Immigrants from Pakistan Married-Couple Family Poverty
COMPARE
Immigrants from Pakistan
Select to Compare
Married-Couple Family Poverty
Immigrants from Pakistan Married-Couple Family Poverty
4.9%
POVERTY | MARRIED-COUPLE FAMILIES
90.7/ 100
METRIC RATING
129th/ 347
METRIC RANK
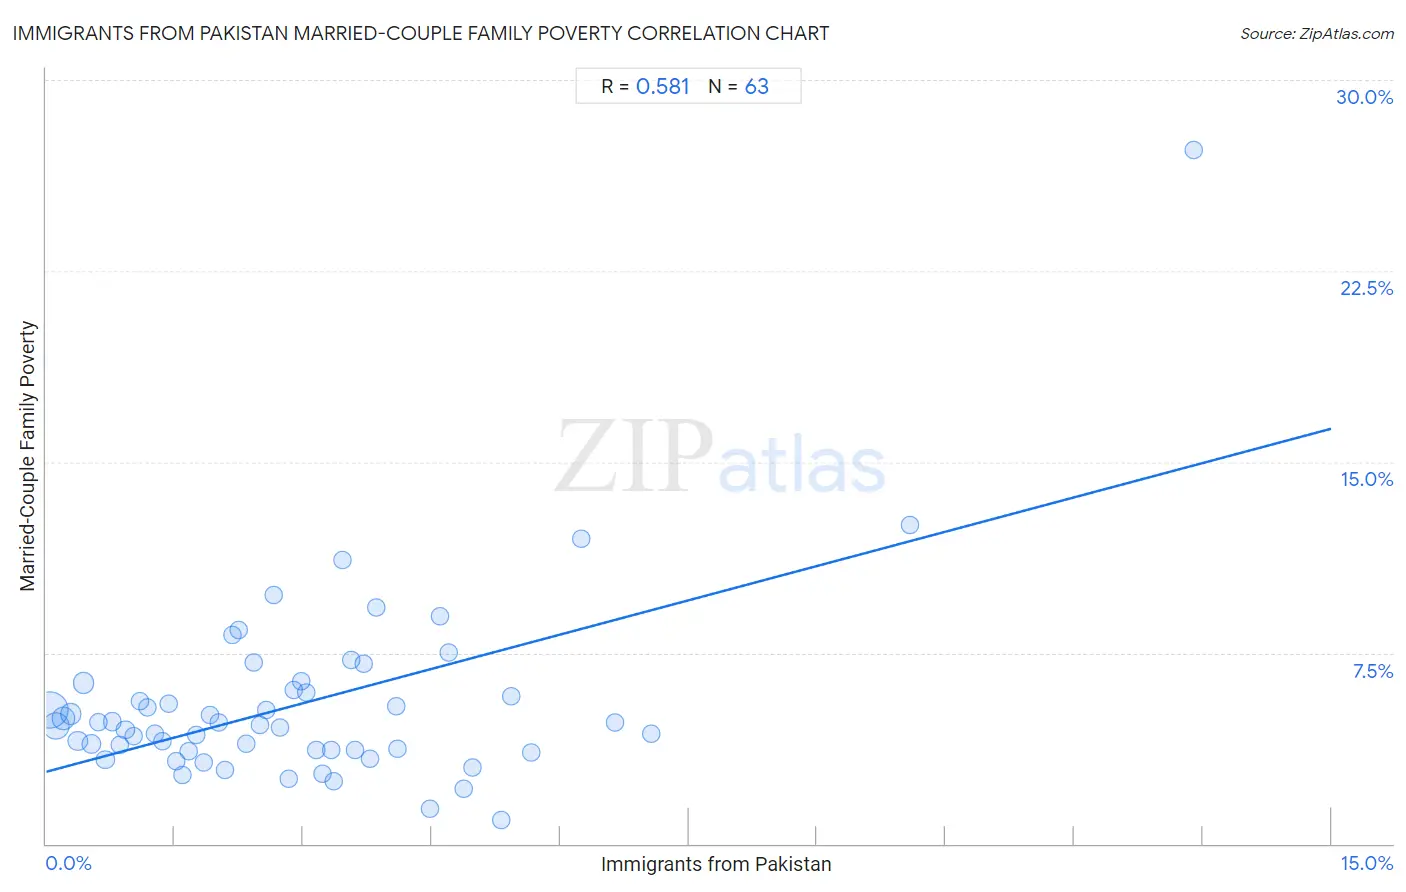
Immigrants from Pakistan Married-Couple Family Poverty Correlation Chart
The statistical analysis conducted on geographies consisting of 282,275,406 people shows a substantial positive correlation between the proportion of Immigrants from Pakistan and poverty level among married-couple families in the United States with a correlation coefficient (R) of 0.581 and weighted average of 4.9%. On average, for every 1% (one percent) increase in Immigrants from Pakistan within a typical geography, there is an increase of 0.90% in poverty level among married-couple families.
It is essential to understand that the correlation between the percentage of Immigrants from Pakistan and poverty level among married-couple families does not imply a direct cause-and-effect relationship. It remains uncertain whether the presence of Immigrants from Pakistan influences an upward or downward trend in the level of poverty level among married-couple families within an area, or if Immigrants from Pakistan simply ended up residing in those areas with higher or lower levels of poverty level among married-couple families due to other factors.
Demographics Similar to Immigrants from Pakistan by Married-Couple Family Poverty
In terms of married-couple family poverty, the demographic groups most similar to Immigrants from Pakistan are Soviet Union (4.9%, a difference of 0.010%), Immigrants from Eastern Europe (4.9%, a difference of 0.080%), Puget Sound Salish (4.9%, a difference of 0.090%), Immigrants from Kenya (4.9%, a difference of 0.16%), and Samoan (4.9%, a difference of 0.17%).
| Demographics | Rating | Rank | Married-Couple Family Poverty |
| Whites/Caucasians | 93.1 /100 | #122 | Exceptional 4.8% |
| Jordanians | 93.1 /100 | #123 | Exceptional 4.8% |
| Romanians | 92.5 /100 | #124 | Exceptional 4.8% |
| Immigrants from Bosnia and Herzegovina | 92.5 /100 | #125 | Exceptional 4.8% |
| Immigrants from Asia | 92.3 /100 | #126 | Exceptional 4.8% |
| Egyptians | 92.0 /100 | #127 | Exceptional 4.8% |
| Palestinians | 91.2 /100 | #128 | Exceptional 4.9% |
| Immigrants from Pakistan | 90.7 /100 | #129 | Exceptional 4.9% |
| Soviet Union | 90.7 /100 | #130 | Exceptional 4.9% |
| Immigrants from Eastern Europe | 90.5 /100 | #131 | Exceptional 4.9% |
| Puget Sound Salish | 90.4 /100 | #132 | Exceptional 4.9% |
| Immigrants from Kenya | 90.2 /100 | #133 | Exceptional 4.9% |
| Samoans | 90.2 /100 | #134 | Exceptional 4.9% |
| Assyrians/Chaldeans/Syriacs | 89.4 /100 | #135 | Excellent 4.9% |
| Immigrants from Hungary | 88.7 /100 | #136 | Excellent 4.9% |
Immigrants from Pakistan Married-Couple Family Poverty Correlation Summary
| Measurement | Immigrants from Pakistan Data | Married-Couple Family Poverty Data |
| Minimum | 0.041% | 0.95% |
| Maximum | 13.4% | 27.3% |
| Range | 13.4% | 26.3% |
| Mean | 2.9% | 5.5% |
| Median | 2.6% | 4.7% |
| Interquartile 25% (IQ1) | 1.3% | 3.7% |
| Interquartile 75% (IQ3) | 3.8% | 6.0% |
| Interquartile Range (IQR) | 2.6% | 2.4% |
| Standard Deviation (Sample) | 2.4% | 3.7% |
| Standard Deviation (Population) | 2.3% | 3.6% |
Correlation Details
| Immigrants from Pakistan Percentile | Sample Size | Married-Couple Family Poverty |
[ 0.0% - 0.5% ] 0.041% | 111,698,236 | 5.3% |
[ 0.0% - 0.5% ] 0.12% | 55,879,655 | 4.6% |
[ 0.0% - 0.5% ] 0.20% | 33,664,596 | 4.9% |
[ 0.0% - 0.5% ] 0.29% | 19,657,676 | 5.1% |
[ 0.0% - 0.5% ] 0.37% | 11,299,517 | 4.0% |
[ 0.0% - 0.5% ] 0.44% | 17,140,513 | 6.3% |
[ 0.5% - 1.0% ] 0.53% | 5,696,803 | 3.9% |
[ 0.5% - 1.0% ] 0.61% | 4,164,170 | 4.8% |
[ 0.5% - 1.0% ] 0.69% | 3,395,540 | 3.3% |
[ 0.5% - 1.0% ] 0.77% | 2,799,263 | 4.8% |
[ 0.5% - 1.0% ] 0.86% | 2,109,382 | 3.9% |
[ 0.5% - 1.0% ] 0.92% | 3,009,887 | 4.5% |
[ 1.0% - 1.5% ] 1.02% | 1,729,565 | 4.2% |
[ 1.0% - 1.5% ] 1.10% | 825,909 | 5.6% |
[ 1.0% - 1.5% ] 1.19% | 978,314 | 5.4% |
[ 1.0% - 1.5% ] 1.26% | 1,328,855 | 4.3% |
[ 1.0% - 1.5% ] 1.35% | 665,447 | 4.0% |
[ 1.0% - 1.5% ] 1.43% | 485,068 | 5.5% |
[ 1.5% - 2.0% ] 1.51% | 652,791 | 3.2% |
[ 1.5% - 2.0% ] 1.59% | 470,032 | 2.7% |
[ 1.5% - 2.0% ] 1.67% | 487,017 | 3.6% |
[ 1.5% - 2.0% ] 1.76% | 231,466 | 4.3% |
[ 1.5% - 2.0% ] 1.83% | 407,537 | 3.2% |
[ 1.5% - 2.0% ] 1.91% | 195,966 | 5.1% |
[ 2.0% - 2.5% ] 2.01% | 119,043 | 4.8% |
[ 2.0% - 2.5% ] 2.09% | 149,817 | 2.9% |
[ 2.0% - 2.5% ] 2.17% | 382,081 | 8.2% |
[ 2.0% - 2.5% ] 2.24% | 363,594 | 8.4% |
[ 2.0% - 2.5% ] 2.33% | 135,618 | 3.9% |
[ 2.0% - 2.5% ] 2.42% | 198,651 | 7.1% |
[ 2.0% - 2.5% ] 2.50% | 254,522 | 4.7% |
[ 2.5% - 3.0% ] 2.57% | 73,701 | 5.3% |
[ 2.5% - 3.0% ] 2.66% | 76,816 | 9.8% |
[ 2.5% - 3.0% ] 2.72% | 90,805 | 4.6% |
[ 2.5% - 3.0% ] 2.83% | 95,197 | 2.5% |
[ 2.5% - 3.0% ] 2.89% | 163,977 | 6.0% |
[ 2.5% - 3.0% ] 2.97% | 38,862 | 6.4% |
[ 3.0% - 3.5% ] 3.04% | 129,420 | 5.9% |
[ 3.0% - 3.5% ] 3.16% | 67,044 | 3.7% |
[ 3.0% - 3.5% ] 3.23% | 32,104 | 2.8% |
[ 3.0% - 3.5% ] 3.32% | 35,831 | 3.7% |
[ 3.0% - 3.5% ] 3.36% | 133,488 | 2.5% |
[ 3.0% - 3.5% ] 3.46% | 109,978 | 11.2% |
[ 3.5% - 4.0% ] 3.56% | 18,357 | 7.2% |
[ 3.5% - 4.0% ] 3.61% | 63,183 | 3.7% |
[ 3.5% - 4.0% ] 3.70% | 83,816 | 7.1% |
[ 3.5% - 4.0% ] 3.78% | 123,078 | 3.3% |
[ 3.5% - 4.0% ] 3.85% | 9,567 | 9.3% |
[ 4.0% - 4.5% ] 4.08% | 4,265 | 5.4% |
[ 4.0% - 4.5% ] 4.10% | 31,609 | 3.7% |
[ 4.0% - 4.5% ] 4.48% | 1,406 | 1.4% |
[ 4.5% - 5.0% ] 4.60% | 50,245 | 8.9% |
[ 4.5% - 5.0% ] 4.70% | 12,209 | 7.5% |
[ 4.5% - 5.0% ] 4.88% | 17,793 | 2.2% |
[ 4.5% - 5.0% ] 4.97% | 95,920 | 3.0% |
[ 5.0% - 5.5% ] 5.32% | 30,553 | 0.95% |
[ 5.0% - 5.5% ] 5.43% | 13,010 | 5.8% |
[ 5.5% - 6.0% ] 5.66% | 10,566 | 3.6% |
[ 6.0% - 6.5% ] 6.24% | 945 | 12.0% |
[ 6.5% - 7.0% ] 6.64% | 76,600 | 4.7% |
[ 7.0% - 7.5% ] 7.07% | 2,533 | 4.3% |
[ 10.0% - 10.5% ] 10.08% | 5,803 | 12.5% |
[ 13.0% - 13.5% ] 13.40% | 194 | 27.3% |