Immigrants from Ireland Married-Couple Family Poverty
COMPARE
Immigrants from Ireland
Select to Compare
Married-Couple Family Poverty
Immigrants from Ireland Married-Couple Family Poverty
4.1%
POVERTY | MARRIED-COUPLE FAMILIES
99.9/ 100
METRIC RATING
19th/ 347
METRIC RANK
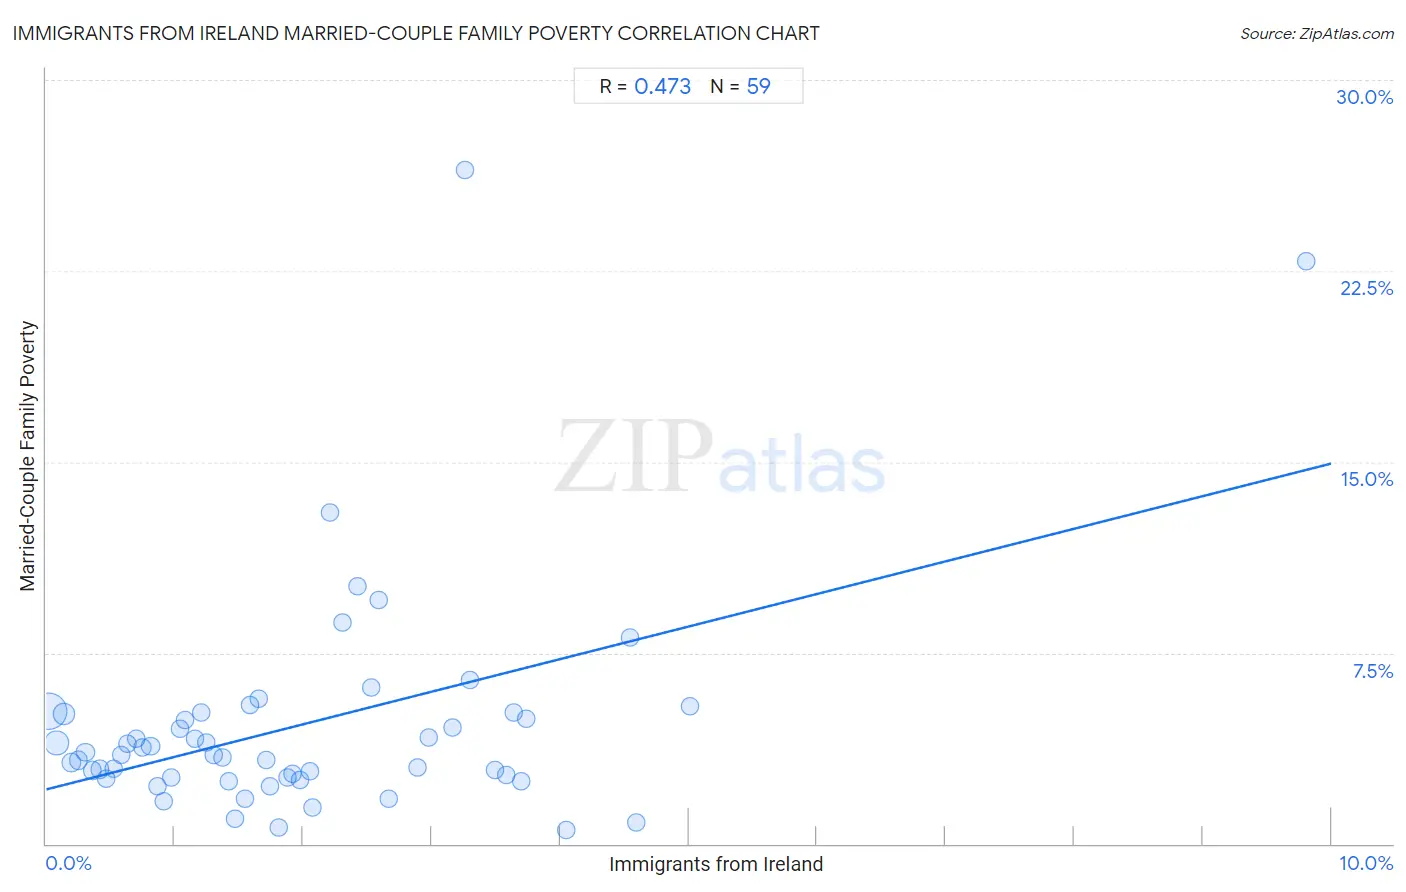
Immigrants from Ireland Married-Couple Family Poverty Correlation Chart
The statistical analysis conducted on geographies consisting of 239,104,626 people shows a moderate positive correlation between the proportion of Immigrants from Ireland and poverty level among married-couple families in the United States with a correlation coefficient (R) of 0.473 and weighted average of 4.1%. On average, for every 1% (one percent) increase in Immigrants from Ireland within a typical geography, there is an increase of 1.3% in poverty level among married-couple families.
It is essential to understand that the correlation between the percentage of Immigrants from Ireland and poverty level among married-couple families does not imply a direct cause-and-effect relationship. It remains uncertain whether the presence of Immigrants from Ireland influences an upward or downward trend in the level of poverty level among married-couple families within an area, or if Immigrants from Ireland simply ended up residing in those areas with higher or lower levels of poverty level among married-couple families due to other factors.
Demographics Similar to Immigrants from Ireland by Married-Couple Family Poverty
In terms of married-couple family poverty, the demographic groups most similar to Immigrants from Ireland are Maltese (4.1%, a difference of 0.25%), Zimbabwean (4.1%, a difference of 0.27%), Immigrants from Singapore (4.1%, a difference of 0.64%), Bhutanese (4.1%, a difference of 0.66%), and Italian (4.0%, a difference of 0.78%).
| Demographics | Rating | Rank | Married-Couple Family Poverty |
| Bulgarians | 100.0 /100 | #12 | Exceptional 4.0% |
| Czechs | 100.0 /100 | #13 | Exceptional 4.0% |
| Slovaks | 100.0 /100 | #14 | Exceptional 4.0% |
| Poles | 100.0 /100 | #15 | Exceptional 4.0% |
| Germans | 100.0 /100 | #16 | Exceptional 4.0% |
| Filipinos | 100.0 /100 | #17 | Exceptional 4.0% |
| Italians | 100.0 /100 | #18 | Exceptional 4.0% |
| Immigrants from Ireland | 99.9 /100 | #19 | Exceptional 4.1% |
| Maltese | 99.9 /100 | #20 | Exceptional 4.1% |
| Zimbabweans | 99.9 /100 | #21 | Exceptional 4.1% |
| Immigrants from Singapore | 99.9 /100 | #22 | Exceptional 4.1% |
| Bhutanese | 99.9 /100 | #23 | Exceptional 4.1% |
| Eastern Europeans | 99.9 /100 | #24 | Exceptional 4.1% |
| Immigrants from Taiwan | 99.9 /100 | #25 | Exceptional 4.1% |
| Cypriots | 99.9 /100 | #26 | Exceptional 4.1% |
Immigrants from Ireland Married-Couple Family Poverty Correlation Summary
| Measurement | Immigrants from Ireland Data | Married-Couple Family Poverty Data |
| Minimum | 0.024% | 0.56% |
| Maximum | 9.8% | 26.5% |
| Range | 9.8% | 25.9% |
| Mean | 2.0% | 4.7% |
| Median | 1.7% | 3.5% |
| Interquartile 25% (IQ1) | 0.81% | 2.6% |
| Interquartile 75% (IQ3) | 2.9% | 5.1% |
| Interquartile Range (IQR) | 2.1% | 2.5% |
| Standard Deviation (Sample) | 1.6% | 4.4% |
| Standard Deviation (Population) | 1.6% | 4.4% |
Correlation Details
| Immigrants from Ireland Percentile | Sample Size | Married-Couple Family Poverty |
[ 0.0% - 0.5% ] 0.024% | 144,516,432 | 5.2% |
[ 0.0% - 0.5% ] 0.080% | 41,403,204 | 4.0% |
[ 0.0% - 0.5% ] 0.14% | 25,691,524 | 5.1% |
[ 0.0% - 0.5% ] 0.19% | 8,352,641 | 3.2% |
[ 0.0% - 0.5% ] 0.25% | 5,136,480 | 3.3% |
[ 0.0% - 0.5% ] 0.31% | 3,620,485 | 3.6% |
[ 0.0% - 0.5% ] 0.36% | 2,659,114 | 2.9% |
[ 0.0% - 0.5% ] 0.42% | 1,405,074 | 2.9% |
[ 0.0% - 0.5% ] 0.47% | 1,087,349 | 2.6% |
[ 0.5% - 1.0% ] 0.52% | 818,042 | 3.0% |
[ 0.5% - 1.0% ] 0.58% | 874,772 | 3.5% |
[ 0.5% - 1.0% ] 0.63% | 593,503 | 3.9% |
[ 0.5% - 1.0% ] 0.70% | 348,324 | 4.1% |
[ 0.5% - 1.0% ] 0.75% | 424,940 | 3.8% |
[ 0.5% - 1.0% ] 0.81% | 363,204 | 3.8% |
[ 0.5% - 1.0% ] 0.86% | 308,777 | 2.2% |
[ 0.5% - 1.0% ] 0.91% | 65,913 | 1.6% |
[ 0.5% - 1.0% ] 0.97% | 83,445 | 2.6% |
[ 1.0% - 1.5% ] 1.04% | 129,619 | 4.5% |
[ 1.0% - 1.5% ] 1.08% | 257,133 | 4.9% |
[ 1.0% - 1.5% ] 1.16% | 62,593 | 4.1% |
[ 1.0% - 1.5% ] 1.21% | 281,363 | 5.2% |
[ 1.0% - 1.5% ] 1.24% | 98,221 | 4.0% |
[ 1.0% - 1.5% ] 1.31% | 81,640 | 3.5% |
[ 1.0% - 1.5% ] 1.37% | 48,524 | 3.4% |
[ 1.0% - 1.5% ] 1.42% | 9,008 | 2.5% |
[ 1.0% - 1.5% ] 1.47% | 45,040 | 1.00% |
[ 1.5% - 2.0% ] 1.54% | 34,446 | 1.7% |
[ 1.5% - 2.0% ] 1.59% | 19,334 | 5.5% |
[ 1.5% - 2.0% ] 1.65% | 10,659 | 5.7% |
[ 1.5% - 2.0% ] 1.71% | 9,357 | 3.3% |
[ 1.5% - 2.0% ] 1.74% | 39,141 | 2.3% |
[ 1.5% - 2.0% ] 1.81% | 5,589 | 0.63% |
[ 1.5% - 2.0% ] 1.88% | 20,148 | 2.6% |
[ 1.5% - 2.0% ] 1.91% | 25,659 | 2.8% |
[ 1.5% - 2.0% ] 1.97% | 4,770 | 2.5% |
[ 2.0% - 2.5% ] 2.05% | 146 | 2.9% |
[ 2.0% - 2.5% ] 2.08% | 6,503 | 1.4% |
[ 2.0% - 2.5% ] 2.21% | 996 | 13.0% |
[ 2.0% - 2.5% ] 2.30% | 304 | 8.7% |
[ 2.0% - 2.5% ] 2.42% | 4,466 | 10.1% |
[ 2.5% - 3.0% ] 2.53% | 5,013 | 6.1% |
[ 2.5% - 3.0% ] 2.59% | 1,469 | 9.6% |
[ 2.5% - 3.0% ] 2.66% | 30,328 | 1.8% |
[ 2.5% - 3.0% ] 2.89% | 3,809 | 3.0% |
[ 2.5% - 3.0% ] 2.97% | 20,306 | 4.2% |
[ 3.0% - 3.5% ] 3.16% | 7,508 | 4.6% |
[ 3.0% - 3.5% ] 3.26% | 399 | 26.5% |
[ 3.0% - 3.5% ] 3.30% | 5,578 | 6.4% |
[ 3.0% - 3.5% ] 3.49% | 15,666 | 2.9% |
[ 3.5% - 4.0% ] 3.58% | 2,041 | 2.7% |
[ 3.5% - 4.0% ] 3.64% | 1,292 | 5.1% |
[ 3.5% - 4.0% ] 3.70% | 16,426 | 2.4% |
[ 3.5% - 4.0% ] 3.74% | 3,828 | 4.9% |
[ 4.0% - 4.5% ] 4.05% | 7,312 | 0.56% |
[ 4.5% - 5.0% ] 4.55% | 550 | 8.1% |
[ 4.5% - 5.0% ] 4.59% | 2,047 | 0.82% |
[ 5.0% - 5.5% ] 5.01% | 33,019 | 5.4% |
[ 9.5% - 10.0% ] 9.80% | 153 | 22.9% |