Canadian Married-Couple Family Poverty

COMPARE

Canadian
Race
Ancestry
AfghanAfricanAlaska NativeAlaskan AthabascanAlbanianAleutAlsatianAmericanApacheArabArapahoArgentineanArmenianAssyrian/Chaldean/SyriacAustralianAustrianBahamianBangladeshiBarbadianBasqueBelgianBelizeanBermudanBhutaneseBlackfeetBolivianBrazilianBritishBritish West IndianBulgarianBurmeseCajunCambodianCanadianCape VerdeanCarpatho RusynCelticCentral AmericanCentral American IndianCherokeeCheyenneChickasawChileanChineseChippewaChoctawColombianColvilleComancheCosta RicanCreeCreekCroatianCrowCubanCypriotCzechCzechoslovakianDanishDelawareDominicanDutchDutch West IndianEastern EuropeanEcuadorianEgyptianEnglishEstonianEthiopianEuropeanFijianFilipinoFinnishFrenchFrench American IndianFrench CanadianGermanGerman RussianGhanaianGreekGuamanian/ChamorroGuatemalanGuyaneseHaitianHmongHonduranHopiHoumaHungarianIcelanderIndian (Asian)IndonesianInupiatIranianIraqiIrishIroquoisIsraeliItalianJamaicanJapaneseJordanianKenyanKiowaKoreanLaotianLatvianLebaneseLiberianLithuanianLumbeeLuxembourgerMacedonianMalaysianMalteseMarshalleseMenomineeMexicanMexican American IndianMongolianMoroccanNative HawaiianNavajoNepaleseNew ZealanderNicaraguanNigerianNorthern EuropeanNorwegianOkinawanOsageOttawaPaiutePakistaniPalestinianPanamanianParaguayanPennsylvania GermanPeruvianPimaPolishPortuguesePotawatomiPuebloPuerto RicanPuget Sound SalishRomanianRussianSalvadoranSamoanScandinavianScotch-IrishScottishSeminoleSenegaleseSerbianShoshoneSierra LeoneanSiouxSlavicSlovakSloveneSomaliSouth AfricanSouth AmericanSouth American IndianSoviet UnionSpaniardSpanishSpanish AmericanSpanish American IndianSri LankanSubsaharan AfricanSudaneseSwedishSwissSyrianTaiwaneseThaiTlingit-HaidaTohono O'OdhamTonganTrinidadian and TobagonianTsimshianTurkishU.S. Virgin IslanderUgandanUkrainianUruguayanUteVenezuelanVietnameseWelshWest IndianYakamaYaquiYugoslavianYumanYup'ikZimbabwean
Immigration
NonimmigrantsImmigrantsAfghanistanAfricaAlbaniaArgentinaArmeniaAsiaAustraliaAustriaBahamasBangladeshBarbadosBelarusBelgiumBelizeBoliviaBosnia and HerzegovinaBrazilBulgariaBurma/MyanmarCabo VerdeCambodiaCameroonCanadaCaribbeanCentral AmericaChileChinaColombiaCongoCosta RicaCroatiaCubaCzechoslovakiaDenmarkDominicaDominican RepublicEastern AfricaEastern AsiaEastern EuropeEcuadorEgyptEl SalvadorEnglandEritreaEthiopiaEuropeFijiFranceGermanyGhanaGreeceGrenadaGuatemalaGuyanaHaitiHondurasHong KongHungaryIndiaIndonesiaIranIraqIrelandIsraelItalyJamaicaJapanJordanKazakhstanKenyaKoreaKuwaitLaosLatin AmericaLatviaLebanonLiberiaLithuaniaMalaysiaMexicoMicronesiaMiddle AfricaMoldovaMoroccoNepalNetherlandsNicaraguaNigeriaNorth AmericaNorth MacedoniaNorthern AfricaNorthern EuropeNorwayOceaniaPakistanPanamaPeruPhilippinesPolandPortugalRomaniaRussiaSaudi ArabiaScotlandSenegalSerbiaSierra LeoneSingaporeSomaliaSouth AfricaSouth AmericaSouth Central AsiaSouth Eastern AsiaSouthern EuropeSpainSri LankaSt. Vincent and the GrenadinesSudanSwedenSwitzerlandSyriaTaiwanThailandTrinidad and TobagoTurkeyUgandaUkraineUruguayUzbekistanVenezuelaVietnamWest IndiesWestern AfricaWestern AsiaWestern EuropeYemenZaireZimbabweAzores
Select to Compare
Race
Ancestry
AfghanAfricanAlaska NativeAlaskan AthabascanAlbanianAleutAlsatianAmericanApacheArabArapahoArgentineanArmenianAssyrian/Chaldean/SyriacAustralianAustrianBahamianBangladeshiBarbadianBasqueBelgianBelizeanBermudanBhutaneseBlackfeetBolivianBrazilianBritishBritish West IndianBulgarianBurmeseCajunCambodianCape VerdeanCarpatho RusynCelticCentral AmericanCentral American IndianCherokeeCheyenneChickasawChileanChineseChippewaChoctawColombianColvilleComancheCosta RicanCreeCreekCroatianCrowCubanCypriotCzechCzechoslovakianDanishDelawareDominicanDutchDutch West IndianEastern EuropeanEcuadorianEgyptianEnglishEstonianEthiopianEuropeanFijianFilipinoFinnishFrenchFrench American IndianFrench CanadianGermanGerman RussianGhanaianGreekGuamanian/ChamorroGuatemalanGuyaneseHaitianHmongHonduranHopiHoumaHungarianIcelanderIndian (Asian)IndonesianInupiatIranianIraqiIrishIroquoisIsraeliItalianJamaicanJapaneseJordanianKenyanKiowaKoreanLaotianLatvianLebaneseLiberianLithuanianLumbeeLuxembourgerMacedonianMalaysianMalteseMarshalleseMenomineeMexicanMexican American IndianMongolianMoroccanNative HawaiianNavajoNepaleseNew ZealanderNicaraguanNigerianNorthern EuropeanNorwegianOkinawanOsageOttawaPaiutePakistaniPalestinianPanamanianParaguayanPennsylvania GermanPeruvianPimaPolishPortuguesePotawatomiPuebloPuerto RicanPuget Sound SalishRomanianRussianSalvadoranSamoanScandinavianScotch-IrishScottishSeminoleSenegaleseSerbianShoshoneSierra LeoneanSiouxSlavicSlovakSloveneSomaliSouth AfricanSouth AmericanSouth American IndianSoviet UnionSpaniardSpanishSpanish AmericanSpanish American IndianSri LankanSubsaharan AfricanSudaneseSwedishSwissSyrianTaiwaneseThaiTlingit-HaidaTohono O'OdhamTonganTrinidadian and TobagonianTsimshianTurkishU.S. Virgin IslanderUgandanUkrainianUruguayanUteVenezuelanVietnameseWelshWest IndianYakamaYaquiYugoslavianYumanYup'ikZimbabwean
Immigration
NonimmigrantsImmigrantsAfghanistanAfricaAlbaniaArgentinaArmeniaAsiaAustraliaAustriaBahamasBangladeshBarbadosBelarusBelgiumBelizeBoliviaBosnia and HerzegovinaBrazilBulgariaBurma/MyanmarCabo VerdeCambodiaCameroonCanadaCaribbeanCentral AmericaChileChinaColombiaCongoCosta RicaCroatiaCubaCzechoslovakiaDenmarkDominicaDominican RepublicEastern AfricaEastern AsiaEastern EuropeEcuadorEgyptEl SalvadorEnglandEritreaEthiopiaEuropeFijiFranceGermanyGhanaGreeceGrenadaGuatemalaGuyanaHaitiHondurasHong KongHungaryIndiaIndonesiaIranIraqIrelandIsraelItalyJamaicaJapanJordanKazakhstanKenyaKoreaKuwaitLaosLatin AmericaLatviaLebanonLiberiaLithuaniaMalaysiaMexicoMicronesiaMiddle AfricaMoldovaMoroccoNepalNetherlandsNicaraguaNigeriaNorth AmericaNorth MacedoniaNorthern AfricaNorthern EuropeNorwayOceaniaPakistanPanamaPeruPhilippinesPolandPortugalRomaniaRussiaSaudi ArabiaScotlandSenegalSerbiaSierra LeoneSingaporeSomaliaSouth AfricaSouth AmericaSouth Central AsiaSouth Eastern AsiaSouthern EuropeSpainSri LankaSt. Vincent and the GrenadinesSudanSwedenSwitzerlandSyriaTaiwanThailandTrinidad and TobagoTurkeyUgandaUkraineUruguayUzbekistanVenezuelaVietnamWest IndiesWestern AfricaWestern AsiaWestern EuropeYemenZaireZimbabweAzores
Married-Couple Family Poverty
Income
Poverty
Unemployment
Labor Participation
Family Structure
Vehicle Availability
Education Level
Disability

Canadian Married-Couple Family Poverty
Exceptional

4.5%
POVERTY | MARRIED-COUPLE FAMILIES
98.8/ 100
METRIC RATING
82nd/ 347
METRIC RANK

Canadian Married-Couple Family Poverty Correlation Chart

The statistical analysis conducted on geographies consisting of 431,987,986 people shows a strong positive correlation between the proportion of Canadians and poverty level among married-couple families in the United States with a correlation coefficient (R) of 0.717 and weighted average of 4.5%. On average, for every 1% (one percent) increase in Canadians within a typical geography, there is an increase of 1.4% in poverty level among married-couple families.
Canadian Married-Couple Family Poverty
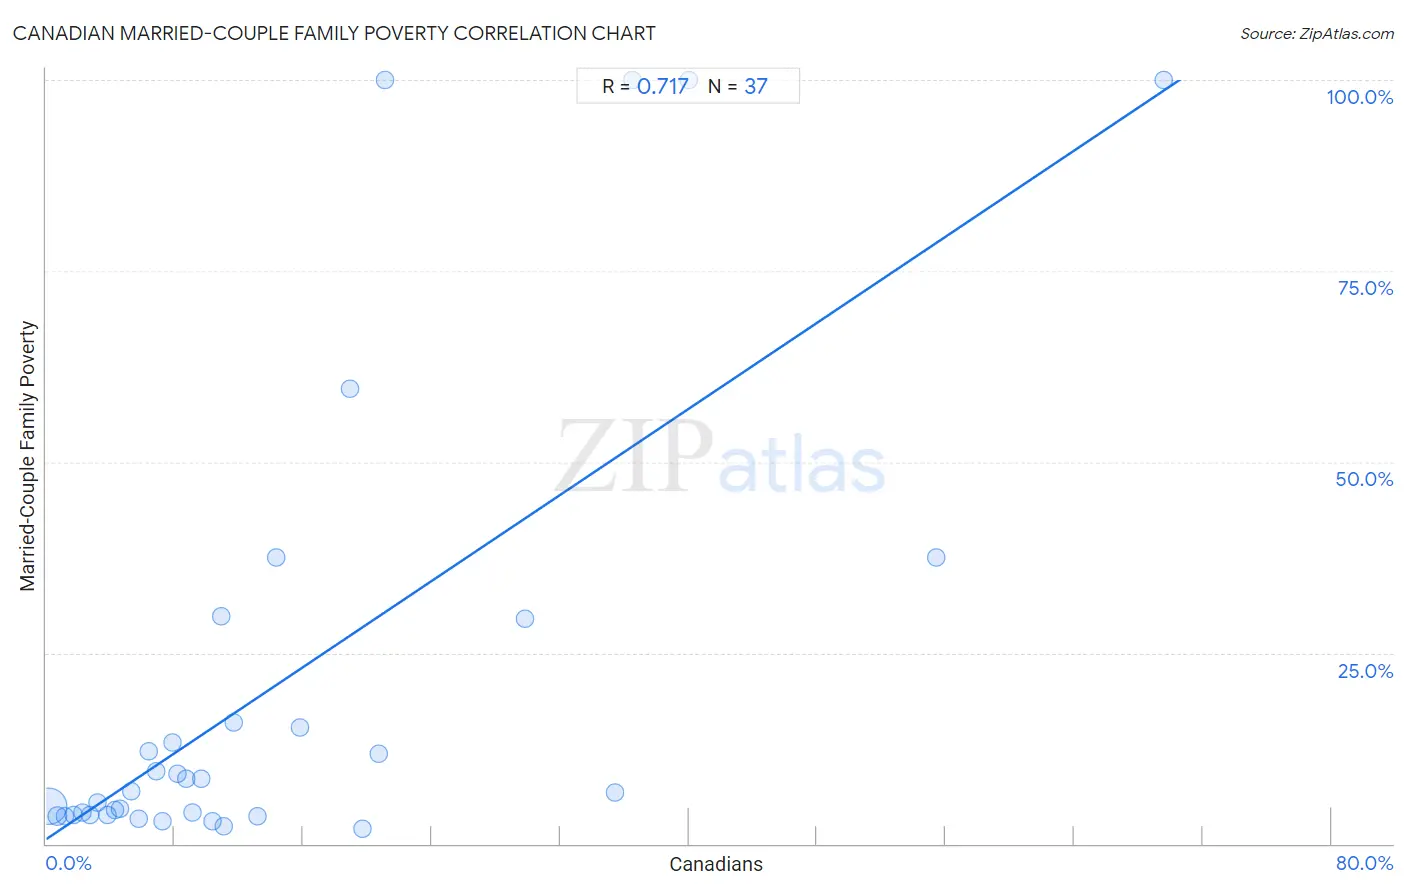
It is essential to understand that the correlation between the percentage of Canadians and poverty level among married-couple families does not imply a direct cause-and-effect relationship. It remains uncertain whether the presence of Canadians influences an upward or downward trend in the level of poverty level among married-couple families within an area, or if Canadians simply ended up residing in those areas with higher or lower levels of poverty level among married-couple families due to other factors.

Demographics Similar to Canadians by Married-Couple Family Poverty

In terms of married-couple family poverty, the demographic groups most similar to Canadians are Immigrants from Denmark (4.6%, a difference of 0.16%), Immigrants from Greece (4.5%, a difference of 0.25%), Immigrants from Croatia (4.6%, a difference of 0.29%), Icelander (4.5%, a difference of 0.39%), and Immigrants from Iran (4.5%, a difference of 0.45%).
DemographicsRating | RankMarried-Couple Family Poverty
Cambodians
99.2
/100
|
#75
Exceptional
4.5%
Immigrants from South Africa
99.1
/100
|
#76
Exceptional
4.5%
Immigrants from Latvia
99.1
/100
|
#77
Exceptional
4.5%
Scotch-Irish
99.1
/100
|
#78
Exceptional
4.5%
Immigrants from Iran
99.0
/100
|
#79
Exceptional
4.5%
Icelanders
99.0
/100
|
#80
Exceptional
4.5%
Immigrants from Greece
98.9
/100
|
#81
Exceptional
4.5%
Canadians
98.8
/100
|
#82
Exceptional
4.5%
Immigrants from Denmark
98.8
/100
|
#83
Exceptional
4.6%
Immigrants from Croatia
98.7
/100
|
#84
Exceptional
4.6%
South Africans
98.7
/100
|
#85
Exceptional
4.6%
Immigrants from Turkey
98.6
/100
|
#86
Exceptional
4.6%
Immigrants from North Macedonia
98.6
/100
|
#87
Exceptional
4.6%
Bolivians
98.6
/100
|
#88
Exceptional
4.6%
Immigrants from Czechoslovakia
98.5
/100
|
#89
Exceptional
4.6%

Canadian Married-Couple Family Poverty Correlation Summary

MeasurementCanadian DataMarried-Couple Family Poverty Data
Minimum0.16%2.0%
Maximum69.6%100.0%
Range69.4%98.0%
Mean14.4%20.9%
Median9.1%6.9%
Interquartile 25% (IQ1)4.5%3.7%
Interquartile 75% (IQ3)19.3%22.6%
Interquartile Range (IQR)14.8%18.9%
Standard Deviation (Sample)15.5%30.5%
Standard Deviation (Population)15.3%30.1%

Correlation Details

Canadian PercentileSample SizeMarried-Couple Family Poverty
[
0.0%
-
0.5%
]
0.16%
390,325,6344.9%
[
0.5%
-
1.0%
]
0.67%
33,398,3403.6%
[
1.0%
-
1.5%
]
1.19%
5,183,3793.6%
[
1.5%
-
2.0%
]
1.68%
1,839,3853.8%
[
2.0%
-
2.5%
]
2.24%
604,3184.1%
[
2.5%
-
3.0%
]
2.76%
205,9033.7%
[
3.0%
-
3.5%
]
3.15%
146,9675.3%
[
3.5%
-
4.0%
]
3.80%
110,9123.8%
[
4.0%
-
4.5%
]
4.28%
40,4524.4%
[
4.5%
-
5.0%
]
4.62%
41,6304.6%
[
5.0%
-
5.5%
]
5.29%
10,2766.9%
[
5.5%
-
6.0%
]
5.77%
11,1013.3%
[
6.0%
-
6.5%
]
6.35%
31,79112.1%
[
6.5%
-
7.0%
]
6.87%
4,2089.6%
[
7.0%
-
7.5%
]
7.21%
7,3933.0%
[
7.5%
-
8.0%
]
7.86%
1,66613.2%
[
8.0%
-
8.5%
]
8.21%
1,4999.2%
[
8.5%
-
9.0%
]
8.71%
11,9108.6%
[
9.0%
-
9.5%
]
9.12%
3,0154.1%
[
9.5%
-
10.0%
]
9.64%
3,1428.5%
[
10.0%
-
10.5%
]
10.38%
5302.9%
[
10.5%
-
11.0%
]
10.87%
54329.8%
[
11.0%
-
11.5%
]
11.02%
6172.4%
[
11.5%
-
12.0%
]
11.65%
1,15015.8%
[
13.0%
-
13.5%
]
13.13%
993.6%
[
14.0%
-
14.5%
]
14.29%
14037.5%
[
15.5%
-
16.0%
]
15.80%
76615.2%
[
18.5%
-
19.0%
]
18.89%
18059.6%
[
19.5%
-
20.0%
]
19.67%
2392.0%
[
20.5%
-
21.0%
]
20.73%
8211.8%
[
21.0%
-
21.5%
]
21.05%
76100.0%
[
29.5%
-
30.0%
]
29.84%
31529.4%
[
35.0%
-
35.5%
]
35.42%
966.7%
[
36.5%
-
37.0%
]
36.51%
63100.0%
[
40.0%
-
40.5%
]
40.00%
45100.0%
[
55.0%
-
55.5%
]
55.45%
10137.5%
[
69.5%
-
70.0%
]
69.57%
23100.0%