Immigrants from Hong Kong Married-Couple Family Poverty
COMPARE
Immigrants from Hong Kong
Select to Compare
Married-Couple Family Poverty
Immigrants from Hong Kong Married-Couple Family Poverty
4.7%
POVERTY | MARRIED-COUPLE FAMILIES
96.4/ 100
METRIC RATING
109th/ 347
METRIC RANK
Immigrants from Hong Kong Married-Couple Family Poverty Correlation Chart
The statistical analysis conducted on geographies consisting of 252,495,550 people shows a slight positive correlation between the proportion of Immigrants from Hong Kong and poverty level among married-couple families in the United States with a correlation coefficient (R) of 0.070 and weighted average of 4.7%. On average, for every 1% (one percent) increase in Immigrants from Hong Kong within a typical geography, there is an increase of 0.13% in poverty level among married-couple families.
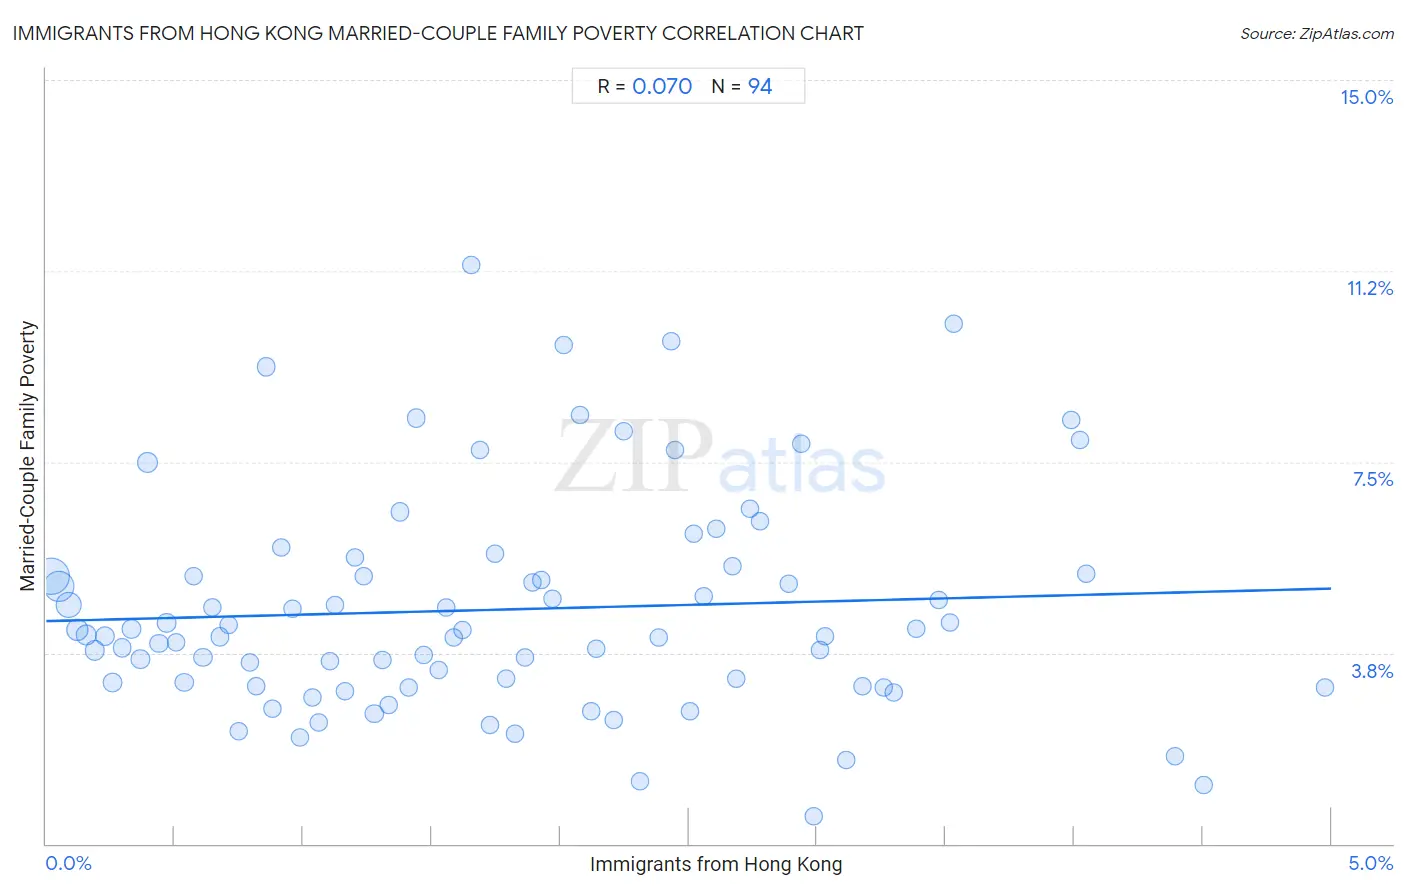
It is essential to understand that the correlation between the percentage of Immigrants from Hong Kong and poverty level among married-couple families does not imply a direct cause-and-effect relationship. It remains uncertain whether the presence of Immigrants from Hong Kong influences an upward or downward trend in the level of poverty level among married-couple families within an area, or if Immigrants from Hong Kong simply ended up residing in those areas with higher or lower levels of poverty level among married-couple families due to other factors.
Demographics Similar to Immigrants from Hong Kong by Married-Couple Family Poverty
In terms of married-couple family poverty, the demographic groups most similar to Immigrants from Hong Kong are Immigrants from Bolivia (4.7%, a difference of 0.16%), Laotian (4.7%, a difference of 0.20%), Pakistani (4.7%, a difference of 0.20%), Tongan (4.7%, a difference of 0.38%), and Immigrants from Nepal (4.7%, a difference of 0.45%).
| Demographics | Rating | Rank | Married-Couple Family Poverty |
| Asians | 97.6 /100 | #102 | Exceptional 4.7% |
| Immigrants from Romania | 97.3 /100 | #103 | Exceptional 4.7% |
| Immigrants from Moldova | 97.1 /100 | #104 | Exceptional 4.7% |
| Aleuts | 97.0 /100 | #105 | Exceptional 4.7% |
| Immigrants from France | 96.9 /100 | #106 | Exceptional 4.7% |
| Immigrants from Germany | 96.8 /100 | #107 | Exceptional 4.7% |
| Laotians | 96.6 /100 | #108 | Exceptional 4.7% |
| Immigrants from Hong Kong | 96.4 /100 | #109 | Exceptional 4.7% |
| Immigrants from Bolivia | 96.2 /100 | #110 | Exceptional 4.7% |
| Pakistanis | 96.2 /100 | #111 | Exceptional 4.7% |
| Tongans | 95.9 /100 | #112 | Exceptional 4.7% |
| Immigrants from Nepal | 95.9 /100 | #113 | Exceptional 4.7% |
| Immigrants from Indonesia | 95.1 /100 | #114 | Exceptional 4.8% |
| Taiwanese | 94.8 /100 | #115 | Exceptional 4.8% |
| Celtics | 94.8 /100 | #116 | Exceptional 4.8% |
Immigrants from Hong Kong Married-Couple Family Poverty Correlation Summary
| Measurement | Immigrants from Hong Kong Data | Married-Couple Family Poverty Data |
| Minimum | 0.018% | 0.53% |
| Maximum | 5.0% | 11.4% |
| Range | 5.0% | 10.8% |
| Mean | 1.8% | 4.6% |
| Median | 1.6% | 4.1% |
| Interquartile 25% (IQ1) | 0.82% | 3.1% |
| Interquartile 75% (IQ3) | 2.6% | 5.3% |
| Interquartile Range (IQR) | 1.8% | 2.2% |
| Standard Deviation (Sample) | 1.2% | 2.2% |
| Standard Deviation (Population) | 1.2% | 2.1% |
Correlation Details
| Immigrants from Hong Kong Percentile | Sample Size | Married-Couple Family Poverty |
[ 0.0% - 0.5% ] 0.018% | 79,847,370 | 5.2% |
[ 0.0% - 0.5% ] 0.051% | 52,147,296 | 5.0% |
[ 0.0% - 0.5% ] 0.088% | 32,608,266 | 4.7% |
[ 0.0% - 0.5% ] 0.12% | 17,242,213 | 4.2% |
[ 0.0% - 0.5% ] 0.16% | 10,417,572 | 4.1% |
[ 0.0% - 0.5% ] 0.19% | 7,191,249 | 3.8% |
[ 0.0% - 0.5% ] 0.23% | 5,945,423 | 4.1% |
[ 0.0% - 0.5% ] 0.26% | 5,043,654 | 3.2% |
[ 0.0% - 0.5% ] 0.30% | 2,907,159 | 3.8% |
[ 0.0% - 0.5% ] 0.33% | 3,622,480 | 4.2% |
[ 0.0% - 0.5% ] 0.37% | 1,934,641 | 3.6% |
[ 0.0% - 0.5% ] 0.40% | 10,433,423 | 7.5% |
[ 0.0% - 0.5% ] 0.44% | 3,003,839 | 3.9% |
[ 0.0% - 0.5% ] 0.47% | 2,162,798 | 4.3% |
[ 0.5% - 1.0% ] 0.50% | 1,358,405 | 4.0% |
[ 0.5% - 1.0% ] 0.54% | 912,276 | 3.2% |
[ 0.5% - 1.0% ] 0.57% | 951,303 | 5.3% |
[ 0.5% - 1.0% ] 0.61% | 1,179,179 | 3.7% |
[ 0.5% - 1.0% ] 0.65% | 1,061,530 | 4.6% |
[ 0.5% - 1.0% ] 0.68% | 734,557 | 4.1% |
[ 0.5% - 1.0% ] 0.71% | 583,885 | 4.3% |
[ 0.5% - 1.0% ] 0.75% | 282,766 | 2.2% |
[ 0.5% - 1.0% ] 0.79% | 738,742 | 3.6% |
[ 0.5% - 1.0% ] 0.82% | 457,267 | 3.1% |
[ 0.5% - 1.0% ] 0.86% | 433,424 | 9.4% |
[ 0.5% - 1.0% ] 0.88% | 350,841 | 2.7% |
[ 0.5% - 1.0% ] 0.91% | 175,546 | 5.8% |
[ 0.5% - 1.0% ] 0.96% | 242,035 | 4.6% |
[ 0.5% - 1.0% ] 0.99% | 299,599 | 2.1% |
[ 1.0% - 1.5% ] 1.03% | 414,695 | 2.9% |
[ 1.0% - 1.5% ] 1.06% | 196,096 | 2.4% |
[ 1.0% - 1.5% ] 1.10% | 596,365 | 3.6% |
[ 1.0% - 1.5% ] 1.12% | 111,908 | 4.7% |
[ 1.0% - 1.5% ] 1.16% | 266,628 | 3.0% |
[ 1.0% - 1.5% ] 1.20% | 309,785 | 5.6% |
[ 1.0% - 1.5% ] 1.23% | 292,806 | 5.2% |
[ 1.0% - 1.5% ] 1.28% | 446,361 | 2.5% |
[ 1.0% - 1.5% ] 1.31% | 111,763 | 3.6% |
[ 1.0% - 1.5% ] 1.33% | 120,781 | 2.7% |
[ 1.0% - 1.5% ] 1.38% | 204,009 | 6.5% |
[ 1.0% - 1.5% ] 1.41% | 213,769 | 3.1% |
[ 1.0% - 1.5% ] 1.44% | 165,074 | 8.4% |
[ 1.0% - 1.5% ] 1.47% | 87,929 | 3.7% |
[ 1.5% - 2.0% ] 1.53% | 180,375 | 3.4% |
[ 1.5% - 2.0% ] 1.55% | 194,808 | 4.6% |
[ 1.5% - 2.0% ] 1.59% | 104,589 | 4.0% |
[ 1.5% - 2.0% ] 1.62% | 103,875 | 4.2% |
[ 1.5% - 2.0% ] 1.65% | 142,957 | 11.4% |
[ 1.5% - 2.0% ] 1.69% | 212,390 | 7.7% |
[ 1.5% - 2.0% ] 1.73% | 68,544 | 2.3% |
[ 1.5% - 2.0% ] 1.75% | 198,364 | 5.7% |
[ 1.5% - 2.0% ] 1.79% | 940,493 | 3.2% |
[ 1.5% - 2.0% ] 1.82% | 134,662 | 2.2% |
[ 1.5% - 2.0% ] 1.86% | 194,065 | 3.7% |
[ 1.5% - 2.0% ] 1.89% | 198,986 | 5.1% |
[ 1.5% - 2.0% ] 1.93% | 58,705 | 5.2% |
[ 1.5% - 2.0% ] 1.97% | 6,238 | 4.8% |
[ 2.0% - 2.5% ] 2.01% | 56,266 | 9.8% |
[ 2.0% - 2.5% ] 2.08% | 67,785 | 8.4% |
[ 2.0% - 2.5% ] 2.12% | 70,245 | 2.6% |
[ 2.0% - 2.5% ] 2.14% | 104,605 | 3.8% |
[ 2.0% - 2.5% ] 2.21% | 634 | 2.4% |
[ 2.0% - 2.5% ] 2.25% | 195,750 | 8.1% |
[ 2.0% - 2.5% ] 2.31% | 10,292 | 1.2% |
[ 2.0% - 2.5% ] 2.38% | 121,317 | 4.1% |
[ 2.0% - 2.5% ] 2.43% | 39,211 | 9.9% |
[ 2.0% - 2.5% ] 2.45% | 43,851 | 7.7% |
[ 2.5% - 3.0% ] 2.51% | 6,145 | 2.6% |
[ 2.5% - 3.0% ] 2.52% | 79,195 | 6.1% |
[ 2.5% - 3.0% ] 2.56% | 20,272 | 4.9% |
[ 2.5% - 3.0% ] 2.61% | 66,979 | 6.2% |
[ 2.5% - 3.0% ] 2.67% | 42,916 | 5.4% |
[ 2.5% - 3.0% ] 2.68% | 65,125 | 3.2% |
[ 2.5% - 3.0% ] 2.74% | 10,622 | 6.6% |
[ 2.5% - 3.0% ] 2.78% | 28,212 | 6.3% |
[ 2.5% - 3.0% ] 2.89% | 19,928 | 5.1% |
[ 2.5% - 3.0% ] 2.94% | 239,314 | 7.9% |
[ 2.5% - 3.0% ] 2.99% | 21,738 | 0.53% |
[ 3.0% - 3.5% ] 3.01% | 18,426 | 3.8% |
[ 3.0% - 3.5% ] 3.03% | 56,181 | 4.1% |
[ 3.0% - 3.5% ] 3.12% | 2,825 | 1.7% |
[ 3.0% - 3.5% ] 3.17% | 46,331 | 3.1% |
[ 3.0% - 3.5% ] 3.26% | 55,863 | 3.1% |
[ 3.0% - 3.5% ] 3.30% | 12,442 | 3.0% |
[ 3.0% - 3.5% ] 3.39% | 40,738 | 4.2% |
[ 3.0% - 3.5% ] 3.47% | 27,641 | 4.8% |
[ 3.5% - 4.0% ] 3.52% | 33,367 | 4.3% |
[ 3.5% - 4.0% ] 3.53% | 29,006 | 10.2% |
[ 3.5% - 4.0% ] 3.99% | 86,804 | 8.3% |
[ 4.0% - 4.5% ] 4.02% | 58,106 | 7.9% |
[ 4.0% - 4.5% ] 4.05% | 22,654 | 5.3% |
[ 4.0% - 4.5% ] 4.39% | 43,903 | 1.7% |
[ 4.5% - 5.0% ] 4.50% | 59,453 | 1.1% |
[ 4.5% - 5.0% ] 4.98% | 45,650 | 3.1% |