Kenyan Married-couple Households
COMPARE
Kenyan
Select to Compare
Married-couple Households
Kenyan Married-couple Households
44.7%
MARRIED-COUPLE HOUSEHOLDS
1.7/ 100
METRIC RATING
228th/ 347
METRIC RANK
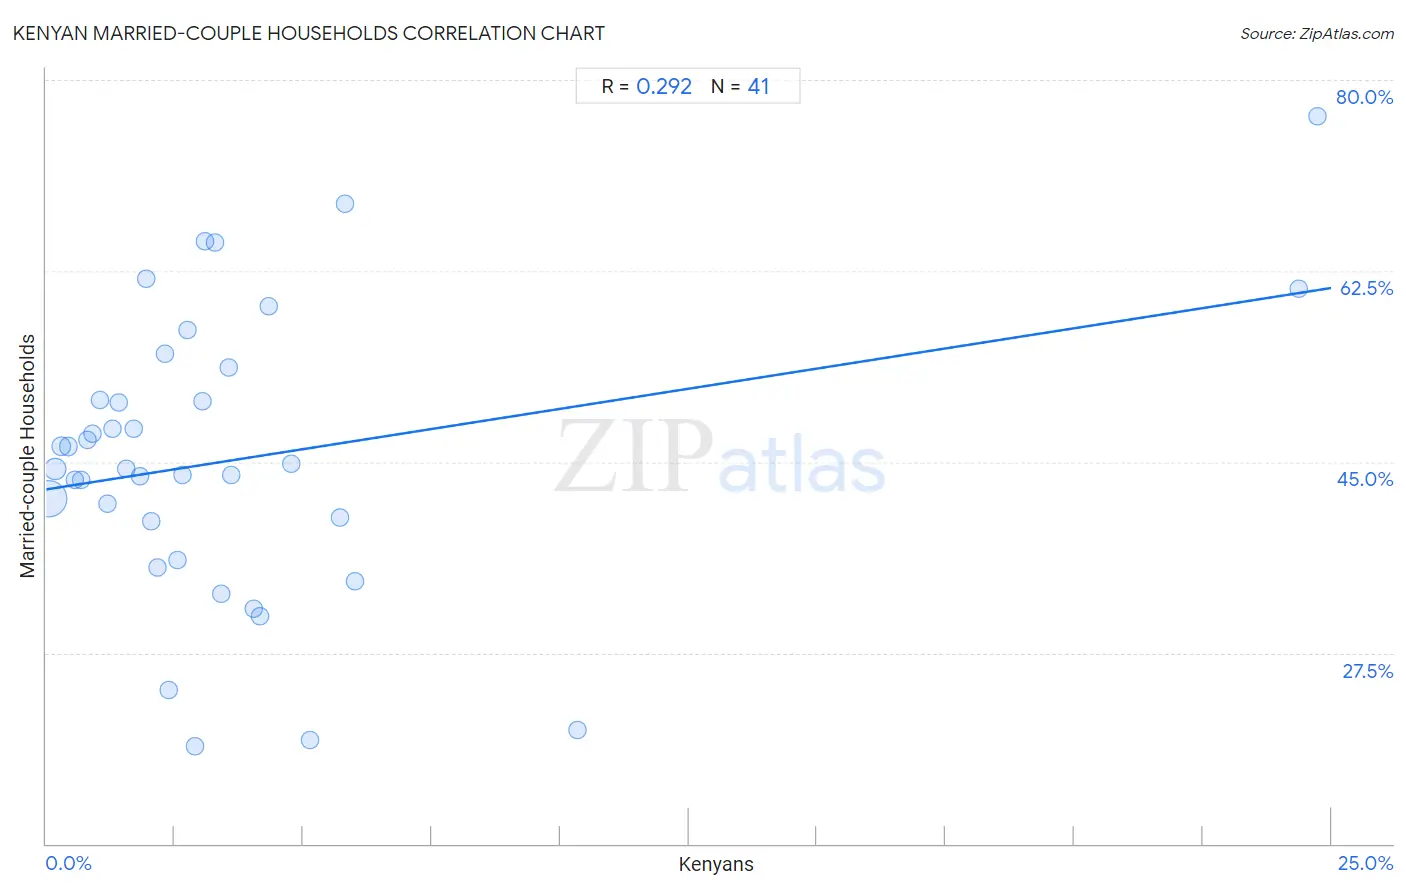
Kenyan Married-couple Households Correlation Chart
The statistical analysis conducted on geographies consisting of 168,165,214 people shows a weak positive correlation between the proportion of Kenyans and percentage of married-couple family households in the United States with a correlation coefficient (R) of 0.292 and weighted average of 44.7%. On average, for every 1% (one percent) increase in Kenyans within a typical geography, there is an increase of 0.74% in percentage of married-couple family households.
It is essential to understand that the correlation between the percentage of Kenyans and percentage of married-couple family households does not imply a direct cause-and-effect relationship. It remains uncertain whether the presence of Kenyans influences an upward or downward trend in the level of percentage of married-couple family households within an area, or if Kenyans simply ended up residing in those areas with higher or lower levels of percentage of married-couple family households due to other factors.
Demographics Similar to Kenyans by Married-couple Households
In terms of married-couple households, the demographic groups most similar to Kenyans are Immigrants from Latin America (44.7%, a difference of 0.050%), Soviet Union (44.6%, a difference of 0.090%), Houma (44.6%, a difference of 0.10%), Marshallese (44.6%, a difference of 0.10%), and Salvadoran (44.7%, a difference of 0.13%).
| Demographics | Rating | Rank | Married-couple Households |
| Tlingit-Haida | 4.9 /100 | #221 | Tragic 45.1% |
| Immigrants from Laos | 4.6 /100 | #222 | Tragic 45.1% |
| Immigrants from Cambodia | 2.7 /100 | #223 | Tragic 44.9% |
| Immigrants from Micronesia | 2.6 /100 | #224 | Tragic 44.9% |
| Dutch West Indians | 2.6 /100 | #225 | Tragic 44.9% |
| Alsatians | 2.3 /100 | #226 | Tragic 44.8% |
| Salvadorans | 1.9 /100 | #227 | Tragic 44.7% |
| Kenyans | 1.7 /100 | #228 | Tragic 44.7% |
| Immigrants from Latin America | 1.6 /100 | #229 | Tragic 44.7% |
| Soviet Union | 1.6 /100 | #230 | Tragic 44.6% |
| Houma | 1.5 /100 | #231 | Tragic 44.6% |
| Marshallese | 1.5 /100 | #232 | Tragic 44.6% |
| Immigrants from Uganda | 1.5 /100 | #233 | Tragic 44.6% |
| Immigrants from Panama | 1.3 /100 | #234 | Tragic 44.6% |
| Immigrants from Nicaragua | 1.2 /100 | #235 | Tragic 44.5% |
Kenyan Married-couple Households Correlation Summary
| Measurement | Kenyan Data | Married-couple Households Data |
| Minimum | 0.039% | 18.9% |
| Maximum | 24.7% | 76.7% |
| Range | 24.7% | 57.7% |
| Mean | 3.8% | 45.3% |
| Median | 2.6% | 44.4% |
| Interquartile 25% (IQ1) | 1.2% | 37.8% |
| Interquartile 75% (IQ3) | 4.1% | 52.2% |
| Interquartile Range (IQR) | 2.8% | 14.4% |
| Standard Deviation (Sample) | 5.2% | 13.1% |
| Standard Deviation (Population) | 5.1% | 12.9% |
Correlation Details
| Kenyan Percentile | Sample Size | Married-couple Households |
[ 0.0% - 0.5% ] 0.039% | 126,515,643 | 41.7% |
[ 0.0% - 0.5% ] 0.17% | 21,797,528 | 44.3% |
[ 0.0% - 0.5% ] 0.30% | 8,421,164 | 46.5% |
[ 0.0% - 0.5% ] 0.43% | 4,720,606 | 46.4% |
[ 0.5% - 1.0% ] 0.55% | 2,134,666 | 43.4% |
[ 0.5% - 1.0% ] 0.67% | 1,166,959 | 43.3% |
[ 0.5% - 1.0% ] 0.80% | 964,807 | 47.0% |
[ 0.5% - 1.0% ] 0.90% | 443,919 | 47.5% |
[ 1.0% - 1.5% ] 1.05% | 433,161 | 50.6% |
[ 1.0% - 1.5% ] 1.19% | 327,740 | 41.2% |
[ 1.0% - 1.5% ] 1.30% | 231,594 | 48.0% |
[ 1.0% - 1.5% ] 1.41% | 210,333 | 50.5% |
[ 1.5% - 2.0% ] 1.56% | 192,252 | 44.4% |
[ 1.5% - 2.0% ] 1.69% | 99,101 | 48.1% |
[ 1.5% - 2.0% ] 1.82% | 30,100 | 43.7% |
[ 1.5% - 2.0% ] 1.95% | 131,069 | 61.8% |
[ 2.0% - 2.5% ] 2.05% | 69,612 | 39.6% |
[ 2.0% - 2.5% ] 2.17% | 85,059 | 35.3% |
[ 2.0% - 2.5% ] 2.31% | 63,729 | 54.9% |
[ 2.0% - 2.5% ] 2.38% | 6,863 | 24.1% |
[ 2.5% - 3.0% ] 2.56% | 586 | 36.0% |
[ 2.5% - 3.0% ] 2.65% | 32,186 | 43.8% |
[ 2.5% - 3.0% ] 2.75% | 8,230 | 57.0% |
[ 2.5% - 3.0% ] 2.90% | 3,966 | 18.9% |
[ 3.0% - 3.5% ] 3.03% | 14,756 | 50.5% |
[ 3.0% - 3.5% ] 3.10% | 8,389 | 65.3% |
[ 3.0% - 3.5% ] 3.29% | 2,034 | 65.2% |
[ 3.0% - 3.5% ] 3.40% | 2,764 | 32.9% |
[ 3.5% - 4.0% ] 3.56% | 2,473 | 53.7% |
[ 3.5% - 4.0% ] 3.59% | 3,785 | 43.8% |
[ 4.0% - 4.5% ] 4.03% | 4,488 | 31.5% |
[ 4.0% - 4.5% ] 4.15% | 9,822 | 30.9% |
[ 4.0% - 4.5% ] 4.32% | 2,474 | 59.3% |
[ 4.5% - 5.0% ] 4.77% | 9,332 | 44.8% |
[ 5.0% - 5.5% ] 5.13% | 4,995 | 19.5% |
[ 5.5% - 6.0% ] 5.71% | 4,728 | 39.9% |
[ 5.5% - 6.0% ] 5.82% | 3,214 | 68.7% |
[ 6.0% - 6.5% ] 6.01% | 183 | 34.1% |
[ 10.0% - 10.5% ] 10.33% | 368 | 20.4% |
[ 24.0% - 24.5% ] 24.37% | 439 | 60.9% |
[ 24.5% - 25.0% ] 24.74% | 97 | 76.7% |