Immigrants from Czechoslovakia Married-Couple Family Poverty
COMPARE
Immigrants from Czechoslovakia
Select to Compare
Married-Couple Family Poverty
Immigrants from Czechoslovakia Married-Couple Family Poverty
4.6%
POVERTY | MARRIED-COUPLE FAMILIES
98.5/ 100
METRIC RATING
89th/ 347
METRIC RANK
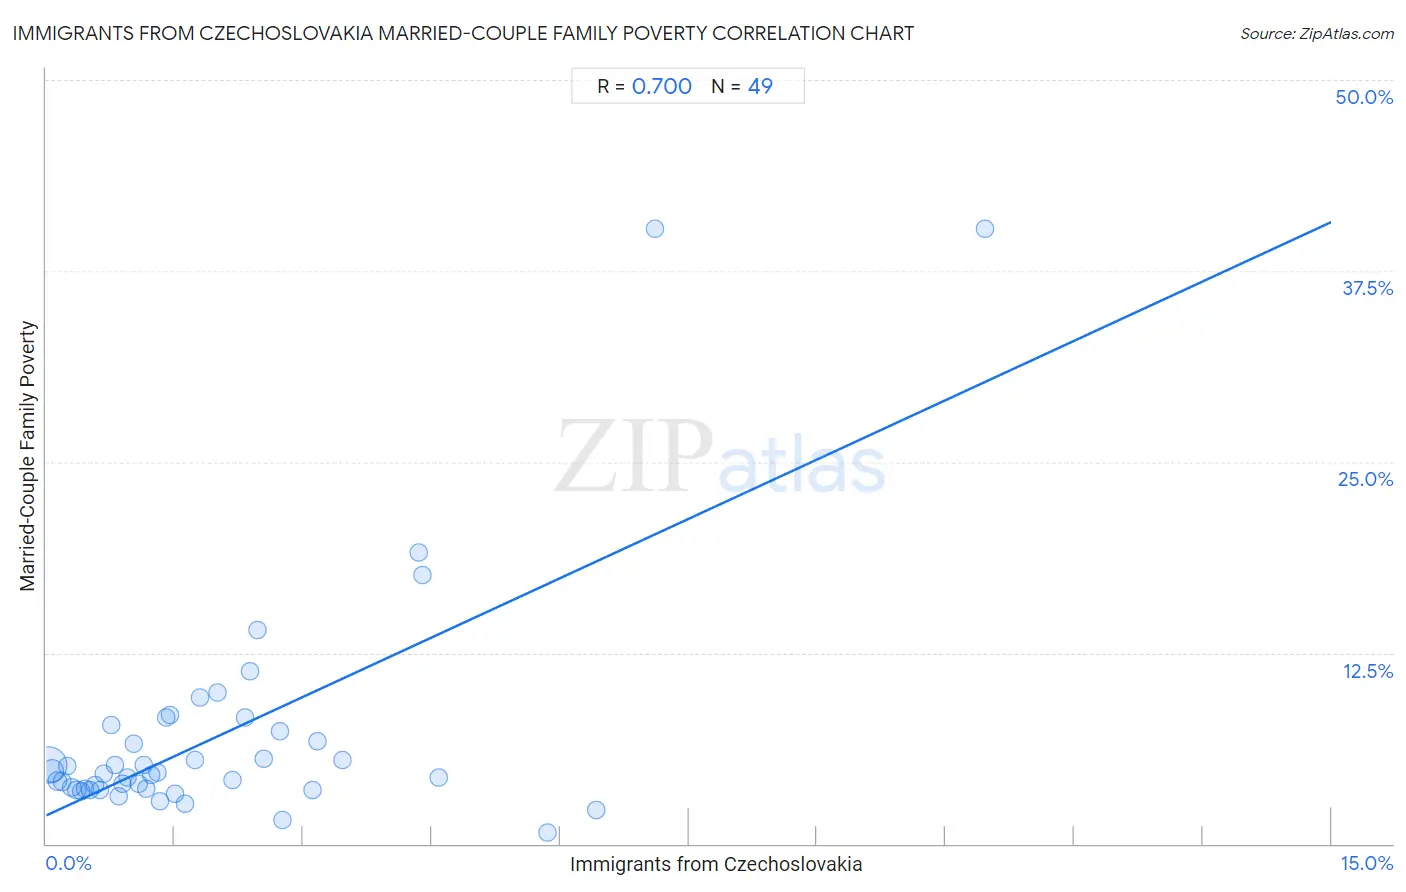
Immigrants from Czechoslovakia Married-Couple Family Poverty Correlation Chart
The statistical analysis conducted on geographies consisting of 194,643,621 people shows a significant positive correlation between the proportion of Immigrants from Czechoslovakia and poverty level among married-couple families in the United States with a correlation coefficient (R) of 0.700 and weighted average of 4.6%. On average, for every 1% (one percent) increase in Immigrants from Czechoslovakia within a typical geography, there is an increase of 2.6% in poverty level among married-couple families.
It is essential to understand that the correlation between the percentage of Immigrants from Czechoslovakia and poverty level among married-couple families does not imply a direct cause-and-effect relationship. It remains uncertain whether the presence of Immigrants from Czechoslovakia influences an upward or downward trend in the level of poverty level among married-couple families within an area, or if Immigrants from Czechoslovakia simply ended up residing in those areas with higher or lower levels of poverty level among married-couple families due to other factors.
Demographics Similar to Immigrants from Czechoslovakia by Married-Couple Family Poverty
In terms of married-couple family poverty, the demographic groups most similar to Immigrants from Czechoslovakia are Immigrants from Switzerland (4.6%, a difference of 0.070%), Bolivian (4.6%, a difference of 0.11%), Basque (4.6%, a difference of 0.11%), Immigrants from Norway (4.6%, a difference of 0.18%), and Immigrants from North Macedonia (4.6%, a difference of 0.21%).
| Demographics | Rating | Rank | Married-Couple Family Poverty |
| Canadians | 98.8 /100 | #82 | Exceptional 4.5% |
| Immigrants from Denmark | 98.8 /100 | #83 | Exceptional 4.6% |
| Immigrants from Croatia | 98.7 /100 | #84 | Exceptional 4.6% |
| South Africans | 98.7 /100 | #85 | Exceptional 4.6% |
| Immigrants from Turkey | 98.6 /100 | #86 | Exceptional 4.6% |
| Immigrants from North Macedonia | 98.6 /100 | #87 | Exceptional 4.6% |
| Bolivians | 98.6 /100 | #88 | Exceptional 4.6% |
| Immigrants from Czechoslovakia | 98.5 /100 | #89 | Exceptional 4.6% |
| Immigrants from Switzerland | 98.5 /100 | #90 | Exceptional 4.6% |
| Basques | 98.5 /100 | #91 | Exceptional 4.6% |
| Immigrants from Norway | 98.4 /100 | #92 | Exceptional 4.6% |
| Koreans | 98.3 /100 | #93 | Exceptional 4.6% |
| Immigrants from Italy | 98.3 /100 | #94 | Exceptional 4.6% |
| Portuguese | 98.3 /100 | #95 | Exceptional 4.6% |
| Immigrants from Poland | 98.3 /100 | #96 | Exceptional 4.6% |
Immigrants from Czechoslovakia Married-Couple Family Poverty Correlation Summary
| Measurement | Immigrants from Czechoslovakia Data | Married-Couple Family Poverty Data |
| Minimum | 0.022% | 0.74% |
| Maximum | 11.0% | 40.3% |
| Range | 10.9% | 39.5% |
| Mean | 2.0% | 7.1% |
| Median | 1.3% | 4.6% |
| Interquartile 25% (IQ1) | 0.65% | 3.6% |
| Interquartile 75% (IQ3) | 2.6% | 7.5% |
| Interquartile Range (IQR) | 2.0% | 4.0% |
| Standard Deviation (Sample) | 2.1% | 7.8% |
| Standard Deviation (Population) | 2.1% | 7.7% |
Correlation Details
| Immigrants from Czechoslovakia Percentile | Sample Size | Married-Couple Family Poverty |
[ 0.0% - 0.5% ] 0.022% | 130,863,901 | 5.1% |
[ 0.0% - 0.5% ] 0.073% | 39,265,322 | 4.8% |
[ 0.0% - 0.5% ] 0.13% | 11,152,756 | 4.1% |
[ 0.0% - 0.5% ] 0.19% | 5,133,436 | 4.1% |
[ 0.0% - 0.5% ] 0.25% | 3,047,065 | 5.1% |
[ 0.0% - 0.5% ] 0.30% | 1,449,062 | 3.7% |
[ 0.0% - 0.5% ] 0.36% | 1,232,022 | 3.5% |
[ 0.0% - 0.5% ] 0.41% | 548,488 | 3.4% |
[ 0.0% - 0.5% ] 0.46% | 400,557 | 3.6% |
[ 0.5% - 1.0% ] 0.52% | 371,455 | 3.5% |
[ 0.5% - 1.0% ] 0.57% | 263,994 | 3.8% |
[ 0.5% - 1.0% ] 0.62% | 250,020 | 3.5% |
[ 0.5% - 1.0% ] 0.68% | 81,707 | 4.6% |
[ 0.5% - 1.0% ] 0.75% | 119,488 | 7.7% |
[ 0.5% - 1.0% ] 0.80% | 71,016 | 5.2% |
[ 0.5% - 1.0% ] 0.85% | 10,550 | 3.1% |
[ 0.5% - 1.0% ] 0.89% | 113,279 | 3.9% |
[ 0.5% - 1.0% ] 0.95% | 39,403 | 4.3% |
[ 1.0% - 1.5% ] 1.02% | 30,925 | 6.6% |
[ 1.0% - 1.5% ] 1.08% | 30,098 | 4.0% |
[ 1.0% - 1.5% ] 1.14% | 16,239 | 5.2% |
[ 1.0% - 1.5% ] 1.17% | 26,447 | 3.6% |
[ 1.0% - 1.5% ] 1.23% | 10,089 | 4.5% |
[ 1.0% - 1.5% ] 1.30% | 22,330 | 4.6% |
[ 1.0% - 1.5% ] 1.33% | 5,787 | 2.8% |
[ 1.0% - 1.5% ] 1.40% | 17,388 | 8.3% |
[ 1.0% - 1.5% ] 1.45% | 3,104 | 8.4% |
[ 1.0% - 1.5% ] 1.50% | 7,749 | 3.3% |
[ 1.5% - 2.0% ] 1.62% | 24,172 | 2.6% |
[ 1.5% - 2.0% ] 1.74% | 5,413 | 5.5% |
[ 1.5% - 2.0% ] 1.79% | 782 | 9.6% |
[ 1.5% - 2.0% ] 2.00% | 2,854 | 9.9% |
[ 2.0% - 2.5% ] 2.18% | 1,975 | 4.1% |
[ 2.0% - 2.5% ] 2.32% | 691 | 8.3% |
[ 2.0% - 2.5% ] 2.38% | 210 | 11.3% |
[ 2.0% - 2.5% ] 2.46% | 2,436 | 14.0% |
[ 2.5% - 3.0% ] 2.54% | 4,135 | 5.6% |
[ 2.5% - 3.0% ] 2.73% | 1,426 | 7.3% |
[ 2.5% - 3.0% ] 2.76% | 2,208 | 1.6% |
[ 3.0% - 3.5% ] 3.12% | 642 | 3.5% |
[ 3.0% - 3.5% ] 3.17% | 6,019 | 6.7% |
[ 3.0% - 3.5% ] 3.46% | 1,272 | 5.5% |
[ 4.0% - 4.5% ] 4.35% | 115 | 19.0% |
[ 4.0% - 4.5% ] 4.39% | 296 | 17.6% |
[ 4.5% - 5.0% ] 4.58% | 1,289 | 4.4% |
[ 5.5% - 6.0% ] 5.84% | 2,002 | 0.74% |
[ 6.0% - 6.5% ] 6.42% | 1,636 | 2.2% |
[ 7.0% - 7.5% ] 7.11% | 225 | 40.3% |
[ 10.5% - 11.0% ] 10.96% | 146 | 40.3% |