Iroquois Married-Couple Family Poverty

COMPARE

Iroquois
Race
Ancestry
AfghanAfricanAlaska NativeAlaskan AthabascanAlbanianAleutAlsatianAmericanApacheArabArapahoArgentineanArmenianAssyrian/Chaldean/SyriacAustralianAustrianBahamianBangladeshiBarbadianBasqueBelgianBelizeanBermudanBhutaneseBlackfeetBolivianBrazilianBritishBritish West IndianBulgarianBurmeseCajunCambodianCanadianCape VerdeanCarpatho RusynCelticCentral AmericanCentral American IndianCherokeeCheyenneChickasawChileanChineseChippewaChoctawColombianColvilleComancheCosta RicanCreeCreekCroatianCrowCubanCypriotCzechCzechoslovakianDanishDelawareDominicanDutchDutch West IndianEastern EuropeanEcuadorianEgyptianEnglishEstonianEthiopianEuropeanFijianFilipinoFinnishFrenchFrench American IndianFrench CanadianGermanGerman RussianGhanaianGreekGuamanian/ChamorroGuatemalanGuyaneseHaitianHmongHonduranHopiHoumaHungarianIcelanderIndian (Asian)IndonesianInupiatIranianIraqiIrishIroquoisIsraeliItalianJamaicanJapaneseJordanianKenyanKiowaKoreanLaotianLatvianLebaneseLiberianLithuanianLumbeeLuxembourgerMacedonianMalaysianMalteseMarshalleseMenomineeMexicanMexican American IndianMongolianMoroccanNative HawaiianNavajoNepaleseNew ZealanderNicaraguanNigerianNorthern EuropeanNorwegianOkinawanOsageOttawaPaiutePakistaniPalestinianPanamanianParaguayanPennsylvania GermanPeruvianPimaPolishPortuguesePotawatomiPuebloPuerto RicanPuget Sound SalishRomanianRussianSalvadoranSamoanScandinavianScotch-IrishScottishSeminoleSenegaleseSerbianShoshoneSierra LeoneanSiouxSlavicSlovakSloveneSomaliSouth AfricanSouth AmericanSouth American IndianSoviet UnionSpaniardSpanishSpanish AmericanSpanish American IndianSri LankanSubsaharan AfricanSudaneseSwedishSwissSyrianTaiwaneseThaiTlingit-HaidaTohono O'OdhamTonganTrinidadian and TobagonianTsimshianTurkishU.S. Virgin IslanderUgandanUkrainianUruguayanUteVenezuelanVietnameseWelshWest IndianYakamaYaquiYugoslavianYumanYup'ikZimbabwean
Immigration
NonimmigrantsImmigrantsAfghanistanAfricaAlbaniaArgentinaArmeniaAsiaAustraliaAustriaBahamasBangladeshBarbadosBelarusBelgiumBelizeBoliviaBosnia and HerzegovinaBrazilBulgariaBurma/MyanmarCabo VerdeCambodiaCameroonCanadaCaribbeanCentral AmericaChileChinaColombiaCongoCosta RicaCroatiaCubaCzechoslovakiaDenmarkDominicaDominican RepublicEastern AfricaEastern AsiaEastern EuropeEcuadorEgyptEl SalvadorEnglandEritreaEthiopiaEuropeFijiFranceGermanyGhanaGreeceGrenadaGuatemalaGuyanaHaitiHondurasHong KongHungaryIndiaIndonesiaIranIraqIrelandIsraelItalyJamaicaJapanJordanKazakhstanKenyaKoreaKuwaitLaosLatin AmericaLatviaLebanonLiberiaLithuaniaMalaysiaMexicoMicronesiaMiddle AfricaMoldovaMoroccoNepalNetherlandsNicaraguaNigeriaNorth AmericaNorth MacedoniaNorthern AfricaNorthern EuropeNorwayOceaniaPakistanPanamaPeruPhilippinesPolandPortugalRomaniaRussiaSaudi ArabiaScotlandSenegalSerbiaSierra LeoneSingaporeSomaliaSouth AfricaSouth AmericaSouth Central AsiaSouth Eastern AsiaSouthern EuropeSpainSri LankaSt. Vincent and the GrenadinesSudanSwedenSwitzerlandSyriaTaiwanThailandTrinidad and TobagoTurkeyUgandaUkraineUruguayUzbekistanVenezuelaVietnamWest IndiesWestern AfricaWestern AsiaWestern EuropeYemenZaireZimbabweAzores
Select to Compare
Race
Ancestry
AfghanAfricanAlaska NativeAlaskan AthabascanAlbanianAleutAlsatianAmericanApacheArabArapahoArgentineanArmenianAssyrian/Chaldean/SyriacAustralianAustrianBahamianBangladeshiBarbadianBasqueBelgianBelizeanBermudanBhutaneseBlackfeetBolivianBrazilianBritishBritish West IndianBulgarianBurmeseCajunCambodianCanadianCape VerdeanCarpatho RusynCelticCentral AmericanCentral American IndianCherokeeCheyenneChickasawChileanChineseChippewaChoctawColombianColvilleComancheCosta RicanCreeCreekCroatianCrowCubanCypriotCzechCzechoslovakianDanishDelawareDominicanDutchDutch West IndianEastern EuropeanEcuadorianEgyptianEnglishEstonianEthiopianEuropeanFijianFilipinoFinnishFrenchFrench American IndianFrench CanadianGermanGerman RussianGhanaianGreekGuamanian/ChamorroGuatemalanGuyaneseHaitianHmongHonduranHopiHoumaHungarianIcelanderIndian (Asian)IndonesianInupiatIranianIraqiIrishIsraeliItalianJamaicanJapaneseJordanianKenyanKiowaKoreanLaotianLatvianLebaneseLiberianLithuanianLumbeeLuxembourgerMacedonianMalaysianMalteseMarshalleseMenomineeMexicanMexican American IndianMongolianMoroccanNative HawaiianNavajoNepaleseNew ZealanderNicaraguanNigerianNorthern EuropeanNorwegianOkinawanOsageOttawaPaiutePakistaniPalestinianPanamanianParaguayanPennsylvania GermanPeruvianPimaPolishPortuguesePotawatomiPuebloPuerto RicanPuget Sound SalishRomanianRussianSalvadoranSamoanScandinavianScotch-IrishScottishSeminoleSenegaleseSerbianShoshoneSierra LeoneanSiouxSlavicSlovakSloveneSomaliSouth AfricanSouth AmericanSouth American IndianSoviet UnionSpaniardSpanishSpanish AmericanSpanish American IndianSri LankanSubsaharan AfricanSudaneseSwedishSwissSyrianTaiwaneseThaiTlingit-HaidaTohono O'OdhamTonganTrinidadian and TobagonianTsimshianTurkishU.S. Virgin IslanderUgandanUkrainianUruguayanUteVenezuelanVietnameseWelshWest IndianYakamaYaquiYugoslavianYumanYup'ikZimbabwean
Immigration
NonimmigrantsImmigrantsAfghanistanAfricaAlbaniaArgentinaArmeniaAsiaAustraliaAustriaBahamasBangladeshBarbadosBelarusBelgiumBelizeBoliviaBosnia and HerzegovinaBrazilBulgariaBurma/MyanmarCabo VerdeCambodiaCameroonCanadaCaribbeanCentral AmericaChileChinaColombiaCongoCosta RicaCroatiaCubaCzechoslovakiaDenmarkDominicaDominican RepublicEastern AfricaEastern AsiaEastern EuropeEcuadorEgyptEl SalvadorEnglandEritreaEthiopiaEuropeFijiFranceGermanyGhanaGreeceGrenadaGuatemalaGuyanaHaitiHondurasHong KongHungaryIndiaIndonesiaIranIraqIrelandIsraelItalyJamaicaJapanJordanKazakhstanKenyaKoreaKuwaitLaosLatin AmericaLatviaLebanonLiberiaLithuaniaMalaysiaMexicoMicronesiaMiddle AfricaMoldovaMoroccoNepalNetherlandsNicaraguaNigeriaNorth AmericaNorth MacedoniaNorthern AfricaNorthern EuropeNorwayOceaniaPakistanPanamaPeruPhilippinesPolandPortugalRomaniaRussiaSaudi ArabiaScotlandSenegalSerbiaSierra LeoneSingaporeSomaliaSouth AfricaSouth AmericaSouth Central AsiaSouth Eastern AsiaSouthern EuropeSpainSri LankaSt. Vincent and the GrenadinesSudanSwedenSwitzerlandSyriaTaiwanThailandTrinidad and TobagoTurkeyUgandaUkraineUruguayUzbekistanVenezuelaVietnamWest IndiesWestern AfricaWestern AsiaWestern EuropeYemenZaireZimbabweAzores
Married-Couple Family Poverty
Income
Poverty
Unemployment
Labor Participation
Family Structure
Vehicle Availability
Education Level
Disability

Iroquois Married-Couple Family Poverty
Poor

5.5%
POVERTY | MARRIED-COUPLE FAMILIES
13.1/ 100
METRIC RATING
214th/ 347
METRIC RANK

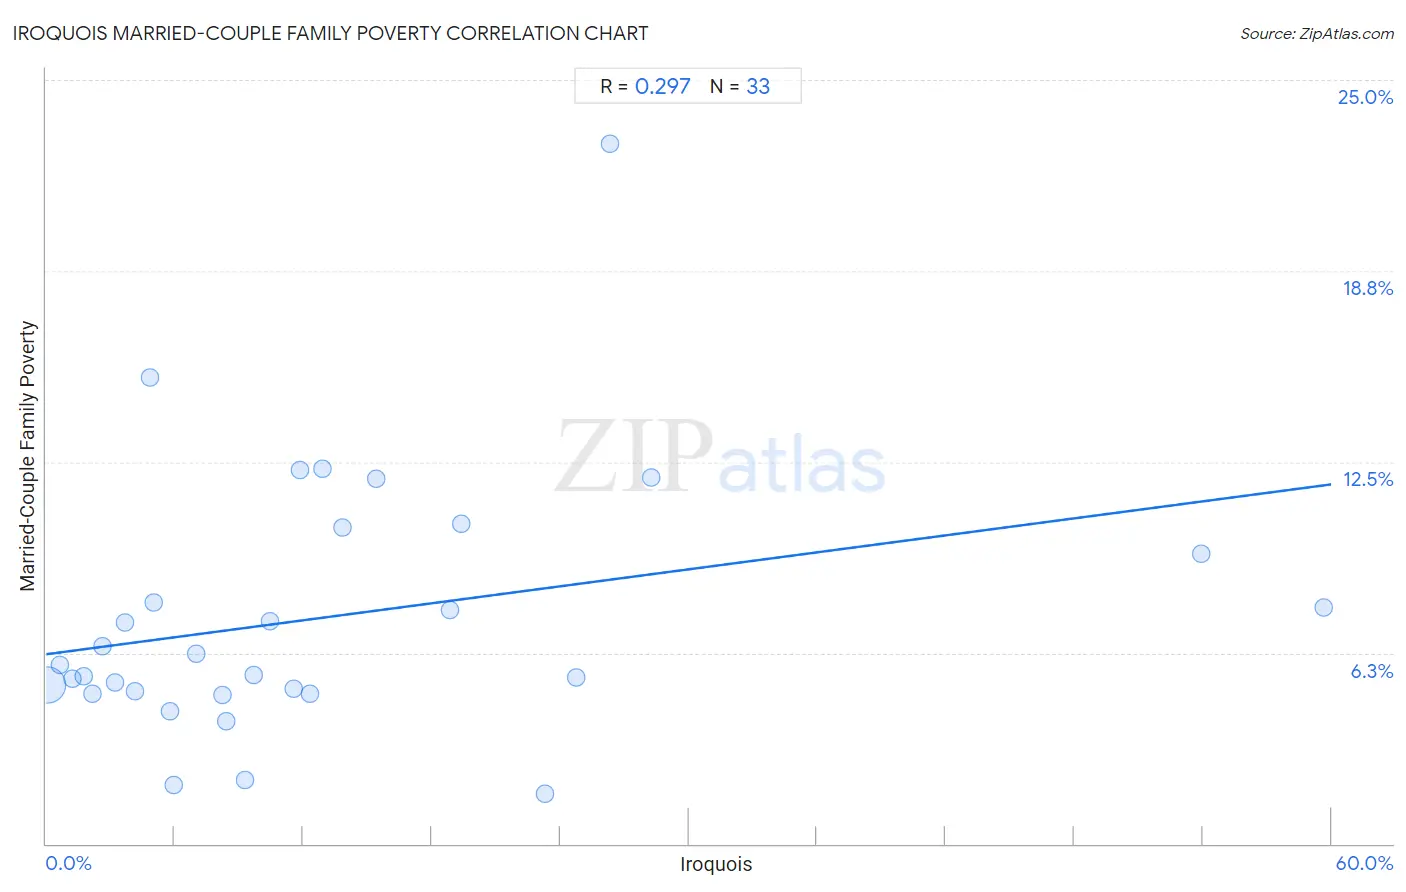
Iroquois Married-Couple Family Poverty Correlation Chart

The statistical analysis conducted on geographies consisting of 206,259,155 people shows a weak positive correlation between the proportion of Iroquois and poverty level among married-couple families in the United States with a correlation coefficient (R) of 0.297 and weighted average of 5.5%. On average, for every 1% (one percent) increase in Iroquois within a typical geography, there is an increase of 0.093% in poverty level among married-couple families.
Iroquois Married-Couple Family Poverty
It is essential to understand that the correlation between the percentage of Iroquois and poverty level among married-couple families does not imply a direct cause-and-effect relationship. It remains uncertain whether the presence of Iroquois influences an upward or downward trend in the level of poverty level among married-couple families within an area, or if Iroquois simply ended up residing in those areas with higher or lower levels of poverty level among married-couple families due to other factors.

Demographics Similar to Iroquois by Married-Couple Family Poverty

In terms of married-couple family poverty, the demographic groups most similar to Iroquois are Immigrants from Liberia (5.5%, a difference of 0.040%), Armenian (5.5%, a difference of 0.060%), Potawatomi (5.5%, a difference of 0.18%), Immigrants from Thailand (5.5%, a difference of 0.22%), and Nigerian (5.5%, a difference of 0.29%).
DemographicsRating | RankMarried-Couple Family Poverty
Immigrants from Africa
17.6
/100
|
#207
Poor
5.5%
French American Indians
16.1
/100
|
#208
Poor
5.5%
Immigrants from Syria
15.4
/100
|
#209
Poor
5.5%
Immigrants from Micronesia
14.4
/100
|
#210
Poor
5.5%
Nigerians
14.3
/100
|
#211
Poor
5.5%
Immigrants from Thailand
14.0
/100
|
#212
Poor
5.5%
Immigrants from Liberia
13.3
/100
|
#213
Poor
5.5%
Iroquois
13.1
/100
|
#214
Poor
5.5%
Armenians
12.8
/100
|
#215
Poor
5.5%
Potawatomi
12.4
/100
|
#216
Poor
5.5%
Immigrants from Nigeria
11.3
/100
|
#217
Poor
5.5%
Afghans
11.2
/100
|
#218
Poor
5.5%
Japanese
9.8
/100
|
#219
Tragic
5.6%
Colombians
9.2
/100
|
#220
Tragic
5.6%
Panamanians
9.2
/100
|
#221
Tragic
5.6%

Iroquois Married-Couple Family Poverty Correlation Summary

MeasurementIroquois DataMarried-Couple Family Poverty Data
Minimum0.053%1.6%
Maximum59.6%22.9%
Range59.6%21.3%
Mean12.9%7.4%
Median9.3%5.9%
Interquartile 25% (IQ1)3.9%4.9%
Interquartile 75% (IQ3)17.1%9.9%
Interquartile Range (IQR)13.2%5.0%
Standard Deviation (Sample)13.7%4.3%
Standard Deviation (Population)13.5%4.2%

Correlation Details

Iroquois PercentileSample SizeMarried-Couple Family Poverty
[
0.0%
-
0.5%
]
0.053%
202,352,3495.2%
[
0.5%
-
1.0%
]
0.65%
2,722,0915.9%
[
1.0%
-
1.5%
]
1.22%
505,9495.4%
[
1.5%
-
2.0%
]
1.73%
196,9915.5%
[
2.0%
-
2.5%
]
2.13%
278,1254.9%
[
2.5%
-
3.0%
]
2.61%
31,1496.5%
[
3.0%
-
3.5%
]
3.20%
45,9885.3%
[
3.5%
-
4.0%
]
3.68%
35,1317.3%
[
4.0%
-
4.5%
]
4.15%
10,1255.0%
[
4.5%
-
5.0%
]
4.82%
5,29115.3%
[
4.5%
-
5.0%
]
4.99%
1,6437.9%
[
5.5%
-
6.0%
]
5.80%
1,9134.3%
[
5.5%
-
6.0%
]
5.96%
10,5611.9%
[
6.5%
-
7.0%
]
6.98%
1,0466.2%
[
8.0%
-
8.5%
]
8.25%
1,3454.9%
[
8.0%
-
8.5%
]
8.43%
3564.0%
[
9.0%
-
9.5%
]
9.28%
6,1862.1%
[
9.5%
-
10.0%
]
9.67%
12,3635.5%
[
10.0%
-
10.5%
]
10.46%
4,3677.3%
[
11.5%
-
12.0%
]
11.56%
8915.1%
[
11.5%
-
12.0%
]
11.84%
1,68112.2%
[
12.0%
-
12.5%
]
12.33%
1,7444.9%
[
12.5%
-
13.0%
]
12.90%
1,20212.3%
[
13.5%
-
14.0%
]
13.82%
1,97610.3%
[
15.0%
-
15.5%
]
15.38%
65012.0%
[
18.5%
-
19.0%
]
18.85%
12,8057.6%
[
19.0%
-
19.5%
]
19.37%
50610.5%
[
23.0%
-
23.5%
]
23.26%
2,2181.6%
[
24.5%
-
25.0%
]
24.74%
2,9105.4%
[
26.0%
-
26.5%
]
26.31%
1,60022.9%
[
28.0%
-
28.5%
]
28.26%
13812.0%
[
53.5%
-
54.0%
]
53.93%
4,1969.5%
[
59.5%
-
60.0%
]
59.63%
3,6697.8%