Czechoslovakian Married-Couple Family Poverty

COMPARE

Czechoslovakian
Race
Ancestry
AfghanAfricanAlaska NativeAlaskan AthabascanAlbanianAleutAlsatianAmericanApacheArabArapahoArgentineanArmenianAssyrian/Chaldean/SyriacAustralianAustrianBahamianBangladeshiBarbadianBasqueBelgianBelizeanBermudanBhutaneseBlackfeetBolivianBrazilianBritishBritish West IndianBulgarianBurmeseCajunCambodianCanadianCape VerdeanCarpatho RusynCelticCentral AmericanCentral American IndianCherokeeCheyenneChickasawChileanChineseChippewaChoctawColombianColvilleComancheCosta RicanCreeCreekCroatianCrowCubanCypriotCzechCzechoslovakianDanishDelawareDominicanDutchDutch West IndianEastern EuropeanEcuadorianEgyptianEnglishEstonianEthiopianEuropeanFijianFilipinoFinnishFrenchFrench American IndianFrench CanadianGermanGerman RussianGhanaianGreekGuamanian/ChamorroGuatemalanGuyaneseHaitianHmongHonduranHopiHoumaHungarianIcelanderIndian (Asian)IndonesianInupiatIranianIraqiIrishIroquoisIsraeliItalianJamaicanJapaneseJordanianKenyanKiowaKoreanLaotianLatvianLebaneseLiberianLithuanianLumbeeLuxembourgerMacedonianMalaysianMalteseMarshalleseMenomineeMexicanMexican American IndianMongolianMoroccanNative HawaiianNavajoNepaleseNew ZealanderNicaraguanNigerianNorthern EuropeanNorwegianOkinawanOsageOttawaPaiutePakistaniPalestinianPanamanianParaguayanPennsylvania GermanPeruvianPimaPolishPortuguesePotawatomiPuebloPuerto RicanPuget Sound SalishRomanianRussianSalvadoranSamoanScandinavianScotch-IrishScottishSeminoleSenegaleseSerbianShoshoneSierra LeoneanSiouxSlavicSlovakSloveneSomaliSouth AfricanSouth AmericanSouth American IndianSoviet UnionSpaniardSpanishSpanish AmericanSpanish American IndianSri LankanSubsaharan AfricanSudaneseSwedishSwissSyrianTaiwaneseThaiTlingit-HaidaTohono O'OdhamTonganTrinidadian and TobagonianTsimshianTurkishU.S. Virgin IslanderUgandanUkrainianUruguayanUteVenezuelanVietnameseWelshWest IndianYakamaYaquiYugoslavianYumanYup'ikZimbabwean
Immigration
NonimmigrantsImmigrantsAfghanistanAfricaAlbaniaArgentinaArmeniaAsiaAustraliaAustriaBahamasBangladeshBarbadosBelarusBelgiumBelizeBoliviaBosnia and HerzegovinaBrazilBulgariaBurma/MyanmarCabo VerdeCambodiaCameroonCanadaCaribbeanCentral AmericaChileChinaColombiaCongoCosta RicaCroatiaCubaCzechoslovakiaDenmarkDominicaDominican RepublicEastern AfricaEastern AsiaEastern EuropeEcuadorEgyptEl SalvadorEnglandEritreaEthiopiaEuropeFijiFranceGermanyGhanaGreeceGrenadaGuatemalaGuyanaHaitiHondurasHong KongHungaryIndiaIndonesiaIranIraqIrelandIsraelItalyJamaicaJapanJordanKazakhstanKenyaKoreaKuwaitLaosLatin AmericaLatviaLebanonLiberiaLithuaniaMalaysiaMexicoMicronesiaMiddle AfricaMoldovaMoroccoNepalNetherlandsNicaraguaNigeriaNorth AmericaNorth MacedoniaNorthern AfricaNorthern EuropeNorwayOceaniaPakistanPanamaPeruPhilippinesPolandPortugalRomaniaRussiaSaudi ArabiaScotlandSenegalSerbiaSierra LeoneSingaporeSomaliaSouth AfricaSouth AmericaSouth Central AsiaSouth Eastern AsiaSouthern EuropeSpainSri LankaSt. Vincent and the GrenadinesSudanSwedenSwitzerlandSyriaTaiwanThailandTrinidad and TobagoTurkeyUgandaUkraineUruguayUzbekistanVenezuelaVietnamWest IndiesWestern AfricaWestern AsiaWestern EuropeYemenZaireZimbabweAzores
Select to Compare
Race
Ancestry
AfghanAfricanAlaska NativeAlaskan AthabascanAlbanianAleutAlsatianAmericanApacheArabArapahoArgentineanArmenianAssyrian/Chaldean/SyriacAustralianAustrianBahamianBangladeshiBarbadianBasqueBelgianBelizeanBermudanBhutaneseBlackfeetBolivianBrazilianBritishBritish West IndianBulgarianBurmeseCajunCambodianCanadianCape VerdeanCarpatho RusynCelticCentral AmericanCentral American IndianCherokeeCheyenneChickasawChileanChineseChippewaChoctawColombianColvilleComancheCosta RicanCreeCreekCroatianCrowCubanCypriotCzechDanishDelawareDominicanDutchDutch West IndianEastern EuropeanEcuadorianEgyptianEnglishEstonianEthiopianEuropeanFijianFilipinoFinnishFrenchFrench American IndianFrench CanadianGermanGerman RussianGhanaianGreekGuamanian/ChamorroGuatemalanGuyaneseHaitianHmongHonduranHopiHoumaHungarianIcelanderIndian (Asian)IndonesianInupiatIranianIraqiIrishIroquoisIsraeliItalianJamaicanJapaneseJordanianKenyanKiowaKoreanLaotianLatvianLebaneseLiberianLithuanianLumbeeLuxembourgerMacedonianMalaysianMalteseMarshalleseMenomineeMexicanMexican American IndianMongolianMoroccanNative HawaiianNavajoNepaleseNew ZealanderNicaraguanNigerianNorthern EuropeanNorwegianOkinawanOsageOttawaPaiutePakistaniPalestinianPanamanianParaguayanPennsylvania GermanPeruvianPimaPolishPortuguesePotawatomiPuebloPuerto RicanPuget Sound SalishRomanianRussianSalvadoranSamoanScandinavianScotch-IrishScottishSeminoleSenegaleseSerbianShoshoneSierra LeoneanSiouxSlavicSlovakSloveneSomaliSouth AfricanSouth AmericanSouth American IndianSoviet UnionSpaniardSpanishSpanish AmericanSpanish American IndianSri LankanSubsaharan AfricanSudaneseSwedishSwissSyrianTaiwaneseThaiTlingit-HaidaTohono O'OdhamTonganTrinidadian and TobagonianTsimshianTurkishU.S. Virgin IslanderUgandanUkrainianUruguayanUteVenezuelanVietnameseWelshWest IndianYakamaYaquiYugoslavianYumanYup'ikZimbabwean
Immigration
NonimmigrantsImmigrantsAfghanistanAfricaAlbaniaArgentinaArmeniaAsiaAustraliaAustriaBahamasBangladeshBarbadosBelarusBelgiumBelizeBoliviaBosnia and HerzegovinaBrazilBulgariaBurma/MyanmarCabo VerdeCambodiaCameroonCanadaCaribbeanCentral AmericaChileChinaColombiaCongoCosta RicaCroatiaCubaCzechoslovakiaDenmarkDominicaDominican RepublicEastern AfricaEastern AsiaEastern EuropeEcuadorEgyptEl SalvadorEnglandEritreaEthiopiaEuropeFijiFranceGermanyGhanaGreeceGrenadaGuatemalaGuyanaHaitiHondurasHong KongHungaryIndiaIndonesiaIranIraqIrelandIsraelItalyJamaicaJapanJordanKazakhstanKenyaKoreaKuwaitLaosLatin AmericaLatviaLebanonLiberiaLithuaniaMalaysiaMexicoMicronesiaMiddle AfricaMoldovaMoroccoNepalNetherlandsNicaraguaNigeriaNorth AmericaNorth MacedoniaNorthern AfricaNorthern EuropeNorwayOceaniaPakistanPanamaPeruPhilippinesPolandPortugalRomaniaRussiaSaudi ArabiaScotlandSenegalSerbiaSierra LeoneSingaporeSomaliaSouth AfricaSouth AmericaSouth Central AsiaSouth Eastern AsiaSouthern EuropeSpainSri LankaSt. Vincent and the GrenadinesSudanSwedenSwitzerlandSyriaTaiwanThailandTrinidad and TobagoTurkeyUgandaUkraineUruguayUzbekistanVenezuelaVietnamWest IndiesWestern AfricaWestern AsiaWestern EuropeYemenZaireZimbabweAzores
Married-Couple Family Poverty
Income
Poverty
Unemployment
Labor Participation
Family Structure
Vehicle Availability
Education Level
Disability

Czechoslovakian Married-Couple Family Poverty
Exceptional

4.4%
POVERTY | MARRIED-COUPLE FAMILIES
99.7/ 100
METRIC RATING
58th/ 347
METRIC RANK

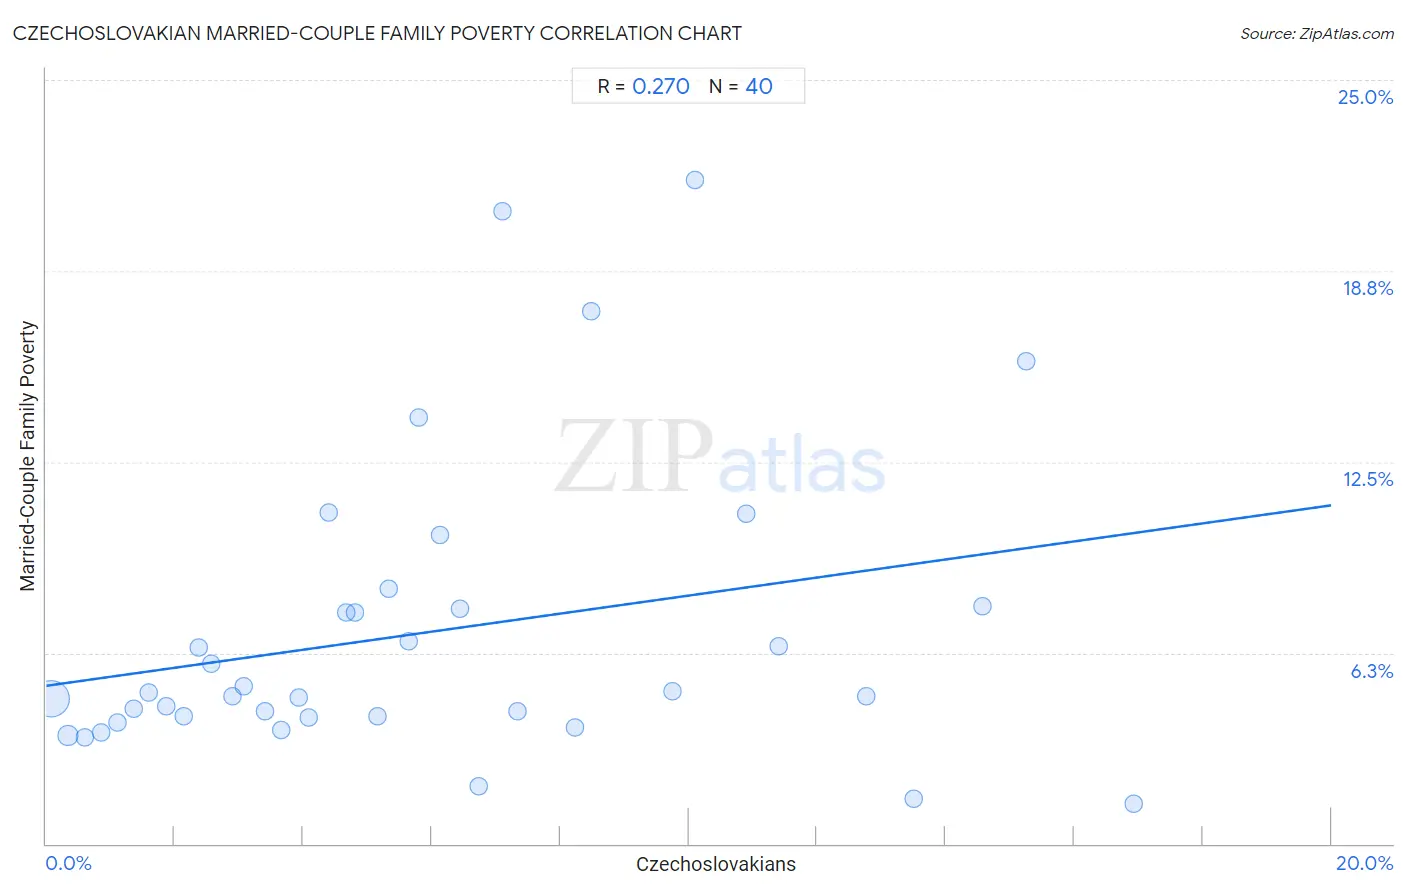
Czechoslovakian Married-Couple Family Poverty Correlation Chart

The statistical analysis conducted on geographies consisting of 364,959,932 people shows a weak positive correlation between the proportion of Czechoslovakians and poverty level among married-couple families in the United States with a correlation coefficient (R) of 0.270 and weighted average of 4.4%. On average, for every 1% (one percent) increase in Czechoslovakians within a typical geography, there is an increase of 0.30% in poverty level among married-couple families.
Czechoslovakian Married-Couple Family Poverty
It is essential to understand that the correlation between the percentage of Czechoslovakians and poverty level among married-couple families does not imply a direct cause-and-effect relationship. It remains uncertain whether the presence of Czechoslovakians influences an upward or downward trend in the level of poverty level among married-couple families within an area, or if Czechoslovakians simply ended up residing in those areas with higher or lower levels of poverty level among married-couple families due to other factors.

Demographics Similar to Czechoslovakians by Married-Couple Family Poverty

In terms of married-couple family poverty, the demographic groups most similar to Czechoslovakians are Immigrants from Zimbabwe (4.3%, a difference of 0.090%), Immigrants from Netherlands (4.3%, a difference of 0.090%), French (4.3%, a difference of 0.24%), Austrian (4.3%, a difference of 0.27%), and Welsh (4.3%, a difference of 0.53%).
DemographicsRating | RankMarried-Couple Family Poverty
Immigrants from Lithuania
99.7
/100
|
#51
Exceptional
4.3%
Russians
99.7
/100
|
#52
Exceptional
4.3%
Welsh
99.7
/100
|
#53
Exceptional
4.3%
Austrians
99.7
/100
|
#54
Exceptional
4.3%
French
99.7
/100
|
#55
Exceptional
4.3%
Immigrants from Zimbabwe
99.7
/100
|
#56
Exceptional
4.3%
Immigrants from Netherlands
99.7
/100
|
#57
Exceptional
4.3%
Czechoslovakians
99.7
/100
|
#58
Exceptional
4.4%
Immigrants from Sweden
99.6
/100
|
#59
Exceptional
4.4%
Tlingit-Haida
99.6
/100
|
#60
Exceptional
4.4%
Okinawans
99.6
/100
|
#61
Exceptional
4.4%
Immigrants from Australia
99.6
/100
|
#62
Exceptional
4.4%
Immigrants from Sri Lanka
99.6
/100
|
#63
Exceptional
4.4%
Immigrants from Bulgaria
99.5
/100
|
#64
Exceptional
4.4%
Macedonians
99.4
/100
|
#65
Exceptional
4.4%

Czechoslovakian Married-Couple Family Poverty Correlation Summary

MeasurementCzechoslovakian DataMarried-Couple Family Poverty Data
Minimum0.078%1.3%
Maximum16.9%21.7%
Range16.8%20.4%
Mean5.9%6.9%
Median5.0%4.9%
Interquartile 25% (IQ1)2.5%4.2%
Interquartile 75% (IQ3)8.4%7.7%
Interquartile Range (IQR)5.9%3.6%
Standard Deviation (Sample)4.4%4.9%
Standard Deviation (Population)4.4%4.8%

Correlation Details

Czechoslovakian PercentileSample SizeMarried-Couple Family Poverty
[
0.0%
-
0.5%
]
0.078%
328,097,2174.8%
[
0.0%
-
0.5%
]
0.34%
27,365,8703.5%
[
0.5%
-
1.0%
]
0.60%
6,105,3943.5%
[
0.5%
-
1.0%
]
0.85%
1,843,8843.6%
[
1.0%
-
1.5%
]
1.11%
611,0284.0%
[
1.0%
-
1.5%
]
1.36%
411,6754.4%
[
1.5%
-
2.0%
]
1.60%
166,4444.9%
[
1.5%
-
2.0%
]
1.87%
112,6644.5%
[
2.0%
-
2.5%
]
2.13%
33,4424.2%
[
2.0%
-
2.5%
]
2.38%
25,2386.4%
[
2.5%
-
3.0%
]
2.57%
41,1025.9%
[
2.5%
-
3.0%
]
2.90%
27,9474.8%
[
3.0%
-
3.5%
]
3.07%
13,4695.2%
[
3.0%
-
3.5%
]
3.41%
24,3434.3%
[
3.5%
-
4.0%
]
3.66%
16,9513.7%
[
3.5%
-
4.0%
]
3.93%
7,7044.8%
[
4.0%
-
4.5%
]
4.09%
12,3734.2%
[
4.0%
-
4.5%
]
4.40%
5,77610.8%
[
4.5%
-
5.0%
]
4.66%
2,5957.6%
[
4.5%
-
5.0%
]
4.80%
4,3367.6%
[
5.0%
-
5.5%
]
5.16%
6,5654.2%
[
5.0%
-
5.5%
]
5.34%
3,7858.3%
[
5.5%
-
6.0%
]
5.64%
3,1216.6%
[
5.5%
-
6.0%
]
5.80%
1,00013.9%
[
6.0%
-
6.5%
]
6.13%
31010.1%
[
6.0%
-
6.5%
]
6.44%
2,8267.7%
[
6.5%
-
7.0%
]
6.72%
5,6531.9%
[
7.0%
-
7.5%
]
7.11%
21120.7%
[
7.0%
-
7.5%
]
7.34%
1094.3%
[
8.0%
-
8.5%
]
8.24%
3403.8%
[
8.0%
-
8.5%
]
8.49%
1,44917.4%
[
9.5%
-
10.0%
]
9.75%
8105.0%
[
10.0%
-
10.5%
]
10.10%
1,00021.7%
[
10.5%
-
11.0%
]
10.90%
68810.8%
[
11.0%
-
11.5%
]
11.39%
3956.5%
[
12.5%
-
13.0%
]
12.77%
3764.8%
[
13.0%
-
13.5%
]
13.50%
5261.5%
[
14.5%
-
15.0%
]
14.56%
6667.8%
[
15.0%
-
15.5%
]
15.25%
5915.8%
[
16.5%
-
17.0%
]
16.92%
5911.3%