Palestinian Married-Couple Family Poverty
COMPARE
Palestinian
Select to Compare
Married-Couple Family Poverty
Palestinian Married-Couple Family Poverty
4.9%
POVERTY | MARRIED-COUPLE FAMILIES
91.2/ 100
METRIC RATING
128th/ 347
METRIC RANK
Palestinian Married-Couple Family Poverty Correlation Chart
The statistical analysis conducted on geographies consisting of 215,628,863 people shows a slight positive correlation between the proportion of Palestinians and poverty level among married-couple families in the United States with a correlation coefficient (R) of 0.052 and weighted average of 4.9%. On average, for every 1% (one percent) increase in Palestinians within a typical geography, there is an increase of 0.050% in poverty level among married-couple families.
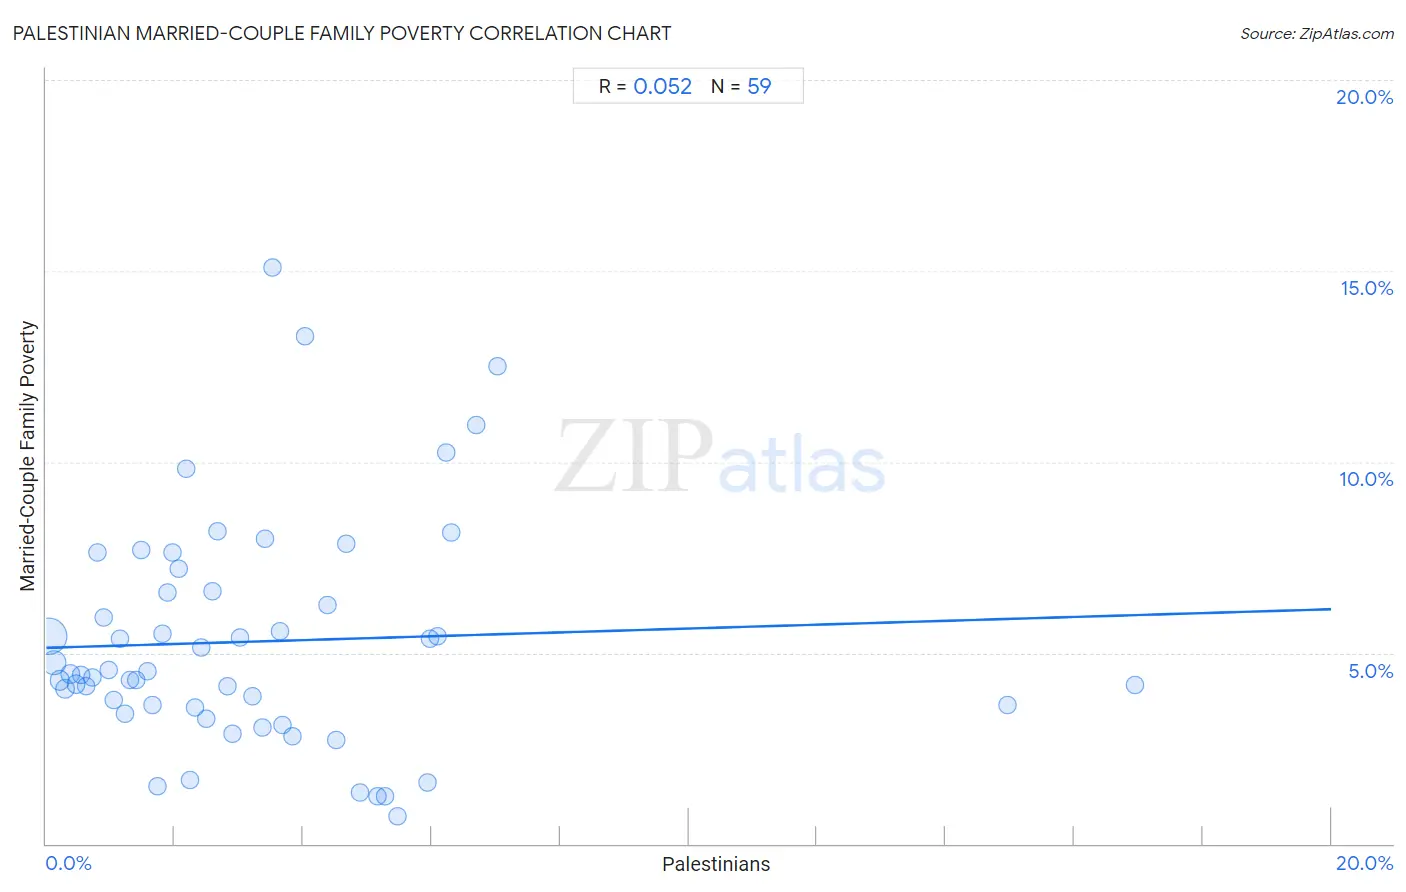
It is essential to understand that the correlation between the percentage of Palestinians and poverty level among married-couple families does not imply a direct cause-and-effect relationship. It remains uncertain whether the presence of Palestinians influences an upward or downward trend in the level of poverty level among married-couple families within an area, or if Palestinians simply ended up residing in those areas with higher or lower levels of poverty level among married-couple families due to other factors.
Demographics Similar to Palestinians by Married-Couple Family Poverty
In terms of married-couple family poverty, the demographic groups most similar to Palestinians are Immigrants from Pakistan (4.9%, a difference of 0.20%), Soviet Union (4.9%, a difference of 0.21%), Immigrants from Eastern Europe (4.9%, a difference of 0.28%), Puget Sound Salish (4.9%, a difference of 0.29%), and Egyptian (4.8%, a difference of 0.32%).
| Demographics | Rating | Rank | Married-Couple Family Poverty |
| Indians (Asian) | 93.2 /100 | #121 | Exceptional 4.8% |
| Whites/Caucasians | 93.1 /100 | #122 | Exceptional 4.8% |
| Jordanians | 93.1 /100 | #123 | Exceptional 4.8% |
| Romanians | 92.5 /100 | #124 | Exceptional 4.8% |
| Immigrants from Bosnia and Herzegovina | 92.5 /100 | #125 | Exceptional 4.8% |
| Immigrants from Asia | 92.3 /100 | #126 | Exceptional 4.8% |
| Egyptians | 92.0 /100 | #127 | Exceptional 4.8% |
| Palestinians | 91.2 /100 | #128 | Exceptional 4.9% |
| Immigrants from Pakistan | 90.7 /100 | #129 | Exceptional 4.9% |
| Soviet Union | 90.7 /100 | #130 | Exceptional 4.9% |
| Immigrants from Eastern Europe | 90.5 /100 | #131 | Exceptional 4.9% |
| Puget Sound Salish | 90.4 /100 | #132 | Exceptional 4.9% |
| Immigrants from Kenya | 90.2 /100 | #133 | Exceptional 4.9% |
| Samoans | 90.2 /100 | #134 | Exceptional 4.9% |
| Assyrians/Chaldeans/Syriacs | 89.4 /100 | #135 | Excellent 4.9% |
Palestinian Married-Couple Family Poverty Correlation Summary
| Measurement | Palestinian Data | Married-Couple Family Poverty Data |
| Minimum | 0.038% | 0.73% |
| Maximum | 16.9% | 15.1% |
| Range | 16.9% | 14.3% |
| Mean | 3.2% | 5.3% |
| Median | 2.5% | 4.4% |
| Interquartile 25% (IQ1) | 1.2% | 3.6% |
| Interquartile 75% (IQ3) | 4.5% | 6.6% |
| Interquartile Range (IQR) | 3.3% | 3.0% |
| Standard Deviation (Sample) | 3.1% | 3.0% |
| Standard Deviation (Population) | 3.0% | 3.0% |
Correlation Details
| Palestinian Percentile | Sample Size | Married-Couple Family Poverty |
[ 0.0% - 0.5% ] 0.038% | 136,032,386 | 5.4% |
[ 0.0% - 0.5% ] 0.12% | 42,466,488 | 4.7% |
[ 0.0% - 0.5% ] 0.21% | 12,727,841 | 4.3% |
[ 0.0% - 0.5% ] 0.29% | 7,885,721 | 4.1% |
[ 0.0% - 0.5% ] 0.38% | 4,830,979 | 4.4% |
[ 0.0% - 0.5% ] 0.47% | 2,718,908 | 4.2% |
[ 0.5% - 1.0% ] 0.55% | 1,758,332 | 4.4% |
[ 0.5% - 1.0% ] 0.63% | 1,362,772 | 4.1% |
[ 0.5% - 1.0% ] 0.71% | 1,093,257 | 4.4% |
[ 0.5% - 1.0% ] 0.80% | 464,525 | 7.6% |
[ 0.5% - 1.0% ] 0.90% | 788,103 | 5.9% |
[ 0.5% - 1.0% ] 0.98% | 533,657 | 4.6% |
[ 1.0% - 1.5% ] 1.05% | 377,013 | 3.8% |
[ 1.0% - 1.5% ] 1.14% | 269,854 | 5.4% |
[ 1.0% - 1.5% ] 1.22% | 254,506 | 3.4% |
[ 1.0% - 1.5% ] 1.30% | 452,606 | 4.3% |
[ 1.0% - 1.5% ] 1.40% | 52,761 | 4.3% |
[ 1.0% - 1.5% ] 1.48% | 94,511 | 7.7% |
[ 1.5% - 2.0% ] 1.57% | 202,961 | 4.5% |
[ 1.5% - 2.0% ] 1.65% | 195,446 | 3.6% |
[ 1.5% - 2.0% ] 1.74% | 49,903 | 1.5% |
[ 1.5% - 2.0% ] 1.81% | 63,426 | 5.5% |
[ 1.5% - 2.0% ] 1.89% | 88,001 | 6.6% |
[ 1.5% - 2.0% ] 1.97% | 57,248 | 7.6% |
[ 2.0% - 2.5% ] 2.06% | 104,816 | 7.2% |
[ 2.0% - 2.5% ] 2.18% | 37,319 | 9.8% |
[ 2.0% - 2.5% ] 2.24% | 11,815 | 1.7% |
[ 2.0% - 2.5% ] 2.32% | 42,595 | 3.6% |
[ 2.0% - 2.5% ] 2.41% | 90,346 | 5.1% |
[ 2.0% - 2.5% ] 2.50% | 71,023 | 3.3% |
[ 2.5% - 3.0% ] 2.60% | 14,176 | 6.6% |
[ 2.5% - 3.0% ] 2.66% | 10,859 | 8.2% |
[ 2.5% - 3.0% ] 2.82% | 7,946 | 4.1% |
[ 2.5% - 3.0% ] 2.91% | 22,318 | 2.9% |
[ 3.0% - 3.5% ] 3.02% | 33,887 | 5.4% |
[ 3.0% - 3.5% ] 3.21% | 68,870 | 3.9% |
[ 3.0% - 3.5% ] 3.37% | 4,830 | 3.1% |
[ 3.0% - 3.5% ] 3.40% | 36,556 | 8.0% |
[ 3.5% - 4.0% ] 3.53% | 14,360 | 15.1% |
[ 3.5% - 4.0% ] 3.64% | 40,942 | 5.6% |
[ 3.5% - 4.0% ] 3.68% | 2,090 | 3.1% |
[ 3.5% - 4.0% ] 3.83% | 8,065 | 2.8% |
[ 4.0% - 4.5% ] 4.03% | 23,437 | 13.3% |
[ 4.0% - 4.5% ] 4.37% | 5,121 | 6.3% |
[ 4.5% - 5.0% ] 4.51% | 8,028 | 2.7% |
[ 4.5% - 5.0% ] 4.66% | 794 | 7.9% |
[ 4.5% - 5.0% ] 4.89% | 3,050 | 1.3% |
[ 5.0% - 5.5% ] 5.16% | 3,447 | 1.3% |
[ 5.0% - 5.5% ] 5.27% | 3,379 | 1.3% |
[ 5.0% - 5.5% ] 5.47% | 4,222 | 0.73% |
[ 5.5% - 6.0% ] 5.93% | 26,198 | 1.6% |
[ 5.5% - 6.0% ] 5.98% | 14,915 | 5.4% |
[ 6.0% - 6.5% ] 6.09% | 14,650 | 5.4% |
[ 6.0% - 6.5% ] 6.22% | 45,772 | 10.3% |
[ 6.0% - 6.5% ] 6.31% | 16,939 | 8.1% |
[ 6.5% - 7.0% ] 6.70% | 2,970 | 11.0% |
[ 7.0% - 7.5% ] 7.03% | 5,022 | 12.5% |
[ 14.5% - 15.0% ] 14.95% | 6,842 | 3.6% |
[ 16.5% - 17.0% ] 16.95% | 59 | 4.2% |