Zimbabwean Married-Couple Family Poverty

COMPARE

Zimbabwean
Race
Ancestry
AfghanAfricanAlaska NativeAlaskan AthabascanAlbanianAleutAlsatianAmericanApacheArabArapahoArgentineanArmenianAssyrian/Chaldean/SyriacAustralianAustrianBahamianBangladeshiBarbadianBasqueBelgianBelizeanBermudanBhutaneseBlackfeetBolivianBrazilianBritishBritish West IndianBulgarianBurmeseCajunCambodianCanadianCape VerdeanCarpatho RusynCelticCentral AmericanCentral American IndianCherokeeCheyenneChickasawChileanChineseChippewaChoctawColombianColvilleComancheCosta RicanCreeCreekCroatianCrowCubanCypriotCzechCzechoslovakianDanishDelawareDominicanDutchDutch West IndianEastern EuropeanEcuadorianEgyptianEnglishEstonianEthiopianEuropeanFijianFilipinoFinnishFrenchFrench American IndianFrench CanadianGermanGerman RussianGhanaianGreekGuamanian/ChamorroGuatemalanGuyaneseHaitianHmongHonduranHopiHoumaHungarianIcelanderIndian (Asian)IndonesianInupiatIranianIraqiIrishIroquoisIsraeliItalianJamaicanJapaneseJordanianKenyanKiowaKoreanLaotianLatvianLebaneseLiberianLithuanianLumbeeLuxembourgerMacedonianMalaysianMalteseMarshalleseMenomineeMexicanMexican American IndianMongolianMoroccanNative HawaiianNavajoNepaleseNew ZealanderNicaraguanNigerianNorthern EuropeanNorwegianOkinawanOsageOttawaPaiutePakistaniPalestinianPanamanianParaguayanPennsylvania GermanPeruvianPimaPolishPortuguesePotawatomiPuebloPuerto RicanPuget Sound SalishRomanianRussianSalvadoranSamoanScandinavianScotch-IrishScottishSeminoleSenegaleseSerbianShoshoneSierra LeoneanSiouxSlavicSlovakSloveneSomaliSouth AfricanSouth AmericanSouth American IndianSoviet UnionSpaniardSpanishSpanish AmericanSpanish American IndianSri LankanSubsaharan AfricanSudaneseSwedishSwissSyrianTaiwaneseThaiTlingit-HaidaTohono O'OdhamTonganTrinidadian and TobagonianTsimshianTurkishU.S. Virgin IslanderUgandanUkrainianUruguayanUteVenezuelanVietnameseWelshWest IndianYakamaYaquiYugoslavianYumanYup'ikZimbabwean
Immigration
NonimmigrantsImmigrantsAfghanistanAfricaAlbaniaArgentinaArmeniaAsiaAustraliaAustriaBahamasBangladeshBarbadosBelarusBelgiumBelizeBoliviaBosnia and HerzegovinaBrazilBulgariaBurma/MyanmarCabo VerdeCambodiaCameroonCanadaCaribbeanCentral AmericaChileChinaColombiaCongoCosta RicaCroatiaCubaCzechoslovakiaDenmarkDominicaDominican RepublicEastern AfricaEastern AsiaEastern EuropeEcuadorEgyptEl SalvadorEnglandEritreaEthiopiaEuropeFijiFranceGermanyGhanaGreeceGrenadaGuatemalaGuyanaHaitiHondurasHong KongHungaryIndiaIndonesiaIranIraqIrelandIsraelItalyJamaicaJapanJordanKazakhstanKenyaKoreaKuwaitLaosLatin AmericaLatviaLebanonLiberiaLithuaniaMalaysiaMexicoMicronesiaMiddle AfricaMoldovaMoroccoNepalNetherlandsNicaraguaNigeriaNorth AmericaNorth MacedoniaNorthern AfricaNorthern EuropeNorwayOceaniaPakistanPanamaPeruPhilippinesPolandPortugalRomaniaRussiaSaudi ArabiaScotlandSenegalSerbiaSierra LeoneSingaporeSomaliaSouth AfricaSouth AmericaSouth Central AsiaSouth Eastern AsiaSouthern EuropeSpainSri LankaSt. Vincent and the GrenadinesSudanSwedenSwitzerlandSyriaTaiwanThailandTrinidad and TobagoTurkeyUgandaUkraineUruguayUzbekistanVenezuelaVietnamWest IndiesWestern AfricaWestern AsiaWestern EuropeYemenZaireZimbabweAzores
Select to Compare
Race
Ancestry
AfghanAfricanAlaska NativeAlaskan AthabascanAlbanianAleutAlsatianAmericanApacheArabArapahoArgentineanArmenianAssyrian/Chaldean/SyriacAustralianAustrianBahamianBangladeshiBarbadianBasqueBelgianBelizeanBermudanBhutaneseBlackfeetBolivianBrazilianBritishBritish West IndianBulgarianBurmeseCajunCambodianCanadianCape VerdeanCarpatho RusynCelticCentral AmericanCentral American IndianCherokeeCheyenneChickasawChileanChineseChippewaChoctawColombianColvilleComancheCosta RicanCreeCreekCroatianCrowCubanCypriotCzechCzechoslovakianDanishDelawareDominicanDutchDutch West IndianEastern EuropeanEcuadorianEgyptianEnglishEstonianEthiopianEuropeanFijianFilipinoFinnishFrenchFrench American IndianFrench CanadianGermanGerman RussianGhanaianGreekGuamanian/ChamorroGuatemalanGuyaneseHaitianHmongHonduranHopiHoumaHungarianIcelanderIndian (Asian)IndonesianInupiatIranianIraqiIrishIroquoisIsraeliItalianJamaicanJapaneseJordanianKenyanKiowaKoreanLaotianLatvianLebaneseLiberianLithuanianLumbeeLuxembourgerMacedonianMalaysianMalteseMarshalleseMenomineeMexicanMexican American IndianMongolianMoroccanNative HawaiianNavajoNepaleseNew ZealanderNicaraguanNigerianNorthern EuropeanNorwegianOkinawanOsageOttawaPaiutePakistaniPalestinianPanamanianParaguayanPennsylvania GermanPeruvianPimaPolishPortuguesePotawatomiPuebloPuerto RicanPuget Sound SalishRomanianRussianSalvadoranSamoanScandinavianScotch-IrishScottishSeminoleSenegaleseSerbianShoshoneSierra LeoneanSiouxSlavicSlovakSloveneSomaliSouth AfricanSouth AmericanSouth American IndianSoviet UnionSpaniardSpanishSpanish AmericanSpanish American IndianSri LankanSubsaharan AfricanSudaneseSwedishSwissSyrianTaiwaneseThaiTlingit-HaidaTohono O'OdhamTonganTrinidadian and TobagonianTsimshianTurkishU.S. Virgin IslanderUgandanUkrainianUruguayanUteVenezuelanVietnameseWelshWest IndianYakamaYaquiYugoslavianYumanYup'ik
Immigration
NonimmigrantsImmigrantsAfghanistanAfricaAlbaniaArgentinaArmeniaAsiaAustraliaAustriaBahamasBangladeshBarbadosBelarusBelgiumBelizeBoliviaBosnia and HerzegovinaBrazilBulgariaBurma/MyanmarCabo VerdeCambodiaCameroonCanadaCaribbeanCentral AmericaChileChinaColombiaCongoCosta RicaCroatiaCubaCzechoslovakiaDenmarkDominicaDominican RepublicEastern AfricaEastern AsiaEastern EuropeEcuadorEgyptEl SalvadorEnglandEritreaEthiopiaEuropeFijiFranceGermanyGhanaGreeceGrenadaGuatemalaGuyanaHaitiHondurasHong KongHungaryIndiaIndonesiaIranIraqIrelandIsraelItalyJamaicaJapanJordanKazakhstanKenyaKoreaKuwaitLaosLatin AmericaLatviaLebanonLiberiaLithuaniaMalaysiaMexicoMicronesiaMiddle AfricaMoldovaMoroccoNepalNetherlandsNicaraguaNigeriaNorth AmericaNorth MacedoniaNorthern AfricaNorthern EuropeNorwayOceaniaPakistanPanamaPeruPhilippinesPolandPortugalRomaniaRussiaSaudi ArabiaScotlandSenegalSerbiaSierra LeoneSingaporeSomaliaSouth AfricaSouth AmericaSouth Central AsiaSouth Eastern AsiaSouthern EuropeSpainSri LankaSt. Vincent and the GrenadinesSudanSwedenSwitzerlandSyriaTaiwanThailandTrinidad and TobagoTurkeyUgandaUkraineUruguayUzbekistanVenezuelaVietnamWest IndiesWestern AfricaWestern AsiaWestern EuropeYemenZaireZimbabweAzores
Married-Couple Family Poverty
Income
Poverty
Unemployment
Labor Participation
Family Structure
Vehicle Availability
Education Level
Disability

Zimbabwean Married-Couple Family Poverty
Exceptional

4.1%
POVERTY | MARRIED-COUPLE FAMILIES
99.9/ 100
METRIC RATING
21st/ 347
METRIC RANK

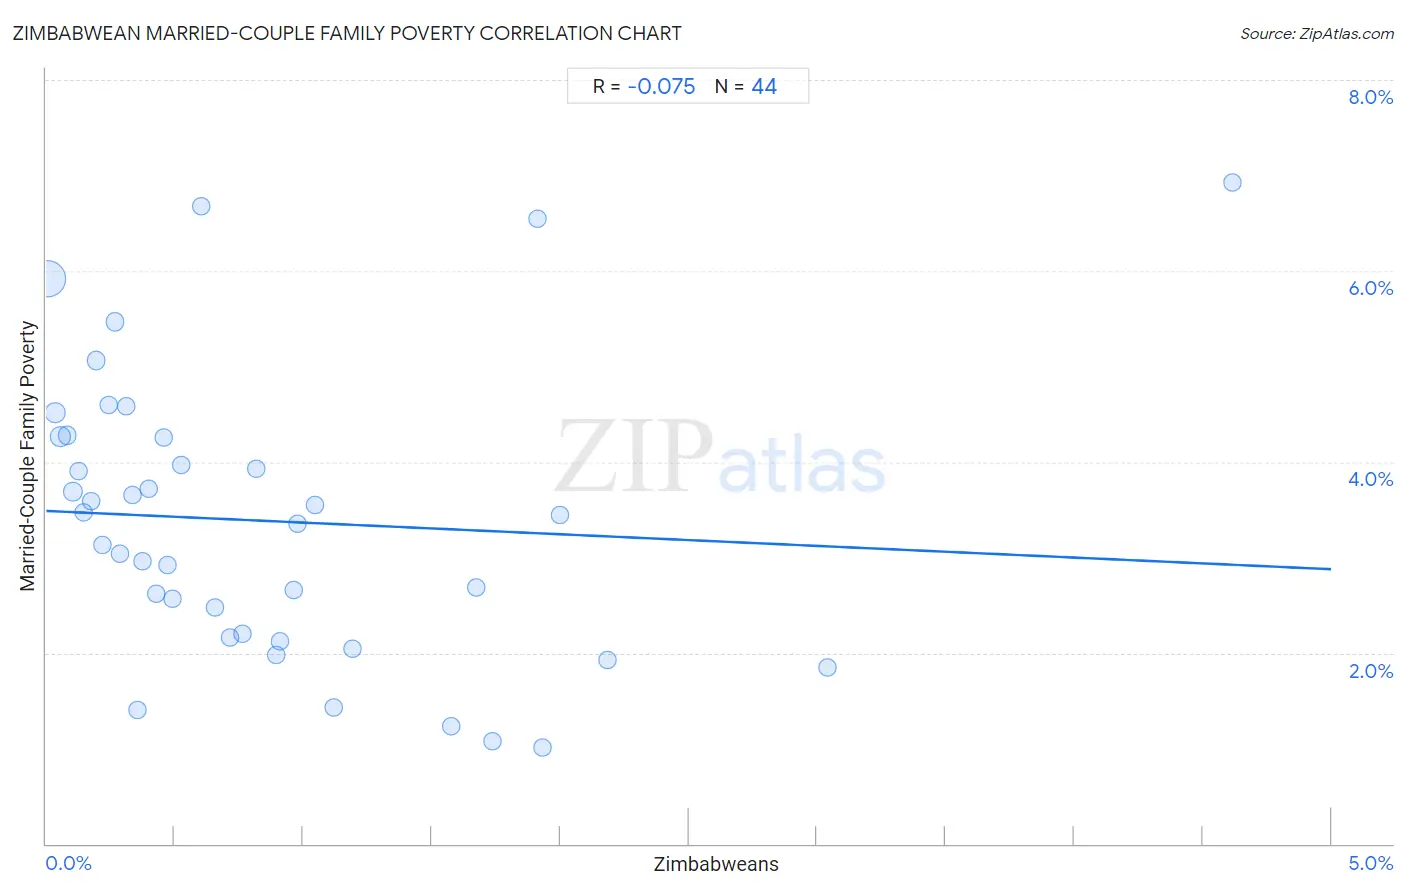
Zimbabwean Married-Couple Family Poverty Correlation Chart

The statistical analysis conducted on geographies consisting of 69,119,087 people shows a slight negative correlation between the proportion of Zimbabweans and poverty level among married-couple families in the United States with a correlation coefficient (R) of -0.075 and weighted average of 4.1%. On average, for every 1% (one percent) increase in Zimbabweans within a typical geography, there is a decrease of 0.12% in poverty level among married-couple families.
Zimbabwean Married-Couple Family Poverty
It is essential to understand that the correlation between the percentage of Zimbabweans and poverty level among married-couple families does not imply a direct cause-and-effect relationship. It remains uncertain whether the presence of Zimbabweans influences an upward or downward trend in the level of poverty level among married-couple families within an area, or if Zimbabweans simply ended up residing in those areas with higher or lower levels of poverty level among married-couple families due to other factors.

Demographics Similar to Zimbabweans by Married-Couple Family Poverty

In terms of married-couple family poverty, the demographic groups most similar to Zimbabweans are Maltese (4.1%, a difference of 0.030%), Immigrants from Ireland (4.1%, a difference of 0.27%), Immigrants from Singapore (4.1%, a difference of 0.37%), Bhutanese (4.1%, a difference of 0.39%), and Eastern European (4.1%, a difference of 0.62%).
DemographicsRating | RankMarried-Couple Family Poverty
Slovaks
100.0
/100
|
#14
Exceptional
4.0%
Poles
100.0
/100
|
#15
Exceptional
4.0%
Germans
100.0
/100
|
#16
Exceptional
4.0%
Filipinos
100.0
/100
|
#17
Exceptional
4.0%
Italians
100.0
/100
|
#18
Exceptional
4.0%
Immigrants from Ireland
99.9
/100
|
#19
Exceptional
4.1%
Maltese
99.9
/100
|
#20
Exceptional
4.1%
Zimbabweans
99.9
/100
|
#21
Exceptional
4.1%
Immigrants from Singapore
99.9
/100
|
#22
Exceptional
4.1%
Bhutanese
99.9
/100
|
#23
Exceptional
4.1%
Eastern Europeans
99.9
/100
|
#24
Exceptional
4.1%
Immigrants from Taiwan
99.9
/100
|
#25
Exceptional
4.1%
Cypriots
99.9
/100
|
#26
Exceptional
4.1%
Danes
99.9
/100
|
#27
Exceptional
4.1%
Scandinavians
99.9
/100
|
#28
Exceptional
4.1%

Zimbabwean Married-Couple Family Poverty Correlation Summary

MeasurementZimbabwean DataMarried-Couple Family Poverty Data
Minimum0.0070%1.0%
Maximum4.6%6.9%
Range4.6%5.9%
Mean0.85%3.4%
Median0.51%3.4%
Interquartile 25% (IQ1)0.26%2.2%
Interquartile 75% (IQ3)1.1%4.3%
Interquartile Range (IQR)0.83%2.1%
Standard Deviation (Sample)0.90%1.5%
Standard Deviation (Population)0.89%1.5%

Correlation Details

Zimbabwean PercentileSample SizeMarried-Couple Family Poverty
[
0.0%
-
0.5%
]
0.0070%
51,351,8845.9%
[
0.0%
-
0.5%
]
0.033%
5,818,7924.5%
[
0.0%
-
0.5%
]
0.055%
4,716,5964.3%
[
0.0%
-
0.5%
]
0.081%
1,658,2664.3%
[
0.0%
-
0.5%
]
0.10%
1,247,0833.7%
[
0.0%
-
0.5%
]
0.13%
800,6973.9%
[
0.0%
-
0.5%
]
0.15%
715,5563.5%
[
0.0%
-
0.5%
]
0.17%
471,9653.6%
[
0.0%
-
0.5%
]
0.19%
539,8855.1%
[
0.0%
-
0.5%
]
0.22%
314,4603.1%
[
0.0%
-
0.5%
]
0.24%
301,8674.6%
[
0.0%
-
0.5%
]
0.27%
189,3135.5%
[
0.0%
-
0.5%
]
0.29%
211,6943.0%
[
0.0%
-
0.5%
]
0.31%
65,9504.6%
[
0.0%
-
0.5%
]
0.33%
38,9793.6%
[
0.0%
-
0.5%
]
0.35%
5,6591.4%
[
0.0%
-
0.5%
]
0.38%
51,3683.0%
[
0.0%
-
0.5%
]
0.40%
28,4583.7%
[
0.0%
-
0.5%
]
0.43%
27,8062.6%
[
0.0%
-
0.5%
]
0.46%
24,6464.3%
[
0.0%
-
0.5%
]
0.47%
145,0122.9%
[
0.0%
-
0.5%
]
0.49%
31,7942.6%
[
0.5%
-
1.0%
]
0.53%
4,7484.0%
[
0.5%
-
1.0%
]
0.60%
15,2076.7%
[
0.5%
-
1.0%
]
0.65%
43,7062.5%
[
0.5%
-
1.0%
]
0.72%
10,2092.2%
[
0.5%
-
1.0%
]
0.76%
2,0952.2%
[
0.5%
-
1.0%
]
0.82%
21,3733.9%
[
0.5%
-
1.0%
]
0.89%
33,9672.0%
[
0.5%
-
1.0%
]
0.91%
27,8292.1%
[
0.5%
-
1.0%
]
0.96%
29,5452.7%
[
0.5%
-
1.0%
]
0.98%
17,9143.3%
[
1.0%
-
1.5%
]
1.04%
6,9953.6%
[
1.0%
-
1.5%
]
1.12%
36,7491.4%
[
1.0%
-
1.5%
]
1.19%
15,9342.0%
[
1.5%
-
2.0%
]
1.58%
12,0451.2%
[
1.5%
-
2.0%
]
1.67%
9572.7%
[
1.5%
-
2.0%
]
1.74%
8,2421.1%
[
1.5%
-
2.0%
]
1.91%
19,8426.6%
[
1.5%
-
2.0%
]
1.93%
15,2441.0%
[
2.0%
-
2.5%
]
2.00%
13,2473.4%
[
2.0%
-
2.5%
]
2.18%
17,2611.9%
[
3.0%
-
3.5%
]
3.04%
6,7751.8%
[
4.5%
-
5.0%
]
4.62%
1,4736.9%