Romanian Married-Couple Family Poverty

COMPARE

Romanian
Race
Ancestry
AfghanAfricanAlaska NativeAlaskan AthabascanAlbanianAleutAlsatianAmericanApacheArabArapahoArgentineanArmenianAssyrian/Chaldean/SyriacAustralianAustrianBahamianBangladeshiBarbadianBasqueBelgianBelizeanBermudanBhutaneseBlackfeetBolivianBrazilianBritishBritish West IndianBulgarianBurmeseCajunCambodianCanadianCape VerdeanCarpatho RusynCelticCentral AmericanCentral American IndianCherokeeCheyenneChickasawChileanChineseChippewaChoctawColombianColvilleComancheCosta RicanCreeCreekCroatianCrowCubanCypriotCzechCzechoslovakianDanishDelawareDominicanDutchDutch West IndianEastern EuropeanEcuadorianEgyptianEnglishEstonianEthiopianEuropeanFijianFilipinoFinnishFrenchFrench American IndianFrench CanadianGermanGerman RussianGhanaianGreekGuamanian/ChamorroGuatemalanGuyaneseHaitianHmongHonduranHopiHoumaHungarianIcelanderIndian (Asian)IndonesianInupiatIranianIraqiIrishIroquoisIsraeliItalianJamaicanJapaneseJordanianKenyanKiowaKoreanLaotianLatvianLebaneseLiberianLithuanianLumbeeLuxembourgerMacedonianMalaysianMalteseMarshalleseMenomineeMexicanMexican American IndianMongolianMoroccanNative HawaiianNavajoNepaleseNew ZealanderNicaraguanNigerianNorthern EuropeanNorwegianOkinawanOsageOttawaPaiutePakistaniPalestinianPanamanianParaguayanPennsylvania GermanPeruvianPimaPolishPortuguesePotawatomiPuebloPuerto RicanPuget Sound SalishRomanianRussianSalvadoranSamoanScandinavianScotch-IrishScottishSeminoleSenegaleseSerbianShoshoneSierra LeoneanSiouxSlavicSlovakSloveneSomaliSouth AfricanSouth AmericanSouth American IndianSoviet UnionSpaniardSpanishSpanish AmericanSpanish American IndianSri LankanSubsaharan AfricanSudaneseSwedishSwissSyrianTaiwaneseThaiTlingit-HaidaTohono O'OdhamTonganTrinidadian and TobagonianTsimshianTurkishU.S. Virgin IslanderUgandanUkrainianUruguayanUteVenezuelanVietnameseWelshWest IndianYakamaYaquiYugoslavianYumanYup'ikZimbabwean
Immigration
NonimmigrantsImmigrantsAfghanistanAfricaAlbaniaArgentinaArmeniaAsiaAustraliaAustriaBahamasBangladeshBarbadosBelarusBelgiumBelizeBoliviaBosnia and HerzegovinaBrazilBulgariaBurma/MyanmarCabo VerdeCambodiaCameroonCanadaCaribbeanCentral AmericaChileChinaColombiaCongoCosta RicaCroatiaCubaCzechoslovakiaDenmarkDominicaDominican RepublicEastern AfricaEastern AsiaEastern EuropeEcuadorEgyptEl SalvadorEnglandEritreaEthiopiaEuropeFijiFranceGermanyGhanaGreeceGrenadaGuatemalaGuyanaHaitiHondurasHong KongHungaryIndiaIndonesiaIranIraqIrelandIsraelItalyJamaicaJapanJordanKazakhstanKenyaKoreaKuwaitLaosLatin AmericaLatviaLebanonLiberiaLithuaniaMalaysiaMexicoMicronesiaMiddle AfricaMoldovaMoroccoNepalNetherlandsNicaraguaNigeriaNorth AmericaNorth MacedoniaNorthern AfricaNorthern EuropeNorwayOceaniaPakistanPanamaPeruPhilippinesPolandPortugalRomaniaRussiaSaudi ArabiaScotlandSenegalSerbiaSierra LeoneSingaporeSomaliaSouth AfricaSouth AmericaSouth Central AsiaSouth Eastern AsiaSouthern EuropeSpainSri LankaSt. Vincent and the GrenadinesSudanSwedenSwitzerlandSyriaTaiwanThailandTrinidad and TobagoTurkeyUgandaUkraineUruguayUzbekistanVenezuelaVietnamWest IndiesWestern AfricaWestern AsiaWestern EuropeYemenZaireZimbabweAzores
Select to Compare
Race
Ancestry
AfghanAfricanAlaska NativeAlaskan AthabascanAlbanianAleutAlsatianAmericanApacheArabArapahoArgentineanArmenianAssyrian/Chaldean/SyriacAustralianAustrianBahamianBangladeshiBarbadianBasqueBelgianBelizeanBermudanBhutaneseBlackfeetBolivianBrazilianBritishBritish West IndianBulgarianBurmeseCajunCambodianCanadianCape VerdeanCarpatho RusynCelticCentral AmericanCentral American IndianCherokeeCheyenneChickasawChileanChineseChippewaChoctawColombianColvilleComancheCosta RicanCreeCreekCroatianCrowCubanCypriotCzechCzechoslovakianDanishDelawareDominicanDutchDutch West IndianEastern EuropeanEcuadorianEgyptianEnglishEstonianEthiopianEuropeanFijianFilipinoFinnishFrenchFrench American IndianFrench CanadianGermanGerman RussianGhanaianGreekGuamanian/ChamorroGuatemalanGuyaneseHaitianHmongHonduranHopiHoumaHungarianIcelanderIndian (Asian)IndonesianInupiatIranianIraqiIrishIroquoisIsraeliItalianJamaicanJapaneseJordanianKenyanKiowaKoreanLaotianLatvianLebaneseLiberianLithuanianLumbeeLuxembourgerMacedonianMalaysianMalteseMarshalleseMenomineeMexicanMexican American IndianMongolianMoroccanNative HawaiianNavajoNepaleseNew ZealanderNicaraguanNigerianNorthern EuropeanNorwegianOkinawanOsageOttawaPaiutePakistaniPalestinianPanamanianParaguayanPennsylvania GermanPeruvianPimaPolishPortuguesePotawatomiPuebloPuerto RicanPuget Sound SalishRussianSalvadoranSamoanScandinavianScotch-IrishScottishSeminoleSenegaleseSerbianShoshoneSierra LeoneanSiouxSlavicSlovakSloveneSomaliSouth AfricanSouth AmericanSouth American IndianSoviet UnionSpaniardSpanishSpanish AmericanSpanish American IndianSri LankanSubsaharan AfricanSudaneseSwedishSwissSyrianTaiwaneseThaiTlingit-HaidaTohono O'OdhamTonganTrinidadian and TobagonianTsimshianTurkishU.S. Virgin IslanderUgandanUkrainianUruguayanUteVenezuelanVietnameseWelshWest IndianYakamaYaquiYugoslavianYumanYup'ikZimbabwean
Immigration
NonimmigrantsImmigrantsAfghanistanAfricaAlbaniaArgentinaArmeniaAsiaAustraliaAustriaBahamasBangladeshBarbadosBelarusBelgiumBelizeBoliviaBosnia and HerzegovinaBrazilBulgariaBurma/MyanmarCabo VerdeCambodiaCameroonCanadaCaribbeanCentral AmericaChileChinaColombiaCongoCosta RicaCroatiaCubaCzechoslovakiaDenmarkDominicaDominican RepublicEastern AfricaEastern AsiaEastern EuropeEcuadorEgyptEl SalvadorEnglandEritreaEthiopiaEuropeFijiFranceGermanyGhanaGreeceGrenadaGuatemalaGuyanaHaitiHondurasHong KongHungaryIndiaIndonesiaIranIraqIrelandIsraelItalyJamaicaJapanJordanKazakhstanKenyaKoreaKuwaitLaosLatin AmericaLatviaLebanonLiberiaLithuaniaMalaysiaMexicoMicronesiaMiddle AfricaMoldovaMoroccoNepalNetherlandsNicaraguaNigeriaNorth AmericaNorth MacedoniaNorthern AfricaNorthern EuropeNorwayOceaniaPakistanPanamaPeruPhilippinesPolandPortugalRomaniaRussiaSaudi ArabiaScotlandSenegalSerbiaSierra LeoneSingaporeSomaliaSouth AfricaSouth AmericaSouth Central AsiaSouth Eastern AsiaSouthern EuropeSpainSri LankaSt. Vincent and the GrenadinesSudanSwedenSwitzerlandSyriaTaiwanThailandTrinidad and TobagoTurkeyUgandaUkraineUruguayUzbekistanVenezuelaVietnamWest IndiesWestern AfricaWestern AsiaWestern EuropeYemenZaireZimbabweAzores
Married-Couple Family Poverty
Income
Poverty
Unemployment
Labor Participation
Family Structure
Vehicle Availability
Education Level
Disability

Romanian Married-Couple Family Poverty
Exceptional

4.8%
POVERTY | MARRIED-COUPLE FAMILIES
92.5/ 100
METRIC RATING
124th/ 347
METRIC RANK

Romanian Married-Couple Family Poverty Correlation Chart

The statistical analysis conducted on geographies consisting of 374,441,854 people shows a moderate positive correlation between the proportion of Romanians and poverty level among married-couple families in the United States with a correlation coefficient (R) of 0.447 and weighted average of 4.8%. On average, for every 1% (one percent) increase in Romanians within a typical geography, there is an increase of 1.2% in poverty level among married-couple families.
Romanian Married-Couple Family Poverty
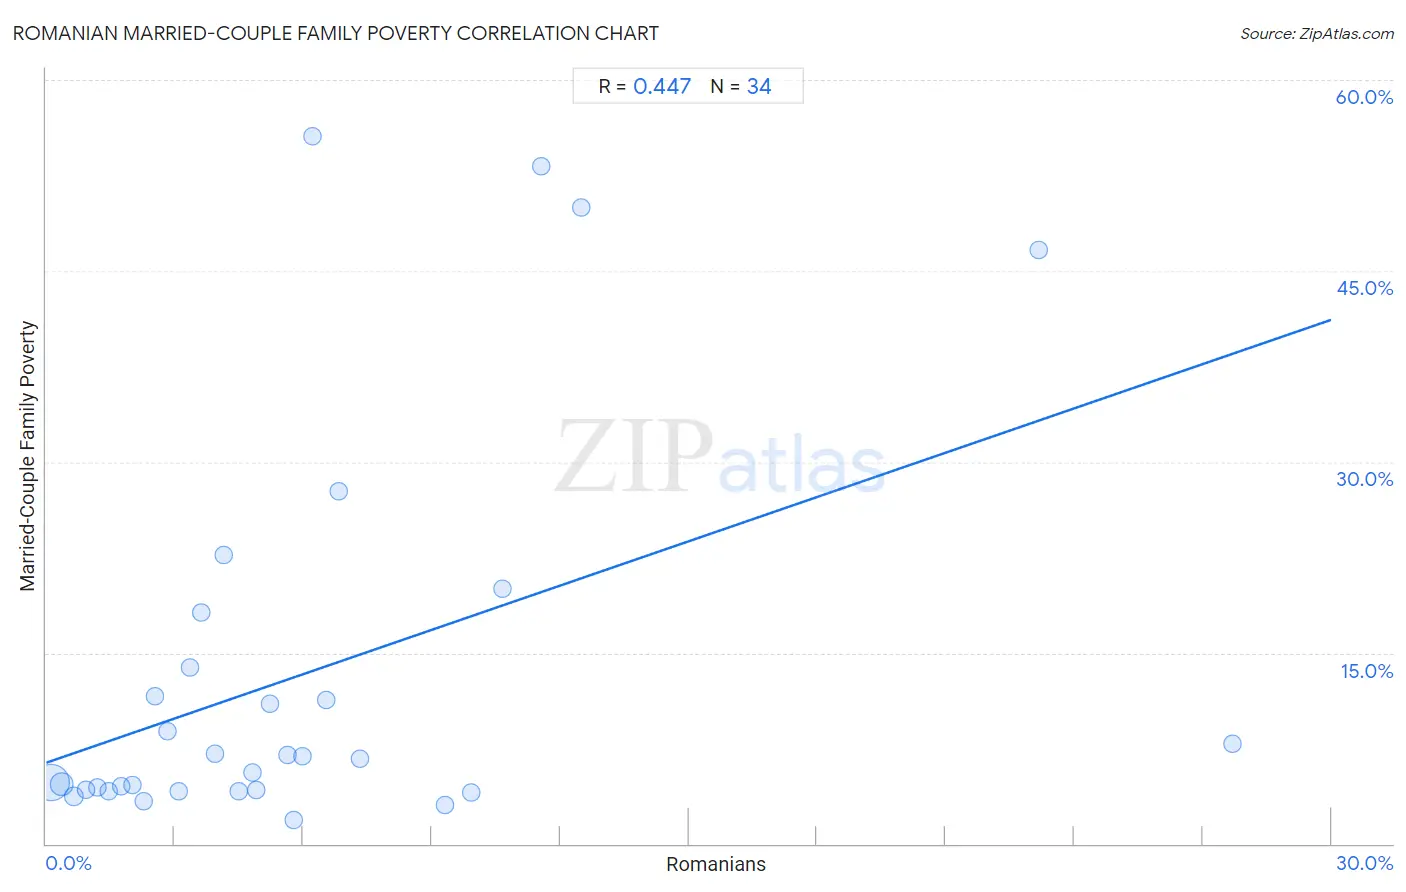
It is essential to understand that the correlation between the percentage of Romanians and poverty level among married-couple families does not imply a direct cause-and-effect relationship. It remains uncertain whether the presence of Romanians influences an upward or downward trend in the level of poverty level among married-couple families within an area, or if Romanians simply ended up residing in those areas with higher or lower levels of poverty level among married-couple families due to other factors.

Demographics Similar to Romanians by Married-Couple Family Poverty

In terms of married-couple family poverty, the demographic groups most similar to Romanians are Immigrants from Bosnia and Herzegovina (4.8%, a difference of 0.020%), Immigrants from Asia (4.8%, a difference of 0.090%), Egyptian (4.8%, a difference of 0.23%), Jordanian (4.8%, a difference of 0.27%), and White/Caucasian (4.8%, a difference of 0.29%).
DemographicsRating | RankMarried-Couple Family Poverty
Kenyans
94.7
/100
|
#117
Exceptional
4.8%
Immigrants from Philippines
94.6
/100
|
#118
Exceptional
4.8%
Immigrants from Eastern Asia
94.0
/100
|
#119
Exceptional
4.8%
Immigrants from Southern Europe
93.4
/100
|
#120
Exceptional
4.8%
Indians (Asian)
93.2
/100
|
#121
Exceptional
4.8%
Whites/Caucasians
93.1
/100
|
#122
Exceptional
4.8%
Jordanians
93.1
/100
|
#123
Exceptional
4.8%
Romanians
92.5
/100
|
#124
Exceptional
4.8%
Immigrants from Bosnia and Herzegovina
92.5
/100
|
#125
Exceptional
4.8%
Immigrants from Asia
92.3
/100
|
#126
Exceptional
4.8%
Egyptians
92.0
/100
|
#127
Exceptional
4.8%
Palestinians
91.2
/100
|
#128
Exceptional
4.9%
Immigrants from Pakistan
90.7
/100
|
#129
Exceptional
4.9%
Soviet Union
90.7
/100
|
#130
Exceptional
4.9%
Immigrants from Eastern Europe
90.5
/100
|
#131
Exceptional
4.9%

Romanian Married-Couple Family Poverty Correlation Summary

MeasurementRomanian DataMarried-Couple Family Poverty Data
Minimum0.10%1.9%
Maximum27.7%55.6%
Range27.6%53.6%
Mean6.0%13.3%
Median4.6%6.8%
Interquartile 25% (IQ1)2.3%4.2%
Interquartile 75% (IQ3)6.8%13.9%
Interquartile Range (IQR)4.6%9.6%
Standard Deviation (Sample)5.9%15.4%
Standard Deviation (Population)5.8%15.1%

Correlation Details

Romanian PercentileSample SizeMarried-Couple Family Poverty
[
0.0%
-
0.5%
]
0.10%
282,874,5614.8%
[
0.0%
-
0.5%
]
0.36%
61,856,3284.7%
[
0.5%
-
1.0%
]
0.66%
15,240,0023.7%
[
0.5%
-
1.0%
]
0.93%
7,274,9514.2%
[
1.0%
-
1.5%
]
1.19%
3,223,9864.4%
[
1.0%
-
1.5%
]
1.46%
1,352,0854.1%
[
1.5%
-
2.0%
]
1.75%
875,5664.5%
[
2.0%
-
2.5%
]
2.02%
544,8354.6%
[
2.0%
-
2.5%
]
2.29%
306,2913.3%
[
2.5%
-
3.0%
]
2.53%
290,02111.6%
[
2.5%
-
3.0%
]
2.83%
199,6338.8%
[
3.0%
-
3.5%
]
3.08%
34,8514.2%
[
3.0%
-
3.5%
]
3.35%
112,76113.9%
[
3.5%
-
4.0%
]
3.62%
81,27518.2%
[
3.5%
-
4.0%
]
3.94%
55,3877.1%
[
4.0%
-
4.5%
]
4.13%
63,65922.7%
[
4.0%
-
4.5%
]
4.48%
5,8244.1%
[
4.5%
-
5.0%
]
4.80%
1,8955.6%
[
4.5%
-
5.0%
]
4.91%
2,7694.2%
[
5.0%
-
5.5%
]
5.22%
2,92911.0%
[
5.5%
-
6.0%
]
5.64%
1,9497.0%
[
5.5%
-
6.0%
]
5.79%
14,2181.9%
[
5.5%
-
6.0%
]
5.97%
4,8396.9%
[
6.0%
-
6.5%
]
6.20%
12955.6%
[
6.5%
-
7.0%
]
6.55%
3,75711.2%
[
6.5%
-
7.0%
]
6.84%
3,85827.7%
[
7.0%
-
7.5%
]
7.32%
1646.7%
[
9.0%
-
9.5%
]
9.30%
1,9903.1%
[
9.5%
-
10.0%
]
9.92%
3,0534.1%
[
10.5%
-
11.0%
]
10.64%
14120.0%
[
11.5%
-
12.0%
]
11.56%
5,50153.2%
[
12.0%
-
12.5%
]
12.50%
1650.0%
[
23.0%
-
23.5%
]
23.18%
96246.6%
[
27.5%
-
28.0%
]
27.70%
1,6687.8%