Immigrants from Bahamas Married-Couple Family Poverty

COMPARE

Immigrants from Bahamas
Race
Ancestry
AfghanAfricanAlaska NativeAlaskan AthabascanAlbanianAleutAlsatianAmericanApacheArabArapahoArgentineanArmenianAssyrian/Chaldean/SyriacAustralianAustrianBahamianBangladeshiBarbadianBasqueBelgianBelizeanBermudanBhutaneseBlackfeetBolivianBrazilianBritishBritish West IndianBulgarianBurmeseCajunCambodianCanadianCape VerdeanCarpatho RusynCelticCentral AmericanCentral American IndianCherokeeCheyenneChickasawChileanChineseChippewaChoctawColombianColvilleComancheCosta RicanCreeCreekCroatianCrowCubanCypriotCzechCzechoslovakianDanishDelawareDominicanDutchDutch West IndianEastern EuropeanEcuadorianEgyptianEnglishEstonianEthiopianEuropeanFijianFilipinoFinnishFrenchFrench American IndianFrench CanadianGermanGerman RussianGhanaianGreekGuamanian/ChamorroGuatemalanGuyaneseHaitianHmongHonduranHopiHoumaHungarianIcelanderIndian (Asian)IndonesianInupiatIranianIraqiIrishIroquoisIsraeliItalianJamaicanJapaneseJordanianKenyanKiowaKoreanLaotianLatvianLebaneseLiberianLithuanianLumbeeLuxembourgerMacedonianMalaysianMalteseMarshalleseMenomineeMexicanMexican American IndianMongolianMoroccanNative HawaiianNavajoNepaleseNew ZealanderNicaraguanNigerianNorthern EuropeanNorwegianOkinawanOsageOttawaPaiutePakistaniPalestinianPanamanianParaguayanPennsylvania GermanPeruvianPimaPolishPortuguesePotawatomiPuebloPuerto RicanPuget Sound SalishRomanianRussianSalvadoranSamoanScandinavianScotch-IrishScottishSeminoleSenegaleseSerbianShoshoneSierra LeoneanSiouxSlavicSlovakSloveneSomaliSouth AfricanSouth AmericanSouth American IndianSoviet UnionSpaniardSpanishSpanish AmericanSpanish American IndianSri LankanSubsaharan AfricanSudaneseSwedishSwissSyrianTaiwaneseThaiTlingit-HaidaTohono O'OdhamTonganTrinidadian and TobagonianTsimshianTurkishU.S. Virgin IslanderUgandanUkrainianUruguayanUteVenezuelanVietnameseWelshWest IndianYakamaYaquiYugoslavianYumanYup'ikZimbabwean
Immigration
NonimmigrantsImmigrantsAfghanistanAfricaAlbaniaArgentinaArmeniaAsiaAustraliaAustriaBahamasBangladeshBarbadosBelarusBelgiumBelizeBoliviaBosnia and HerzegovinaBrazilBulgariaBurma/MyanmarCabo VerdeCambodiaCameroonCanadaCaribbeanCentral AmericaChileChinaColombiaCongoCosta RicaCroatiaCubaCzechoslovakiaDenmarkDominicaDominican RepublicEastern AfricaEastern AsiaEastern EuropeEcuadorEgyptEl SalvadorEnglandEritreaEthiopiaEuropeFijiFranceGermanyGhanaGreeceGrenadaGuatemalaGuyanaHaitiHondurasHong KongHungaryIndiaIndonesiaIranIraqIrelandIsraelItalyJamaicaJapanJordanKazakhstanKenyaKoreaKuwaitLaosLatin AmericaLatviaLebanonLiberiaLithuaniaMalaysiaMexicoMicronesiaMiddle AfricaMoldovaMoroccoNepalNetherlandsNicaraguaNigeriaNorth AmericaNorth MacedoniaNorthern AfricaNorthern EuropeNorwayOceaniaPakistanPanamaPeruPhilippinesPolandPortugalRomaniaRussiaSaudi ArabiaScotlandSenegalSerbiaSierra LeoneSingaporeSomaliaSouth AfricaSouth AmericaSouth Central AsiaSouth Eastern AsiaSouthern EuropeSpainSri LankaSt. Vincent and the GrenadinesSudanSwedenSwitzerlandSyriaTaiwanThailandTrinidad and TobagoTurkeyUgandaUkraineUruguayUzbekistanVenezuelaVietnamWest IndiesWestern AfricaWestern AsiaWestern EuropeYemenZaireZimbabweAzores
Select to Compare
Race
Ancestry
AfghanAfricanAlaska NativeAlaskan AthabascanAlbanianAleutAlsatianAmericanApacheArabArapahoArgentineanArmenianAssyrian/Chaldean/SyriacAustralianAustrianBahamianBangladeshiBarbadianBasqueBelgianBelizeanBermudanBhutaneseBlackfeetBolivianBrazilianBritishBritish West IndianBulgarianBurmeseCajunCambodianCanadianCape VerdeanCarpatho RusynCelticCentral AmericanCentral American IndianCherokeeCheyenneChickasawChileanChineseChippewaChoctawColombianColvilleComancheCosta RicanCreeCreekCroatianCrowCubanCypriotCzechCzechoslovakianDanishDelawareDominicanDutchDutch West IndianEastern EuropeanEcuadorianEgyptianEnglishEstonianEthiopianEuropeanFijianFilipinoFinnishFrenchFrench American IndianFrench CanadianGermanGerman RussianGhanaianGreekGuamanian/ChamorroGuatemalanGuyaneseHaitianHmongHonduranHopiHoumaHungarianIcelanderIndian (Asian)IndonesianInupiatIranianIraqiIrishIroquoisIsraeliItalianJamaicanJapaneseJordanianKenyanKiowaKoreanLaotianLatvianLebaneseLiberianLithuanianLumbeeLuxembourgerMacedonianMalaysianMalteseMarshalleseMenomineeMexicanMexican American IndianMongolianMoroccanNative HawaiianNavajoNepaleseNew ZealanderNicaraguanNigerianNorthern EuropeanNorwegianOkinawanOsageOttawaPaiutePakistaniPalestinianPanamanianParaguayanPennsylvania GermanPeruvianPimaPolishPortuguesePotawatomiPuebloPuerto RicanPuget Sound SalishRomanianRussianSalvadoranSamoanScandinavianScotch-IrishScottishSeminoleSenegaleseSerbianShoshoneSierra LeoneanSiouxSlavicSlovakSloveneSomaliSouth AfricanSouth AmericanSouth American IndianSoviet UnionSpaniardSpanishSpanish AmericanSpanish American IndianSri LankanSubsaharan AfricanSudaneseSwedishSwissSyrianTaiwaneseThaiTlingit-HaidaTohono O'OdhamTonganTrinidadian and TobagonianTsimshianTurkishU.S. Virgin IslanderUgandanUkrainianUruguayanUteVenezuelanVietnameseWelshWest IndianYakamaYaquiYugoslavianYumanYup'ikZimbabwean
Immigration
NonimmigrantsImmigrantsAfghanistanAfricaAlbaniaArgentinaArmeniaAsiaAustraliaAustriaBangladeshBarbadosBelarusBelgiumBelizeBoliviaBosnia and HerzegovinaBrazilBulgariaBurma/MyanmarCabo VerdeCambodiaCameroonCanadaCaribbeanCentral AmericaChileChinaColombiaCongoCosta RicaCroatiaCubaCzechoslovakiaDenmarkDominicaDominican RepublicEastern AfricaEastern AsiaEastern EuropeEcuadorEgyptEl SalvadorEnglandEritreaEthiopiaEuropeFijiFranceGermanyGhanaGreeceGrenadaGuatemalaGuyanaHaitiHondurasHong KongHungaryIndiaIndonesiaIranIraqIrelandIsraelItalyJamaicaJapanJordanKazakhstanKenyaKoreaKuwaitLaosLatin AmericaLatviaLebanonLiberiaLithuaniaMalaysiaMexicoMicronesiaMiddle AfricaMoldovaMoroccoNepalNetherlandsNicaraguaNigeriaNorth AmericaNorth MacedoniaNorthern AfricaNorthern EuropeNorwayOceaniaPakistanPanamaPeruPhilippinesPolandPortugalRomaniaRussiaSaudi ArabiaScotlandSenegalSerbiaSierra LeoneSingaporeSomaliaSouth AfricaSouth AmericaSouth Central AsiaSouth Eastern AsiaSouthern EuropeSpainSri LankaSt. Vincent and the GrenadinesSudanSwedenSwitzerlandSyriaTaiwanThailandTrinidad and TobagoTurkeyUgandaUkraineUruguayUzbekistanVenezuelaVietnamWest IndiesWestern AfricaWestern AsiaWestern EuropeYemenZaireZimbabweAzores
Married-Couple Family Poverty
Income
Poverty
Unemployment
Labor Participation
Family Structure
Vehicle Availability
Education Level
Disability

Immigrants from Bahamas Married-Couple Family Poverty
Tragic

6.2%
POVERTY | MARRIED-COUPLE FAMILIES
0.1/ 100
METRIC RATING
271st/ 347
METRIC RANK

Immigrants from Bahamas Married-Couple Family Poverty Correlation Chart

The statistical analysis conducted on geographies consisting of 104,426,116 people shows a poor positive correlation between the proportion of Immigrants from Bahamas and poverty level among married-couple families in the United States with a correlation coefficient (R) of 0.111 and weighted average of 6.2%. On average, for every 1% (one percent) increase in Immigrants from Bahamas within a typical geography, there is an increase of 0.30% in poverty level among married-couple families.
Immigrants from Bahamas Married-Couple Family Poverty
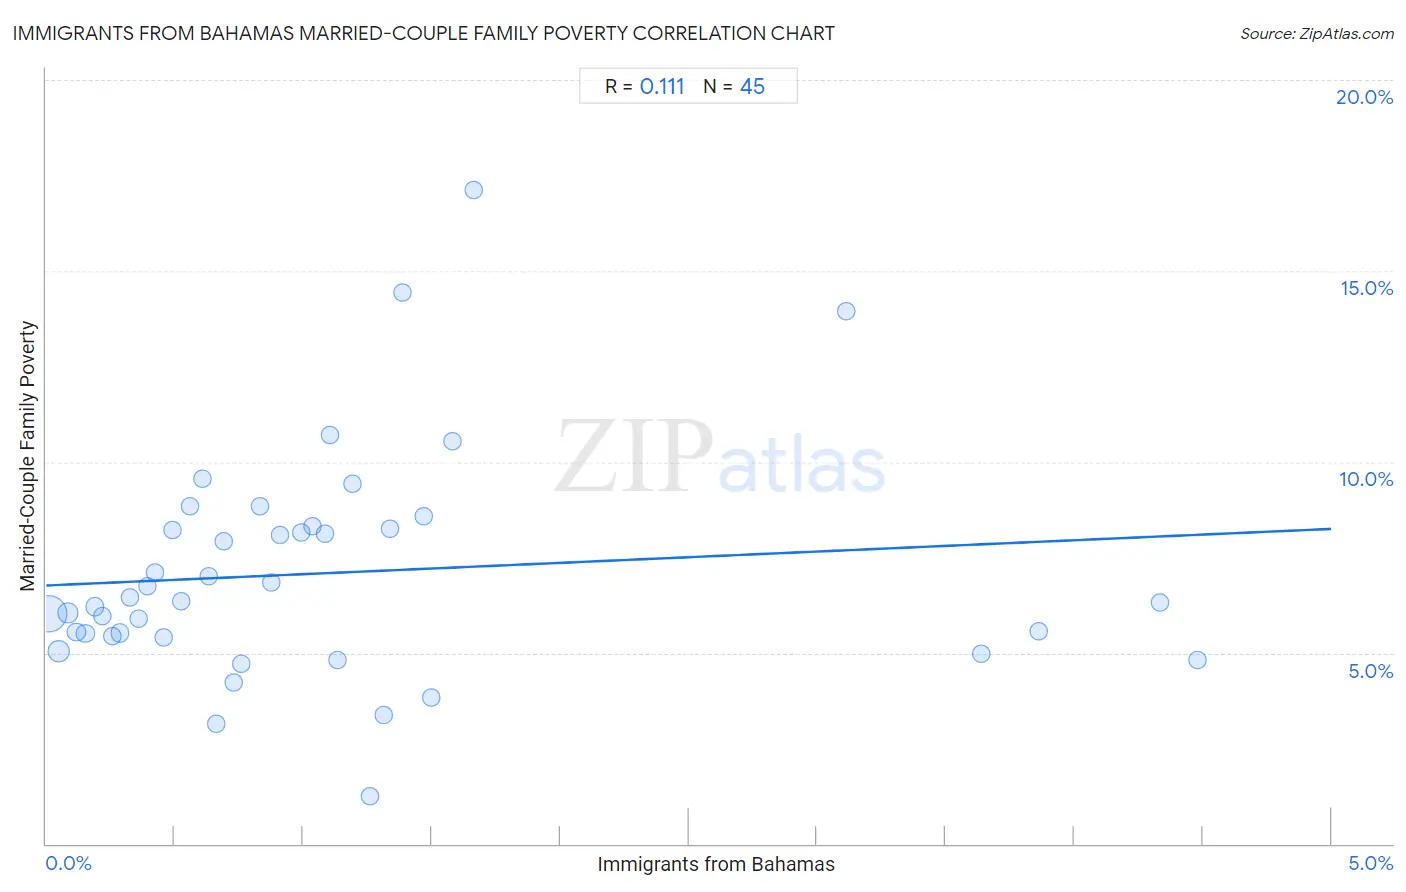
It is essential to understand that the correlation between the percentage of Immigrants from Bahamas and poverty level among married-couple families does not imply a direct cause-and-effect relationship. It remains uncertain whether the presence of Immigrants from Bahamas influences an upward or downward trend in the level of poverty level among married-couple families within an area, or if Immigrants from Bahamas simply ended up residing in those areas with higher or lower levels of poverty level among married-couple families due to other factors.

Demographics Similar to Immigrants from Bahamas by Married-Couple Family Poverty

In terms of married-couple family poverty, the demographic groups most similar to Immigrants from Bahamas are Trinidadian and Tobagonian (6.2%, a difference of 0.030%), Immigrants from Jamaica (6.2%, a difference of 0.22%), Immigrants from West Indies (6.2%, a difference of 0.26%), Alaska Native (6.2%, a difference of 0.43%), and Colville (6.3%, a difference of 0.81%).
DemographicsRating | RankMarried-Couple Family Poverty
Immigrants from Congo
0.2
/100
|
#264
Tragic
6.1%
Blackfeet
0.2
/100
|
#265
Tragic
6.2%
Creek
0.2
/100
|
#266
Tragic
6.2%
Spanish Americans
0.2
/100
|
#267
Tragic
6.2%
Alaska Natives
0.2
/100
|
#268
Tragic
6.2%
Immigrants from West Indies
0.1
/100
|
#269
Tragic
6.2%
Immigrants from Jamaica
0.1
/100
|
#270
Tragic
6.2%
Immigrants from Bahamas
0.1
/100
|
#271
Tragic
6.2%
Trinidadians and Tobagonians
0.1
/100
|
#272
Tragic
6.2%
Colville
0.1
/100
|
#273
Tragic
6.3%
Barbadians
0.1
/100
|
#274
Tragic
6.3%
Choctaw
0.1
/100
|
#275
Tragic
6.3%
Yaqui
0.1
/100
|
#276
Tragic
6.3%
Indonesians
0.1
/100
|
#277
Tragic
6.3%
Immigrants from Trinidad and Tobago
0.1
/100
|
#278
Tragic
6.4%

Immigrants from Bahamas Married-Couple Family Poverty Correlation Summary

MeasurementImmigrants from Bahamas DataMarried-Couple Family Poverty Data
Minimum0.012%1.2%
Maximum4.5%17.1%
Range4.5%15.9%
Mean1.1%7.1%
Median0.76%6.4%
Interquartile 25% (IQ1)0.38%5.4%
Interquartile 75% (IQ3)1.3%8.3%
Interquartile Range (IQR)0.95%2.9%
Standard Deviation (Sample)1.1%3.0%
Standard Deviation (Population)1.1%2.9%

Correlation Details

Immigrants from Bahamas PercentileSample SizeMarried-Couple Family Poverty
[
0.0%
-
0.5%
]
0.012%
70,154,0096.0%
[
0.0%
-
0.5%
]
0.049%
14,047,2615.1%
[
0.0%
-
0.5%
]
0.085%
6,081,9716.0%
[
0.0%
-
0.5%
]
0.12%
3,287,6505.5%
[
0.0%
-
0.5%
]
0.15%
2,334,4885.5%
[
0.0%
-
0.5%
]
0.19%
1,373,6686.2%
[
0.0%
-
0.5%
]
0.22%
1,215,4645.9%
[
0.0%
-
0.5%
]
0.26%
1,248,7915.4%
[
0.0%
-
0.5%
]
0.29%
862,2245.5%
[
0.0%
-
0.5%
]
0.33%
495,3866.4%
[
0.0%
-
0.5%
]
0.36%
705,5515.9%
[
0.0%
-
0.5%
]
0.39%
310,4886.7%
[
0.0%
-
0.5%
]
0.42%
96,8897.1%
[
0.0%
-
0.5%
]
0.46%
385,2035.4%
[
0.0%
-
0.5%
]
0.49%
135,2888.2%
[
0.5%
-
1.0%
]
0.53%
197,5366.4%
[
0.5%
-
1.0%
]
0.56%
95,6458.8%
[
0.5%
-
1.0%
]
0.61%
123,5729.6%
[
0.5%
-
1.0%
]
0.63%
170,2237.0%
[
0.5%
-
1.0%
]
0.66%
17,4763.1%
[
0.5%
-
1.0%
]
0.69%
92,3077.9%
[
0.5%
-
1.0%
]
0.73%
122,9334.2%
[
0.5%
-
1.0%
]
0.76%
65,2024.7%
[
0.5%
-
1.0%
]
0.83%
113,3398.8%
[
0.5%
-
1.0%
]
0.87%
47,8386.9%
[
0.5%
-
1.0%
]
0.91%
35,8098.1%
[
0.5%
-
1.0%
]
0.99%
62,2328.2%
[
1.0%
-
1.5%
]
1.03%
104,8248.3%
[
1.0%
-
1.5%
]
1.08%
159,9448.1%
[
1.0%
-
1.5%
]
1.10%
33,96610.7%
[
1.0%
-
1.5%
]
1.13%
2,3814.8%
[
1.0%
-
1.5%
]
1.19%
47,4709.4%
[
1.0%
-
1.5%
]
1.26%
12,0801.2%
[
1.0%
-
1.5%
]
1.31%
5,1743.4%
[
1.0%
-
1.5%
]
1.34%
45,3128.3%
[
1.0%
-
1.5%
]
1.38%
1,01114.4%
[
1.0%
-
1.5%
]
1.47%
10,2088.6%
[
1.0%
-
1.5%
]
1.50%
14,5583.8%
[
1.5%
-
2.0%
]
1.58%
43,09910.5%
[
1.5%
-
2.0%
]
1.66%
8,24417.1%
[
3.0%
-
3.5%
]
3.11%
7,38513.9%
[
3.5%
-
4.0%
]
3.64%
9,6775.0%
[
3.5%
-
4.0%
]
3.86%
18,4875.6%
[
4.0%
-
4.5%
]
4.34%
8,1186.3%
[
4.0%
-
4.5%
]
4.48%
15,7354.8%