Paraguayan Married-Couple Family Poverty
COMPARE
Paraguayan
Select to Compare
Married-Couple Family Poverty
Paraguayan Married-Couple Family Poverty
5.1%
POVERTY | MARRIED-COUPLE FAMILIES
61.5/ 100
METRIC RATING
166th/ 347
METRIC RANK
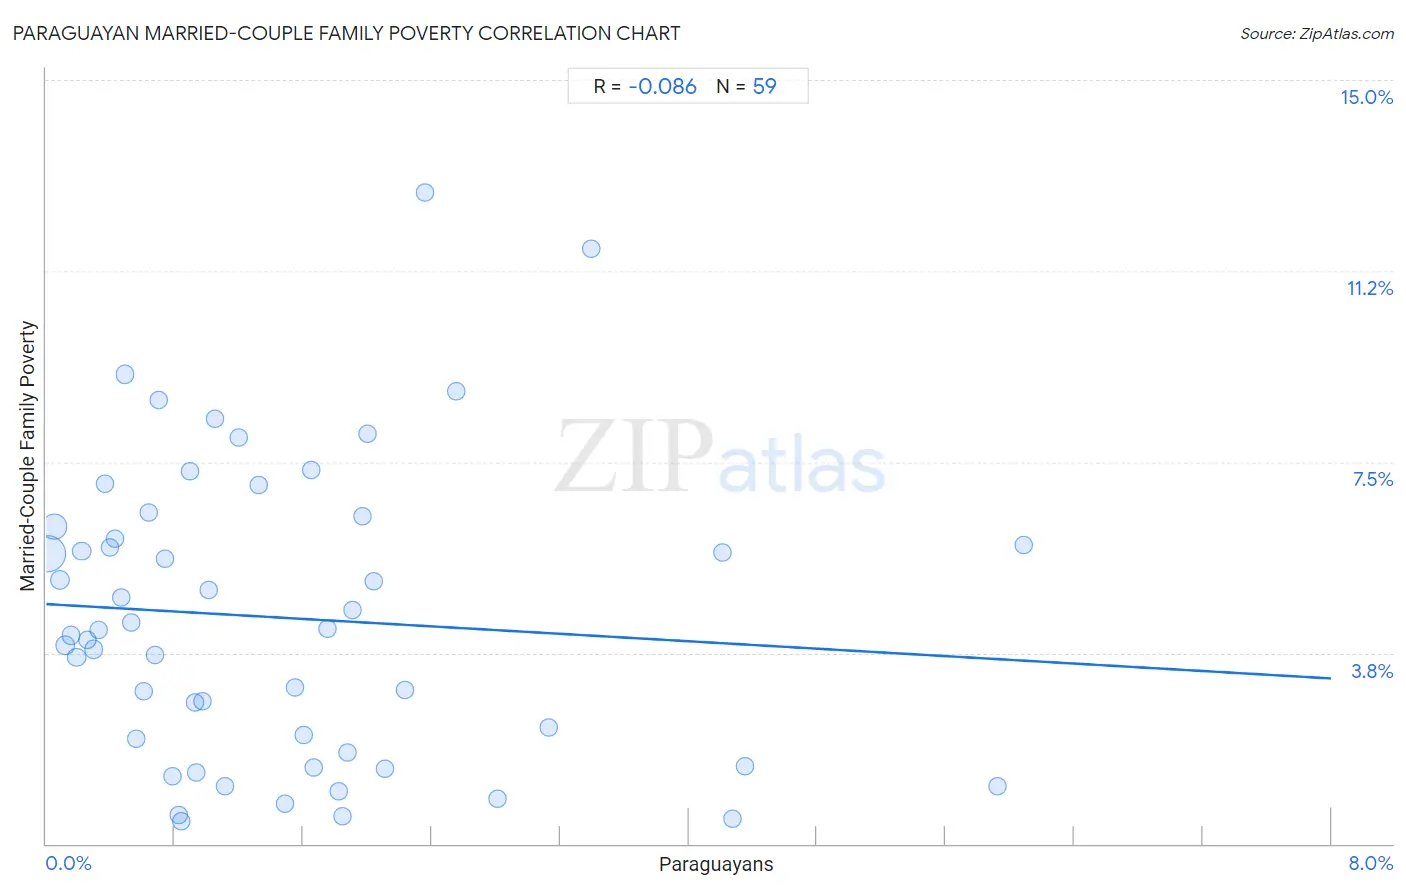
Paraguayan Married-Couple Family Poverty Correlation Chart
The statistical analysis conducted on geographies consisting of 94,718,815 people shows a slight negative correlation between the proportion of Paraguayans and poverty level among married-couple families in the United States with a correlation coefficient (R) of -0.086 and weighted average of 5.1%. On average, for every 1% (one percent) increase in Paraguayans within a typical geography, there is a decrease of 0.18% in poverty level among married-couple families.
It is essential to understand that the correlation between the percentage of Paraguayans and poverty level among married-couple families does not imply a direct cause-and-effect relationship. It remains uncertain whether the presence of Paraguayans influences an upward or downward trend in the level of poverty level among married-couple families within an area, or if Paraguayans simply ended up residing in those areas with higher or lower levels of poverty level among married-couple families due to other factors.
Demographics Similar to Paraguayans by Married-Couple Family Poverty
In terms of married-couple family poverty, the demographic groups most similar to Paraguayans are Costa Rican (5.1%, a difference of 0.0%), Immigrants from Malaysia (5.1%, a difference of 0.090%), Hawaiian (5.1%, a difference of 0.10%), Sierra Leonean (5.1%, a difference of 0.34%), and Immigrants from Jordan (5.1%, a difference of 0.65%).
| Demographics | Rating | Rank | Married-Couple Family Poverty |
| Immigrants from Saudi Arabia | 70.3 /100 | #159 | Good 5.1% |
| Pennsylvania Germans | 68.5 /100 | #160 | Good 5.1% |
| Ethiopians | 68.1 /100 | #161 | Good 5.1% |
| Immigrants from Jordan | 66.5 /100 | #162 | Good 5.1% |
| Sierra Leoneans | 64.1 /100 | #163 | Good 5.1% |
| Hawaiians | 62.3 /100 | #164 | Good 5.1% |
| Immigrants from Malaysia | 62.2 /100 | #165 | Good 5.1% |
| Paraguayans | 61.5 /100 | #166 | Good 5.1% |
| Costa Ricans | 61.5 /100 | #167 | Good 5.1% |
| Immigrants from Uganda | 54.9 /100 | #168 | Average 5.2% |
| Ottawa | 54.5 /100 | #169 | Average 5.2% |
| Immigrants from Argentina | 54.4 /100 | #170 | Average 5.2% |
| Bermudans | 52.9 /100 | #171 | Average 5.2% |
| Immigrants from Northern Africa | 51.3 /100 | #172 | Average 5.2% |
| Alsatians | 51.2 /100 | #173 | Average 5.2% |
Paraguayan Married-Couple Family Poverty Correlation Summary
| Measurement | Paraguayan Data | Married-Couple Family Poverty Data |
| Minimum | 0.0097% | 0.45% |
| Maximum | 6.1% | 12.8% |
| Range | 6.1% | 12.3% |
| Mean | 1.5% | 4.4% |
| Median | 1.0% | 4.2% |
| Interquartile 25% (IQ1) | 0.49% | 1.8% |
| Interquartile 75% (IQ3) | 2.0% | 6.2% |
| Interquartile Range (IQR) | 1.5% | 4.4% |
| Standard Deviation (Sample) | 1.4% | 2.9% |
| Standard Deviation (Population) | 1.4% | 2.9% |
Correlation Details
| Paraguayan Percentile | Sample Size | Married-Couple Family Poverty |
[ 0.0% - 0.5% ] 0.0097% | 59,466,563 | 5.7% |
[ 0.0% - 0.5% ] 0.048% | 21,198,336 | 6.2% |
[ 0.0% - 0.5% ] 0.086% | 4,454,001 | 5.2% |
[ 0.0% - 0.5% ] 0.12% | 2,161,077 | 3.9% |
[ 0.0% - 0.5% ] 0.16% | 1,472,725 | 4.1% |
[ 0.0% - 0.5% ] 0.19% | 1,275,240 | 3.7% |
[ 0.0% - 0.5% ] 0.22% | 1,033,074 | 5.8% |
[ 0.0% - 0.5% ] 0.26% | 879,875 | 4.0% |
[ 0.0% - 0.5% ] 0.30% | 348,965 | 3.8% |
[ 0.0% - 0.5% ] 0.33% | 487,871 | 4.2% |
[ 0.0% - 0.5% ] 0.37% | 113,195 | 7.1% |
[ 0.0% - 0.5% ] 0.39% | 407,514 | 5.8% |
[ 0.0% - 0.5% ] 0.43% | 220,665 | 6.0% |
[ 0.0% - 0.5% ] 0.47% | 98,814 | 4.8% |
[ 0.0% - 0.5% ] 0.49% | 191,328 | 9.2% |
[ 0.5% - 1.0% ] 0.53% | 49,954 | 4.3% |
[ 0.5% - 1.0% ] 0.56% | 25,680 | 2.1% |
[ 0.5% - 1.0% ] 0.61% | 5,454 | 3.0% |
[ 0.5% - 1.0% ] 0.64% | 27,509 | 6.5% |
[ 0.5% - 1.0% ] 0.67% | 142,413 | 3.7% |
[ 0.5% - 1.0% ] 0.70% | 44,812 | 8.7% |
[ 0.5% - 1.0% ] 0.74% | 103,406 | 5.6% |
[ 0.5% - 1.0% ] 0.79% | 23,838 | 1.3% |
[ 0.5% - 1.0% ] 0.83% | 16,478 | 0.55% |
[ 0.5% - 1.0% ] 0.84% | 19,482 | 0.45% |
[ 0.5% - 1.0% ] 0.89% | 30,287 | 7.3% |
[ 0.5% - 1.0% ] 0.93% | 48,905 | 2.8% |
[ 0.5% - 1.0% ] 0.94% | 44,123 | 1.4% |
[ 0.5% - 1.0% ] 0.97% | 42,498 | 2.8% |
[ 1.0% - 1.5% ] 1.01% | 20,482 | 5.0% |
[ 1.0% - 1.5% ] 1.05% | 42,585 | 8.3% |
[ 1.0% - 1.5% ] 1.11% | 24,656 | 1.1% |
[ 1.0% - 1.5% ] 1.20% | 5,504 | 8.0% |
[ 1.0% - 1.5% ] 1.32% | 32,720 | 7.0% |
[ 1.0% - 1.5% ] 1.48% | 2,630 | 0.79% |
[ 1.5% - 2.0% ] 1.55% | 11,518 | 3.1% |
[ 1.5% - 2.0% ] 1.61% | 5,725 | 2.1% |
[ 1.5% - 2.0% ] 1.65% | 5,632 | 7.3% |
[ 1.5% - 2.0% ] 1.67% | 1,739 | 1.5% |
[ 1.5% - 2.0% ] 1.75% | 285 | 4.2% |
[ 1.5% - 2.0% ] 1.82% | 3,399 | 1.0% |
[ 1.5% - 2.0% ] 1.85% | 9,581 | 0.53% |
[ 1.5% - 2.0% ] 1.87% | 800 | 1.8% |
[ 1.5% - 2.0% ] 1.91% | 23,734 | 4.6% |
[ 1.5% - 2.0% ] 1.97% | 712 | 6.4% |
[ 2.0% - 2.5% ] 2.00% | 500 | 8.1% |
[ 2.0% - 2.5% ] 2.04% | 28,413 | 5.1% |
[ 2.0% - 2.5% ] 2.11% | 1,516 | 1.5% |
[ 2.0% - 2.5% ] 2.23% | 7,573 | 3.0% |
[ 2.0% - 2.5% ] 2.36% | 12,581 | 12.8% |
[ 2.5% - 3.0% ] 2.55% | 392 | 8.9% |
[ 2.5% - 3.0% ] 2.81% | 5,867 | 0.88% |
[ 3.0% - 3.5% ] 3.12% | 160 | 2.3% |
[ 3.0% - 3.5% ] 3.39% | 1,385 | 11.7% |
[ 4.0% - 4.5% ] 4.21% | 285 | 5.7% |
[ 4.0% - 4.5% ] 4.27% | 7,888 | 0.50% |
[ 4.0% - 4.5% ] 4.35% | 8,822 | 1.5% |
[ 5.5% - 6.0% ] 5.92% | 1,047 | 1.1% |
[ 6.0% - 6.5% ] 6.08% | 16,602 | 5.9% |