Kenyan Receiving Food Stamps
COMPARE
Kenyan
Select to Compare
Receiving Food Stamps
Kenyan Receiving Food Stamps
11.6%
PUBLIC INCOME | FOOD STAMPS
60.2/ 100
METRIC RATING
167th/ 347
METRIC RANK
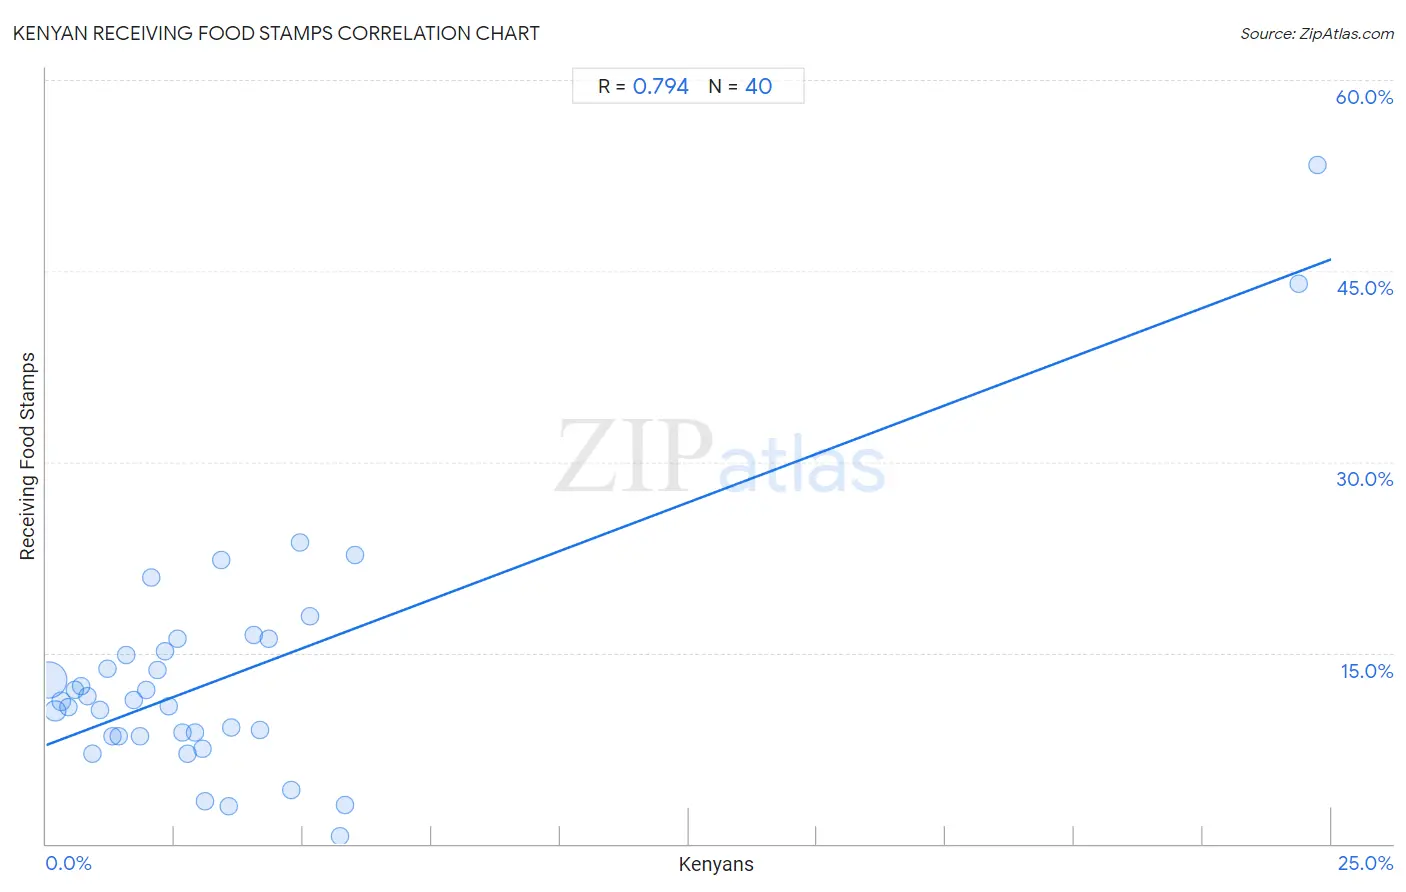
Kenyan Receiving Food Stamps Correlation Chart
The statistical analysis conducted on geographies consisting of 168,088,158 people shows a strong positive correlation between the proportion of Kenyans and percentage of population receiving government assistance and/or food stamps in the United States with a correlation coefficient (R) of 0.794 and weighted average of 11.6%. On average, for every 1% (one percent) increase in Kenyans within a typical geography, there is an increase of 1.5% in percentage of population receiving government assistance and/or food stamps.
It is essential to understand that the correlation between the percentage of Kenyans and percentage of population receiving government assistance and/or food stamps does not imply a direct cause-and-effect relationship. It remains uncertain whether the presence of Kenyans influences an upward or downward trend in the level of percentage of population receiving government assistance and/or food stamps within an area, or if Kenyans simply ended up residing in those areas with higher or lower levels of percentage of population receiving government assistance and/or food stamps due to other factors.
Demographics Similar to Kenyans by Receiving Food Stamps
In terms of receiving food stamps, the demographic groups most similar to Kenyans are Tlingit-Haida (11.6%, a difference of 0.16%), Immigrants from Eastern Africa (11.6%, a difference of 0.28%), Costa Rican (11.6%, a difference of 0.35%), Immigrants from Belarus (11.5%, a difference of 0.38%), and Immigrants from Western Asia (11.6%, a difference of 0.56%).
| Demographics | Rating | Rank | Receiving Food Stamps |
| French Canadians | 69.5 /100 | #160 | Good 11.4% |
| Pennsylvania Germans | 68.4 /100 | #161 | Good 11.4% |
| Alsatians | 68.0 /100 | #162 | Good 11.4% |
| Immigrants from Southern Europe | 65.8 /100 | #163 | Good 11.5% |
| Immigrants from Chile | 65.0 /100 | #164 | Good 11.5% |
| Arabs | 64.7 /100 | #165 | Good 11.5% |
| Immigrants from Belarus | 62.8 /100 | #166 | Good 11.5% |
| Kenyans | 60.2 /100 | #167 | Good 11.6% |
| Tlingit-Haida | 59.1 /100 | #168 | Average 11.6% |
| Immigrants from Eastern Africa | 58.3 /100 | #169 | Average 11.6% |
| Costa Ricans | 57.9 /100 | #170 | Average 11.6% |
| Immigrants from Western Asia | 56.4 /100 | #171 | Average 11.6% |
| Guamanians/Chamorros | 54.2 /100 | #172 | Average 11.7% |
| Immigrants from Syria | 53.4 /100 | #173 | Average 11.7% |
| Immigrants from Eritrea | 50.0 /100 | #174 | Average 11.7% |
Kenyan Receiving Food Stamps Correlation Summary
| Measurement | Kenyan Data | Receiving Food Stamps Data |
| Minimum | 0.039% | 0.60% |
| Maximum | 24.7% | 53.3% |
| Range | 24.7% | 52.7% |
| Mean | 3.7% | 13.3% |
| Median | 2.5% | 11.2% |
| Interquartile 25% (IQ1) | 1.2% | 8.5% |
| Interquartile 75% (IQ3) | 4.1% | 15.6% |
| Interquartile Range (IQR) | 2.8% | 7.2% |
| Standard Deviation (Sample) | 5.1% | 9.9% |
| Standard Deviation (Population) | 5.1% | 9.7% |
Correlation Details
| Kenyan Percentile | Sample Size | Receiving Food Stamps |
[ 0.0% - 0.5% ] 0.039% | 126,491,543 | 12.9% |
[ 0.0% - 0.5% ] 0.17% | 21,794,516 | 10.4% |
[ 0.0% - 0.5% ] 0.30% | 8,410,539 | 11.2% |
[ 0.0% - 0.5% ] 0.43% | 4,706,528 | 10.8% |
[ 0.5% - 1.0% ] 0.55% | 2,134,666 | 12.1% |
[ 0.5% - 1.0% ] 0.67% | 1,153,821 | 12.4% |
[ 0.5% - 1.0% ] 0.80% | 963,114 | 11.6% |
[ 0.5% - 1.0% ] 0.90% | 439,069 | 7.1% |
[ 1.0% - 1.5% ] 1.05% | 428,842 | 10.6% |
[ 1.0% - 1.5% ] 1.19% | 327,740 | 13.8% |
[ 1.0% - 1.5% ] 1.30% | 231,594 | 8.5% |
[ 1.0% - 1.5% ] 1.41% | 210,333 | 8.4% |
[ 1.5% - 2.0% ] 1.56% | 192,252 | 14.9% |
[ 1.5% - 2.0% ] 1.69% | 100,838 | 11.3% |
[ 1.5% - 2.0% ] 1.82% | 29,829 | 8.5% |
[ 1.5% - 2.0% ] 1.95% | 131,069 | 12.1% |
[ 2.0% - 2.5% ] 2.05% | 69,612 | 21.0% |
[ 2.0% - 2.5% ] 2.17% | 85,059 | 13.7% |
[ 2.0% - 2.5% ] 2.31% | 63,729 | 15.2% |
[ 2.0% - 2.5% ] 2.38% | 6,863 | 10.8% |
[ 2.5% - 3.0% ] 2.56% | 586 | 16.1% |
[ 2.5% - 3.0% ] 2.65% | 32,186 | 8.8% |
[ 2.5% - 3.0% ] 2.75% | 8,230 | 7.1% |
[ 2.5% - 3.0% ] 2.90% | 3,966 | 8.7% |
[ 3.0% - 3.5% ] 3.03% | 14,127 | 7.4% |
[ 3.0% - 3.5% ] 3.10% | 8,389 | 3.3% |
[ 3.0% - 3.5% ] 3.40% | 2,764 | 22.3% |
[ 3.5% - 4.0% ] 3.56% | 2,473 | 2.9% |
[ 3.5% - 4.0% ] 3.59% | 3,785 | 9.1% |
[ 4.0% - 4.5% ] 4.03% | 4,488 | 16.4% |
[ 4.0% - 4.5% ] 4.15% | 9,822 | 8.9% |
[ 4.0% - 4.5% ] 4.32% | 2,474 | 16.1% |
[ 4.5% - 5.0% ] 4.77% | 9,332 | 4.2% |
[ 4.5% - 5.0% ] 4.94% | 324 | 23.7% |
[ 5.0% - 5.5% ] 5.13% | 4,995 | 17.9% |
[ 5.5% - 6.0% ] 5.71% | 4,728 | 0.60% |
[ 5.5% - 6.0% ] 5.82% | 3,214 | 3.0% |
[ 6.0% - 6.5% ] 6.01% | 183 | 22.7% |
[ 24.0% - 24.5% ] 24.37% | 439 | 44.0% |
[ 24.5% - 25.0% ] 24.74% | 97 | 53.3% |