Immigrants from Africa Married-Couple Family Poverty
COMPARE
Immigrants from Africa
Select to Compare
Married-Couple Family Poverty
Immigrants from Africa Married-Couple Family Poverty
5.5%
POVERTY | MARRIED-COUPLE FAMILIES
17.6/ 100
METRIC RATING
207th/ 347
METRIC RANK
Immigrants from Africa Married-Couple Family Poverty Correlation Chart
The statistical analysis conducted on geographies consisting of 463,705,705 people shows a strong positive correlation between the proportion of Immigrants from Africa and poverty level among married-couple families in the United States with a correlation coefficient (R) of 0.713 and weighted average of 5.5%. On average, for every 1% (one percent) increase in Immigrants from Africa within a typical geography, there is an increase of 0.57% in poverty level among married-couple families.
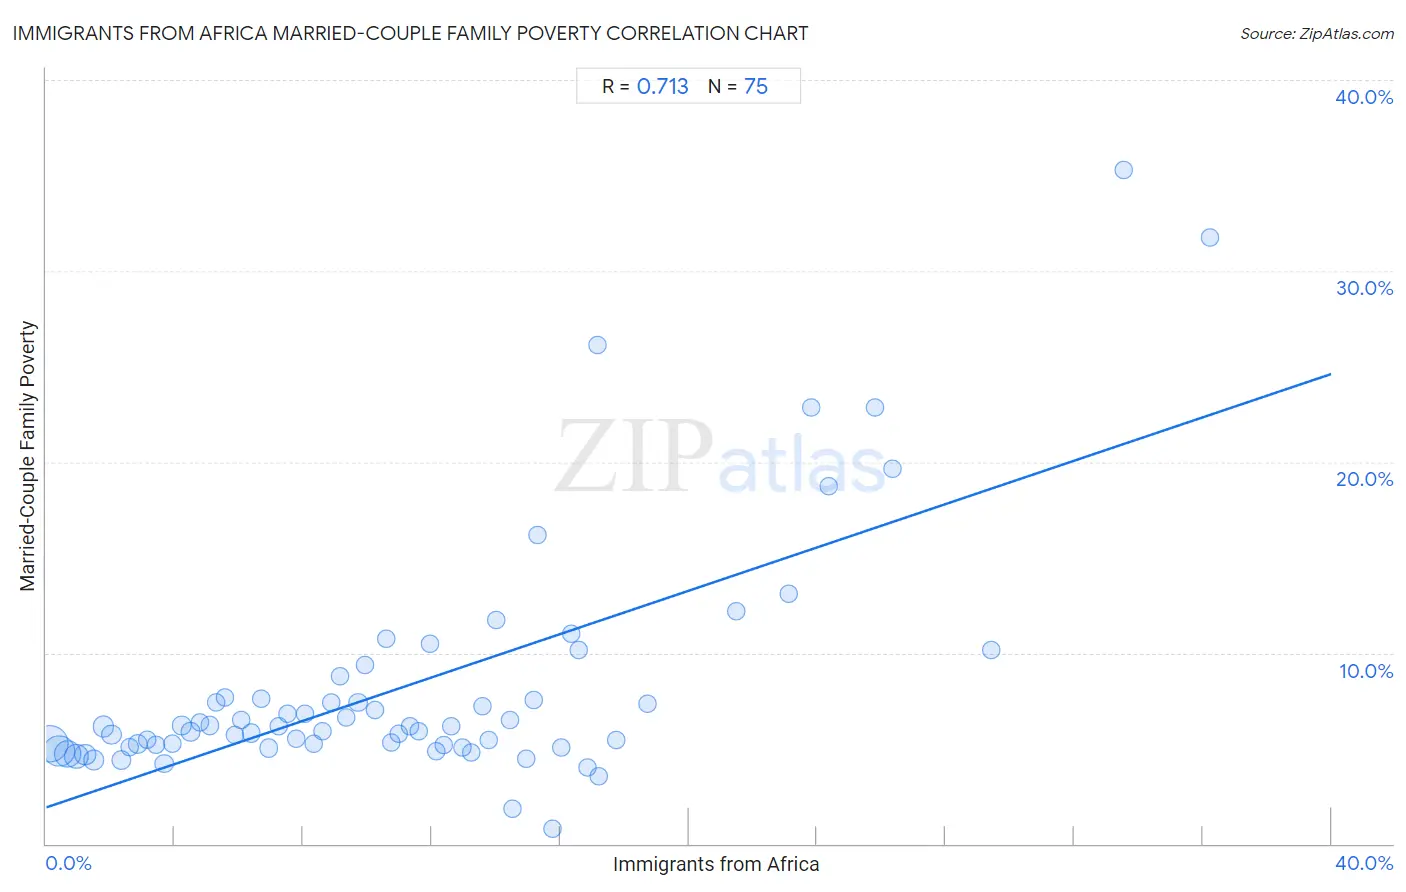
It is essential to understand that the correlation between the percentage of Immigrants from Africa and poverty level among married-couple families does not imply a direct cause-and-effect relationship. It remains uncertain whether the presence of Immigrants from Africa influences an upward or downward trend in the level of poverty level among married-couple families within an area, or if Immigrants from Africa simply ended up residing in those areas with higher or lower levels of poverty level among married-couple families due to other factors.
Demographics Similar to Immigrants from Africa by Married-Couple Family Poverty
In terms of married-couple family poverty, the demographic groups most similar to Immigrants from Africa are Osage (5.4%, a difference of 0.14%), Chippewa (5.4%, a difference of 0.24%), French American Indian (5.5%, a difference of 0.32%), Immigrants from Costa Rica (5.4%, a difference of 0.33%), and Immigrants from Syria (5.5%, a difference of 0.46%).
| Demographics | Rating | Rank | Married-Couple Family Poverty |
| Immigrants from Morocco | 24.3 /100 | #200 | Fair 5.4% |
| Lebanese | 24.1 /100 | #201 | Fair 5.4% |
| Immigrants from Middle Africa | 23.8 /100 | #202 | Fair 5.4% |
| Immigrants from Peru | 21.8 /100 | #203 | Fair 5.4% |
| Immigrants from Costa Rica | 19.4 /100 | #204 | Poor 5.4% |
| Chippewa | 18.9 /100 | #205 | Poor 5.4% |
| Osage | 18.4 /100 | #206 | Poor 5.4% |
| Immigrants from Africa | 17.6 /100 | #207 | Poor 5.5% |
| French American Indians | 16.1 /100 | #208 | Poor 5.5% |
| Immigrants from Syria | 15.4 /100 | #209 | Poor 5.5% |
| Immigrants from Micronesia | 14.4 /100 | #210 | Poor 5.5% |
| Nigerians | 14.3 /100 | #211 | Poor 5.5% |
| Immigrants from Thailand | 14.0 /100 | #212 | Poor 5.5% |
| Immigrants from Liberia | 13.3 /100 | #213 | Poor 5.5% |
| Iroquois | 13.1 /100 | #214 | Poor 5.5% |
Immigrants from Africa Married-Couple Family Poverty Correlation Summary
| Measurement | Immigrants from Africa Data | Married-Couple Family Poverty Data |
| Minimum | 0.13% | 0.82% |
| Maximum | 36.2% | 35.3% |
| Range | 36.1% | 34.5% |
| Mean | 11.2% | 8.3% |
| Median | 10.2% | 6.1% |
| Interquartile 25% (IQ1) | 5.1% | 5.2% |
| Interquartile 75% (IQ3) | 15.3% | 7.6% |
| Interquartile Range (IQR) | 10.2% | 2.5% |
| Standard Deviation (Sample) | 7.9% | 6.3% |
| Standard Deviation (Population) | 7.8% | 6.2% |
Correlation Details
| Immigrants from Africa Percentile | Sample Size | Married-Couple Family Poverty |
[ 0.0% - 0.5% ] 0.13% | 136,175,358 | 5.3% |
[ 0.0% - 0.5% ] 0.40% | 94,610,598 | 4.9% |
[ 0.5% - 1.0% ] 0.67% | 61,312,519 | 4.7% |
[ 0.5% - 1.0% ] 0.94% | 43,729,961 | 4.6% |
[ 1.0% - 1.5% ] 1.21% | 23,750,680 | 4.7% |
[ 1.0% - 1.5% ] 1.50% | 17,459,877 | 4.4% |
[ 1.5% - 2.0% ] 1.78% | 23,312,552 | 6.2% |
[ 2.0% - 2.5% ] 2.04% | 14,333,612 | 5.7% |
[ 2.0% - 2.5% ] 2.32% | 7,843,312 | 4.4% |
[ 2.5% - 3.0% ] 2.59% | 5,274,138 | 5.1% |
[ 2.5% - 3.0% ] 2.85% | 5,805,731 | 5.2% |
[ 3.0% - 3.5% ] 3.14% | 4,464,044 | 5.4% |
[ 3.0% - 3.5% ] 3.41% | 3,436,563 | 5.2% |
[ 3.5% - 4.0% ] 3.67% | 2,642,912 | 4.2% |
[ 3.5% - 4.0% ] 3.92% | 1,595,155 | 5.3% |
[ 4.0% - 4.5% ] 4.22% | 1,679,001 | 6.2% |
[ 4.0% - 4.5% ] 4.49% | 1,409,049 | 5.9% |
[ 4.5% - 5.0% ] 4.78% | 1,514,658 | 6.3% |
[ 5.0% - 5.5% ] 5.09% | 2,171,330 | 6.2% |
[ 5.0% - 5.5% ] 5.30% | 1,227,503 | 7.4% |
[ 5.5% - 6.0% ] 5.56% | 752,076 | 7.6% |
[ 5.5% - 6.0% ] 5.86% | 1,493,583 | 5.7% |
[ 6.0% - 6.5% ] 6.08% | 790,762 | 6.5% |
[ 6.0% - 6.5% ] 6.40% | 576,369 | 5.8% |
[ 6.5% - 7.0% ] 6.67% | 501,825 | 7.6% |
[ 6.5% - 7.0% ] 6.92% | 546,632 | 5.0% |
[ 7.0% - 7.5% ] 7.23% | 459,990 | 6.1% |
[ 7.0% - 7.5% ] 7.50% | 235,822 | 6.8% |
[ 7.5% - 8.0% ] 7.80% | 458,806 | 5.5% |
[ 8.0% - 8.5% ] 8.05% | 244,774 | 6.8% |
[ 8.0% - 8.5% ] 8.32% | 272,323 | 5.3% |
[ 8.5% - 9.0% ] 8.61% | 221,015 | 5.9% |
[ 8.5% - 9.0% ] 8.88% | 165,092 | 7.4% |
[ 9.0% - 9.5% ] 9.13% | 262,114 | 8.7% |
[ 9.0% - 9.5% ] 9.34% | 171,610 | 6.6% |
[ 9.5% - 10.0% ] 9.71% | 406,762 | 7.4% |
[ 9.5% - 10.0% ] 9.94% | 102,217 | 9.4% |
[ 10.0% - 10.5% ] 10.23% | 200,999 | 7.0% |
[ 10.5% - 11.0% ] 10.60% | 106,284 | 10.7% |
[ 10.5% - 11.0% ] 10.74% | 31,403 | 5.3% |
[ 10.5% - 11.0% ] 10.98% | 208,062 | 5.7% |
[ 11.0% - 11.5% ] 11.33% | 128,651 | 6.1% |
[ 11.5% - 12.0% ] 11.59% | 173,608 | 5.9% |
[ 11.5% - 12.0% ] 11.94% | 47,305 | 10.5% |
[ 12.0% - 12.5% ] 12.12% | 198,710 | 4.8% |
[ 12.0% - 12.5% ] 12.39% | 85,199 | 5.2% |
[ 12.5% - 13.0% ] 12.60% | 31,679 | 6.2% |
[ 12.5% - 13.0% ] 12.94% | 214,064 | 5.0% |
[ 13.0% - 13.5% ] 13.24% | 106,553 | 4.8% |
[ 13.5% - 14.0% ] 13.57% | 151,008 | 7.2% |
[ 13.5% - 14.0% ] 13.77% | 65,413 | 5.4% |
[ 14.0% - 14.5% ] 14.03% | 54,073 | 11.7% |
[ 14.0% - 14.5% ] 14.44% | 2,348 | 6.5% |
[ 14.0% - 14.5% ] 14.50% | 29,259 | 1.8% |
[ 14.5% - 15.0% ] 14.95% | 37,693 | 4.5% |
[ 15.0% - 15.5% ] 15.19% | 25,823 | 7.5% |
[ 15.0% - 15.5% ] 15.29% | 29,830 | 16.2% |
[ 15.5% - 16.0% ] 15.75% | 16,076 | 0.82% |
[ 16.0% - 16.5% ] 16.03% | 36,105 | 5.0% |
[ 16.0% - 16.5% ] 16.33% | 72,621 | 11.0% |
[ 16.5% - 17.0% ] 16.59% | 31,018 | 10.2% |
[ 16.5% - 17.0% ] 16.87% | 25,987 | 4.0% |
[ 17.0% - 17.5% ] 17.15% | 3,056 | 26.1% |
[ 17.0% - 17.5% ] 17.20% | 56,532 | 3.5% |
[ 17.5% - 18.0% ] 17.76% | 23,110 | 5.4% |
[ 18.5% - 19.0% ] 18.73% | 19,531 | 7.3% |
[ 21.0% - 21.5% ] 21.47% | 8,290 | 12.2% |
[ 23.0% - 23.5% ] 23.11% | 7,703 | 13.1% |
[ 23.5% - 24.0% ] 23.82% | 14,553 | 22.9% |
[ 24.0% - 24.5% ] 24.37% | 439 | 18.8% |
[ 25.5% - 26.0% ] 25.78% | 26,684 | 22.9% |
[ 26.0% - 26.5% ] 26.36% | 1,157 | 19.6% |
[ 29.0% - 29.5% ] 29.42% | 15,489 | 10.1% |
[ 33.5% - 34.0% ] 33.53% | 173 | 35.3% |
[ 36.0% - 36.5% ] 36.22% | 8,892 | 31.7% |