Immigrants from Portugal Married-Couple Family Poverty
COMPARE
Immigrants from Portugal
Select to Compare
Married-Couple Family Poverty
Immigrants from Portugal Married-Couple Family Poverty
5.0%
POVERTY | MARRIED-COUPLE FAMILIES
84.8/ 100
METRIC RATING
140th/ 347
METRIC RANK
Immigrants from Portugal Married-Couple Family Poverty Correlation Chart
The statistical analysis conducted on geographies consisting of 173,825,666 people shows a weak positive correlation between the proportion of Immigrants from Portugal and poverty level among married-couple families in the United States with a correlation coefficient (R) of 0.208 and weighted average of 5.0%. On average, for every 1% (one percent) increase in Immigrants from Portugal within a typical geography, there is an increase of 0.19% in poverty level among married-couple families.
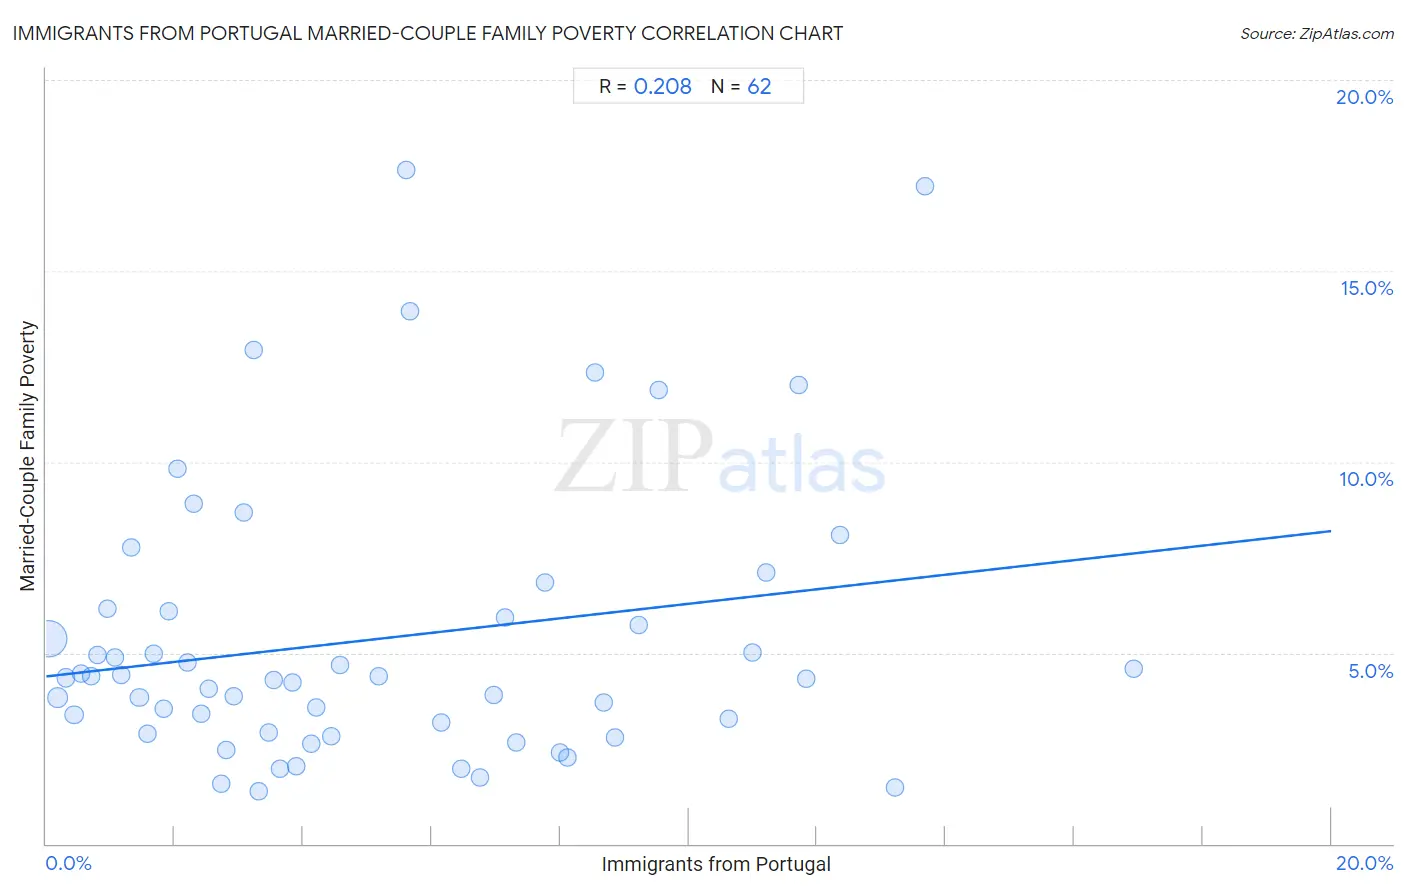
It is essential to understand that the correlation between the percentage of Immigrants from Portugal and poverty level among married-couple families does not imply a direct cause-and-effect relationship. It remains uncertain whether the presence of Immigrants from Portugal influences an upward or downward trend in the level of poverty level among married-couple families within an area, or if Immigrants from Portugal simply ended up residing in those areas with higher or lower levels of poverty level among married-couple families due to other factors.
Demographics Similar to Immigrants from Portugal by Married-Couple Family Poverty
In terms of married-couple family poverty, the demographic groups most similar to Immigrants from Portugal are Immigrants from Brazil (5.0%, a difference of 0.050%), Immigrants from China (5.0%, a difference of 0.050%), German Russian (5.0%, a difference of 0.060%), Chilean (4.9%, a difference of 0.29%), and Immigrants from Egypt (5.0%, a difference of 0.32%).
| Demographics | Rating | Rank | Married-Couple Family Poverty |
| Immigrants from Kenya | 90.2 /100 | #133 | Exceptional 4.9% |
| Samoans | 90.2 /100 | #134 | Exceptional 4.9% |
| Assyrians/Chaldeans/Syriacs | 89.4 /100 | #135 | Excellent 4.9% |
| Immigrants from Hungary | 88.7 /100 | #136 | Excellent 4.9% |
| Guamanians/Chamorros | 86.5 /100 | #137 | Excellent 4.9% |
| Chileans | 86.0 /100 | #138 | Excellent 4.9% |
| German Russians | 85.1 /100 | #139 | Excellent 5.0% |
| Immigrants from Portugal | 84.8 /100 | #140 | Excellent 5.0% |
| Immigrants from Brazil | 84.6 /100 | #141 | Excellent 5.0% |
| Immigrants from China | 84.6 /100 | #142 | Excellent 5.0% |
| Immigrants from Egypt | 83.4 /100 | #143 | Excellent 5.0% |
| Hmong | 83.2 /100 | #144 | Excellent 5.0% |
| Immigrants from Spain | 79.9 /100 | #145 | Good 5.0% |
| Mongolians | 79.8 /100 | #146 | Good 5.0% |
| Syrians | 78.7 /100 | #147 | Good 5.0% |
Immigrants from Portugal Married-Couple Family Poverty Correlation Summary
| Measurement | Immigrants from Portugal Data | Married-Couple Family Poverty Data |
| Minimum | 0.034% | 1.4% |
| Maximum | 16.9% | 17.6% |
| Range | 16.9% | 16.3% |
| Mean | 5.2% | 5.4% |
| Median | 3.9% | 4.3% |
| Interquartile 25% (IQ1) | 1.9% | 2.9% |
| Interquartile 75% (IQ3) | 8.0% | 6.1% |
| Interquartile Range (IQR) | 6.1% | 3.2% |
| Standard Deviation (Sample) | 4.0% | 3.7% |
| Standard Deviation (Population) | 4.0% | 3.7% |
Correlation Details
| Immigrants from Portugal Percentile | Sample Size | Married-Couple Family Poverty |
[ 0.0% - 0.5% ] 0.034% | 138,833,597 | 5.4% |
[ 0.0% - 0.5% ] 0.18% | 16,498,111 | 3.8% |
[ 0.0% - 0.5% ] 0.30% | 5,272,083 | 4.3% |
[ 0.0% - 0.5% ] 0.43% | 3,038,375 | 3.4% |
[ 0.5% - 1.0% ] 0.55% | 2,493,368 | 4.4% |
[ 0.5% - 1.0% ] 0.69% | 1,256,500 | 4.4% |
[ 0.5% - 1.0% ] 0.81% | 628,110 | 4.9% |
[ 0.5% - 1.0% ] 0.95% | 663,778 | 6.1% |
[ 1.0% - 1.5% ] 1.06% | 682,253 | 4.9% |
[ 1.0% - 1.5% ] 1.17% | 303,200 | 4.4% |
[ 1.0% - 1.5% ] 1.33% | 472,374 | 7.8% |
[ 1.0% - 1.5% ] 1.45% | 312,476 | 3.8% |
[ 1.5% - 2.0% ] 1.58% | 182,320 | 2.9% |
[ 1.5% - 2.0% ] 1.68% | 209,863 | 5.0% |
[ 1.5% - 2.0% ] 1.82% | 359,969 | 3.5% |
[ 1.5% - 2.0% ] 1.91% | 101,802 | 6.1% |
[ 2.0% - 2.5% ] 2.05% | 341,530 | 9.8% |
[ 2.0% - 2.5% ] 2.20% | 213,314 | 4.7% |
[ 2.0% - 2.5% ] 2.29% | 26,163 | 8.9% |
[ 2.0% - 2.5% ] 2.41% | 118,553 | 3.4% |
[ 2.5% - 3.0% ] 2.53% | 163,270 | 4.1% |
[ 2.5% - 3.0% ] 2.72% | 31,505 | 1.6% |
[ 2.5% - 3.0% ] 2.80% | 184,081 | 2.5% |
[ 2.5% - 3.0% ] 2.92% | 102,349 | 3.8% |
[ 3.0% - 3.5% ] 3.07% | 80,862 | 8.7% |
[ 3.0% - 3.5% ] 3.23% | 13,154 | 12.9% |
[ 3.0% - 3.5% ] 3.31% | 76,771 | 1.4% |
[ 3.0% - 3.5% ] 3.46% | 37,495 | 2.9% |
[ 3.5% - 4.0% ] 3.54% | 86,761 | 4.3% |
[ 3.5% - 4.0% ] 3.65% | 16,296 | 2.0% |
[ 3.5% - 4.0% ] 3.84% | 17,048 | 4.2% |
[ 3.5% - 4.0% ] 3.89% | 16,427 | 2.0% |
[ 4.0% - 4.5% ] 4.12% | 43,579 | 2.6% |
[ 4.0% - 4.5% ] 4.20% | 32,704 | 3.6% |
[ 4.0% - 4.5% ] 4.44% | 64,636 | 2.8% |
[ 4.5% - 5.0% ] 4.58% | 111,351 | 4.7% |
[ 5.0% - 5.5% ] 5.17% | 82,314 | 4.4% |
[ 5.5% - 6.0% ] 5.61% | 196 | 17.6% |
[ 5.5% - 6.0% ] 5.67% | 2,436 | 14.0% |
[ 6.0% - 6.5% ] 6.14% | 69,043 | 3.2% |
[ 6.0% - 6.5% ] 6.45% | 10,466 | 2.0% |
[ 6.5% - 7.0% ] 6.74% | 11,431 | 1.7% |
[ 6.5% - 7.0% ] 6.96% | 4,556 | 3.9% |
[ 7.0% - 7.5% ] 7.15% | 1,581 | 5.9% |
[ 7.0% - 7.5% ] 7.31% | 12,072 | 2.6% |
[ 7.5% - 8.0% ] 7.76% | 100,620 | 6.8% |
[ 7.5% - 8.0% ] 8.00% | 21,383 | 2.4% |
[ 8.0% - 8.5% ] 8.11% | 47,012 | 2.2% |
[ 8.5% - 9.0% ] 8.54% | 56,696 | 12.3% |
[ 8.5% - 9.0% ] 8.68% | 26,474 | 3.7% |
[ 8.5% - 9.0% ] 8.86% | 27,548 | 2.8% |
[ 9.0% - 9.5% ] 9.22% | 25,084 | 5.7% |
[ 9.5% - 10.0% ] 9.53% | 18,445 | 11.9% |
[ 10.5% - 11.0% ] 10.61% | 12,465 | 3.3% |
[ 10.5% - 11.0% ] 11.00% | 30,558 | 5.0% |
[ 11.0% - 11.5% ] 11.21% | 93,638 | 7.1% |
[ 11.5% - 12.0% ] 11.71% | 8,763 | 12.0% |
[ 11.5% - 12.0% ] 11.82% | 17,164 | 4.3% |
[ 12.0% - 12.5% ] 12.36% | 26,807 | 8.1% |
[ 13.0% - 13.5% ] 13.22% | 21,742 | 1.5% |
[ 13.5% - 14.0% ] 13.68% | 6,484 | 17.2% |
[ 16.5% - 17.0% ] 16.93% | 4,660 | 4.6% |