Ute Married-Couple Family Poverty

COMPARE

Ute
Race
Ancestry
AfghanAfricanAlaska NativeAlaskan AthabascanAlbanianAleutAlsatianAmericanApacheArabArapahoArgentineanArmenianAssyrian/Chaldean/SyriacAustralianAustrianBahamianBangladeshiBarbadianBasqueBelgianBelizeanBermudanBhutaneseBlackfeetBolivianBrazilianBritishBritish West IndianBulgarianBurmeseCajunCambodianCanadianCape VerdeanCarpatho RusynCelticCentral AmericanCentral American IndianCherokeeCheyenneChickasawChileanChineseChippewaChoctawColombianColvilleComancheCosta RicanCreeCreekCroatianCrowCubanCypriotCzechCzechoslovakianDanishDelawareDominicanDutchDutch West IndianEastern EuropeanEcuadorianEgyptianEnglishEstonianEthiopianEuropeanFijianFilipinoFinnishFrenchFrench American IndianFrench CanadianGermanGerman RussianGhanaianGreekGuamanian/ChamorroGuatemalanGuyaneseHaitianHmongHonduranHopiHoumaHungarianIcelanderIndian (Asian)IndonesianInupiatIranianIraqiIrishIroquoisIsraeliItalianJamaicanJapaneseJordanianKenyanKiowaKoreanLaotianLatvianLebaneseLiberianLithuanianLumbeeLuxembourgerMacedonianMalaysianMalteseMarshalleseMenomineeMexicanMexican American IndianMongolianMoroccanNative HawaiianNavajoNepaleseNew ZealanderNicaraguanNigerianNorthern EuropeanNorwegianOkinawanOsageOttawaPaiutePakistaniPalestinianPanamanianParaguayanPennsylvania GermanPeruvianPimaPolishPortuguesePotawatomiPuebloPuerto RicanPuget Sound SalishRomanianRussianSalvadoranSamoanScandinavianScotch-IrishScottishSeminoleSenegaleseSerbianShoshoneSierra LeoneanSiouxSlavicSlovakSloveneSomaliSouth AfricanSouth AmericanSouth American IndianSoviet UnionSpaniardSpanishSpanish AmericanSpanish American IndianSri LankanSubsaharan AfricanSudaneseSwedishSwissSyrianTaiwaneseThaiTlingit-HaidaTohono O'OdhamTonganTrinidadian and TobagonianTsimshianTurkishU.S. Virgin IslanderUgandanUkrainianUruguayanUteVenezuelanVietnameseWelshWest IndianYakamaYaquiYugoslavianYumanYup'ikZimbabwean
Immigration
NonimmigrantsImmigrantsAfghanistanAfricaAlbaniaArgentinaArmeniaAsiaAustraliaAustriaBahamasBangladeshBarbadosBelarusBelgiumBelizeBoliviaBosnia and HerzegovinaBrazilBulgariaBurma/MyanmarCabo VerdeCambodiaCameroonCanadaCaribbeanCentral AmericaChileChinaColombiaCongoCosta RicaCroatiaCubaCzechoslovakiaDenmarkDominicaDominican RepublicEastern AfricaEastern AsiaEastern EuropeEcuadorEgyptEl SalvadorEnglandEritreaEthiopiaEuropeFijiFranceGermanyGhanaGreeceGrenadaGuatemalaGuyanaHaitiHondurasHong KongHungaryIndiaIndonesiaIranIraqIrelandIsraelItalyJamaicaJapanJordanKazakhstanKenyaKoreaKuwaitLaosLatin AmericaLatviaLebanonLiberiaLithuaniaMalaysiaMexicoMicronesiaMiddle AfricaMoldovaMoroccoNepalNetherlandsNicaraguaNigeriaNorth AmericaNorth MacedoniaNorthern AfricaNorthern EuropeNorwayOceaniaPakistanPanamaPeruPhilippinesPolandPortugalRomaniaRussiaSaudi ArabiaScotlandSenegalSerbiaSierra LeoneSingaporeSomaliaSouth AfricaSouth AmericaSouth Central AsiaSouth Eastern AsiaSouthern EuropeSpainSri LankaSt. Vincent and the GrenadinesSudanSwedenSwitzerlandSyriaTaiwanThailandTrinidad and TobagoTurkeyUgandaUkraineUruguayUzbekistanVenezuelaVietnamWest IndiesWestern AfricaWestern AsiaWestern EuropeYemenZaireZimbabweAzores
Select to Compare
Race
Ancestry
AfghanAfricanAlaska NativeAlaskan AthabascanAlbanianAleutAlsatianAmericanApacheArabArapahoArgentineanArmenianAssyrian/Chaldean/SyriacAustralianAustrianBahamianBangladeshiBarbadianBasqueBelgianBelizeanBermudanBhutaneseBlackfeetBolivianBrazilianBritishBritish West IndianBulgarianBurmeseCajunCambodianCanadianCape VerdeanCarpatho RusynCelticCentral AmericanCentral American IndianCherokeeCheyenneChickasawChileanChineseChippewaChoctawColombianColvilleComancheCosta RicanCreeCreekCroatianCrowCubanCypriotCzechCzechoslovakianDanishDelawareDominicanDutchDutch West IndianEastern EuropeanEcuadorianEgyptianEnglishEstonianEthiopianEuropeanFijianFilipinoFinnishFrenchFrench American IndianFrench CanadianGermanGerman RussianGhanaianGreekGuamanian/ChamorroGuatemalanGuyaneseHaitianHmongHonduranHopiHoumaHungarianIcelanderIndian (Asian)IndonesianInupiatIranianIraqiIrishIroquoisIsraeliItalianJamaicanJapaneseJordanianKenyanKiowaKoreanLaotianLatvianLebaneseLiberianLithuanianLumbeeLuxembourgerMacedonianMalaysianMalteseMarshalleseMenomineeMexicanMexican American IndianMongolianMoroccanNative HawaiianNavajoNepaleseNew ZealanderNicaraguanNigerianNorthern EuropeanNorwegianOkinawanOsageOttawaPaiutePakistaniPalestinianPanamanianParaguayanPennsylvania GermanPeruvianPimaPolishPortuguesePotawatomiPuebloPuerto RicanPuget Sound SalishRomanianRussianSalvadoranSamoanScandinavianScotch-IrishScottishSeminoleSenegaleseSerbianShoshoneSierra LeoneanSiouxSlavicSlovakSloveneSomaliSouth AfricanSouth AmericanSouth American IndianSoviet UnionSpaniardSpanishSpanish AmericanSpanish American IndianSri LankanSubsaharan AfricanSudaneseSwedishSwissSyrianTaiwaneseThaiTlingit-HaidaTohono O'OdhamTonganTrinidadian and TobagonianTsimshianTurkishU.S. Virgin IslanderUgandanUkrainianUruguayanVenezuelanVietnameseWelshWest IndianYakamaYaquiYugoslavianYumanYup'ikZimbabwean
Immigration
NonimmigrantsImmigrantsAfghanistanAfricaAlbaniaArgentinaArmeniaAsiaAustraliaAustriaBahamasBangladeshBarbadosBelarusBelgiumBelizeBoliviaBosnia and HerzegovinaBrazilBulgariaBurma/MyanmarCabo VerdeCambodiaCameroonCanadaCaribbeanCentral AmericaChileChinaColombiaCongoCosta RicaCroatiaCubaCzechoslovakiaDenmarkDominicaDominican RepublicEastern AfricaEastern AsiaEastern EuropeEcuadorEgyptEl SalvadorEnglandEritreaEthiopiaEuropeFijiFranceGermanyGhanaGreeceGrenadaGuatemalaGuyanaHaitiHondurasHong KongHungaryIndiaIndonesiaIranIraqIrelandIsraelItalyJamaicaJapanJordanKazakhstanKenyaKoreaKuwaitLaosLatin AmericaLatviaLebanonLiberiaLithuaniaMalaysiaMexicoMicronesiaMiddle AfricaMoldovaMoroccoNepalNetherlandsNicaraguaNigeriaNorth AmericaNorth MacedoniaNorthern AfricaNorthern EuropeNorwayOceaniaPakistanPanamaPeruPhilippinesPolandPortugalRomaniaRussiaSaudi ArabiaScotlandSenegalSerbiaSierra LeoneSingaporeSomaliaSouth AfricaSouth AmericaSouth Central AsiaSouth Eastern AsiaSouthern EuropeSpainSri LankaSt. Vincent and the GrenadinesSudanSwedenSwitzerlandSyriaTaiwanThailandTrinidad and TobagoTurkeyUgandaUkraineUruguayUzbekistanVenezuelaVietnamWest IndiesWestern AfricaWestern AsiaWestern EuropeYemenZaireZimbabweAzores
Married-Couple Family Poverty
Income
Poverty
Unemployment
Labor Participation
Family Structure
Vehicle Availability
Education Level
Disability

Ute Married-Couple Family Poverty
Tragic

6.4%
POVERTY | MARRIED-COUPLE FAMILIES
0.0/ 100
METRIC RATING
283rd/ 347
METRIC RANK

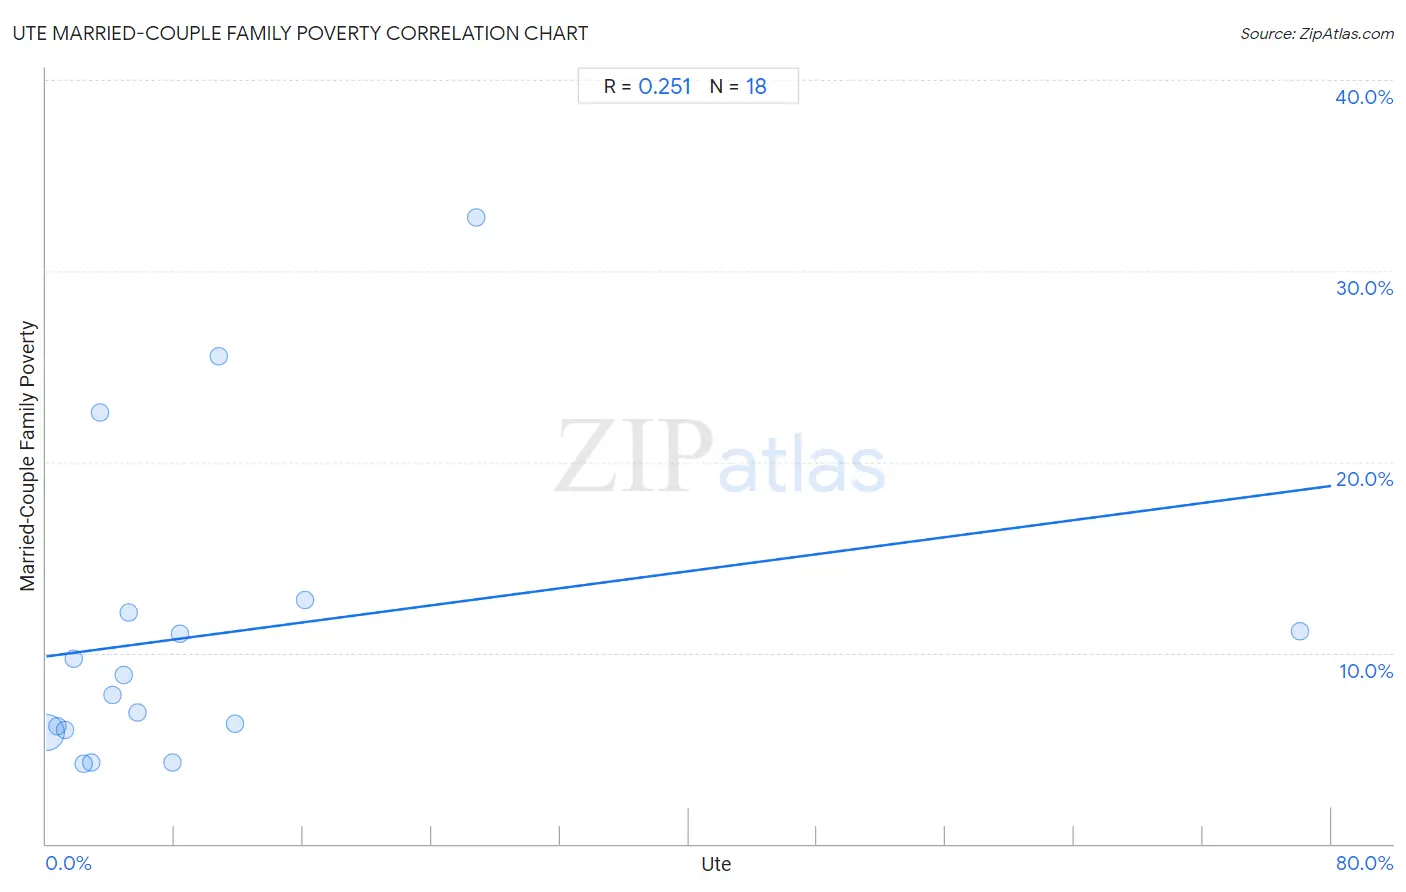
Ute Married-Couple Family Poverty Correlation Chart

The statistical analysis conducted on geographies consisting of 55,601,048 people shows a weak positive correlation between the proportion of Ute and poverty level among married-couple families in the United States with a correlation coefficient (R) of 0.251 and weighted average of 6.4%. On average, for every 1% (one percent) increase in Ute within a typical geography, there is an increase of 0.11% in poverty level among married-couple families.
Ute Married-Couple Family Poverty
It is essential to understand that the correlation between the percentage of Ute and poverty level among married-couple families does not imply a direct cause-and-effect relationship. It remains uncertain whether the presence of Ute influences an upward or downward trend in the level of poverty level among married-couple families within an area, or if Ute simply ended up residing in those areas with higher or lower levels of poverty level among married-couple families due to other factors.

Demographics Similar to Ute by Married-Couple Family Poverty

In terms of married-couple family poverty, the demographic groups most similar to Ute are Dutch West Indian (6.4%, a difference of 0.12%), Seminole (6.4%, a difference of 0.38%), Mexican American Indian (6.4%, a difference of 0.39%), Black/African American (6.5%, a difference of 0.63%), and Guyanese (6.5%, a difference of 0.73%).
DemographicsRating | RankMarried-Couple Family Poverty
Yaqui
0.1
/100
|
#276
Tragic
6.3%
Indonesians
0.1
/100
|
#277
Tragic
6.3%
Immigrants from Trinidad and Tobago
0.1
/100
|
#278
Tragic
6.4%
Houma
0.0
/100
|
#279
Tragic
6.4%
West Indians
0.0
/100
|
#280
Tragic
6.4%
Mexican American Indians
0.0
/100
|
#281
Tragic
6.4%
Seminole
0.0
/100
|
#282
Tragic
6.4%
Ute
0.0
/100
|
#283
Tragic
6.4%
Dutch West Indians
0.0
/100
|
#284
Tragic
6.4%
Blacks/African Americans
0.0
/100
|
#285
Tragic
6.5%
Guyanese
0.0
/100
|
#286
Tragic
6.5%
Ecuadorians
0.0
/100
|
#287
Tragic
6.5%
Salvadorans
0.0
/100
|
#288
Tragic
6.5%
Nepalese
0.0
/100
|
#289
Tragic
6.5%
Immigrants from Barbados
0.0
/100
|
#290
Tragic
6.5%

Ute Married-Couple Family Poverty Correlation Summary

MeasurementUte DataMarried-Couple Family Poverty Data
Minimum0.028%4.2%
Maximum78.1%32.8%
Range78.0%28.6%
Mean10.6%11.0%
Median5.0%8.3%
Interquartile 25% (IQ1)2.3%6.0%
Interquartile 75% (IQ3)10.7%12.1%
Interquartile Range (IQR)8.4%6.1%
Standard Deviation (Sample)18.1%8.0%
Standard Deviation (Population)17.6%7.8%

Correlation Details

Ute PercentileSample SizeMarried-Couple Family Poverty
[
0.0%
-
0.5%
]
0.028%
55,204,5785.8%
[
0.5%
-
1.0%
]
0.68%
246,9356.2%
[
1.0%
-
1.5%
]
1.20%
49,6346.0%
[
1.5%
-
2.0%
]
1.68%
9,0679.7%
[
2.0%
-
2.5%
]
2.34%
46,6984.2%
[
2.5%
-
3.0%
]
2.77%
6,2154.2%
[
3.0%
-
3.5%
]
3.36%
38722.6%
[
4.0%
-
4.5%
]
4.09%
2,0047.8%
[
4.5%
-
5.0%
]
4.85%
8,3468.8%
[
5.0%
-
5.5%
]
5.13%
1,15112.1%
[
5.5%
-
6.0%
]
5.71%
14,8946.9%
[
7.5%
-
8.0%
]
7.88%
1,2574.3%
[
8.0%
-
8.5%
]
8.33%
1,28511.0%
[
10.5%
-
11.0%
]
10.72%
48525.5%
[
11.5%
-
12.0%
]
11.76%
5,4956.3%
[
16.0%
-
16.5%
]
16.07%
61612.8%
[
26.5%
-
27.0%
]
26.77%
31032.8%
[
78.0%
-
78.5%
]
78.06%
1,69111.1%