South American Indian Married-Couple Family Poverty

COMPARE

South American Indian
Race
Ancestry
AfghanAfricanAlaska NativeAlaskan AthabascanAlbanianAleutAlsatianAmericanApacheArabArapahoArgentineanArmenianAssyrian/Chaldean/SyriacAustralianAustrianBahamianBangladeshiBarbadianBasqueBelgianBelizeanBermudanBhutaneseBlackfeetBolivianBrazilianBritishBritish West IndianBulgarianBurmeseCajunCambodianCanadianCape VerdeanCarpatho RusynCelticCentral AmericanCentral American IndianCherokeeCheyenneChickasawChileanChineseChippewaChoctawColombianColvilleComancheCosta RicanCreeCreekCroatianCrowCubanCypriotCzechCzechoslovakianDanishDelawareDominicanDutchDutch West IndianEastern EuropeanEcuadorianEgyptianEnglishEstonianEthiopianEuropeanFijianFilipinoFinnishFrenchFrench American IndianFrench CanadianGermanGerman RussianGhanaianGreekGuamanian/ChamorroGuatemalanGuyaneseHaitianHmongHonduranHopiHoumaHungarianIcelanderIndian (Asian)IndonesianInupiatIranianIraqiIrishIroquoisIsraeliItalianJamaicanJapaneseJordanianKenyanKiowaKoreanLaotianLatvianLebaneseLiberianLithuanianLumbeeLuxembourgerMacedonianMalaysianMalteseMarshalleseMenomineeMexicanMexican American IndianMongolianMoroccanNative HawaiianNavajoNepaleseNew ZealanderNicaraguanNigerianNorthern EuropeanNorwegianOkinawanOsageOttawaPaiutePakistaniPalestinianPanamanianParaguayanPennsylvania GermanPeruvianPimaPolishPortuguesePotawatomiPuebloPuerto RicanPuget Sound SalishRomanianRussianSalvadoranSamoanScandinavianScotch-IrishScottishSeminoleSenegaleseSerbianShoshoneSierra LeoneanSiouxSlavicSlovakSloveneSomaliSouth AfricanSouth AmericanSouth American IndianSoviet UnionSpaniardSpanishSpanish AmericanSpanish American IndianSri LankanSubsaharan AfricanSudaneseSwedishSwissSyrianTaiwaneseThaiTlingit-HaidaTohono O'OdhamTonganTrinidadian and TobagonianTsimshianTurkishU.S. Virgin IslanderUgandanUkrainianUruguayanUteVenezuelanVietnameseWelshWest IndianYakamaYaquiYugoslavianYumanYup'ikZimbabwean
Immigration
NonimmigrantsImmigrantsAfghanistanAfricaAlbaniaArgentinaArmeniaAsiaAustraliaAustriaBahamasBangladeshBarbadosBelarusBelgiumBelizeBoliviaBosnia and HerzegovinaBrazilBulgariaBurma/MyanmarCabo VerdeCambodiaCameroonCanadaCaribbeanCentral AmericaChileChinaColombiaCongoCosta RicaCroatiaCubaCzechoslovakiaDenmarkDominicaDominican RepublicEastern AfricaEastern AsiaEastern EuropeEcuadorEgyptEl SalvadorEnglandEritreaEthiopiaEuropeFijiFranceGermanyGhanaGreeceGrenadaGuatemalaGuyanaHaitiHondurasHong KongHungaryIndiaIndonesiaIranIraqIrelandIsraelItalyJamaicaJapanJordanKazakhstanKenyaKoreaKuwaitLaosLatin AmericaLatviaLebanonLiberiaLithuaniaMalaysiaMexicoMicronesiaMiddle AfricaMoldovaMoroccoNepalNetherlandsNicaraguaNigeriaNorth AmericaNorth MacedoniaNorthern AfricaNorthern EuropeNorwayOceaniaPakistanPanamaPeruPhilippinesPolandPortugalRomaniaRussiaSaudi ArabiaScotlandSenegalSerbiaSierra LeoneSingaporeSomaliaSouth AfricaSouth AmericaSouth Central AsiaSouth Eastern AsiaSouthern EuropeSpainSri LankaSt. Vincent and the GrenadinesSudanSwedenSwitzerlandSyriaTaiwanThailandTrinidad and TobagoTurkeyUgandaUkraineUruguayUzbekistanVenezuelaVietnamWest IndiesWestern AfricaWestern AsiaWestern EuropeYemenZaireZimbabweAzores
Select to Compare
Race
Ancestry
AfghanAfricanAlaska NativeAlaskan AthabascanAlbanianAleutAlsatianAmericanApacheArabArapahoArgentineanArmenianAssyrian/Chaldean/SyriacAustralianAustrianBahamianBangladeshiBarbadianBasqueBelgianBelizeanBermudanBhutaneseBlackfeetBolivianBrazilianBritishBritish West IndianBulgarianBurmeseCajunCambodianCanadianCape VerdeanCarpatho RusynCelticCentral AmericanCentral American IndianCherokeeCheyenneChickasawChileanChineseChippewaChoctawColombianColvilleComancheCosta RicanCreeCreekCroatianCrowCubanCypriotCzechCzechoslovakianDanishDelawareDominicanDutchDutch West IndianEastern EuropeanEcuadorianEgyptianEnglishEstonianEthiopianEuropeanFijianFilipinoFinnishFrenchFrench American IndianFrench CanadianGermanGerman RussianGhanaianGreekGuamanian/ChamorroGuatemalanGuyaneseHaitianHmongHonduranHopiHoumaHungarianIcelanderIndian (Asian)IndonesianInupiatIranianIraqiIrishIroquoisIsraeliItalianJamaicanJapaneseJordanianKenyanKiowaKoreanLaotianLatvianLebaneseLiberianLithuanianLumbeeLuxembourgerMacedonianMalaysianMalteseMarshalleseMenomineeMexicanMexican American IndianMongolianMoroccanNative HawaiianNavajoNepaleseNew ZealanderNicaraguanNigerianNorthern EuropeanNorwegianOkinawanOsageOttawaPaiutePakistaniPalestinianPanamanianParaguayanPennsylvania GermanPeruvianPimaPolishPortuguesePotawatomiPuebloPuerto RicanPuget Sound SalishRomanianRussianSalvadoranSamoanScandinavianScotch-IrishScottishSeminoleSenegaleseSerbianShoshoneSierra LeoneanSiouxSlavicSlovakSloveneSomaliSouth AfricanSouth AmericanSoviet UnionSpaniardSpanishSpanish AmericanSpanish American IndianSri LankanSubsaharan AfricanSudaneseSwedishSwissSyrianTaiwaneseThaiTlingit-HaidaTohono O'OdhamTonganTrinidadian and TobagonianTsimshianTurkishU.S. Virgin IslanderUgandanUkrainianUruguayanUteVenezuelanVietnameseWelshWest IndianYakamaYaquiYugoslavianYumanYup'ikZimbabwean
Immigration
NonimmigrantsImmigrantsAfghanistanAfricaAlbaniaArgentinaArmeniaAsiaAustraliaAustriaBahamasBangladeshBarbadosBelarusBelgiumBelizeBoliviaBosnia and HerzegovinaBrazilBulgariaBurma/MyanmarCabo VerdeCambodiaCameroonCanadaCaribbeanCentral AmericaChileChinaColombiaCongoCosta RicaCroatiaCubaCzechoslovakiaDenmarkDominicaDominican RepublicEastern AfricaEastern AsiaEastern EuropeEcuadorEgyptEl SalvadorEnglandEritreaEthiopiaEuropeFijiFranceGermanyGhanaGreeceGrenadaGuatemalaGuyanaHaitiHondurasHong KongHungaryIndiaIndonesiaIranIraqIrelandIsraelItalyJamaicaJapanJordanKazakhstanKenyaKoreaKuwaitLaosLatin AmericaLatviaLebanonLiberiaLithuaniaMalaysiaMexicoMicronesiaMiddle AfricaMoldovaMoroccoNepalNetherlandsNicaraguaNigeriaNorth AmericaNorth MacedoniaNorthern AfricaNorthern EuropeNorwayOceaniaPakistanPanamaPeruPhilippinesPolandPortugalRomaniaRussiaSaudi ArabiaScotlandSenegalSerbiaSierra LeoneSingaporeSomaliaSouth AfricaSouth AmericaSouth Central AsiaSouth Eastern AsiaSouthern EuropeSpainSri LankaSt. Vincent and the GrenadinesSudanSwedenSwitzerlandSyriaTaiwanThailandTrinidad and TobagoTurkeyUgandaUkraineUruguayUzbekistanVenezuelaVietnamWest IndiesWestern AfricaWestern AsiaWestern EuropeYemenZaireZimbabweAzores
Married-Couple Family Poverty
Income
Poverty
Unemployment
Labor Participation
Family Structure
Vehicle Availability
Education Level
Disability

South American Indian Married-Couple Family Poverty
Fair

5.3%
POVERTY | MARRIED-COUPLE FAMILIES
32.5/ 100
METRIC RATING
189th/ 347
METRIC RANK

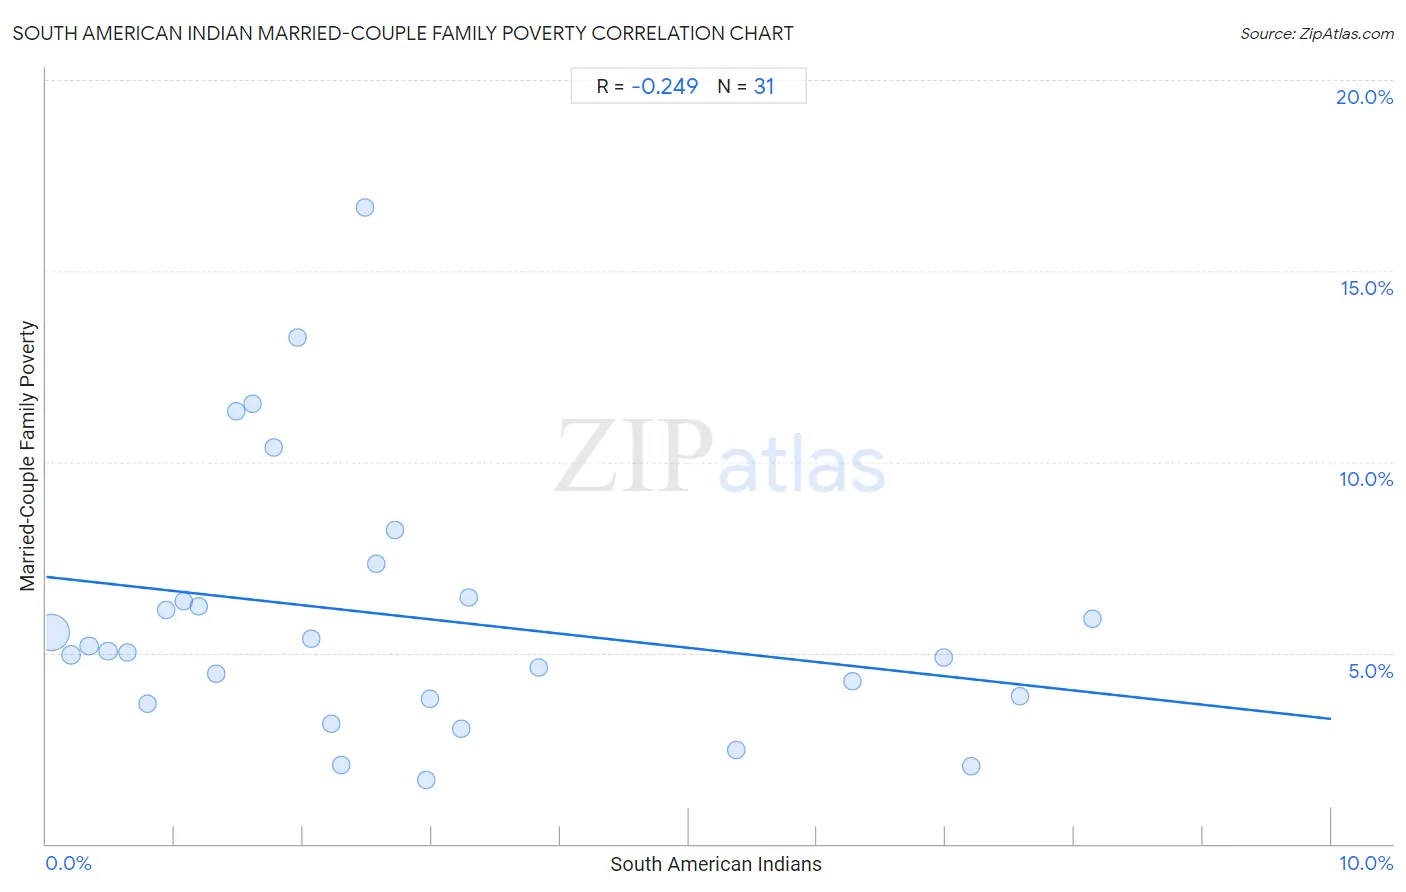
South American Indian Married-Couple Family Poverty Correlation Chart

The statistical analysis conducted on geographies consisting of 164,101,002 people shows a weak negative correlation between the proportion of South American Indians and poverty level among married-couple families in the United States with a correlation coefficient (R) of -0.249 and weighted average of 5.3%. On average, for every 1% (one percent) increase in South American Indians within a typical geography, there is a decrease of 0.37% in poverty level among married-couple families.
South American Indian Married-Couple Family Poverty
It is essential to understand that the correlation between the percentage of South American Indians and poverty level among married-couple families does not imply a direct cause-and-effect relationship. It remains uncertain whether the presence of South American Indians influences an upward or downward trend in the level of poverty level among married-couple families within an area, or if South American Indians simply ended up residing in those areas with higher or lower levels of poverty level among married-couple families due to other factors.

Demographics Similar to South American Indians by Married-Couple Family Poverty

In terms of married-couple family poverty, the demographic groups most similar to South American Indians are Israeli (5.3%, a difference of 0.090%), Ugandan (5.3%, a difference of 0.11%), Immigrants from Albania (5.3%, a difference of 0.18%), Immigrants from Cabo Verde (5.3%, a difference of 0.20%), and Cape Verdean (5.3%, a difference of 0.23%).
DemographicsRating | RankMarried-Couple Family Poverty
Immigrants from Vietnam
37.7
/100
|
#182
Fair
5.3%
Peruvians
37.6
/100
|
#183
Fair
5.3%
Nonimmigrants
35.8
/100
|
#184
Fair
5.3%
Americans
35.4
/100
|
#185
Fair
5.3%
Hungarians
34.7
/100
|
#186
Fair
5.3%
Immigrants from Albania
33.8
/100
|
#187
Fair
5.3%
Israelis
33.1
/100
|
#188
Fair
5.3%
South American Indians
32.5
/100
|
#189
Fair
5.3%
Ugandans
31.6
/100
|
#190
Fair
5.3%
Immigrants from Cabo Verde
30.9
/100
|
#191
Fair
5.3%
Cape Verdeans
30.7
/100
|
#192
Fair
5.3%
Malaysians
29.5
/100
|
#193
Fair
5.4%
Immigrants from Israel
27.8
/100
|
#194
Fair
5.4%
Immigrants from the Azores
27.5
/100
|
#195
Fair
5.4%
Spaniards
27.4
/100
|
#196
Fair
5.4%

South American Indian Married-Couple Family Poverty Correlation Summary

MeasurementSouth American Indian DataMarried-Couple Family Poverty Data
Minimum0.038%1.7%
Maximum8.1%16.7%
Range8.1%15.0%
Mean2.8%6.0%
Median2.2%5.0%
Interquartile 25% (IQ1)1.1%3.8%
Interquartile 75% (IQ3)3.3%6.5%
Interquartile Range (IQR)2.2%2.7%
Standard Deviation (Sample)2.3%3.5%
Standard Deviation (Population)2.3%3.4%

Correlation Details

South American Indian PercentileSample SizeMarried-Couple Family Poverty
[
0.0%
-
0.5%
]
0.038%
145,645,8855.5%
[
0.0%
-
0.5%
]
0.20%
12,337,2705.0%
[
0.0%
-
0.5%
]
0.33%
3,247,2045.2%
[
0.0%
-
0.5%
]
0.48%
1,002,1475.0%
[
0.5%
-
1.0%
]
0.63%
838,6315.0%
[
0.5%
-
1.0%
]
0.78%
363,5403.7%
[
0.5%
-
1.0%
]
0.93%
109,0066.1%
[
1.0%
-
1.5%
]
1.07%
201,3286.4%
[
1.0%
-
1.5%
]
1.19%
73,9056.2%
[
1.0%
-
1.5%
]
1.32%
118,9224.5%
[
1.0%
-
1.5%
]
1.48%
33,25011.3%
[
1.5%
-
2.0%
]
1.60%
18,59011.5%
[
1.5%
-
2.0%
]
1.77%
21,55010.4%
[
1.5%
-
2.0%
]
1.96%
1,43113.2%
[
2.0%
-
2.5%
]
2.07%
2,4195.4%
[
2.0%
-
2.5%
]
2.22%
34,7983.1%
[
2.0%
-
2.5%
]
2.30%
6092.1%
[
2.0%
-
2.5%
]
2.48%
12116.7%
[
2.5%
-
3.0%
]
2.57%
6617.3%
[
2.5%
-
3.0%
]
2.72%
15,8938.2%
[
2.5%
-
3.0%
]
2.95%
6,2991.7%
[
2.5%
-
3.0%
]
2.99%
1,1723.8%
[
3.0%
-
3.5%
]
3.23%
13,1113.0%
[
3.0%
-
3.5%
]
3.29%
1,0356.5%
[
3.5%
-
4.0%
]
3.84%
3,8834.6%
[
5.0%
-
5.5%
]
5.37%
1,3592.5%
[
6.0%
-
6.5%
]
6.27%
5584.3%
[
6.5%
-
7.0%
]
6.98%
3,7814.9%
[
7.0%
-
7.5%
]
7.20%
6252.0%
[
7.5%
-
8.0%
]
7.58%
9633.9%
[
8.0%
-
8.5%
]
8.14%
1,0565.9%