Immigrants from Honduras Married-Couple Family Poverty
COMPARE
Immigrants from Honduras
Select to Compare
Married-Couple Family Poverty
Immigrants from Honduras Married-Couple Family Poverty
7.3%
POVERTY | MARRIED-COUPLE FAMILIES
0.0/ 100
METRIC RATING
322nd/ 347
METRIC RANK
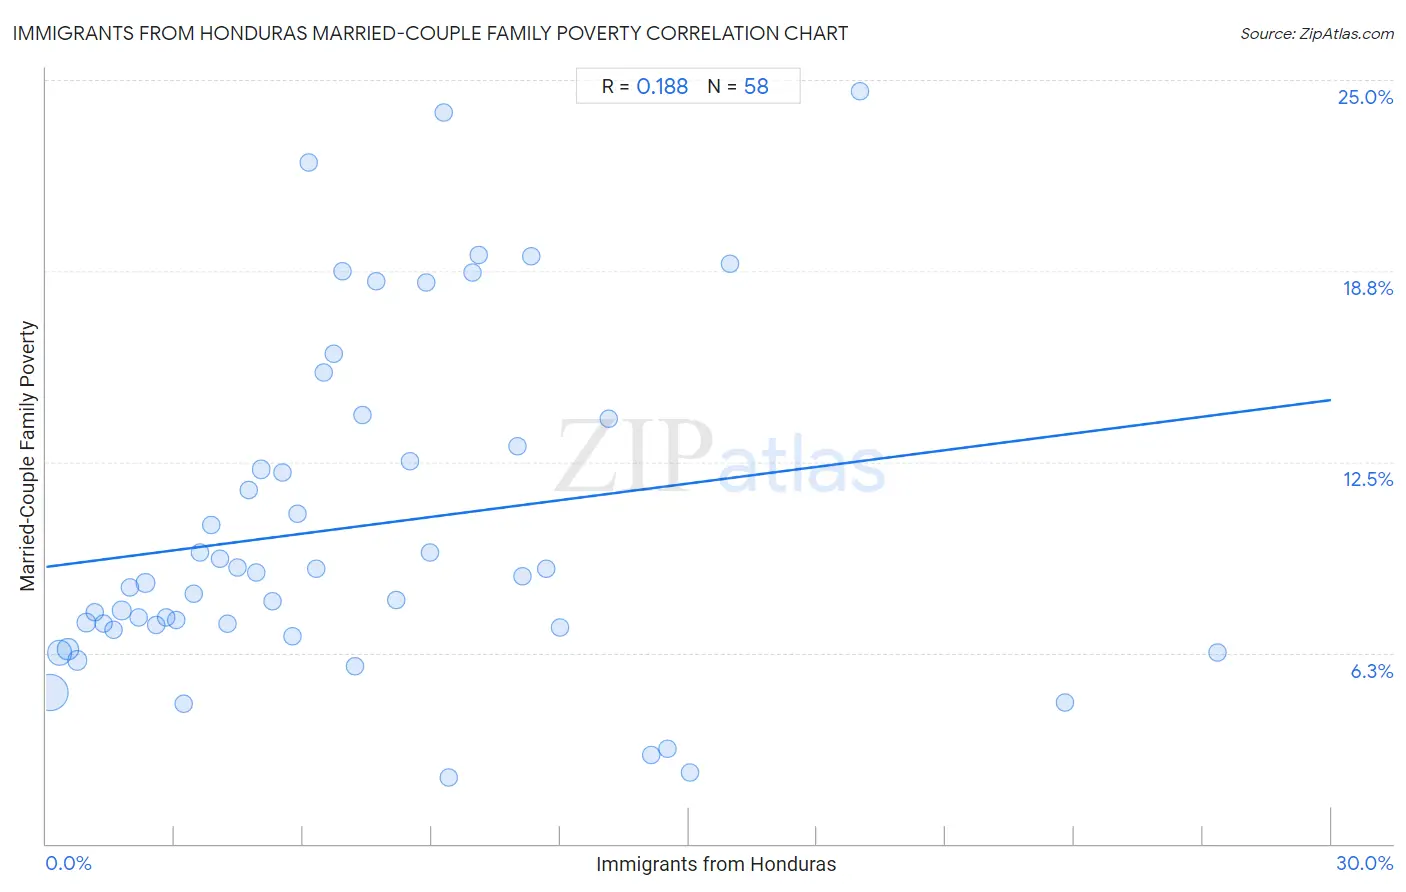
Immigrants from Honduras Married-Couple Family Poverty Correlation Chart
The statistical analysis conducted on geographies consisting of 321,084,315 people shows a poor positive correlation between the proportion of Immigrants from Honduras and poverty level among married-couple families in the United States with a correlation coefficient (R) of 0.188 and weighted average of 7.3%. On average, for every 1% (one percent) increase in Immigrants from Honduras within a typical geography, there is an increase of 0.18% in poverty level among married-couple families.
It is essential to understand that the correlation between the percentage of Immigrants from Honduras and poverty level among married-couple families does not imply a direct cause-and-effect relationship. It remains uncertain whether the presence of Immigrants from Honduras influences an upward or downward trend in the level of poverty level among married-couple families within an area, or if Immigrants from Honduras simply ended up residing in those areas with higher or lower levels of poverty level among married-couple families due to other factors.
Demographics Similar to Immigrants from Honduras by Married-Couple Family Poverty
In terms of married-couple family poverty, the demographic groups most similar to Immigrants from Honduras are Immigrants from Caribbean (7.3%, a difference of 0.030%), Immigrants from Grenada (7.3%, a difference of 0.79%), Vietnamese (7.4%, a difference of 1.1%), Immigrants from Central America (7.4%, a difference of 1.1%), and Immigrants from Cuba (7.5%, a difference of 1.7%).
| Demographics | Rating | Rank | Married-Couple Family Poverty |
| Inupiat | 0.0 /100 | #315 | Tragic 7.1% |
| Hondurans | 0.0 /100 | #316 | Tragic 7.2% |
| Mexicans | 0.0 /100 | #317 | Tragic 7.2% |
| Immigrants from Guatemala | 0.0 /100 | #318 | Tragic 7.2% |
| Immigrants from Latin America | 0.0 /100 | #319 | Tragic 7.2% |
| Immigrants from Grenada | 0.0 /100 | #320 | Tragic 7.3% |
| Immigrants from Caribbean | 0.0 /100 | #321 | Tragic 7.3% |
| Immigrants from Honduras | 0.0 /100 | #322 | Tragic 7.3% |
| Vietnamese | 0.0 /100 | #323 | Tragic 7.4% |
| Immigrants from Central America | 0.0 /100 | #324 | Tragic 7.4% |
| Immigrants from Cuba | 0.0 /100 | #325 | Tragic 7.5% |
| Immigrants from Bangladesh | 0.0 /100 | #326 | Tragic 7.5% |
| Hispanics or Latinos | 0.0 /100 | #327 | Tragic 7.5% |
| Immigrants from Mexico | 0.0 /100 | #328 | Tragic 7.6% |
| Natives/Alaskans | 0.0 /100 | #329 | Tragic 8.2% |
Immigrants from Honduras Married-Couple Family Poverty Correlation Summary
| Measurement | Immigrants from Honduras Data | Married-Couple Family Poverty Data |
| Minimum | 0.086% | 2.2% |
| Maximum | 27.3% | 24.6% |
| Range | 27.3% | 22.4% |
| Mean | 7.2% | 10.4% |
| Median | 6.0% | 8.6% |
| Interquartile 25% (IQ1) | 3.0% | 7.1% |
| Interquartile 75% (IQ3) | 9.9% | 13.0% |
| Interquartile Range (IQR) | 6.9% | 5.9% |
| Standard Deviation (Sample) | 5.6% | 5.5% |
| Standard Deviation (Population) | 5.6% | 5.4% |
Correlation Details
| Immigrants from Honduras Percentile | Sample Size | Married-Couple Family Poverty |
[ 0.0% - 0.5% ] 0.086% | 174,512,770 | 5.0% |
[ 0.0% - 0.5% ] 0.31% | 65,602,383 | 6.2% |
[ 0.5% - 1.0% ] 0.50% | 26,949,105 | 6.4% |
[ 0.5% - 1.0% ] 0.72% | 15,478,141 | 6.0% |
[ 0.5% - 1.0% ] 0.94% | 9,482,867 | 7.2% |
[ 1.0% - 1.5% ] 1.13% | 4,875,754 | 7.6% |
[ 1.0% - 1.5% ] 1.34% | 4,139,977 | 7.2% |
[ 1.5% - 2.0% ] 1.57% | 3,884,346 | 7.0% |
[ 1.5% - 2.0% ] 1.76% | 2,948,219 | 7.6% |
[ 1.5% - 2.0% ] 1.96% | 1,704,608 | 8.4% |
[ 2.0% - 2.5% ] 2.17% | 1,300,544 | 7.4% |
[ 2.0% - 2.5% ] 2.32% | 3,446,661 | 8.5% |
[ 2.5% - 3.0% ] 2.57% | 1,108,578 | 7.2% |
[ 2.5% - 3.0% ] 2.79% | 1,254,383 | 7.4% |
[ 3.0% - 3.5% ] 3.02% | 411,315 | 7.3% |
[ 3.0% - 3.5% ] 3.22% | 306,089 | 4.6% |
[ 3.0% - 3.5% ] 3.44% | 175,989 | 8.2% |
[ 3.5% - 4.0% ] 3.60% | 453,463 | 9.5% |
[ 3.5% - 4.0% ] 3.87% | 222,403 | 10.4% |
[ 4.0% - 4.5% ] 4.04% | 257,095 | 9.3% |
[ 4.0% - 4.5% ] 4.24% | 343,115 | 7.2% |
[ 4.0% - 4.5% ] 4.45% | 235,811 | 9.0% |
[ 4.5% - 5.0% ] 4.73% | 52,505 | 11.6% |
[ 4.5% - 5.0% ] 4.90% | 110,575 | 8.9% |
[ 5.0% - 5.5% ] 5.02% | 553,558 | 12.3% |
[ 5.0% - 5.5% ] 5.30% | 60,562 | 7.9% |
[ 5.5% - 6.0% ] 5.52% | 136,073 | 12.1% |
[ 5.5% - 6.0% ] 5.76% | 193,302 | 6.8% |
[ 5.5% - 6.0% ] 5.86% | 132,426 | 10.8% |
[ 6.0% - 6.5% ] 6.11% | 37,205 | 22.3% |
[ 6.0% - 6.5% ] 6.30% | 54,266 | 9.0% |
[ 6.0% - 6.5% ] 6.48% | 76,752 | 15.4% |
[ 6.5% - 7.0% ] 6.70% | 11,795 | 16.0% |
[ 6.5% - 7.0% ] 6.93% | 2,453 | 18.7% |
[ 7.0% - 7.5% ] 7.20% | 32,011 | 5.8% |
[ 7.0% - 7.5% ] 7.38% | 45,797 | 14.0% |
[ 7.5% - 8.0% ] 7.71% | 33,614 | 18.4% |
[ 8.0% - 8.5% ] 8.17% | 45,390 | 8.0% |
[ 8.0% - 8.5% ] 8.48% | 37,222 | 12.5% |
[ 8.5% - 9.0% ] 8.87% | 46,123 | 18.4% |
[ 8.5% - 9.0% ] 8.95% | 20,266 | 9.6% |
[ 9.0% - 9.5% ] 9.27% | 52,360 | 24.0% |
[ 9.0% - 9.5% ] 9.39% | 277 | 2.2% |
[ 9.5% - 10.0% ] 9.95% | 46,266 | 18.7% |
[ 10.0% - 10.5% ] 10.09% | 2,547 | 19.3% |
[ 11.0% - 11.5% ] 11.01% | 8,750 | 13.0% |
[ 11.0% - 11.5% ] 11.13% | 66,326 | 8.8% |
[ 11.0% - 11.5% ] 11.32% | 59,121 | 19.2% |
[ 11.5% - 12.0% ] 11.66% | 16,743 | 9.0% |
[ 12.0% - 12.5% ] 12.01% | 26,105 | 7.1% |
[ 13.0% - 13.5% ] 13.13% | 7,385 | 13.9% |
[ 14.0% - 14.5% ] 14.14% | 6,947 | 2.9% |
[ 14.5% - 15.0% ] 14.50% | 1,303 | 3.1% |
[ 15.0% - 15.5% ] 15.03% | 3,559 | 2.3% |
[ 15.5% - 16.0% ] 15.95% | 8,989 | 19.0% |
[ 18.5% - 19.0% ] 19.00% | 679 | 24.6% |
[ 23.5% - 24.0% ] 23.77% | 774 | 4.6% |
[ 27.0% - 27.5% ] 27.34% | 673 | 6.2% |