Spanish American Married-Couple Family Poverty

COMPARE

Spanish American
Race
Ancestry
AfghanAfricanAlaska NativeAlaskan AthabascanAlbanianAleutAlsatianAmericanApacheArabArapahoArgentineanArmenianAssyrian/Chaldean/SyriacAustralianAustrianBahamianBangladeshiBarbadianBasqueBelgianBelizeanBermudanBhutaneseBlackfeetBolivianBrazilianBritishBritish West IndianBulgarianBurmeseCajunCambodianCanadianCape VerdeanCarpatho RusynCelticCentral AmericanCentral American IndianCherokeeCheyenneChickasawChileanChineseChippewaChoctawColombianColvilleComancheCosta RicanCreeCreekCroatianCrowCubanCypriotCzechCzechoslovakianDanishDelawareDominicanDutchDutch West IndianEastern EuropeanEcuadorianEgyptianEnglishEstonianEthiopianEuropeanFijianFilipinoFinnishFrenchFrench American IndianFrench CanadianGermanGerman RussianGhanaianGreekGuamanian/ChamorroGuatemalanGuyaneseHaitianHmongHonduranHopiHoumaHungarianIcelanderIndian (Asian)IndonesianInupiatIranianIraqiIrishIroquoisIsraeliItalianJamaicanJapaneseJordanianKenyanKiowaKoreanLaotianLatvianLebaneseLiberianLithuanianLumbeeLuxembourgerMacedonianMalaysianMalteseMarshalleseMenomineeMexicanMexican American IndianMongolianMoroccanNative HawaiianNavajoNepaleseNew ZealanderNicaraguanNigerianNorthern EuropeanNorwegianOkinawanOsageOttawaPaiutePakistaniPalestinianPanamanianParaguayanPennsylvania GermanPeruvianPimaPolishPortuguesePotawatomiPuebloPuerto RicanPuget Sound SalishRomanianRussianSalvadoranSamoanScandinavianScotch-IrishScottishSeminoleSenegaleseSerbianShoshoneSierra LeoneanSiouxSlavicSlovakSloveneSomaliSouth AfricanSouth AmericanSouth American IndianSoviet UnionSpaniardSpanishSpanish AmericanSpanish American IndianSri LankanSubsaharan AfricanSudaneseSwedishSwissSyrianTaiwaneseThaiTlingit-HaidaTohono O'OdhamTonganTrinidadian and TobagonianTsimshianTurkishU.S. Virgin IslanderUgandanUkrainianUruguayanUteVenezuelanVietnameseWelshWest IndianYakamaYaquiYugoslavianYumanYup'ikZimbabwean
Immigration
NonimmigrantsImmigrantsAfghanistanAfricaAlbaniaArgentinaArmeniaAsiaAustraliaAustriaBahamasBangladeshBarbadosBelarusBelgiumBelizeBoliviaBosnia and HerzegovinaBrazilBulgariaBurma/MyanmarCabo VerdeCambodiaCameroonCanadaCaribbeanCentral AmericaChileChinaColombiaCongoCosta RicaCroatiaCubaCzechoslovakiaDenmarkDominicaDominican RepublicEastern AfricaEastern AsiaEastern EuropeEcuadorEgyptEl SalvadorEnglandEritreaEthiopiaEuropeFijiFranceGermanyGhanaGreeceGrenadaGuatemalaGuyanaHaitiHondurasHong KongHungaryIndiaIndonesiaIranIraqIrelandIsraelItalyJamaicaJapanJordanKazakhstanKenyaKoreaKuwaitLaosLatin AmericaLatviaLebanonLiberiaLithuaniaMalaysiaMexicoMicronesiaMiddle AfricaMoldovaMoroccoNepalNetherlandsNicaraguaNigeriaNorth AmericaNorth MacedoniaNorthern AfricaNorthern EuropeNorwayOceaniaPakistanPanamaPeruPhilippinesPolandPortugalRomaniaRussiaSaudi ArabiaScotlandSenegalSerbiaSierra LeoneSingaporeSomaliaSouth AfricaSouth AmericaSouth Central AsiaSouth Eastern AsiaSouthern EuropeSpainSri LankaSt. Vincent and the GrenadinesSudanSwedenSwitzerlandSyriaTaiwanThailandTrinidad and TobagoTurkeyUgandaUkraineUruguayUzbekistanVenezuelaVietnamWest IndiesWestern AfricaWestern AsiaWestern EuropeYemenZaireZimbabweAzores
Select to Compare
Race
Ancestry
AfghanAfricanAlaska NativeAlaskan AthabascanAlbanianAleutAlsatianAmericanApacheArabArapahoArgentineanArmenianAssyrian/Chaldean/SyriacAustralianAustrianBahamianBangladeshiBarbadianBasqueBelgianBelizeanBermudanBhutaneseBlackfeetBolivianBrazilianBritishBritish West IndianBulgarianBurmeseCajunCambodianCanadianCape VerdeanCarpatho RusynCelticCentral AmericanCentral American IndianCherokeeCheyenneChickasawChileanChineseChippewaChoctawColombianColvilleComancheCosta RicanCreeCreekCroatianCrowCubanCypriotCzechCzechoslovakianDanishDelawareDominicanDutchDutch West IndianEastern EuropeanEcuadorianEgyptianEnglishEstonianEthiopianEuropeanFijianFilipinoFinnishFrenchFrench American IndianFrench CanadianGermanGerman RussianGhanaianGreekGuamanian/ChamorroGuatemalanGuyaneseHaitianHmongHonduranHopiHoumaHungarianIcelanderIndian (Asian)IndonesianInupiatIranianIraqiIrishIroquoisIsraeliItalianJamaicanJapaneseJordanianKenyanKiowaKoreanLaotianLatvianLebaneseLiberianLithuanianLumbeeLuxembourgerMacedonianMalaysianMalteseMarshalleseMenomineeMexicanMexican American IndianMongolianMoroccanNative HawaiianNavajoNepaleseNew ZealanderNicaraguanNigerianNorthern EuropeanNorwegianOkinawanOsageOttawaPaiutePakistaniPalestinianPanamanianParaguayanPennsylvania GermanPeruvianPimaPolishPortuguesePotawatomiPuebloPuerto RicanPuget Sound SalishRomanianRussianSalvadoranSamoanScandinavianScotch-IrishScottishSeminoleSenegaleseSerbianShoshoneSierra LeoneanSiouxSlavicSlovakSloveneSomaliSouth AfricanSouth AmericanSouth American IndianSoviet UnionSpaniardSpanishSpanish American IndianSri LankanSubsaharan AfricanSudaneseSwedishSwissSyrianTaiwaneseThaiTlingit-HaidaTohono O'OdhamTonganTrinidadian and TobagonianTsimshianTurkishU.S. Virgin IslanderUgandanUkrainianUruguayanUteVenezuelanVietnameseWelshWest IndianYakamaYaquiYugoslavianYumanYup'ikZimbabwean
Immigration
NonimmigrantsImmigrantsAfghanistanAfricaAlbaniaArgentinaArmeniaAsiaAustraliaAustriaBahamasBangladeshBarbadosBelarusBelgiumBelizeBoliviaBosnia and HerzegovinaBrazilBulgariaBurma/MyanmarCabo VerdeCambodiaCameroonCanadaCaribbeanCentral AmericaChileChinaColombiaCongoCosta RicaCroatiaCubaCzechoslovakiaDenmarkDominicaDominican RepublicEastern AfricaEastern AsiaEastern EuropeEcuadorEgyptEl SalvadorEnglandEritreaEthiopiaEuropeFijiFranceGermanyGhanaGreeceGrenadaGuatemalaGuyanaHaitiHondurasHong KongHungaryIndiaIndonesiaIranIraqIrelandIsraelItalyJamaicaJapanJordanKazakhstanKenyaKoreaKuwaitLaosLatin AmericaLatviaLebanonLiberiaLithuaniaMalaysiaMexicoMicronesiaMiddle AfricaMoldovaMoroccoNepalNetherlandsNicaraguaNigeriaNorth AmericaNorth MacedoniaNorthern AfricaNorthern EuropeNorwayOceaniaPakistanPanamaPeruPhilippinesPolandPortugalRomaniaRussiaSaudi ArabiaScotlandSenegalSerbiaSierra LeoneSingaporeSomaliaSouth AfricaSouth AmericaSouth Central AsiaSouth Eastern AsiaSouthern EuropeSpainSri LankaSt. Vincent and the GrenadinesSudanSwedenSwitzerlandSyriaTaiwanThailandTrinidad and TobagoTurkeyUgandaUkraineUruguayUzbekistanVenezuelaVietnamWest IndiesWestern AfricaWestern AsiaWestern EuropeYemenZaireZimbabweAzores
Married-Couple Family Poverty
Income
Poverty
Unemployment
Labor Participation
Family Structure
Vehicle Availability
Education Level
Disability

Spanish American Married-Couple Family Poverty
Tragic

6.2%
POVERTY | MARRIED-COUPLE FAMILIES
0.2/ 100
METRIC RATING
267th/ 347
METRIC RANK

Spanish American Married-Couple Family Poverty Correlation Chart

The statistical analysis conducted on geographies consisting of 103,037,673 people shows a weak positive correlation between the proportion of Spanish Americans and poverty level among married-couple families in the United States with a correlation coefficient (R) of 0.287 and weighted average of 6.2%. On average, for every 1% (one percent) increase in Spanish Americans within a typical geography, there is an increase of 0.42% in poverty level among married-couple families.
Spanish American Married-Couple Family Poverty
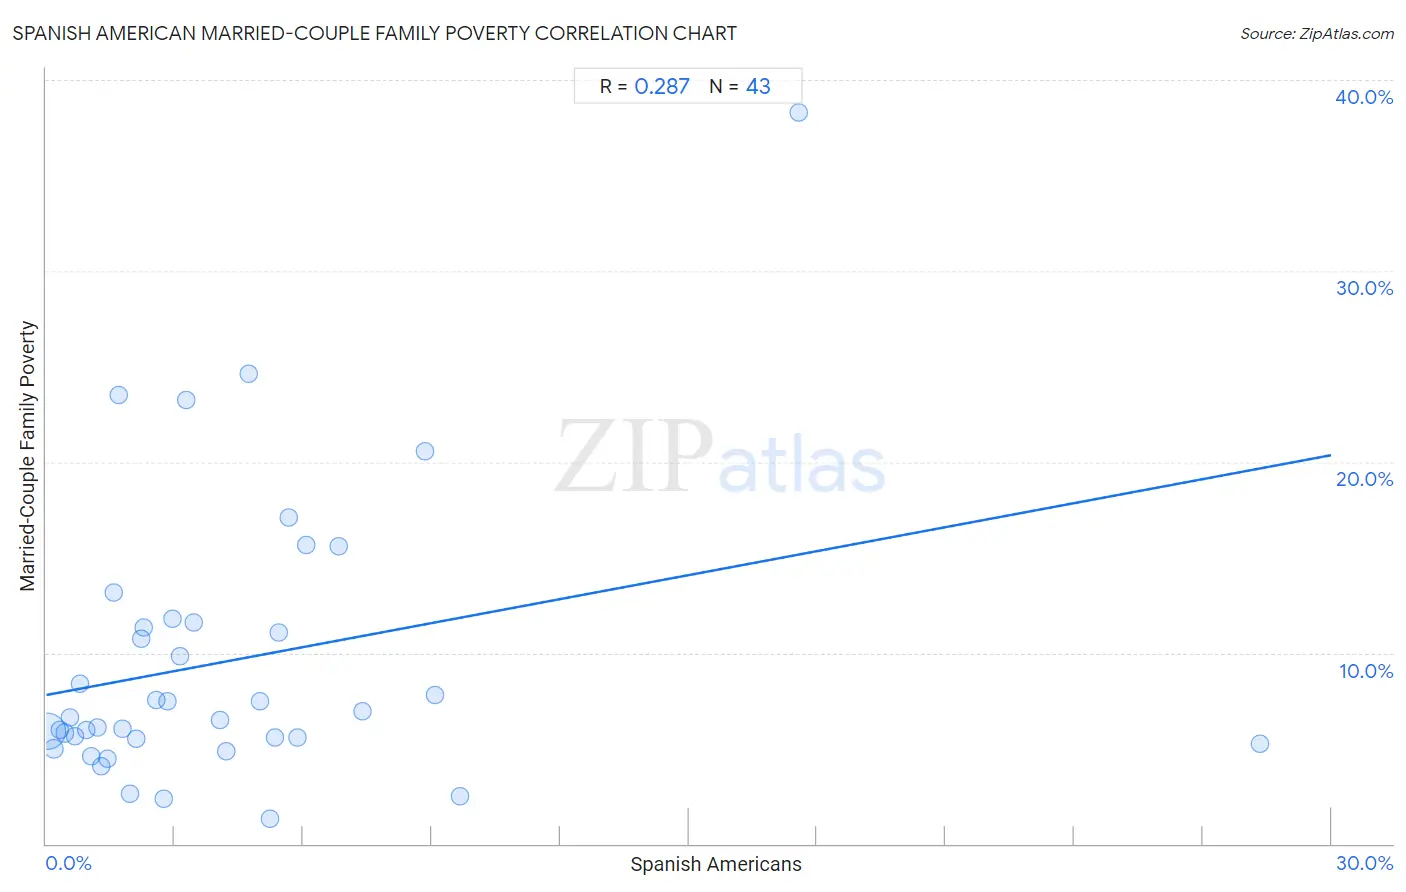
It is essential to understand that the correlation between the percentage of Spanish Americans and poverty level among married-couple families does not imply a direct cause-and-effect relationship. It remains uncertain whether the presence of Spanish Americans influences an upward or downward trend in the level of poverty level among married-couple families within an area, or if Spanish Americans simply ended up residing in those areas with higher or lower levels of poverty level among married-couple families due to other factors.

Demographics Similar to Spanish Americans by Married-Couple Family Poverty

In terms of married-couple family poverty, the demographic groups most similar to Spanish Americans are Creek (6.2%, a difference of 0.050%), Blackfeet (6.2%, a difference of 0.13%), Alaska Native (6.2%, a difference of 0.48%), Immigrants from Congo (6.1%, a difference of 0.56%), and Immigrants from West Indies (6.2%, a difference of 0.65%).
DemographicsRating | RankMarried-Couple Family Poverty
Jamaicans
0.3
/100
|
#260
Tragic
6.1%
Senegalese
0.3
/100
|
#261
Tragic
6.1%
Shoshone
0.3
/100
|
#262
Tragic
6.1%
Immigrants from Senegal
0.3
/100
|
#263
Tragic
6.1%
Immigrants from Congo
0.2
/100
|
#264
Tragic
6.1%
Blackfeet
0.2
/100
|
#265
Tragic
6.2%
Creek
0.2
/100
|
#266
Tragic
6.2%
Spanish Americans
0.2
/100
|
#267
Tragic
6.2%
Alaska Natives
0.2
/100
|
#268
Tragic
6.2%
Immigrants from West Indies
0.1
/100
|
#269
Tragic
6.2%
Immigrants from Jamaica
0.1
/100
|
#270
Tragic
6.2%
Immigrants from Bahamas
0.1
/100
|
#271
Tragic
6.2%
Trinidadians and Tobagonians
0.1
/100
|
#272
Tragic
6.2%
Colville
0.1
/100
|
#273
Tragic
6.3%
Barbadians
0.1
/100
|
#274
Tragic
6.3%

Spanish American Married-Couple Family Poverty Correlation Summary

MeasurementSpanish American DataMarried-Couple Family Poverty Data
Minimum0.023%1.3%
Maximum28.3%38.3%
Range28.3%37.0%
Mean4.2%9.6%
Median2.8%6.6%
Interquartile 25% (IQ1)1.3%5.5%
Interquartile 75% (IQ3)5.4%11.6%
Interquartile Range (IQR)4.1%6.0%
Standard Deviation (Sample)5.0%7.3%
Standard Deviation (Population)5.0%7.3%

Correlation Details

Spanish American PercentileSample SizeMarried-Couple Family Poverty
[
0.0%
-
0.5%
]
0.023%
92,586,3465.9%
[
0.0%
-
0.5%
]
0.17%
5,505,1754.9%
[
0.0%
-
0.5%
]
0.31%
1,671,3506.0%
[
0.0%
-
0.5%
]
0.44%
1,668,0065.8%
[
0.5%
-
1.0%
]
0.55%
465,8566.6%
[
0.5%
-
1.0%
]
0.68%
294,8025.6%
[
0.5%
-
1.0%
]
0.80%
228,3708.4%
[
0.5%
-
1.0%
]
0.95%
73,3185.9%
[
1.0%
-
1.5%
]
1.05%
167,5534.6%
[
1.0%
-
1.5%
]
1.21%
108,7736.1%
[
1.0%
-
1.5%
]
1.30%
34,2054.1%
[
1.0%
-
1.5%
]
1.43%
61,4744.4%
[
1.5%
-
2.0%
]
1.59%
38,57413.2%
[
1.5%
-
2.0%
]
1.69%
9,87823.5%
[
1.5%
-
2.0%
]
1.78%
23,4746.0%
[
1.5%
-
2.0%
]
1.94%
2,2662.6%
[
2.0%
-
2.5%
]
2.09%
10,4585.5%
[
2.0%
-
2.5%
]
2.21%
11,70010.7%
[
2.0%
-
2.5%
]
2.28%
4,38711.3%
[
2.5%
-
3.0%
]
2.58%
9,1657.5%
[
2.5%
-
3.0%
]
2.75%
1,0192.3%
[
2.5%
-
3.0%
]
2.82%
8,0837.5%
[
2.5%
-
3.0%
]
2.96%
5,57111.8%
[
3.0%
-
3.5%
]
3.11%
7,2039.8%
[
3.0%
-
3.5%
]
3.27%
48923.3%
[
3.0%
-
3.5%
]
3.44%
6,78111.6%
[
4.0%
-
4.5%
]
4.07%
1,4026.5%
[
4.0%
-
4.5%
]
4.20%
1,9534.8%
[
4.5%
-
5.0%
]
4.73%
2,49624.6%
[
4.5%
-
5.0%
]
4.99%
2,3447.5%
[
5.0%
-
5.5%
]
5.21%
2,3981.3%
[
5.0%
-
5.5%
]
5.33%
1,5015.5%
[
5.0%
-
5.5%
]
5.42%
4,22411.1%
[
5.5%
-
6.0%
]
5.65%
2,95517.1%
[
5.5%
-
6.0%
]
5.86%
5,1565.6%
[
6.0%
-
6.5%
]
6.08%
14815.6%
[
6.5%
-
7.0%
]
6.84%
3,21715.6%
[
7.0%
-
7.5%
]
7.39%
1,3817.0%
[
8.5%
-
9.0%
]
8.83%
63420.6%
[
9.0%
-
9.5%
]
9.09%
2,8067.8%
[
9.5%
-
10.0%
]
9.65%
2282.5%
[
17.5%
-
18.0%
]
17.56%
42738.3%
[
28.0%
-
28.5%
]
28.35%
1275.3%