Kenyan College, 1 year or more
COMPARE
Kenyan
Select to Compare
College, 1 year or more
Kenyan College, 1 year or more
60.5%
COLLEGE, 1 YEAR OR MORE
79.0/ 100
METRIC RATING
148th/ 347
METRIC RANK
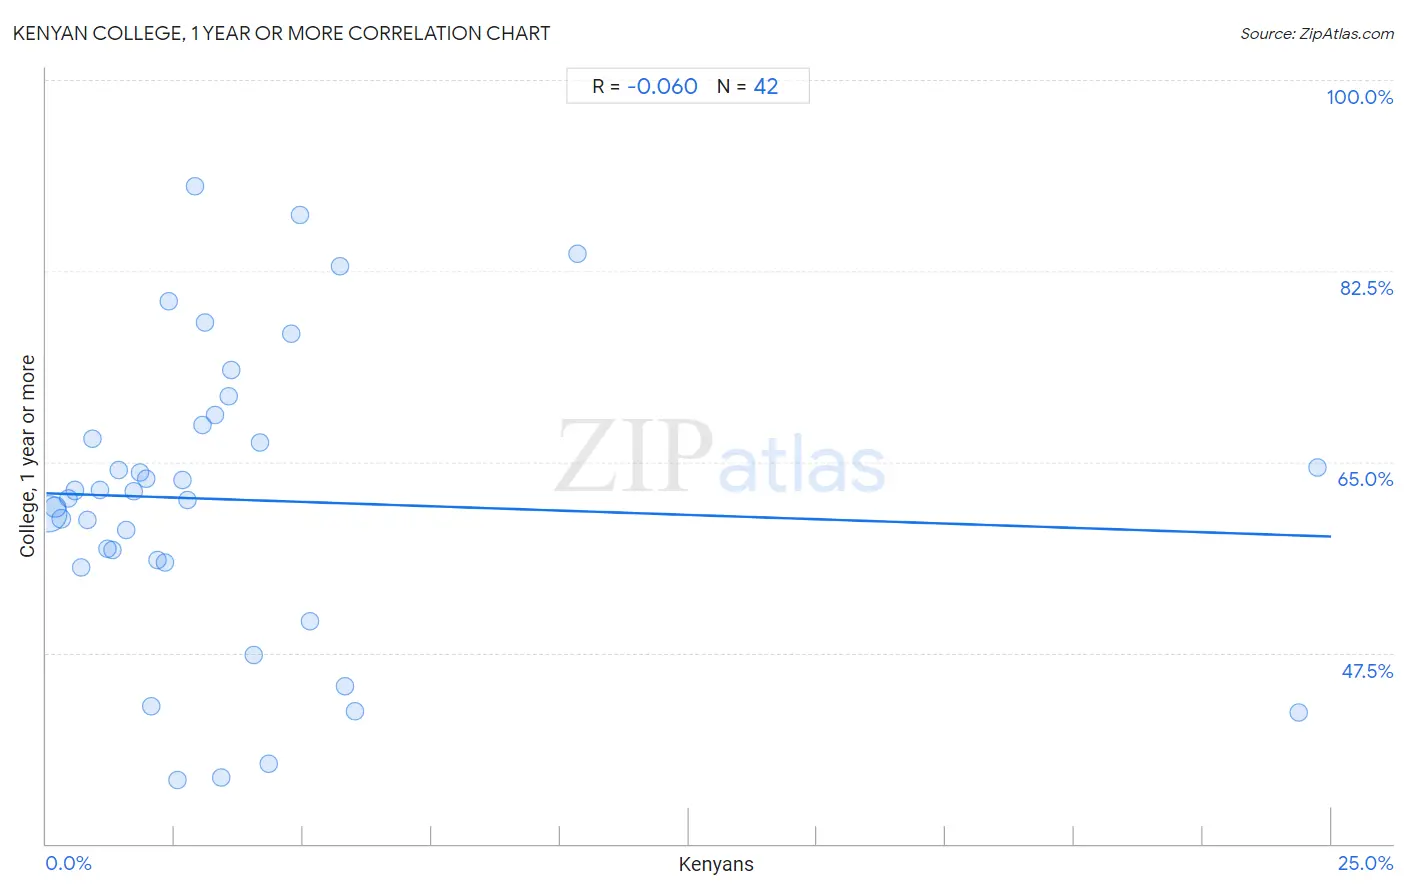
Kenyan College, 1 year or more Correlation Chart
The statistical analysis conducted on geographies consisting of 168,244,481 people shows a slight negative correlation between the proportion of Kenyans and percentage of population with at least college, 1 year or more education in the United States with a correlation coefficient (R) of -0.060 and weighted average of 60.5%. On average, for every 1% (one percent) increase in Kenyans within a typical geography, there is a decrease of 0.16% in percentage of population with at least college, 1 year or more education.
It is essential to understand that the correlation between the percentage of Kenyans and percentage of population with at least college, 1 year or more education does not imply a direct cause-and-effect relationship. It remains uncertain whether the presence of Kenyans influences an upward or downward trend in the level of percentage of population with at least college, 1 year or more education within an area, or if Kenyans simply ended up residing in those areas with higher or lower levels of percentage of population with at least college, 1 year or more education due to other factors.
Demographics Similar to Kenyans by College, 1 year or more
In terms of college, 1 year or more, the demographic groups most similar to Kenyans are Brazilian (60.5%, a difference of 0.0%), Immigrants from Kenya (60.5%, a difference of 0.010%), Immigrants from Sudan (60.4%, a difference of 0.090%), Albanian (60.4%, a difference of 0.090%), and Scottish (60.5%, a difference of 0.10%).
| Demographics | Rating | Rank | College, 1 year or more |
| Immigrants from Afghanistan | 83.1 /100 | #141 | Excellent 60.7% |
| Poles | 82.8 /100 | #142 | Excellent 60.7% |
| Canadians | 82.7 /100 | #143 | Excellent 60.6% |
| Czechs | 81.9 /100 | #144 | Excellent 60.6% |
| Slavs | 81.1 /100 | #145 | Excellent 60.6% |
| Scottish | 80.2 /100 | #146 | Excellent 60.5% |
| Immigrants from Kenya | 79.1 /100 | #147 | Good 60.5% |
| Kenyans | 79.0 /100 | #148 | Good 60.5% |
| Brazilians | 79.0 /100 | #149 | Good 60.5% |
| Immigrants from Sudan | 77.8 /100 | #150 | Good 60.4% |
| Albanians | 77.8 /100 | #151 | Good 60.4% |
| Immigrants from Germany | 76.1 /100 | #152 | Good 60.3% |
| Sierra Leoneans | 74.1 /100 | #153 | Good 60.2% |
| Sudanese | 73.0 /100 | #154 | Good 60.2% |
| Moroccans | 72.9 /100 | #155 | Good 60.2% |
Kenyan College, 1 year or more Correlation Summary
| Measurement | Kenyan Data | College, 1 year or more Data |
| Minimum | 0.039% | 35.8% |
| Maximum | 24.7% | 90.2% |
| Range | 24.7% | 54.4% |
| Mean | 3.8% | 61.5% |
| Median | 2.6% | 62.0% |
| Interquartile 25% (IQ1) | 1.3% | 55.8% |
| Interquartile 75% (IQ3) | 4.2% | 68.3% |
| Interquartile Range (IQR) | 2.9% | 12.6% |
| Standard Deviation (Sample) | 5.1% | 13.5% |
| Standard Deviation (Population) | 5.0% | 13.4% |
Correlation Details
| Kenyan Percentile | Sample Size | College, 1 year or more |
[ 0.0% - 0.5% ] 0.039% | 126,538,541 | 60.3% |
[ 0.0% - 0.5% ] 0.17% | 21,807,122 | 60.8% |
[ 0.0% - 0.5% ] 0.30% | 8,432,744 | 59.8% |
[ 0.0% - 0.5% ] 0.43% | 4,726,962 | 61.6% |
[ 0.5% - 1.0% ] 0.55% | 2,142,529 | 62.4% |
[ 0.5% - 1.0% ] 0.67% | 1,169,136 | 55.3% |
[ 0.5% - 1.0% ] 0.80% | 975,254 | 59.7% |
[ 0.5% - 1.0% ] 0.90% | 446,933 | 67.2% |
[ 1.0% - 1.5% ] 1.05% | 433,161 | 62.5% |
[ 1.0% - 1.5% ] 1.19% | 330,826 | 57.0% |
[ 1.0% - 1.5% ] 1.30% | 231,594 | 56.9% |
[ 1.0% - 1.5% ] 1.41% | 210,333 | 64.3% |
[ 1.5% - 2.0% ] 1.56% | 192,252 | 58.8% |
[ 1.5% - 2.0% ] 1.69% | 100,838 | 62.4% |
[ 1.5% - 2.0% ] 1.82% | 30,100 | 64.0% |
[ 1.5% - 2.0% ] 1.95% | 131,069 | 63.5% |
[ 2.0% - 2.5% ] 2.05% | 69,612 | 42.7% |
[ 2.0% - 2.5% ] 2.17% | 85,059 | 56.0% |
[ 2.0% - 2.5% ] 2.31% | 63,729 | 55.8% |
[ 2.0% - 2.5% ] 2.38% | 6,863 | 79.8% |
[ 2.5% - 3.0% ] 2.56% | 586 | 35.8% |
[ 2.5% - 3.0% ] 2.65% | 32,186 | 63.4% |
[ 2.5% - 3.0% ] 2.75% | 8,230 | 61.5% |
[ 2.5% - 3.0% ] 2.90% | 3,966 | 90.2% |
[ 3.0% - 3.5% ] 3.03% | 14,756 | 68.3% |
[ 3.0% - 3.5% ] 3.10% | 8,580 | 77.8% |
[ 3.0% - 3.5% ] 3.29% | 2,034 | 69.3% |
[ 3.0% - 3.5% ] 3.40% | 2,764 | 36.1% |
[ 3.5% - 4.0% ] 3.56% | 2,473 | 71.0% |
[ 3.5% - 4.0% ] 3.59% | 3,785 | 73.5% |
[ 4.0% - 4.5% ] 4.03% | 4,488 | 47.3% |
[ 4.0% - 4.5% ] 4.15% | 9,822 | 66.8% |
[ 4.0% - 4.5% ] 4.32% | 2,474 | 37.3% |
[ 4.5% - 5.0% ] 4.77% | 9,332 | 76.8% |
[ 4.5% - 5.0% ] 4.94% | 324 | 87.6% |
[ 5.0% - 5.5% ] 5.13% | 4,995 | 50.4% |
[ 5.5% - 6.0% ] 5.71% | 4,728 | 83.0% |
[ 5.5% - 6.0% ] 5.82% | 3,214 | 44.4% |
[ 6.0% - 6.5% ] 6.01% | 183 | 42.1% |
[ 10.0% - 10.5% ] 10.33% | 368 | 84.0% |
[ 24.0% - 24.5% ] 24.37% | 439 | 42.0% |
[ 24.5% - 25.0% ] 24.74% | 97 | 64.5% |