Kenyan Disability

COMPARE

Kenyan
Race
Ancestry
AfghanAfricanAlaska NativeAlaskan AthabascanAlbanianAleutAlsatianAmericanApacheArabArapahoArgentineanArmenianAssyrian/Chaldean/SyriacAustralianAustrianBahamianBangladeshiBarbadianBasqueBelgianBelizeanBermudanBhutaneseBlackfeetBolivianBrazilianBritishBritish West IndianBulgarianBurmeseCajunCambodianCanadianCape VerdeanCarpatho RusynCelticCentral AmericanCentral American IndianCherokeeCheyenneChickasawChileanChineseChippewaChoctawColombianColvilleComancheCosta RicanCreeCreekCroatianCrowCubanCypriotCzechCzechoslovakianDanishDelawareDominicanDutchDutch West IndianEastern EuropeanEcuadorianEgyptianEnglishEstonianEthiopianEuropeanFijianFilipinoFinnishFrenchFrench American IndianFrench CanadianGermanGerman RussianGhanaianGreekGuamanian/ChamorroGuatemalanGuyaneseHaitianHmongHonduranHopiHoumaHungarianIcelanderIndian (Asian)IndonesianInupiatIranianIraqiIrishIroquoisIsraeliItalianJamaicanJapaneseJordanianKenyanKiowaKoreanLaotianLatvianLebaneseLiberianLithuanianLumbeeLuxembourgerMacedonianMalaysianMalteseMarshalleseMenomineeMexicanMexican American IndianMongolianMoroccanNative HawaiianNavajoNepaleseNew ZealanderNicaraguanNigerianNorthern EuropeanNorwegianOkinawanOsageOttawaPaiutePakistaniPalestinianPanamanianParaguayanPennsylvania GermanPeruvianPimaPolishPortuguesePotawatomiPuebloPuerto RicanPuget Sound SalishRomanianRussianSalvadoranSamoanScandinavianScotch-IrishScottishSeminoleSenegaleseSerbianShoshoneSierra LeoneanSiouxSlavicSlovakSloveneSomaliSouth AfricanSouth AmericanSouth American IndianSoviet UnionSpaniardSpanishSpanish AmericanSpanish American IndianSri LankanSubsaharan AfricanSudaneseSwedishSwissSyrianTaiwaneseThaiTlingit-HaidaTohono O'OdhamTonganTrinidadian and TobagonianTsimshianTurkishU.S. Virgin IslanderUgandanUkrainianUruguayanUteVenezuelanVietnameseWelshWest IndianYakamaYaquiYugoslavianYumanYup'ikZimbabwean
Immigration
NonimmigrantsImmigrantsAfghanistanAfricaAlbaniaArgentinaArmeniaAsiaAustraliaAustriaBahamasBangladeshBarbadosBelarusBelgiumBelizeBoliviaBosnia and HerzegovinaBrazilBulgariaBurma/MyanmarCabo VerdeCambodiaCameroonCanadaCaribbeanCentral AmericaChileChinaColombiaCongoCosta RicaCroatiaCubaCzechoslovakiaDenmarkDominicaDominican RepublicEastern AfricaEastern AsiaEastern EuropeEcuadorEgyptEl SalvadorEnglandEritreaEthiopiaEuropeFijiFranceGermanyGhanaGreeceGrenadaGuatemalaGuyanaHaitiHondurasHong KongHungaryIndiaIndonesiaIranIraqIrelandIsraelItalyJamaicaJapanJordanKazakhstanKenyaKoreaKuwaitLaosLatin AmericaLatviaLebanonLiberiaLithuaniaMalaysiaMexicoMicronesiaMiddle AfricaMoldovaMoroccoNepalNetherlandsNicaraguaNigeriaNorth AmericaNorth MacedoniaNorthern AfricaNorthern EuropeNorwayOceaniaPakistanPanamaPeruPhilippinesPolandPortugalRomaniaRussiaSaudi ArabiaScotlandSenegalSerbiaSierra LeoneSingaporeSomaliaSouth AfricaSouth AmericaSouth Central AsiaSouth Eastern AsiaSouthern EuropeSpainSri LankaSt. Vincent and the GrenadinesSudanSwedenSwitzerlandSyriaTaiwanThailandTrinidad and TobagoTurkeyUgandaUkraineUruguayUzbekistanVenezuelaVietnamWest IndiesWestern AfricaWestern AsiaWestern EuropeYemenZaireZimbabweAzores
Select to Compare
Race
Ancestry
AfghanAfricanAlaska NativeAlaskan AthabascanAlbanianAleutAlsatianAmericanApacheArabArapahoArgentineanArmenianAssyrian/Chaldean/SyriacAustralianAustrianBahamianBangladeshiBarbadianBasqueBelgianBelizeanBermudanBhutaneseBlackfeetBolivianBrazilianBritishBritish West IndianBulgarianBurmeseCajunCambodianCanadianCape VerdeanCarpatho RusynCelticCentral AmericanCentral American IndianCherokeeCheyenneChickasawChileanChineseChippewaChoctawColombianColvilleComancheCosta RicanCreeCreekCroatianCrowCubanCypriotCzechCzechoslovakianDanishDelawareDominicanDutchDutch West IndianEastern EuropeanEcuadorianEgyptianEnglishEstonianEthiopianEuropeanFijianFilipinoFinnishFrenchFrench American IndianFrench CanadianGermanGerman RussianGhanaianGreekGuamanian/ChamorroGuatemalanGuyaneseHaitianHmongHonduranHopiHoumaHungarianIcelanderIndian (Asian)IndonesianInupiatIranianIraqiIrishIroquoisIsraeliItalianJamaicanJapaneseJordanianKiowaKoreanLaotianLatvianLebaneseLiberianLithuanianLumbeeLuxembourgerMacedonianMalaysianMalteseMarshalleseMenomineeMexicanMexican American IndianMongolianMoroccanNative HawaiianNavajoNepaleseNew ZealanderNicaraguanNigerianNorthern EuropeanNorwegianOkinawanOsageOttawaPaiutePakistaniPalestinianPanamanianParaguayanPennsylvania GermanPeruvianPimaPolishPortuguesePotawatomiPuebloPuerto RicanPuget Sound SalishRomanianRussianSalvadoranSamoanScandinavianScotch-IrishScottishSeminoleSenegaleseSerbianShoshoneSierra LeoneanSiouxSlavicSlovakSloveneSomaliSouth AfricanSouth AmericanSouth American IndianSoviet UnionSpaniardSpanishSpanish AmericanSpanish American IndianSri LankanSubsaharan AfricanSudaneseSwedishSwissSyrianTaiwaneseThaiTlingit-HaidaTohono O'OdhamTonganTrinidadian and TobagonianTsimshianTurkishU.S. Virgin IslanderUgandanUkrainianUruguayanUteVenezuelanVietnameseWelshWest IndianYakamaYaquiYugoslavianYumanYup'ikZimbabwean
Immigration
NonimmigrantsImmigrantsAfghanistanAfricaAlbaniaArgentinaArmeniaAsiaAustraliaAustriaBahamasBangladeshBarbadosBelarusBelgiumBelizeBoliviaBosnia and HerzegovinaBrazilBulgariaBurma/MyanmarCabo VerdeCambodiaCameroonCanadaCaribbeanCentral AmericaChileChinaColombiaCongoCosta RicaCroatiaCubaCzechoslovakiaDenmarkDominicaDominican RepublicEastern AfricaEastern AsiaEastern EuropeEcuadorEgyptEl SalvadorEnglandEritreaEthiopiaEuropeFijiFranceGermanyGhanaGreeceGrenadaGuatemalaGuyanaHaitiHondurasHong KongHungaryIndiaIndonesiaIranIraqIrelandIsraelItalyJamaicaJapanJordanKazakhstanKenyaKoreaKuwaitLaosLatin AmericaLatviaLebanonLiberiaLithuaniaMalaysiaMexicoMicronesiaMiddle AfricaMoldovaMoroccoNepalNetherlandsNicaraguaNigeriaNorth AmericaNorth MacedoniaNorthern AfricaNorthern EuropeNorwayOceaniaPakistanPanamaPeruPhilippinesPolandPortugalRomaniaRussiaSaudi ArabiaScotlandSenegalSerbiaSierra LeoneSingaporeSomaliaSouth AfricaSouth AmericaSouth Central AsiaSouth Eastern AsiaSouthern EuropeSpainSri LankaSt. Vincent and the GrenadinesSudanSwedenSwitzerlandSyriaTaiwanThailandTrinidad and TobagoTurkeyUgandaUkraineUruguayUzbekistanVenezuelaVietnamWest IndiesWestern AfricaWestern AsiaWestern EuropeYemenZaireZimbabweAzores
Disability
Income
Poverty
Unemployment
Labor Participation
Family Structure
Vehicle Availability
Education Level
Disability

Kenyan Disability
Excellent

11.5%
DISABILITY
87.1/ 100
METRIC RATING
137th/ 347
METRIC RANK

Kenyan Disability Correlation Chart

The statistical analysis conducted on geographies consisting of 168,214,038 people shows a weak positive correlation between the proportion of Kenyans and percentage of population with a disability in the United States with a correlation coefficient (R) of 0.277 and weighted average of 11.5%. On average, for every 1% (one percent) increase in Kenyans within a typical geography, there is an increase of 0.32% in percentage of population with a disability.
Kenyan Disability
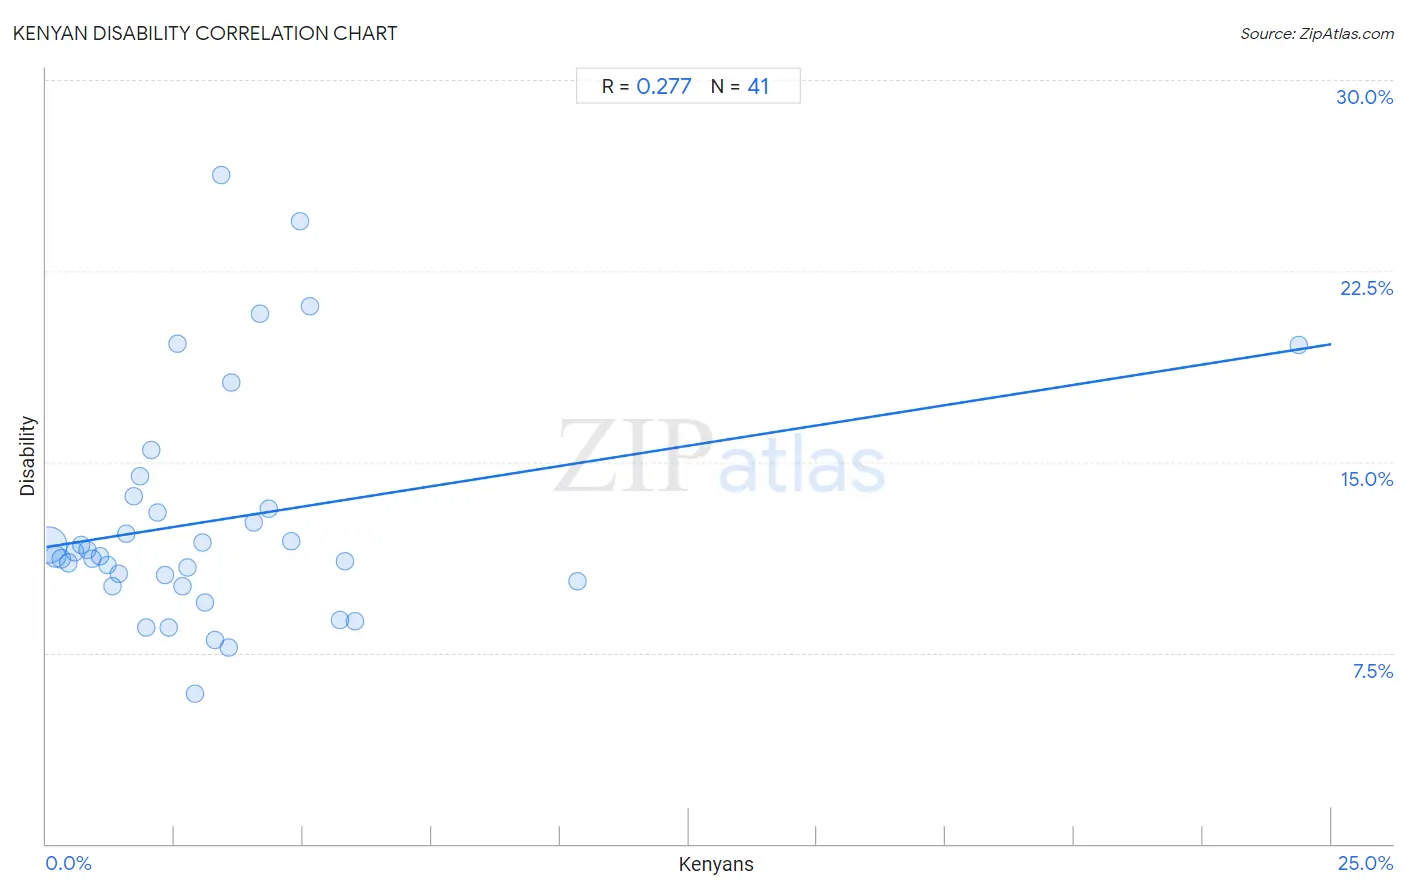
It is essential to understand that the correlation between the percentage of Kenyans and percentage of population with a disability does not imply a direct cause-and-effect relationship. It remains uncertain whether the presence of Kenyans influences an upward or downward trend in the level of percentage of population with a disability within an area, or if Kenyans simply ended up residing in those areas with higher or lower levels of percentage of population with a disability due to other factors.

Demographics Similar to Kenyans by Disability

In terms of disability, the demographic groups most similar to Kenyans are New Zealander (11.5%, a difference of 0.010%), Ghanaian (11.5%, a difference of 0.010%), Russian (11.5%, a difference of 0.030%), Immigrants from St. Vincent and the Grenadines (11.4%, a difference of 0.070%), and Ugandan (11.4%, a difference of 0.080%).
DemographicsRating | RankDisability
Latvians
89.8
/100
|
#130
Excellent
11.4%
Immigrants from Croatia
89.8
/100
|
#131
Excellent
11.4%
Immigrants from Africa
89.3
/100
|
#132
Excellent
11.4%
Arabs
89.1
/100
|
#133
Excellent
11.4%
Immigrants from Guyana
88.3
/100
|
#134
Excellent
11.4%
Ugandans
87.9
/100
|
#135
Excellent
11.4%
Immigrants from St. Vincent and the Grenadines
87.8
/100
|
#136
Excellent
11.4%
Kenyans
87.1
/100
|
#137
Excellent
11.5%
New Zealanders
87.0
/100
|
#138
Excellent
11.5%
Ghanaians
87.0
/100
|
#139
Excellent
11.5%
Russians
86.8
/100
|
#140
Excellent
11.5%
Immigrants from Grenada
86.1
/100
|
#141
Excellent
11.5%
Immigrants from Sudan
85.3
/100
|
#142
Excellent
11.5%
Moroccans
83.3
/100
|
#143
Excellent
11.5%
Australians
82.5
/100
|
#144
Excellent
11.5%

Kenyan Disability Correlation Summary

MeasurementKenyan DataDisability Data
Minimum0.039%5.9%
Maximum24.4%26.2%
Range24.3%20.3%
Mean3.3%12.7%
Median2.6%11.3%
Interquartile 25% (IQ1)1.2%10.2%
Interquartile 75% (IQ3)4.1%13.4%
Interquartile Range (IQR)2.8%3.2%
Standard Deviation (Sample)3.9%4.5%
Standard Deviation (Population)3.9%4.5%

Correlation Details

Kenyan PercentileSample SizeDisability
[
0.0%
-
0.5%
]
0.039%
126,525,09111.7%
[
0.0%
-
0.5%
]
0.17%
21,807,12211.3%
[
0.0%
-
0.5%
]
0.30%
8,422,25711.2%
[
0.0%
-
0.5%
]
0.43%
4,726,96211.0%
[
0.5%
-
1.0%
]
0.55%
2,142,52911.5%
[
0.5%
-
1.0%
]
0.67%
1,169,13611.8%
[
0.5%
-
1.0%
]
0.80%
971,85911.6%
[
0.5%
-
1.0%
]
0.90%
443,91911.2%
[
1.0%
-
1.5%
]
1.05%
433,16111.3%
[
1.0%
-
1.5%
]
1.19%
330,82610.9%
[
1.0%
-
1.5%
]
1.30%
231,59410.1%
[
1.0%
-
1.5%
]
1.41%
210,33310.6%
[
1.5%
-
2.0%
]
1.56%
192,25212.2%
[
1.5%
-
2.0%
]
1.69%
100,83813.6%
[
1.5%
-
2.0%
]
1.82%
30,10014.4%
[
1.5%
-
2.0%
]
1.95%
131,0698.5%
[
2.0%
-
2.5%
]
2.05%
69,61215.5%
[
2.0%
-
2.5%
]
2.17%
85,05913.0%
[
2.0%
-
2.5%
]
2.31%
63,72910.6%
[
2.0%
-
2.5%
]
2.38%
6,8638.5%
[
2.5%
-
3.0%
]
2.56%
58619.6%
[
2.5%
-
3.0%
]
2.65%
32,18610.1%
[
2.5%
-
3.0%
]
2.75%
8,23010.9%
[
2.5%
-
3.0%
]
2.90%
3,9665.9%
[
3.0%
-
3.5%
]
3.03%
14,75611.8%
[
3.0%
-
3.5%
]
3.10%
8,5809.5%
[
3.0%
-
3.5%
]
3.29%
2,0348.0%
[
3.0%
-
3.5%
]
3.40%
2,76426.2%
[
3.5%
-
4.0%
]
3.56%
2,4737.7%
[
3.5%
-
4.0%
]
3.59%
3,78518.1%
[
4.0%
-
4.5%
]
4.03%
4,48812.6%
[
4.0%
-
4.5%
]
4.15%
9,82220.8%
[
4.0%
-
4.5%
]
4.32%
2,47413.2%
[
4.5%
-
5.0%
]
4.77%
9,33211.9%
[
4.5%
-
5.0%
]
4.94%
32424.4%
[
5.0%
-
5.5%
]
5.13%
4,99521.1%
[
5.5%
-
6.0%
]
5.71%
4,7288.8%
[
5.5%
-
6.0%
]
5.82%
3,21411.1%
[
6.0%
-
6.5%
]
6.01%
1838.7%
[
10.0%
-
10.5%
]
10.33%
36810.3%
[
24.0%
-
24.5%
]
24.37%
43919.6%