Zip Codes with the Highest Percentage of Population Employed in Transportation & Warehousing in Alaska
RELATED REPORTS & OPTIONS
Transportation & Warehousing
Alaska
Compare Zip Codes
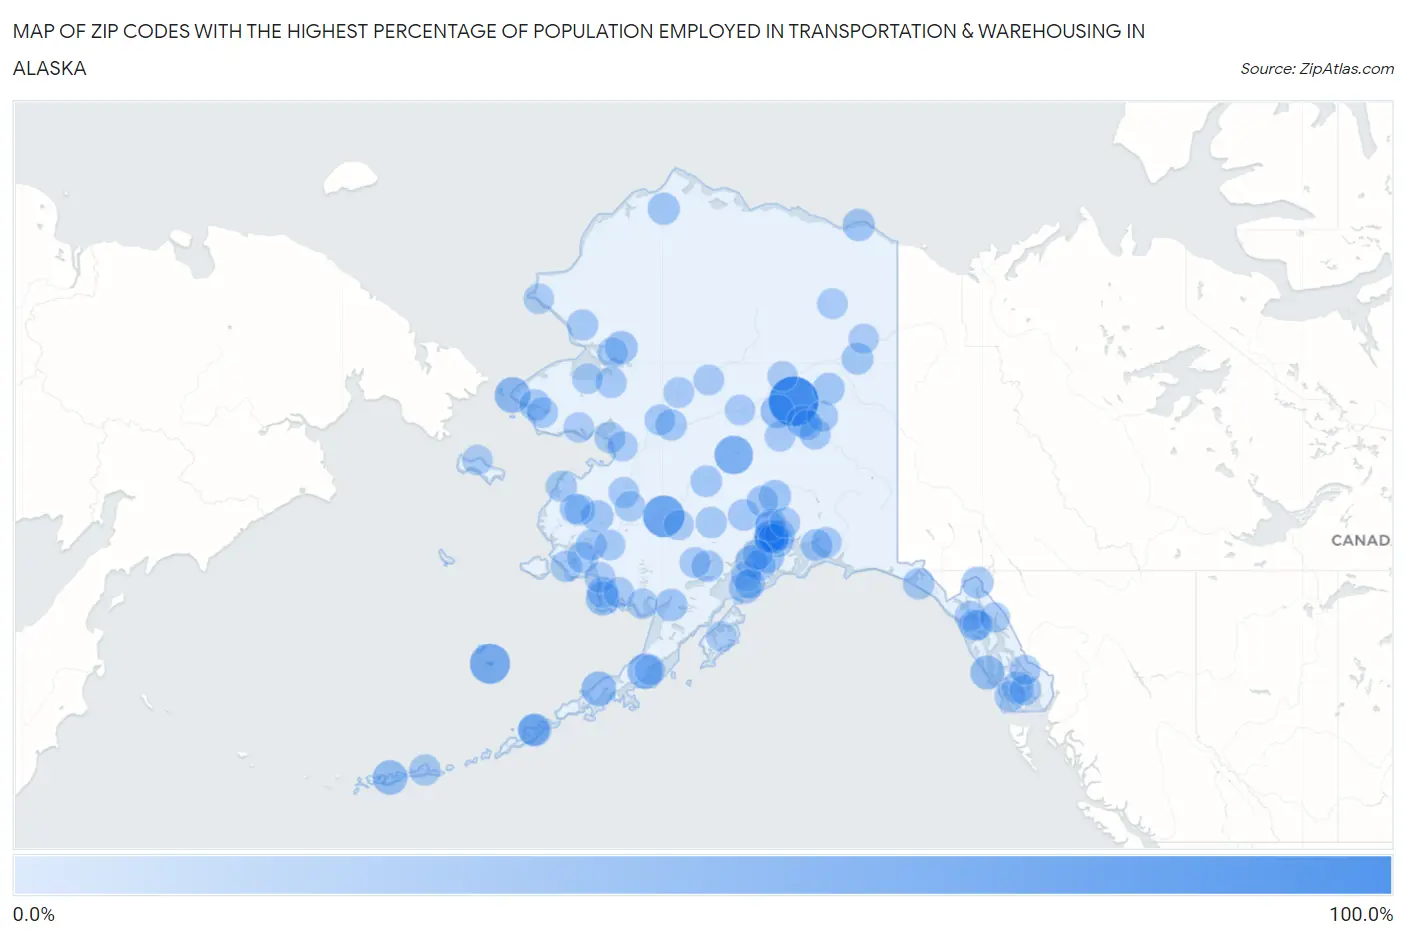
Map of Zip Codes with the Highest Percentage of Population Employed in Transportation & Warehousing in Alaska
0.0%
100.0%
Zip Codes with the Highest Percentage of Population Employed in Transportation & Warehousing in Alaska
| Zip Code | % Employed | vs State | vs National | |
| 1. | 99790 | 100.0% | 7.7%(+92.3)#1 | 4.9%(+95.1)#23 |
| 2. | 99656 | 60.0% | 7.7%(+52.3)#2 | 4.9%(+55.1)#52 |
| 3. | 99591 | 53.6% | 7.7%(+45.9)#3 | 4.9%(+48.6)#65 |
| 4. | 99757 | 45.5% | 7.7%(+37.8)#4 | 4.9%(+40.5)#101 |
| 5. | 99783 | 32.3% | 7.7%(+24.6)#5 | 4.9%(+27.4)#196 |
| 6. | 99548 | 30.0% | 7.7%(+22.3)#6 | 4.9%(+25.1)#227 |
| 7. | 99571 | 27.0% | 7.7%(+19.3)#7 | 4.9%(+22.1)#290 |
| 8. | 99546 | 26.9% | 7.7%(+19.3)#8 | 4.9%(+22.0)#292 |
| 9. | 99836 | 25.0% | 7.7%(+17.3)#9 | 4.9%(+20.1)#336 |
| 10. | 99758 | 23.1% | 7.7%(+15.4)#10 | 4.9%(+18.1)#394 |
| 11. | 99651 | 21.4% | 7.7%(+13.7)#11 | 4.9%(+16.5)#460 |
| 12. | 99572 | 21.1% | 7.7%(+13.4)#12 | 4.9%(+16.1)#476 |
| 13. | 99749 | 18.5% | 7.7%(+10.8)#13 | 4.9%(+13.6)#636 |
| 14. | 99685 | 18.4% | 7.7%(+10.7)#14 | 4.9%(+13.5)#647 |
| 15. | 99633 | 16.6% | 7.7%(+8.89)#15 | 4.9%(+11.6)#837 |
| 16. | 99676 | 16.5% | 7.7%(+8.85)#16 | 4.9%(+11.6)#843 |
| 17. | 99747 | 16.2% | 7.7%(+8.53)#17 | 4.9%(+11.3)#874 |
| 18. | 99663 | 16.2% | 7.7%(+8.50)#18 | 4.9%(+11.2)#879 |
| 19. | 99540 | 15.6% | 7.7%(+7.94)#19 | 4.9%(+10.7)#959 |
| 20. | 99791 | 15.2% | 7.7%(+7.53)#20 | 4.9%(+10.3)#1,018 |
| 21. | 99585 | 15.0% | 7.7%(+7.31)#21 | 4.9%(+10.1)#1,066 |
| 22. | 99610 | 14.2% | 7.7%(+6.53)#22 | 4.9%(+9.28)#1,233 |
| 23. | 99692 | 14.1% | 7.7%(+6.45)#23 | 4.9%(+9.19)#1,253 |
| 24. | 99919 | 14.0% | 7.7%(+6.33)#24 | 4.9%(+9.07)#1,281 |
| 25. | 99730 | 13.9% | 7.7%(+6.20)#25 | 4.9%(+8.94)#1,307 |
| 26. | 99840 | 13.6% | 7.7%(+5.95)#26 | 4.9%(+8.70)#1,362 |
| 27. | 99653 | 13.5% | 7.7%(+5.77)#27 | 4.9%(+8.52)#1,400 |
| 28. | 99788 | 13.5% | 7.7%(+5.77)#28 | 4.9%(+8.52)#1,401 |
| 29. | 99677 | 13.3% | 7.7%(+5.64)#29 | 4.9%(+8.39)#1,449 |
| 30. | 99703 | 13.3% | 7.7%(+5.61)#30 | 4.9%(+8.35)#1,452 |
| 31. | 99667 | 12.7% | 7.7%(+5.04)#31 | 4.9%(+7.78)#1,616 |
| 32. | 99627 | 12.6% | 7.7%(+4.95)#32 | 4.9%(+7.70)#1,638 |
| 33. | 99841 | 12.5% | 7.7%(+4.81)#33 | 4.9%(+7.55)#1,684 |
| 34. | 99689 | 12.4% | 7.7%(+4.73)#34 | 4.9%(+7.48)#1,707 |
| 35. | 99568 | 12.1% | 7.7%(+4.44)#35 | 4.9%(+7.19)#1,803 |
| 36. | 99683 | 12.0% | 7.7%(+4.31)#36 | 4.9%(+7.05)#1,857 |
| 37. | 99561 | 12.0% | 7.7%(+4.28)#37 | 4.9%(+7.02)#1,880 |
| 38. | 99785 | 11.9% | 7.7%(+4.23)#38 | 4.9%(+6.97)#1,898 |
| 39. | 99714 | 11.6% | 7.7%(+3.94)#39 | 4.9%(+6.68)#2,016 |
| 40. | 99741 | 11.6% | 7.7%(+3.92)#40 | 4.9%(+6.66)#2,018 |
| 41. | 99518 | 11.3% | 7.7%(+3.66)#41 | 4.9%(+6.40)#2,149 |
| 42. | 99559 | 11.3% | 7.7%(+3.63)#42 | 4.9%(+6.38)#2,163 |
| 43. | 99547 | 11.1% | 7.7%(+3.42)#43 | 4.9%(+6.16)#2,278 |
| 44. | 99508 | 11.1% | 7.7%(+3.40)#44 | 4.9%(+6.14)#2,285 |
| 45. | 99761 | 11.0% | 7.7%(+3.33)#45 | 4.9%(+6.08)#2,313 |
| 46. | 99503 | 10.9% | 7.7%(+3.22)#46 | 4.9%(+5.96)#2,365 |
| 47. | 99507 | 10.9% | 7.7%(+3.20)#47 | 4.9%(+5.95)#2,369 |
| 48. | 99589 | 10.9% | 7.7%(+3.18)#48 | 4.9%(+5.92)#2,385 |
| 49. | 99581 | 10.6% | 7.7%(+2.95)#49 | 4.9%(+5.69)#2,504 |
| 50. | 99658 | 10.3% | 7.7%(+2.65)#50 | 4.9%(+5.39)#2,689 |
| 51. | 99502 | 10.2% | 7.7%(+2.46)#51 | 4.9%(+5.21)#2,787 |
| 52. | 99517 | 10.0% | 7.7%(+2.32)#52 | 4.9%(+5.06)#2,880 |
| 53. | 99609 | 10.0% | 7.7%(+2.31)#53 | 4.9%(+5.05)#2,887 |
| 54. | 99771 | 10.0% | 7.7%(+2.31)#54 | 4.9%(+5.05)#2,890 |
| 55. | 99712 | 9.9% | 7.7%(+2.18)#55 | 4.9%(+4.93)#2,968 |
| 56. | 99754 | 9.8% | 7.7%(+2.07)#56 | 4.9%(+4.81)#3,040 |
| 57. | 99922 | 9.6% | 7.7%(+1.94)#57 | 4.9%(+4.68)#3,139 |
| 58. | 99762 | 9.6% | 7.7%(+1.92)#58 | 4.9%(+4.67)#3,155 |
| 59. | 99727 | 9.5% | 7.7%(+1.77)#59 | 4.9%(+4.51)#3,266 |
| 60. | 99686 | 9.0% | 7.7%(+1.35)#60 | 4.9%(+4.10)#3,658 |
| 61. | 99504 | 9.0% | 7.7%(+1.30)#61 | 4.9%(+4.04)#3,718 |
| 62. | 99901 | 9.0% | 7.7%(+1.26)#62 | 4.9%(+4.01)#3,752 |
| 63. | 99655 | 8.9% | 7.7%(+1.26)#63 | 4.9%(+4.00)#3,754 |
| 64. | 99678 | 8.8% | 7.7%(+1.15)#64 | 4.9%(+3.89)#3,890 |
| 65. | 99558 | 8.8% | 7.7%(+1.13)#65 | 4.9%(+3.88)#3,904 |
| 66. | 99640 | 8.7% | 7.7%(+1.01)#66 | 4.9%(+3.75)#4,053 |
| 67. | 99556 | 8.6% | 7.7%(+0.931)#67 | 4.9%(+3.67)#4,128 |
| 68. | 99746 | 8.6% | 7.7%(+0.931)#68 | 4.9%(+3.67)#4,133 |
| 69. | 99722 | 8.3% | 7.7%(+0.644)#69 | 4.9%(+3.39)#4,474 |
| 70. | 99745 | 8.3% | 7.7%(+0.644)#70 | 4.9%(+3.39)#4,482 |
| 71. | 99694 | 8.1% | 7.7%(+0.460)#71 | 4.9%(+3.20)#4,698 |
| 72. | 99552 | 8.0% | 7.7%(+0.356)#72 | 4.9%(+3.10)#4,831 |
| 73. | 99564 | 8.0% | 7.7%(+0.310)#73 | 4.9%(+3.05)#4,899 |
| 74. | 99826 | 8.0% | 7.7%(+0.275)#74 | 4.9%(+3.02)#4,950 |
| 75. | 99515 | 7.9% | 7.7%(+0.196)#75 | 4.9%(+2.94)#5,054 |
| 76. | 99577 | 7.9% | 7.7%(+0.186)#76 | 4.9%(+2.93)#5,072 |
| 77. | 99652 | 7.8% | 7.7%(+0.100)#77 | 4.9%(+2.84)#5,196 |
| 78. | 99628 | 7.7% | 7.7%(+0.003)#78 | 4.9%(+2.75)#5,330 |
| 79. | 99760 | 7.6% | 7.7%(-0.059)#79 | 4.9%(+2.68)#5,433 |
| 80. | 99736 | 7.5% | 7.7%(-0.142)#80 | 4.9%(+2.60)#5,571 |
| 81. | 99777 | 7.5% | 7.7%(-0.163)#81 | 4.9%(+2.58)#5,597 |
| 82. | 99705 | 7.4% | 7.7%(-0.250)#82 | 4.9%(+2.49)#5,755 |
| 83. | 99602 | 7.4% | 7.7%(-0.282)#83 | 4.9%(+2.46)#5,811 |
| 84. | 99603 | 7.4% | 7.7%(-0.314)#84 | 4.9%(+2.43)#5,865 |
| 85. | 99516 | 7.3% | 7.7%(-0.377)#85 | 4.9%(+2.37)#5,983 |
| 86. | 99615 | 7.3% | 7.7%(-0.383)#86 | 4.9%(+2.36)#5,991 |
| 87. | 99632 | 7.2% | 7.7%(-0.513)#87 | 4.9%(+2.23)#6,222 |
| 88. | 99829 | 7.1% | 7.7%(-0.547)#88 | 4.9%(+2.20)#6,282 |
| 89. | 99763 | 7.1% | 7.7%(-0.547)#89 | 4.9%(+2.20)#6,286 |
| 90. | 99784 | 7.1% | 7.7%(-0.547)#90 | 4.9%(+2.20)#6,291 |
| 91. | 99740 | 7.0% | 7.7%(-0.683)#91 | 4.9%(+2.06)#6,546 |
| 92. | 99766 | 7.0% | 7.7%(-0.697)#92 | 4.9%(+2.05)#6,578 |
| 93. | 99672 | 6.9% | 7.7%(-0.754)#93 | 4.9%(+1.99)#6,687 |
| 94. | 99557 | 6.9% | 7.7%(-0.821)#94 | 4.9%(+1.92)#6,811 |
| 95. | 99684 | 6.8% | 7.7%(-0.889)#95 | 4.9%(+1.85)#6,972 |
| 96. | 99645 | 6.7% | 7.7%(-0.972)#96 | 4.9%(+1.77)#7,117 |
| 97. | 99801 | 6.7% | 7.7%(-1.00)#97 | 4.9%(+1.74)#7,186 |
| 98. | 99769 | 6.7% | 7.7%(-1.02)#98 | 4.9%(+1.72)#7,234 |
| 99. | 99929 | 6.6% | 7.7%(-1.06)#99 | 4.9%(+1.68)#7,323 |
| 100. | 99701 | 6.5% | 7.7%(-1.15)#100 | 4.9%(+1.60)#7,481 |
Common Questions
What are the Top 10 Zip Codes with the Highest Percentage of Population Employed in Transportation & Warehousing in Alaska?
Top 10 Zip Codes with the Highest Percentage of Population Employed in Transportation & Warehousing in Alaska are:
What zip code has the Highest Percentage of Population Employed in Transportation & Warehousing in Alaska?
99790 has the Highest Percentage of Population Employed in Transportation & Warehousing in Alaska with 100.0%.
What is the Percentage of Population Employed in Transportation & Warehousing in the State of Alaska?
Percentage of Population Employed in Transportation & Warehousing in Alaska is 7.7%.
What is the Percentage of Population Employed in Transportation & Warehousing in the United States?
Percentage of Population Employed in Transportation & Warehousing in the United States is 4.9%.