Zip Codes with the Highest Percentage of Population Employed in Transportation & Warehousing in Louisiana
RELATED REPORTS & OPTIONS
Transportation & Warehousing
Louisiana
Compare Zip Codes
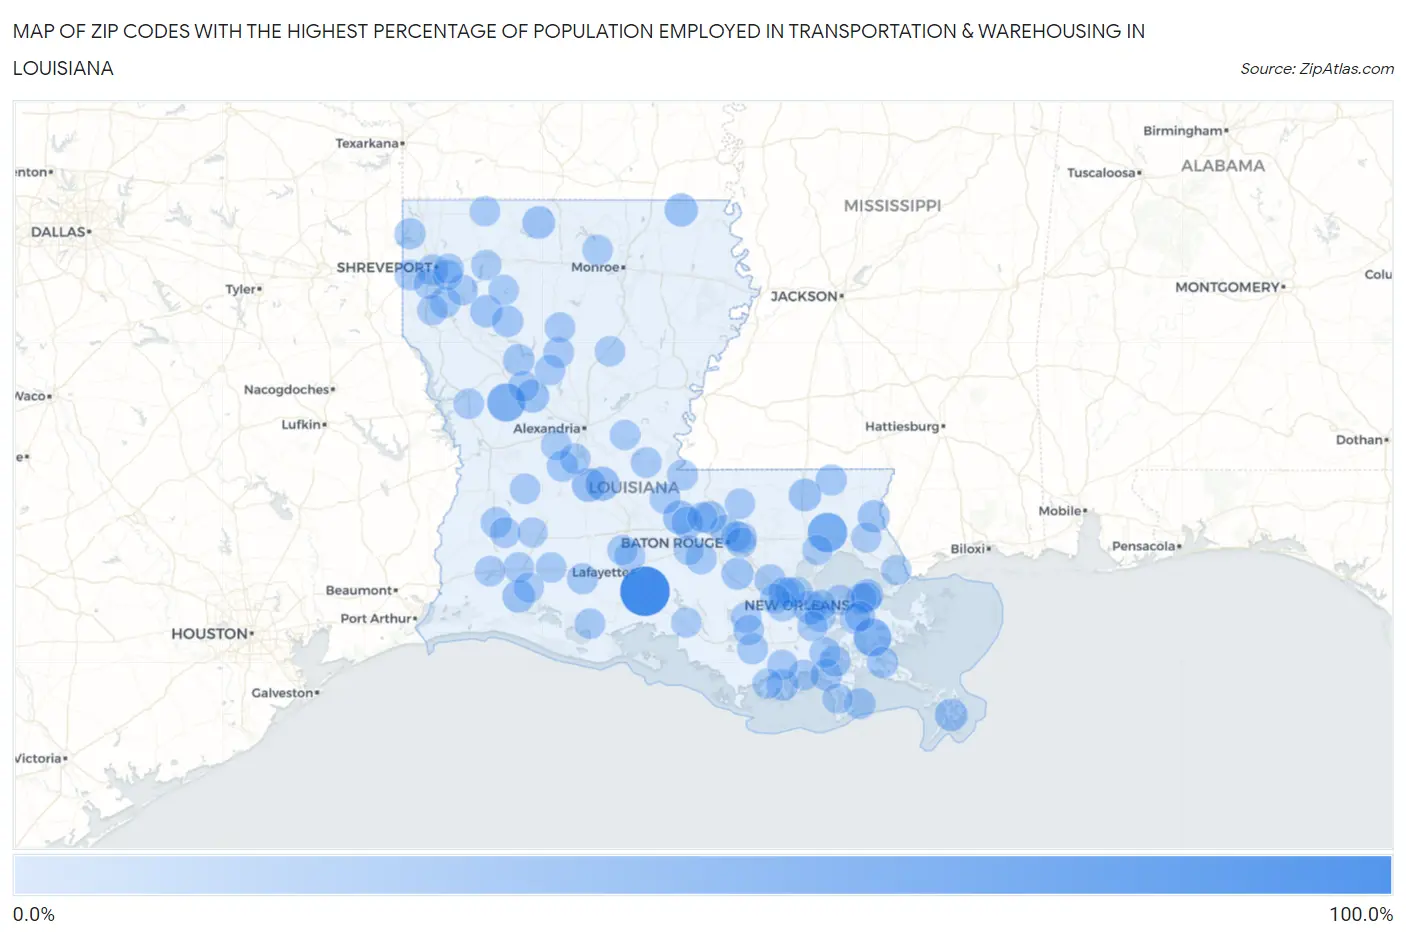
Map of Zip Codes with the Highest Percentage of Population Employed in Transportation & Warehousing in Louisiana
0.0%
100.0%
Zip Codes with the Highest Percentage of Population Employed in Transportation & Warehousing in Louisiana
| Zip Code | % Employed | vs State | vs National | |
| 1. | 70519 | 100.0% | 4.6%(+95.4)#1 | 4.9%(+95.1)#12 |
| 2. | 70455 | 50.0% | 4.6%(+45.4)#2 | 4.9%(+45.1)#75 |
| 3. | 71468 | 43.7% | 4.6%(+39.1)#3 | 4.9%(+38.7)#110 |
| 4. | 70040 | 42.1% | 4.6%(+37.4)#4 | 4.9%(+37.1)#116 |
| 5. | 71367 | 24.1% | 4.6%(+19.5)#5 | 4.9%(+19.2)#361 |
| 6. | 70732 | 23.9% | 4.6%(+19.2)#6 | 4.9%(+18.9)#370 |
| 7. | 70585 | 23.6% | 4.6%(+19.0)#7 | 4.9%(+18.7)#378 |
| 8. | 71250 | 20.7% | 4.6%(+16.1)#8 | 4.9%(+15.7)#496 |
| 9. | 71416 | 20.6% | 4.6%(+15.9)#9 | 4.9%(+15.6)#505 |
| 10. | 70057 | 20.0% | 4.6%(+15.4)#10 | 4.9%(+15.1)#535 |
| 11. | 70630 | 18.8% | 4.6%(+14.2)#11 | 4.9%(+13.9)#611 |
| 12. | 70736 | 18.8% | 4.6%(+14.2)#12 | 4.9%(+13.9)#612 |
| 13. | 70091 | 18.2% | 4.6%(+13.5)#13 | 4.9%(+13.2)#665 |
| 14. | 71048 | 17.8% | 4.6%(+13.1)#14 | 4.9%(+12.8)#701 |
| 15. | 70456 | 17.4% | 4.6%(+12.8)#15 | 4.9%(+12.5)#729 |
| 16. | 71034 | 16.5% | 4.6%(+11.9)#16 | 4.9%(+11.6)#845 |
| 17. | 70463 | 16.0% | 4.6%(+11.4)#17 | 4.9%(+11.1)#910 |
| 18. | 70721 | 15.3% | 4.6%(+10.7)#18 | 4.9%(+10.4)#1,001 |
| 19. | 70755 | 14.9% | 4.6%(+10.2)#19 | 4.9%(+9.91)#1,095 |
| 20. | 70128 | 14.0% | 4.6%(+9.34)#20 | 4.9%(+9.04)#1,290 |
| 21. | 71002 | 13.2% | 4.6%(+8.60)#21 | 4.9%(+8.29)#1,471 |
| 22. | 71414 | 12.8% | 4.6%(+8.17)#22 | 4.9%(+7.86)#1,590 |
| 23. | 70353 | 12.7% | 4.6%(+8.10)#23 | 4.9%(+7.79)#1,613 |
| 24. | 70354 | 12.2% | 4.6%(+7.59)#24 | 4.9%(+7.28)#1,772 |
| 25. | 70083 | 11.9% | 4.6%(+7.26)#25 | 4.9%(+6.95)#1,907 |
| 26. | 71433 | 11.7% | 4.6%(+7.10)#26 | 4.9%(+6.79)#1,981 |
| 27. | 70814 | 11.6% | 4.6%(+6.92)#27 | 4.9%(+6.61)#2,048 |
| 28. | 70778 | 11.4% | 4.6%(+6.77)#28 | 4.9%(+6.46)#2,117 |
| 29. | 70039 | 11.2% | 4.6%(+6.58)#29 | 4.9%(+6.27)#2,223 |
| 30. | 70358 | 11.2% | 4.6%(+6.56)#30 | 4.9%(+6.25)#2,234 |
| 31. | 70345 | 11.1% | 4.6%(+6.51)#31 | 4.9%(+6.20)#2,252 |
| 32. | 71103 | 11.1% | 4.6%(+6.44)#32 | 4.9%(+6.13)#2,286 |
| 33. | 70450 | 11.1% | 4.6%(+6.42)#33 | 4.9%(+6.11)#2,300 |
| 34. | 70740 | 10.8% | 4.6%(+6.16)#34 | 4.9%(+5.85)#2,423 |
| 35. | 70373 | 10.6% | 4.6%(+5.99)#35 | 4.9%(+5.68)#2,512 |
| 36. | 70652 | 10.5% | 4.6%(+5.82)#36 | 4.9%(+5.52)#2,609 |
| 37. | 70534 | 10.4% | 4.6%(+5.72)#37 | 4.9%(+5.41)#2,669 |
| 38. | 70084 | 10.3% | 4.6%(+5.71)#38 | 4.9%(+5.40)#2,676 |
| 39. | 71061 | 10.1% | 4.6%(+5.48)#39 | 4.9%(+5.17)#2,807 |
| 40. | 71027 | 10.1% | 4.6%(+5.48)#40 | 4.9%(+5.17)#2,808 |
| 41. | 70356 | 10.0% | 4.6%(+5.35)#41 | 4.9%(+5.04)#2,907 |
| 42. | 71430 | 10.0% | 4.6%(+5.33)#42 | 4.9%(+5.03)#2,913 |
| 43. | 70126 | 9.7% | 4.6%(+5.03)#43 | 4.9%(+4.72)#3,098 |
| 44. | 71051 | 9.5% | 4.6%(+4.86)#44 | 4.9%(+4.55)#3,237 |
| 45. | 71033 | 9.5% | 4.6%(+4.86)#45 | 4.9%(+4.55)#3,238 |
| 46. | 70052 | 9.5% | 4.6%(+4.85)#46 | 4.9%(+4.54)#3,250 |
| 47. | 70712 | 9.5% | 4.6%(+4.83)#47 | 4.9%(+4.52)#3,259 |
| 48. | 71355 | 9.3% | 4.6%(+4.70)#48 | 4.9%(+4.39)#3,366 |
| 49. | 70127 | 9.3% | 4.6%(+4.66)#49 | 4.9%(+4.35)#3,397 |
| 50. | 71483 | 9.3% | 4.6%(+4.65)#50 | 4.9%(+4.34)#3,404 |
| 51. | 70377 | 9.1% | 4.6%(+4.44)#51 | 4.9%(+4.13)#3,624 |
| 52. | 71456 | 9.0% | 4.6%(+4.34)#52 | 4.9%(+4.03)#3,724 |
| 53. | 70647 | 9.0% | 4.6%(+4.32)#53 | 4.9%(+4.01)#3,743 |
| 54. | 70058 | 8.9% | 4.6%(+4.27)#54 | 4.9%(+3.96)#3,803 |
| 55. | 70390 | 8.9% | 4.6%(+4.25)#55 | 4.9%(+3.95)#3,816 |
| 56. | 71118 | 8.9% | 4.6%(+4.23)#56 | 4.9%(+3.92)#3,852 |
| 57. | 70657 | 8.8% | 4.6%(+4.16)#57 | 4.9%(+3.85)#3,935 |
| 58. | 70520 | 8.7% | 4.6%(+4.10)#58 | 4.9%(+3.79)#4,004 |
| 59. | 71030 | 8.7% | 4.6%(+4.07)#59 | 4.9%(+3.76)#4,038 |
| 60. | 71404 | 8.7% | 4.6%(+4.05)#60 | 4.9%(+3.74)#4,066 |
| 61. | 70753 | 8.7% | 4.6%(+4.04)#61 | 4.9%(+3.73)#4,070 |
| 62. | 70669 | 8.6% | 4.6%(+3.98)#62 | 4.9%(+3.67)#4,142 |
| 63. | 70372 | 8.6% | 4.6%(+3.94)#63 | 4.9%(+3.63)#4,179 |
| 64. | 70006 | 8.6% | 4.6%(+3.92)#64 | 4.9%(+3.61)#4,200 |
| 65. | 71426 | 8.3% | 4.6%(+3.70)#65 | 4.9%(+3.39)#4,475 |
| 66. | 70363 | 8.3% | 4.6%(+3.62)#66 | 4.9%(+3.31)#4,566 |
| 67. | 70581 | 8.2% | 4.6%(+3.53)#67 | 4.9%(+3.22)#4,668 |
| 68. | 70548 | 8.0% | 4.6%(+3.37)#68 | 4.9%(+3.06)#4,891 |
| 69. | 71422 | 7.9% | 4.6%(+3.28)#69 | 4.9%(+2.98)#5,001 |
| 70. | 70656 | 7.9% | 4.6%(+3.23)#70 | 4.9%(+2.93)#5,076 |
| 71. | 70047 | 7.9% | 4.6%(+3.23)#71 | 4.9%(+2.92)#5,081 |
| 72. | 70090 | 7.9% | 4.6%(+3.23)#72 | 4.9%(+2.92)#5,090 |
| 73. | 70777 | 7.9% | 4.6%(+3.21)#73 | 4.9%(+2.91)#5,104 |
| 74. | 70056 | 7.8% | 4.6%(+3.21)#74 | 4.9%(+2.90)#5,112 |
| 75. | 70584 | 7.7% | 4.6%(+3.10)#75 | 4.9%(+2.79)#5,265 |
| 76. | 71073 | 7.7% | 4.6%(+3.08)#76 | 4.9%(+2.77)#5,292 |
| 77. | 71465 | 7.7% | 4.6%(+3.06)#77 | 4.9%(+2.75)#5,319 |
| 78. | 70051 | 7.7% | 4.6%(+3.05)#78 | 4.9%(+2.75)#5,327 |
| 79. | 71424 | 7.7% | 4.6%(+3.05)#79 | 4.9%(+2.75)#5,328 |
| 80. | 70807 | 7.6% | 4.6%(+2.98)#80 | 4.9%(+2.67)#5,466 |
| 81. | 71045 | 7.6% | 4.6%(+2.95)#81 | 4.9%(+2.65)#5,503 |
| 82. | 70420 | 7.6% | 4.6%(+2.94)#82 | 4.9%(+2.63)#5,522 |
| 83. | 71234 | 7.5% | 4.6%(+2.82)#83 | 4.9%(+2.51)#5,722 |
| 84. | 70812 | 7.4% | 4.6%(+2.80)#84 | 4.9%(+2.49)#5,756 |
| 85. | 70646 | 7.4% | 4.6%(+2.75)#85 | 4.9%(+2.44)#5,844 |
| 86. | 70749 | 7.4% | 4.6%(+2.72)#86 | 4.9%(+2.41)#5,896 |
| 87. | 70397 | 7.3% | 4.6%(+2.68)#87 | 4.9%(+2.37)#5,967 |
| 88. | 71112 | 7.3% | 4.6%(+2.62)#88 | 4.9%(+2.31)#6,088 |
| 89. | 70030 | 7.2% | 4.6%(+2.60)#89 | 4.9%(+2.29)#6,120 |
| 90. | 70454 | 7.2% | 4.6%(+2.54)#90 | 4.9%(+2.23)#6,216 |
| 91. | 70815 | 7.2% | 4.6%(+2.53)#91 | 4.9%(+2.22)#6,243 |
| 92. | 70743 | 7.1% | 4.6%(+2.51)#92 | 4.9%(+2.20)#6,285 |
| 93. | 70648 | 7.0% | 4.6%(+2.39)#93 | 4.9%(+2.08)#6,506 |
| 94. | 70357 | 7.0% | 4.6%(+2.37)#94 | 4.9%(+2.06)#6,545 |
| 95. | 70757 | 7.0% | 4.6%(+2.36)#95 | 4.9%(+2.05)#6,576 |
| 96. | 71331 | 7.0% | 4.6%(+2.35)#96 | 4.9%(+2.04)#6,585 |
| 97. | 70461 | 6.9% | 4.6%(+2.29)#97 | 4.9%(+1.98)#6,707 |
| 98. | 70514 | 6.9% | 4.6%(+2.28)#98 | 4.9%(+1.97)#6,717 |
| 99. | 71110 | 6.9% | 4.6%(+2.27)#99 | 4.9%(+1.96)#6,739 |
| 100. | 71072 | 6.9% | 4.6%(+2.27)#100 | 4.9%(+1.96)#6,749 |
Common Questions
What are the Top 10 Zip Codes with the Highest Percentage of Population Employed in Transportation & Warehousing in Louisiana?
Top 10 Zip Codes with the Highest Percentage of Population Employed in Transportation & Warehousing in Louisiana are:
What zip code has the Highest Percentage of Population Employed in Transportation & Warehousing in Louisiana?
70519 has the Highest Percentage of Population Employed in Transportation & Warehousing in Louisiana with 100.0%.
What is the Percentage of Population Employed in Transportation & Warehousing in the State of Louisiana?
Percentage of Population Employed in Transportation & Warehousing in Louisiana is 4.6%.
What is the Percentage of Population Employed in Transportation & Warehousing in the United States?
Percentage of Population Employed in Transportation & Warehousing in the United States is 4.9%.