Zip Codes with the Highest Percentage of Population Employed in Transportation & Warehousing in Alabama
RELATED REPORTS & OPTIONS
Transportation & Warehousing
Alabama
Compare Zip Codes
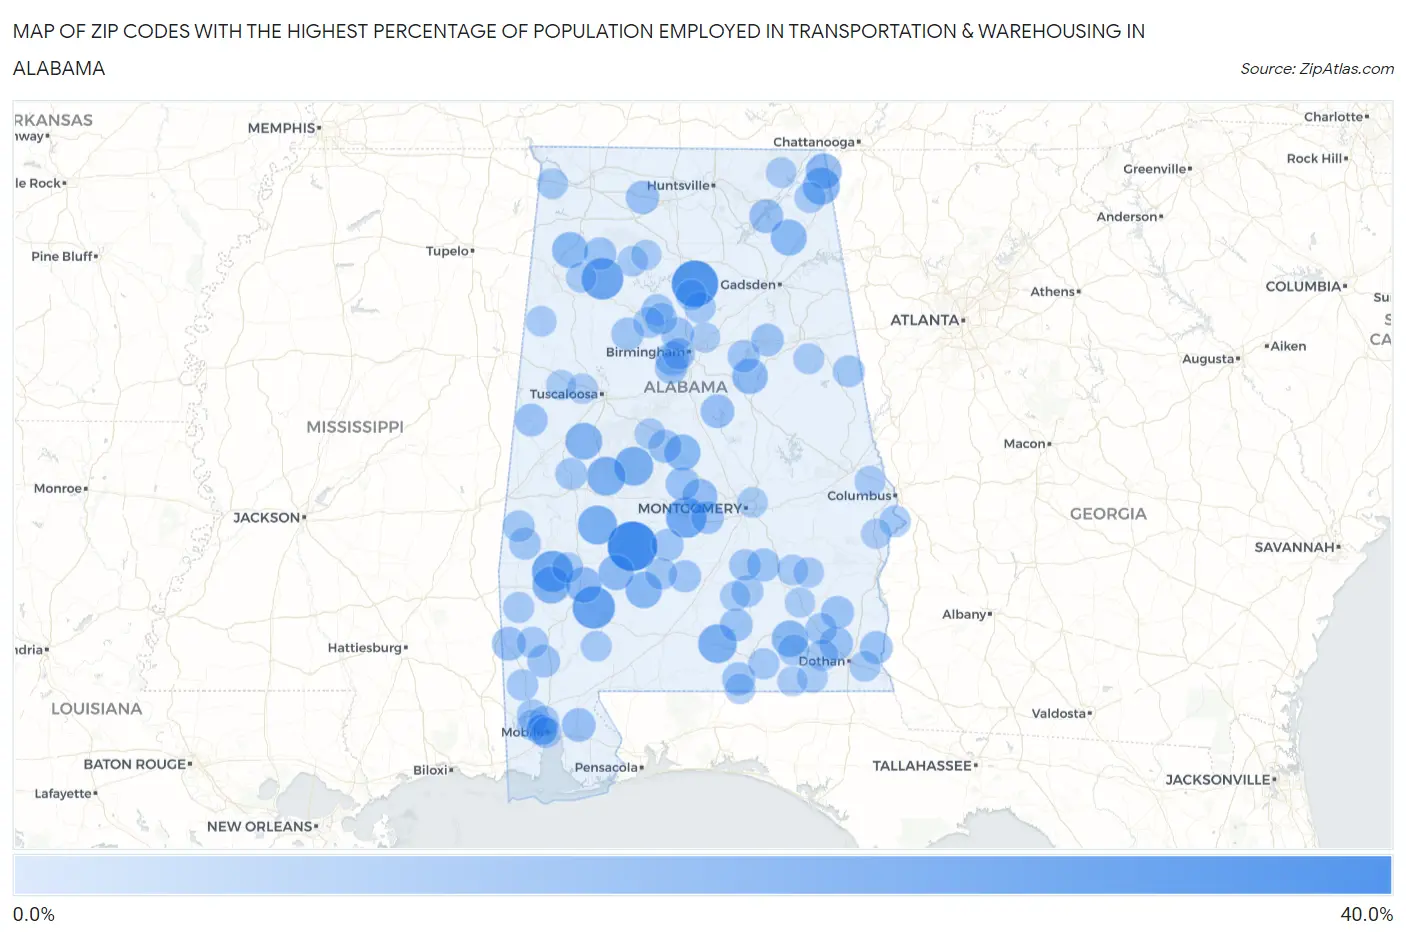
Map of Zip Codes with the Highest Percentage of Population Employed in Transportation & Warehousing in Alabama
0.0%
40.0%
Zip Codes with the Highest Percentage of Population Employed in Transportation & Warehousing in Alabama
| Zip Code | % Employed | vs State | vs National | |
| 1. | 36723 | 32.1% | 4.3%(+27.8)#1 | 4.9%(+27.1)#200 |
| 2. | 35070 | 28.1% | 4.3%(+23.8)#2 | 4.9%(+23.2)#268 |
| 3. | 36482 | 23.0% | 4.3%(+18.7)#3 | 4.9%(+18.1)#395 |
| 4. | 35575 | 22.0% | 4.3%(+17.7)#4 | 4.9%(+17.0)#440 |
| 5. | 36727 | 21.3% | 4.3%(+17.0)#5 | 4.9%(+16.3)#462 |
| 6. | 36785 | 20.5% | 4.3%(+16.2)#6 | 4.9%(+15.5)#509 |
| 7. | 36783 | 18.8% | 4.3%(+14.4)#7 | 4.9%(+13.8)#615 |
| 8. | 36756 | 18.5% | 4.3%(+14.2)#8 | 4.9%(+13.5)#643 |
| 9. | 36765 | 18.2% | 4.3%(+13.9)#9 | 4.9%(+13.3)#659 |
| 10. | 36476 | 18.2% | 4.3%(+13.9)#10 | 4.9%(+13.2)#670 |
| 11. | 36524 | 16.7% | 4.3%(+12.4)#11 | 4.9%(+11.7)#815 |
| 12. | 35981 | 16.3% | 4.3%(+12.0)#12 | 4.9%(+11.4)#864 |
| 13. | 35441 | 15.9% | 4.3%(+11.6)#13 | 4.9%(+11.0)#919 |
| 14. | 36351 | 15.6% | 4.3%(+11.3)#14 | 4.9%(+10.6)#965 |
| 15. | 36425 | 15.5% | 4.3%(+11.2)#15 | 4.9%(+10.5)#976 |
| 16. | 35963 | 15.0% | 4.3%(+10.6)#16 | 4.9%(+10.0)#1,076 |
| 17. | 36750 | 14.9% | 4.3%(+10.6)#17 | 4.9%(+9.94)#1,091 |
| 18. | 35564 | 14.8% | 4.3%(+10.5)#18 | 4.9%(+9.89)#1,096 |
| 19. | 35979 | 14.6% | 4.3%(+10.3)#19 | 4.9%(+9.69)#1,135 |
| 20. | 36446 | 14.5% | 4.3%(+10.2)#20 | 4.9%(+9.56)#1,165 |
| 21. | 35014 | 14.5% | 4.3%(+10.2)#21 | 4.9%(+9.56)#1,166 |
| 22. | 36435 | 14.3% | 4.3%(+9.98)#22 | 4.9%(+9.34)#1,205 |
| 23. | 36003 | 13.4% | 4.3%(+9.06)#23 | 4.9%(+8.42)#1,428 |
| 24. | 35061 | 12.3% | 4.3%(+8.01)#24 | 4.9%(+7.37)#1,746 |
| 25. | 35755 | 12.2% | 4.3%(+7.92)#25 | 4.9%(+7.28)#1,771 |
| 26. | 36539 | 12.1% | 4.3%(+7.79)#26 | 4.9%(+7.15)#1,810 |
| 27. | 36350 | 12.0% | 4.3%(+7.67)#27 | 4.9%(+7.03)#1,876 |
| 28. | 35143 | 11.9% | 4.3%(+7.64)#28 | 4.9%(+7.00)#1,888 |
| 29. | 36578 | 11.9% | 4.3%(+7.63)#29 | 4.9%(+6.99)#1,895 |
| 30. | 36749 | 11.8% | 4.3%(+7.46)#30 | 4.9%(+6.82)#1,964 |
| 31. | 35643 | 11.5% | 4.3%(+7.21)#31 | 4.9%(+6.57)#2,071 |
| 32. | 36442 | 11.3% | 4.3%(+7.02)#32 | 4.9%(+6.38)#2,162 |
| 33. | 36793 | 11.3% | 4.3%(+6.97)#33 | 4.9%(+6.33)#2,189 |
| 34. | 36374 | 11.3% | 4.3%(+6.95)#34 | 4.9%(+6.31)#2,204 |
| 35. | 35117 | 11.1% | 4.3%(+6.80)#35 | 4.9%(+6.16)#2,279 |
| 36. | 36036 | 11.1% | 4.3%(+6.77)#36 | 4.9%(+6.13)#2,287 |
| 37. | 36752 | 11.1% | 4.3%(+6.76)#37 | 4.9%(+6.12)#2,294 |
| 38. | 36028 | 11.0% | 4.3%(+6.73)#38 | 4.9%(+6.09)#2,310 |
| 39. | 35565 | 11.0% | 4.3%(+6.70)#39 | 4.9%(+6.06)#2,321 |
| 40. | 36319 | 11.0% | 4.3%(+6.69)#40 | 4.9%(+6.05)#2,324 |
| 41. | 35442 | 11.0% | 4.3%(+6.69)#41 | 4.9%(+6.05)#2,330 |
| 42. | 36553 | 10.9% | 4.3%(+6.55)#42 | 4.9%(+5.91)#2,393 |
| 43. | 35096 | 10.7% | 4.3%(+6.42)#43 | 4.9%(+5.78)#2,463 |
| 44. | 35020 | 10.6% | 4.3%(+6.24)#44 | 4.9%(+5.60)#2,561 |
| 45. | 35579 | 10.4% | 4.3%(+6.10)#45 | 4.9%(+5.46)#2,636 |
| 46. | 35054 | 10.3% | 4.3%(+6.03)#46 | 4.9%(+5.39)#2,686 |
| 47. | 36030 | 10.2% | 4.3%(+5.90)#47 | 4.9%(+5.26)#2,762 |
| 48. | 36761 | 10.2% | 4.3%(+5.88)#48 | 4.9%(+5.24)#2,767 |
| 49. | 35218 | 10.1% | 4.3%(+5.81)#49 | 4.9%(+5.17)#2,818 |
| 50. | 36768 | 10.0% | 4.3%(+5.67)#50 | 4.9%(+5.03)#2,910 |
| 51. | 36740 | 9.9% | 4.3%(+5.61)#51 | 4.9%(+4.98)#2,939 |
| 52. | 36904 | 9.7% | 4.3%(+5.44)#52 | 4.9%(+4.80)#3,045 |
| 53. | 36280 | 9.7% | 4.3%(+5.37)#53 | 4.9%(+4.73)#3,089 |
| 54. | 35584 | 9.7% | 4.3%(+5.37)#54 | 4.9%(+4.73)#3,096 |
| 55. | 35148 | 9.6% | 4.3%(+5.29)#55 | 4.9%(+4.66)#3,167 |
| 56. | 36049 | 9.6% | 4.3%(+5.29)#56 | 4.9%(+4.65)#3,169 |
| 57. | 36041 | 9.5% | 4.3%(+5.21)#57 | 4.9%(+4.57)#3,221 |
| 58. | 36912 | 9.5% | 4.3%(+5.20)#58 | 4.9%(+4.56)#3,233 |
| 59. | 36360 | 9.5% | 4.3%(+5.20)#59 | 4.9%(+4.56)#3,234 |
| 60. | 36856 | 9.3% | 4.3%(+5.02)#60 | 4.9%(+4.38)#3,375 |
| 61. | 35172 | 9.3% | 4.3%(+4.98)#61 | 4.9%(+4.34)#3,407 |
| 62. | 36352 | 9.2% | 4.3%(+4.90)#62 | 4.9%(+4.26)#3,478 |
| 63. | 36522 | 9.2% | 4.3%(+4.90)#63 | 4.9%(+4.26)#3,483 |
| 64. | 36613 | 9.1% | 4.3%(+4.84)#64 | 4.9%(+4.20)#3,532 |
| 65. | 36330 | 9.1% | 4.3%(+4.84)#65 | 4.9%(+4.20)#3,535 |
| 66. | 35550 | 9.1% | 4.3%(+4.83)#66 | 4.9%(+4.19)#3,549 |
| 67. | 36583 | 9.1% | 4.3%(+4.83)#67 | 4.9%(+4.19)#3,550 |
| 68. | 36453 | 9.1% | 4.3%(+4.78)#68 | 4.9%(+4.14)#3,597 |
| 69. | 36617 | 8.9% | 4.3%(+4.63)#69 | 4.9%(+3.99)#3,776 |
| 70. | 36558 | 8.8% | 4.3%(+4.53)#70 | 4.9%(+3.89)#3,892 |
| 71. | 35079 | 8.8% | 4.3%(+4.51)#71 | 4.9%(+3.87)#3,906 |
| 72. | 36618 | 8.8% | 4.3%(+4.48)#72 | 4.9%(+3.84)#3,945 |
| 73. | 35978 | 8.8% | 4.3%(+4.45)#73 | 4.9%(+3.81)#3,981 |
| 74. | 36312 | 8.6% | 4.3%(+4.33)#74 | 4.9%(+3.69)#4,111 |
| 75. | 36611 | 8.6% | 4.3%(+4.31)#75 | 4.9%(+3.67)#4,127 |
| 76. | 36258 | 8.6% | 4.3%(+4.31)#76 | 4.9%(+3.67)#4,138 |
| 77. | 36081 | 8.6% | 4.3%(+4.29)#77 | 4.9%(+3.65)#4,152 |
| 78. | 36784 | 8.5% | 4.3%(+4.24)#78 | 4.9%(+3.60)#4,224 |
| 79. | 36480 | 8.5% | 4.3%(+4.23)#79 | 4.9%(+3.59)#4,228 |
| 80. | 35616 | 8.5% | 4.3%(+4.22)#80 | 4.9%(+3.58)#4,244 |
| 81. | 35042 | 8.5% | 4.3%(+4.20)#81 | 4.9%(+3.56)#4,268 |
| 82. | 36607 | 8.4% | 4.3%(+4.11)#82 | 4.9%(+3.47)#4,372 |
| 83. | 36115 | 8.4% | 4.3%(+4.08)#83 | 4.9%(+3.44)#4,406 |
| 84. | 36874 | 8.4% | 4.3%(+4.06)#84 | 4.9%(+3.42)#4,424 |
| 85. | 36603 | 8.3% | 4.3%(+4.01)#85 | 4.9%(+3.37)#4,490 |
| 86. | 35592 | 8.3% | 4.3%(+3.99)#86 | 4.9%(+3.35)#4,522 |
| 87. | 36344 | 8.3% | 4.3%(+3.98)#87 | 4.9%(+3.34)#4,525 |
| 88. | 35572 | 8.2% | 4.3%(+3.94)#88 | 4.9%(+3.30)#4,578 |
| 89. | 36005 | 8.2% | 4.3%(+3.90)#89 | 4.9%(+3.26)#4,623 |
| 90. | 35746 | 8.2% | 4.3%(+3.86)#90 | 4.9%(+3.22)#4,676 |
| 91. | 36455 | 8.2% | 4.3%(+3.86)#91 | 4.9%(+3.22)#4,681 |
| 92. | 35548 | 8.1% | 4.3%(+3.83)#92 | 4.9%(+3.19)#4,716 |
| 93. | 35540 | 8.0% | 4.3%(+3.67)#93 | 4.9%(+3.03)#4,931 |
| 94. | 36340 | 8.0% | 4.3%(+3.65)#94 | 4.9%(+3.01)#4,953 |
| 95. | 35446 | 7.9% | 4.3%(+3.64)#95 | 4.9%(+3.00)#4,967 |
| 96. | 35466 | 7.9% | 4.3%(+3.63)#96 | 4.9%(+2.99)#4,987 |
| 97. | 35235 | 7.9% | 4.3%(+3.56)#97 | 4.9%(+2.92)#5,084 |
| 98. | 36071 | 7.8% | 4.3%(+3.54)#98 | 4.9%(+2.90)#5,119 |
| 99. | 36010 | 7.8% | 4.3%(+3.51)#99 | 4.9%(+2.87)#5,156 |
| 100. | 36871 | 7.8% | 4.3%(+3.48)#100 | 4.9%(+2.84)#5,200 |
Common Questions
What are the Top 10 Zip Codes with the Highest Percentage of Population Employed in Transportation & Warehousing in Alabama?
Top 10 Zip Codes with the Highest Percentage of Population Employed in Transportation & Warehousing in Alabama are:
What zip code has the Highest Percentage of Population Employed in Transportation & Warehousing in Alabama?
36723 has the Highest Percentage of Population Employed in Transportation & Warehousing in Alabama with 32.1%.
What is the Percentage of Population Employed in Transportation & Warehousing in the State of Alabama?
Percentage of Population Employed in Transportation & Warehousing in Alabama is 4.3%.
What is the Percentage of Population Employed in Transportation & Warehousing in the United States?
Percentage of Population Employed in Transportation & Warehousing in the United States is 4.9%.