Zip Codes with the Highest Percentage of Population Employed in Transportation & Warehousing in Arkansas
RELATED REPORTS & OPTIONS
Transportation & Warehousing
Arkansas
Compare Zip Codes
Map of Zip Codes with the Highest Percentage of Population Employed in Transportation & Warehousing in Arkansas
0.0%
100.0%
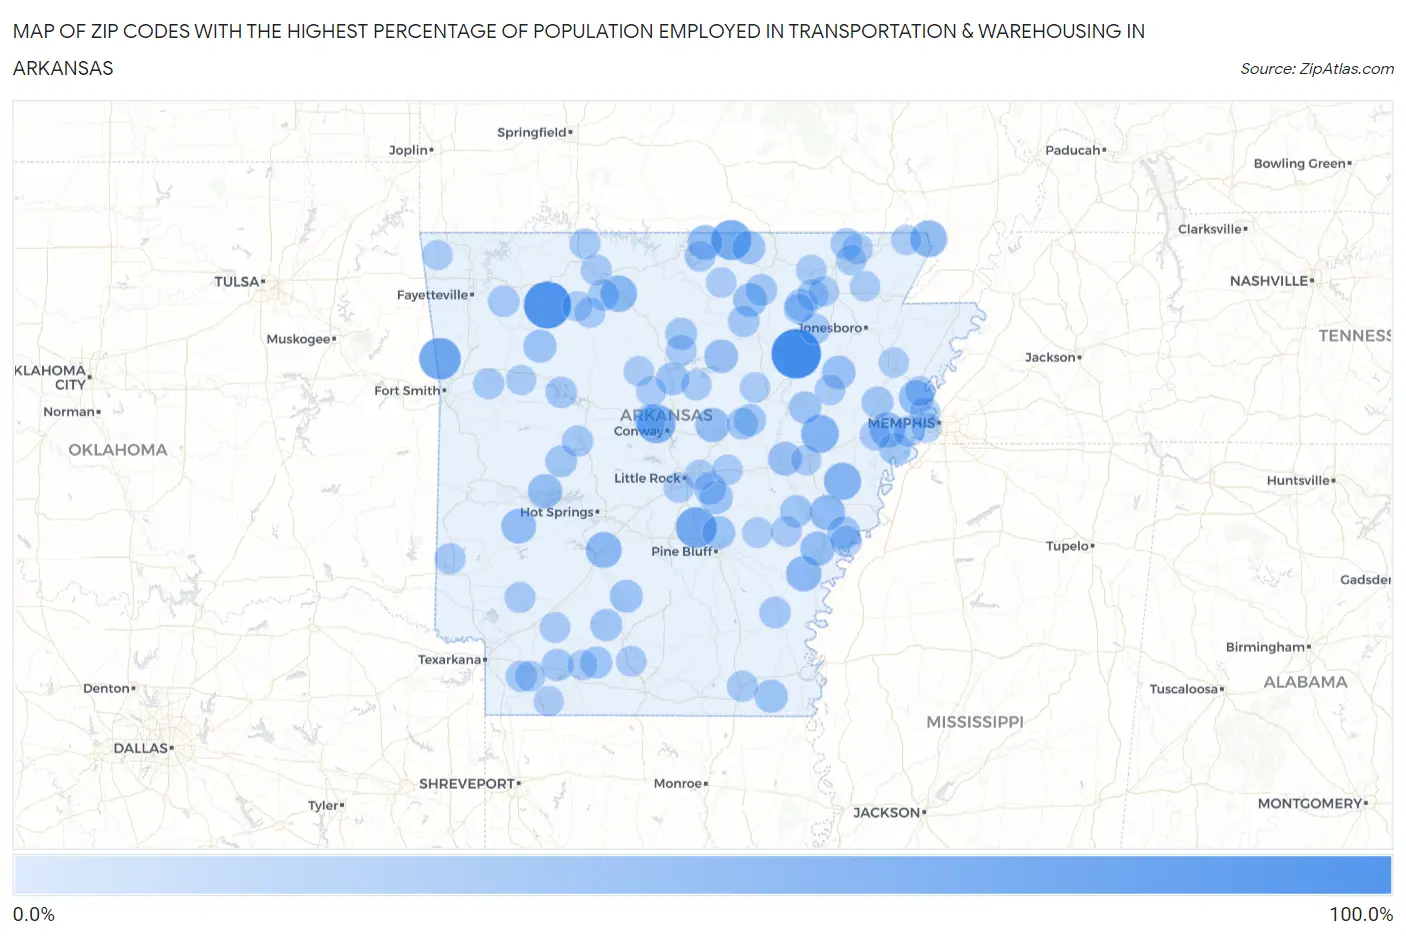
Zip Codes with the Highest Percentage of Population Employed in Transportation & Warehousing in Arkansas
| Zip Code | % Employed | vs State | vs National | |
| 1. | 72075 | 83.3% | 5.0% (+78.3)#1 | 4.9% (+78.4)#28 |
| 2. | 72742 | 74.0% | 5.0% (+68.9)#2 | 4.9% (+69.0)#35 |
| 3. | 72955 | 51.9% | 5.0% (+46.9)#3 | 4.9% (+47.0)#72 |
| 4. | 72079 | 48.7% | 5.0% (+43.6)#4 | 4.9% (+43.7)#84 |
| 5. | 72578 | 46.5% | 5.0% (+41.4)#5 | 4.9% (+41.5)#97 |
| 6. | 72107 | 41.7% | 5.0% (+36.6)#6 | 4.9% (+36.7)#120 |
| 7. | 72074 | 36.8% | 5.0% (+31.7)#7 | 4.9% (+31.8)#155 |
| 8. | 72311 | 35.0% | 5.0% (+30.0)#8 | 4.9% (+30.1)#167 |
| 9. | 72464 | 33.3% | 5.0% (+28.3)#9 | 4.9% (+28.4)#186 |
| 10. | 72669 | 32.1% | 5.0% (+27.0)#10 | 4.9% (+27.1)#201 |
| 11. | 71942 | 30.3% | 5.0% (+25.3)#11 | 4.9% (+25.4)#223 |
| 12. | 72166 | 28.4% | 5.0% (+23.4)#12 | 4.9% (+23.5)#263 |
| 13. | 72346 | 27.9% | 5.0% (+22.9)#13 | 4.9% (+23.0)#271 |
| 14. | 72383 | 27.8% | 5.0% (+22.7)#14 | 4.9% (+22.8)#274 |
| 15. | 72538 | 25.9% | 5.0% (+20.9)#15 | 4.9% (+21.0)#312 |
| 16. | 71935 | 25.6% | 5.0% (+20.5)#16 | 4.9% (+20.6)#321 |
| 17. | 72325 | 25.0% | 5.0% (+20.0)#17 | 4.9% (+20.1)#339 |
| 18. | 71970 | 24.3% | 5.0% (+19.3)#18 | 4.9% (+19.4)#351 |
| 19. | 72045 | 24.2% | 5.0% (+19.2)#19 | 4.9% (+19.3)#352 |
| 20. | 72048 | 24.0% | 5.0% (+18.9)#20 | 4.9% (+19.0)#368 |
| 21. | 72017 | 22.0% | 5.0% (+17.0)#21 | 4.9% (+17.1)#438 |
| 22. | 72577 | 22.0% | 5.0% (+16.9)#22 | 4.9% (+17.0)#441 |
| 23. | 72530 | 21.8% | 5.0% (+16.8)#23 | 4.9% (+16.9)#444 |
| 24. | 72429 | 21.2% | 5.0% (+16.2)#24 | 4.9% (+16.3)#465 |
| 25. | 72520 | 20.0% | 5.0% (+15.0)#25 | 4.9% (+15.1)#537 |
| 26. | 71661 | 20.0% | 5.0% (+15.0)#26 | 4.9% (+15.1)#538 |
| 27. | 72852 | 19.6% | 5.0% (+14.5)#27 | 4.9% (+14.6)#569 |
| 28. | 72083 | 19.4% | 5.0% (+14.3)#28 | 4.9% (+14.4)#576 |
| 29. | 72013 | 18.9% | 5.0% (+13.8)#29 | 4.9% (+13.9)#608 |
| 30. | 71763 | 18.7% | 5.0% (+13.7)#30 | 4.9% (+13.8)#620 |
| 31. | 72152 | 18.7% | 5.0% (+13.7)#31 | 4.9% (+13.8)#622 |
| 32. | 72389 | 18.1% | 5.0% (+13.0)#32 | 4.9% (+13.1)#678 |
| 33. | 72123 | 17.2% | 5.0% (+12.2)#33 | 4.9% (+12.3)#753 |
| 34. | 72026 | 17.0% | 5.0% (+11.9)#34 | 4.9% (+12.0)#776 |
| 35. | 72142 | 16.7% | 5.0% (+11.7)#35 | 4.9% (+11.8)#808 |
| 36. | 72440 | 16.7% | 5.0% (+11.6)#36 | 4.9% (+11.7)#822 |
| 37. | 71827 | 16.2% | 5.0% (+11.1)#37 | 4.9% (+11.2)#884 |
| 38. | 71726 | 16.1% | 5.0% (+11.1)#38 | 4.9% (+11.1)#894 |
| 39. | 71764 | 16.1% | 5.0% (+11.0)#39 | 4.9% (+11.1)#898 |
| 40. | 72068 | 15.9% | 5.0% (+10.8)#40 | 4.9% (+10.9)#926 |
| 41. | 72051 | 15.1% | 5.0% (+10.1)#41 | 4.9% (+10.1)#1,043 |
| 42. | 72373 | 15.0% | 5.0% (+9.92)#42 | 4.9% (+10.0)#1,075 |
| 43. | 72532 | 14.8% | 5.0% (+9.72)#43 | 4.9% (+9.82)#1,110 |
| 44. | 72348 | 14.7% | 5.0% (+9.68)#44 | 4.9% (+9.78)#1,118 |
| 45. | 72857 | 14.2% | 5.0% (+9.12)#45 | 4.9% (+9.21)#1,246 |
| 46. | 72052 | 14.1% | 5.0% (+9.02)#46 | 4.9% (+9.12)#1,271 |
| 47. | 72526 | 14.0% | 5.0% (+8.99)#47 | 4.9% (+9.09)#1,278 |
| 48. | 72773 | 13.8% | 5.0% (+8.75)#48 | 4.9% (+8.85)#1,322 |
| 49. | 72845 | 13.7% | 5.0% (+8.65)#49 | 4.9% (+8.74)#1,349 |
| 50. | 71677 | 13.6% | 5.0% (+8.59)#50 | 4.9% (+8.69)#1,368 |
| 51. | 72127 | 13.3% | 5.0% (+8.31)#51 | 4.9% (+8.40)#1,430 |
| 52. | 72853 | 13.2% | 5.0% (+8.20)#52 | 4.9% (+8.30)#1,468 |
| 53. | 72444 | 12.8% | 5.0% (+7.74)#53 | 4.9% (+7.84)#1,598 |
| 54. | 72685 | 12.7% | 5.0% (+7.66)#54 | 4.9% (+7.75)#1,624 |
| 55. | 72458 | 12.7% | 5.0% (+7.63)#55 | 4.9% (+7.72)#1,628 |
| 56. | 71839 | 12.6% | 5.0% (+7.57)#56 | 4.9% (+7.67)#1,650 |
| 57. | 72376 | 12.6% | 5.0% (+7.56)#57 | 4.9% (+7.65)#1,652 |
| 58. | 71646 | 12.4% | 5.0% (+7.32)#58 | 4.9% (+7.41)#1,728 |
| 59. | 72333 | 12.2% | 5.0% (+7.17)#59 | 4.9% (+7.27)#1,781 |
| 60. | 71841 | 12.1% | 5.0% (+7.04)#60 | 4.9% (+7.13)#1,819 |
| 61. | 72930 | 11.7% | 5.0% (+6.65)#61 | 4.9% (+6.74)#1,991 |
| 62. | 72601 | 11.6% | 5.0% (+6.55)#62 | 4.9% (+6.65)#2,024 |
| 63. | 71855 | 11.5% | 5.0% (+6.46)#63 | 4.9% (+6.56)#2,073 |
| 64. | 72662 | 11.2% | 5.0% (+6.12)#64 | 4.9% (+6.22)#2,248 |
| 65. | 72531 | 11.1% | 5.0% (+6.03)#65 | 4.9% (+6.12)#2,292 |
| 66. | 72364 | 11.1% | 5.0% (+6.02)#66 | 4.9% (+6.12)#2,295 |
| 67. | 72073 | 11.0% | 5.0% (+5.94)#67 | 4.9% (+6.03)#2,336 |
| 68. | 72003 | 10.9% | 5.0% (+5.89)#68 | 4.9% (+5.99)#2,352 |
| 69. | 72153 | 10.9% | 5.0% (+5.85)#69 | 4.9% (+5.94)#2,372 |
| 70. | 71845 | 10.7% | 5.0% (+5.66)#70 | 4.9% (+5.76)#2,475 |
| 71. | 71835 | 10.5% | 5.0% (+5.46)#71 | 4.9% (+5.56)#2,586 |
| 72. | 72117 | 10.5% | 5.0% (+5.41)#72 | 4.9% (+5.51)#2,611 |
| 73. | 72471 | 10.4% | 5.0% (+5.39)#73 | 4.9% (+5.48)#2,621 |
| 74. | 71751 | 10.4% | 5.0% (+5.36)#74 | 4.9% (+5.45)#2,641 |
| 75. | 72131 | 10.4% | 5.0% (+5.32)#75 | 4.9% (+5.41)#2,670 |
| 76. | 72347 | 10.3% | 5.0% (+5.23)#76 | 4.9% (+5.33)#2,720 |
| 77. | 72683 | 10.1% | 5.0% (+5.09)#77 | 4.9% (+5.19)#2,795 |
| 78. | 72462 | 10.1% | 5.0% (+5.06)#78 | 4.9% (+5.15)#2,827 |
| 79. | 72394 | 10.1% | 5.0% (+5.06)#79 | 4.9% (+5.15)#2,828 |
| 80. | 72021 | 10.0% | 5.0% (+4.99)#80 | 4.9% (+5.09)#2,860 |
| 81. | 72434 | 10.0% | 5.0% (+4.97)#81 | 4.9% (+5.07)#2,874 |
| 82. | 72086 | 9.9% | 5.0% (+4.87)#82 | 4.9% (+4.97)#2,943 |
| 83. | 72209 | 9.7% | 5.0% (+4.62)#83 | 4.9% (+4.72)#3,106 |
| 84. | 72027 | 9.5% | 5.0% (+4.45)#84 | 4.9% (+4.55)#3,244 |
| 85. | 72413 | 9.5% | 5.0% (+4.43)#85 | 4.9% (+4.53)#3,256 |
| 86. | 72081 | 9.5% | 5.0% (+4.43)#86 | 4.9% (+4.53)#3,257 |
| 87. | 72457 | 9.4% | 5.0% (+4.36)#87 | 4.9% (+4.46)#3,317 |
| 88. | 72517 | 9.4% | 5.0% (+4.33)#88 | 4.9% (+4.43)#3,337 |
| 89. | 72384 | 9.4% | 5.0% (+4.32)#89 | 4.9% (+4.41)#3,351 |
| 90. | 72412 | 9.3% | 5.0% (+4.24)#90 | 4.9% (+4.34)#3,413 |
| 91. | 72641 | 9.3% | 5.0% (+4.23)#91 | 4.9% (+4.32)#3,428 |
| 92. | 72141 | 9.2% | 5.0% (+4.12)#92 | 4.9% (+4.21)#3,523 |
| 93. | 72456 | 9.2% | 5.0% (+4.11)#93 | 4.9% (+4.21)#3,527 |
| 94. | 72722 | 9.1% | 5.0% (+4.10)#94 | 4.9% (+4.20)#3,538 |
| 95. | 72365 | 9.0% | 5.0% (+3.96)#95 | 4.9% (+4.06)#3,700 |
| 96. | 71752 | 9.0% | 5.0% (+3.92)#96 | 4.9% (+4.02)#3,736 |
| 97. | 72821 | 8.9% | 5.0% (+3.83)#97 | 4.9% (+3.93)#3,848 |
| 98. | 71861 | 8.9% | 5.0% (+3.82)#98 | 4.9% (+3.91)#3,858 |
| 99. | 72301 | 8.9% | 5.0% (+3.82)#99 | 4.9% (+3.91)#3,861 |
| 100. | 72469 | 8.8% | 5.0% (+3.81)#100 | 4.9% (+3.90)#3,871 |
Common Questions
What are the Top 10 Zip Codes with the Highest Percentage of Population Employed in Transportation & Warehousing in Arkansas?
Top 10 Zip Codes with the Highest Percentage of Population Employed in Transportation & Warehousing in Arkansas are:
What zip code has the Highest Percentage of Population Employed in Transportation & Warehousing in Arkansas?
72075 has the Highest Percentage of Population Employed in Transportation & Warehousing in Arkansas with 83.3%.
What is the Percentage of Population Employed in Transportation & Warehousing in the State of Arkansas?
Percentage of Population Employed in Transportation & Warehousing in Arkansas is 5.0%.
What is the Percentage of Population Employed in Transportation & Warehousing in the United States?
Percentage of Population Employed in Transportation & Warehousing in the United States is 4.9%.