Zip Codes with the Highest Percentage of Population Employed in Transportation & Warehousing in Mississippi
RELATED REPORTS & OPTIONS
Transportation & Warehousing
Mississippi
Compare Zip Codes
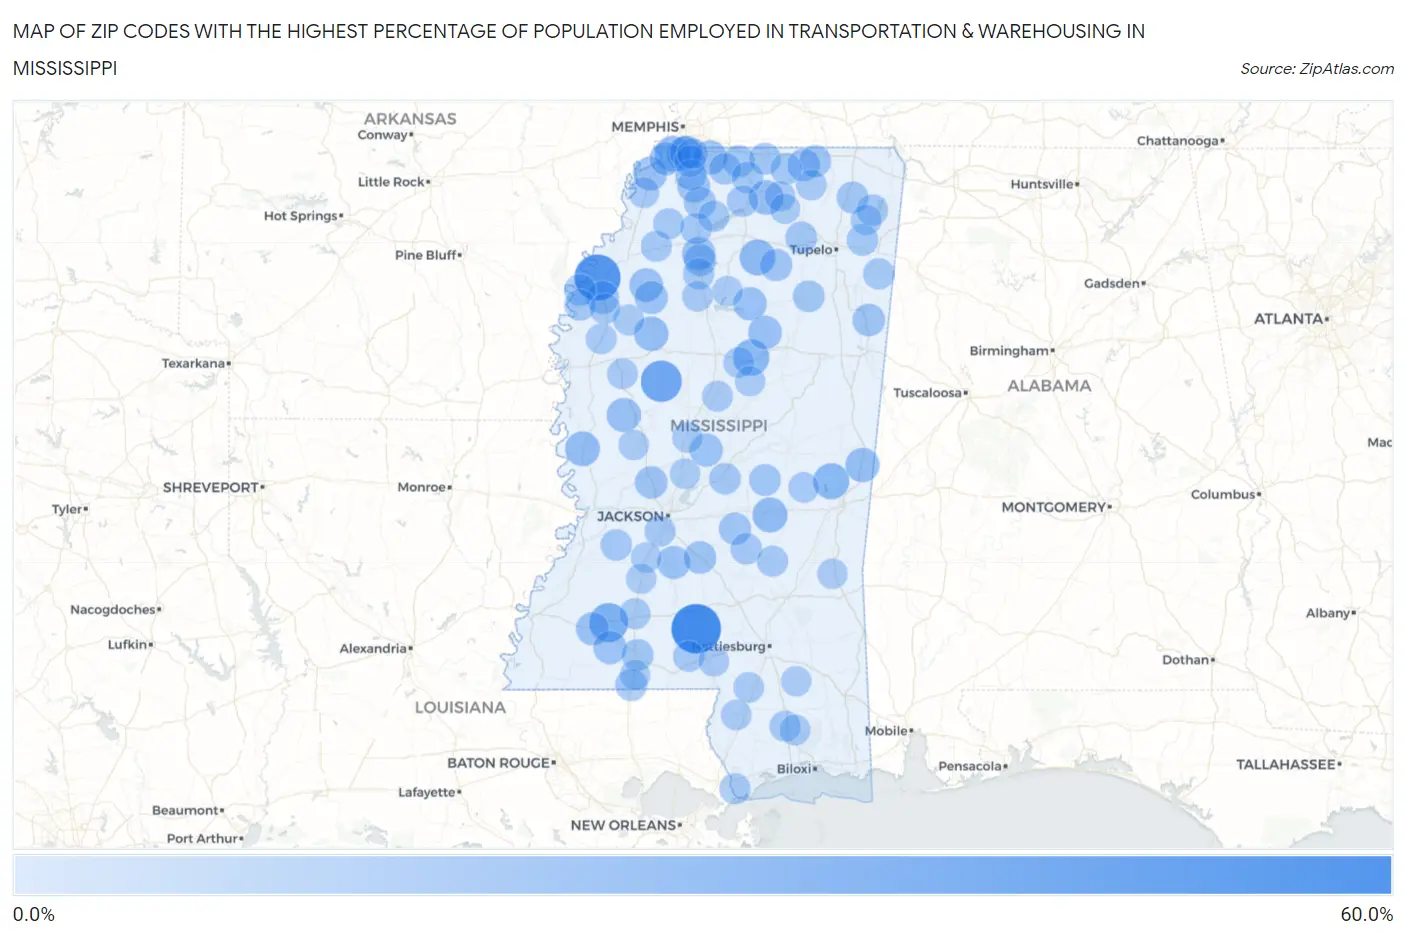
Map of Zip Codes with the Highest Percentage of Population Employed in Transportation & Warehousing in Mississippi
0.0%
60.0%
Zip Codes with the Highest Percentage of Population Employed in Transportation & Warehousing in Mississippi
| Zip Code | % Employed | vs State | vs National | |
| 1. | 39656 | 52.8% | 5.8%(+47.0)#1 | 4.9%(+47.9)#69 |
| 2. | 38740 | 44.5% | 5.8%(+38.7)#2 | 4.9%(+39.6)#106 |
| 3. | 38924 | 33.0% | 5.8%(+27.2)#3 | 4.9%(+28.1)#189 |
| 4. | 39647 | 27.6% | 5.8%(+21.7)#4 | 4.9%(+22.6)#282 |
| 5. | 39767 | 21.4% | 5.8%(+15.6)#5 | 4.9%(+16.5)#455 |
| 6. | 39320 | 21.0% | 5.8%(+15.2)#6 | 4.9%(+16.1)#478 |
| 7. | 38949 | 20.3% | 5.8%(+14.5)#7 | 4.9%(+15.4)#520 |
| 8. | 38680 | 19.4% | 5.8%(+13.6)#8 | 4.9%(+14.5)#573 |
| 9. | 39336 | 18.5% | 5.8%(+12.6)#9 | 4.9%(+13.5)#644 |
| 10. | 39054 | 17.7% | 5.8%(+11.9)#10 | 4.9%(+12.8)#706 |
| 11. | 38637 | 17.5% | 5.8%(+11.7)#11 | 4.9%(+12.6)#721 |
| 12. | 38659 | 17.4% | 5.8%(+11.6)#12 | 4.9%(+12.5)#728 |
| 13. | 38952 | 17.2% | 5.8%(+11.3)#13 | 4.9%(+12.2)#758 |
| 14. | 38654 | 16.8% | 5.8%(+10.9)#14 | 4.9%(+11.8)#803 |
| 15. | 39352 | 16.7% | 5.8%(+10.8)#15 | 4.9%(+11.7)#819 |
| 16. | 39115 | 16.3% | 5.8%(+10.5)#16 | 4.9%(+11.3)#869 |
| 17. | 38664 | 15.5% | 5.8%(+9.70)#17 | 4.9%(+10.6)#970 |
| 18. | 38957 | 15.4% | 5.8%(+9.56)#18 | 4.9%(+10.4)#989 |
| 19. | 39737 | 15.4% | 5.8%(+9.56)#19 | 4.9%(+10.4)#992 |
| 20. | 38620 | 14.7% | 5.8%(+8.85)#20 | 4.9%(+9.73)#1,128 |
| 21. | 38914 | 14.7% | 5.8%(+8.83)#21 | 4.9%(+9.71)#1,130 |
| 22. | 38641 | 14.6% | 5.8%(+8.77)#22 | 4.9%(+9.65)#1,144 |
| 23. | 39045 | 14.5% | 5.8%(+8.67)#23 | 4.9%(+9.55)#1,168 |
| 24. | 39630 | 14.3% | 5.8%(+8.51)#24 | 4.9%(+9.39)#1,197 |
| 25. | 39664 | 14.3% | 5.8%(+8.48)#25 | 4.9%(+9.36)#1,199 |
| 26. | 38966 | 14.3% | 5.8%(+8.46)#26 | 4.9%(+9.34)#1,204 |
| 27. | 38781 | 14.3% | 5.8%(+8.46)#27 | 4.9%(+9.34)#1,212 |
| 28. | 39082 | 14.3% | 5.8%(+8.43)#28 | 4.9%(+9.31)#1,227 |
| 29. | 38671 | 14.1% | 5.8%(+8.25)#29 | 4.9%(+9.13)#1,266 |
| 30. | 38618 | 13.4% | 5.8%(+7.61)#30 | 4.9%(+8.49)#1,408 |
| 31. | 39071 | 13.3% | 5.8%(+7.43)#31 | 4.9%(+8.31)#1,464 |
| 32. | 39062 | 13.1% | 5.8%(+7.27)#32 | 4.9%(+8.15)#1,511 |
| 33. | 39746 | 13.1% | 5.8%(+7.25)#33 | 4.9%(+8.13)#1,518 |
| 34. | 38629 | 12.8% | 5.8%(+6.98)#34 | 4.9%(+7.86)#1,592 |
| 35. | 39152 | 12.3% | 5.8%(+6.51)#35 | 4.9%(+7.39)#1,735 |
| 36. | 38864 | 12.2% | 5.8%(+6.39)#36 | 4.9%(+7.27)#1,776 |
| 37. | 38658 | 12.1% | 5.8%(+6.29)#37 | 4.9%(+7.17)#1,804 |
| 38. | 38683 | 12.0% | 5.8%(+6.15)#38 | 4.9%(+7.03)#1,871 |
| 39. | 38668 | 11.8% | 5.8%(+5.97)#39 | 4.9%(+6.85)#1,953 |
| 40. | 39666 | 11.5% | 5.8%(+5.71)#40 | 4.9%(+6.59)#2,062 |
| 41. | 39657 | 11.5% | 5.8%(+5.67)#41 | 4.9%(+6.55)#2,078 |
| 42. | 38661 | 11.4% | 5.8%(+5.54)#42 | 4.9%(+6.42)#2,136 |
| 43. | 38746 | 11.4% | 5.8%(+5.54)#43 | 4.9%(+6.42)#2,141 |
| 44. | 38841 | 11.3% | 5.8%(+5.47)#44 | 4.9%(+6.35)#2,179 |
| 45. | 38611 | 11.3% | 5.8%(+5.46)#45 | 4.9%(+6.34)#2,187 |
| 46. | 38642 | 11.3% | 5.8%(+5.45)#46 | 4.9%(+6.33)#2,196 |
| 47. | 39359 | 11.2% | 5.8%(+5.41)#47 | 4.9%(+6.29)#2,212 |
| 48. | 38851 | 11.1% | 5.8%(+5.30)#48 | 4.9%(+6.18)#2,258 |
| 49. | 38829 | 11.1% | 5.8%(+5.23)#49 | 4.9%(+6.11)#2,299 |
| 50. | 38666 | 10.9% | 5.8%(+5.12)#50 | 4.9%(+6.00)#2,348 |
| 51. | 39094 | 10.9% | 5.8%(+5.07)#51 | 4.9%(+5.95)#2,368 |
| 52. | 38855 | 10.6% | 5.8%(+4.81)#52 | 4.9%(+5.69)#2,510 |
| 53. | 39153 | 10.5% | 5.8%(+4.72)#53 | 4.9%(+5.60)#2,565 |
| 54. | 39175 | 10.5% | 5.8%(+4.69)#54 | 4.9%(+5.57)#2,581 |
| 55. | 38769 | 10.5% | 5.8%(+4.65)#55 | 4.9%(+5.53)#2,596 |
| 56. | 38603 | 10.5% | 5.8%(+4.65)#56 | 4.9%(+5.53)#2,599 |
| 57. | 38635 | 10.4% | 5.8%(+4.57)#57 | 4.9%(+5.45)#2,639 |
| 58. | 38859 | 10.3% | 5.8%(+4.50)#58 | 4.9%(+5.38)#2,697 |
| 59. | 38651 | 10.3% | 5.8%(+4.46)#59 | 4.9%(+5.34)#2,712 |
| 60. | 38685 | 10.2% | 5.8%(+4.39)#60 | 4.9%(+5.27)#2,752 |
| 61. | 38619 | 10.0% | 5.8%(+4.15)#61 | 4.9%(+5.03)#2,912 |
| 62. | 38870 | 10.0% | 5.8%(+4.13)#62 | 4.9%(+5.01)#2,928 |
| 63. | 38948 | 9.8% | 5.8%(+4.02)#63 | 4.9%(+4.90)#2,987 |
| 64. | 39643 | 9.7% | 5.8%(+3.85)#64 | 4.9%(+4.73)#3,091 |
| 65. | 38646 | 9.7% | 5.8%(+3.83)#65 | 4.9%(+4.71)#3,114 |
| 66. | 39601 | 9.6% | 5.8%(+3.82)#66 | 4.9%(+4.70)#3,121 |
| 67. | 39422 | 9.6% | 5.8%(+3.80)#67 | 4.9%(+4.68)#3,146 |
| 68. | 39572 | 9.6% | 5.8%(+3.75)#68 | 4.9%(+4.63)#3,190 |
| 69. | 38632 | 9.4% | 5.8%(+3.59)#69 | 4.9%(+4.47)#3,306 |
| 70. | 38621 | 9.4% | 5.8%(+3.58)#70 | 4.9%(+4.46)#3,310 |
| 71. | 39561 | 9.3% | 5.8%(+3.48)#71 | 4.9%(+4.36)#3,381 |
| 72. | 39272 | 9.3% | 5.8%(+3.48)#72 | 4.9%(+4.36)#3,384 |
| 73. | 38856 | 9.2% | 5.8%(+3.40)#73 | 4.9%(+4.28)#3,454 |
| 74. | 39573 | 9.1% | 5.8%(+3.28)#74 | 4.9%(+4.16)#3,582 |
| 75. | 39192 | 9.1% | 5.8%(+3.28)#75 | 4.9%(+4.16)#3,584 |
| 76. | 38771 | 9.1% | 5.8%(+3.27)#76 | 4.9%(+4.15)#3,590 |
| 77. | 38676 | 9.1% | 5.8%(+3.26)#77 | 4.9%(+4.14)#3,596 |
| 78. | 38672 | 9.1% | 5.8%(+3.23)#78 | 4.9%(+4.11)#3,644 |
| 79. | 39747 | 9.0% | 5.8%(+3.14)#79 | 4.9%(+4.02)#3,734 |
| 80. | 38953 | 9.0% | 5.8%(+3.13)#80 | 4.9%(+4.01)#3,750 |
| 81. | 38759 | 9.0% | 5.8%(+3.12)#81 | 4.9%(+4.00)#3,753 |
| 82. | 38753 | 8.9% | 5.8%(+3.10)#82 | 4.9%(+3.98)#3,779 |
| 83. | 38773 | 8.8% | 5.8%(+2.99)#83 | 4.9%(+3.87)#3,916 |
| 84. | 39146 | 8.6% | 5.8%(+2.77)#84 | 4.9%(+3.65)#4,159 |
| 85. | 39429 | 8.6% | 5.8%(+2.75)#85 | 4.9%(+3.63)#4,178 |
| 86. | 38663 | 8.5% | 5.8%(+2.68)#86 | 4.9%(+3.56)#4,273 |
| 87. | 39470 | 8.5% | 5.8%(+2.67)#87 | 4.9%(+3.55)#4,279 |
| 88. | 39337 | 8.4% | 5.8%(+2.55)#88 | 4.9%(+3.43)#4,414 |
| 89. | 39455 | 8.3% | 5.8%(+2.52)#89 | 4.9%(+3.40)#4,446 |
| 90. | 39059 | 8.3% | 5.8%(+2.49)#90 | 4.9%(+3.37)#4,495 |
| 91. | 38633 | 8.3% | 5.8%(+2.45)#91 | 4.9%(+3.33)#4,545 |
| 92. | 38922 | 8.3% | 5.8%(+2.43)#92 | 4.9%(+3.31)#4,572 |
| 93. | 39652 | 8.2% | 5.8%(+2.33)#93 | 4.9%(+3.21)#4,685 |
| 94. | 39046 | 8.0% | 5.8%(+2.21)#94 | 4.9%(+3.09)#4,842 |
| 95. | 38650 | 8.0% | 5.8%(+2.17)#95 | 4.9%(+3.05)#4,902 |
| 96. | 39360 | 8.0% | 5.8%(+2.16)#96 | 4.9%(+3.04)#4,919 |
| 97. | 39425 | 8.0% | 5.8%(+2.13)#97 | 4.9%(+3.01)#4,958 |
| 98. | 39083 | 7.9% | 5.8%(+2.08)#98 | 4.9%(+2.96)#5,021 |
| 99. | 39194 | 7.8% | 5.8%(+2.01)#99 | 4.9%(+2.89)#5,132 |
| 100. | 39745 | 7.8% | 5.8%(+1.97)#100 | 4.9%(+2.85)#5,185 |
Common Questions
What are the Top 10 Zip Codes with the Highest Percentage of Population Employed in Transportation & Warehousing in Mississippi?
Top 10 Zip Codes with the Highest Percentage of Population Employed in Transportation & Warehousing in Mississippi are:
What zip code has the Highest Percentage of Population Employed in Transportation & Warehousing in Mississippi?
39656 has the Highest Percentage of Population Employed in Transportation & Warehousing in Mississippi with 52.8%.
What is the Percentage of Population Employed in Transportation & Warehousing in the State of Mississippi?
Percentage of Population Employed in Transportation & Warehousing in Mississippi is 5.8%.
What is the Percentage of Population Employed in Transportation & Warehousing in the United States?
Percentage of Population Employed in Transportation & Warehousing in the United States is 4.9%.