Zip Codes with the Highest Percentage of Population Employed in Transportation & Warehousing in Connecticut
RELATED REPORTS & OPTIONS
Transportation & Warehousing
Connecticut
Compare Zip Codes
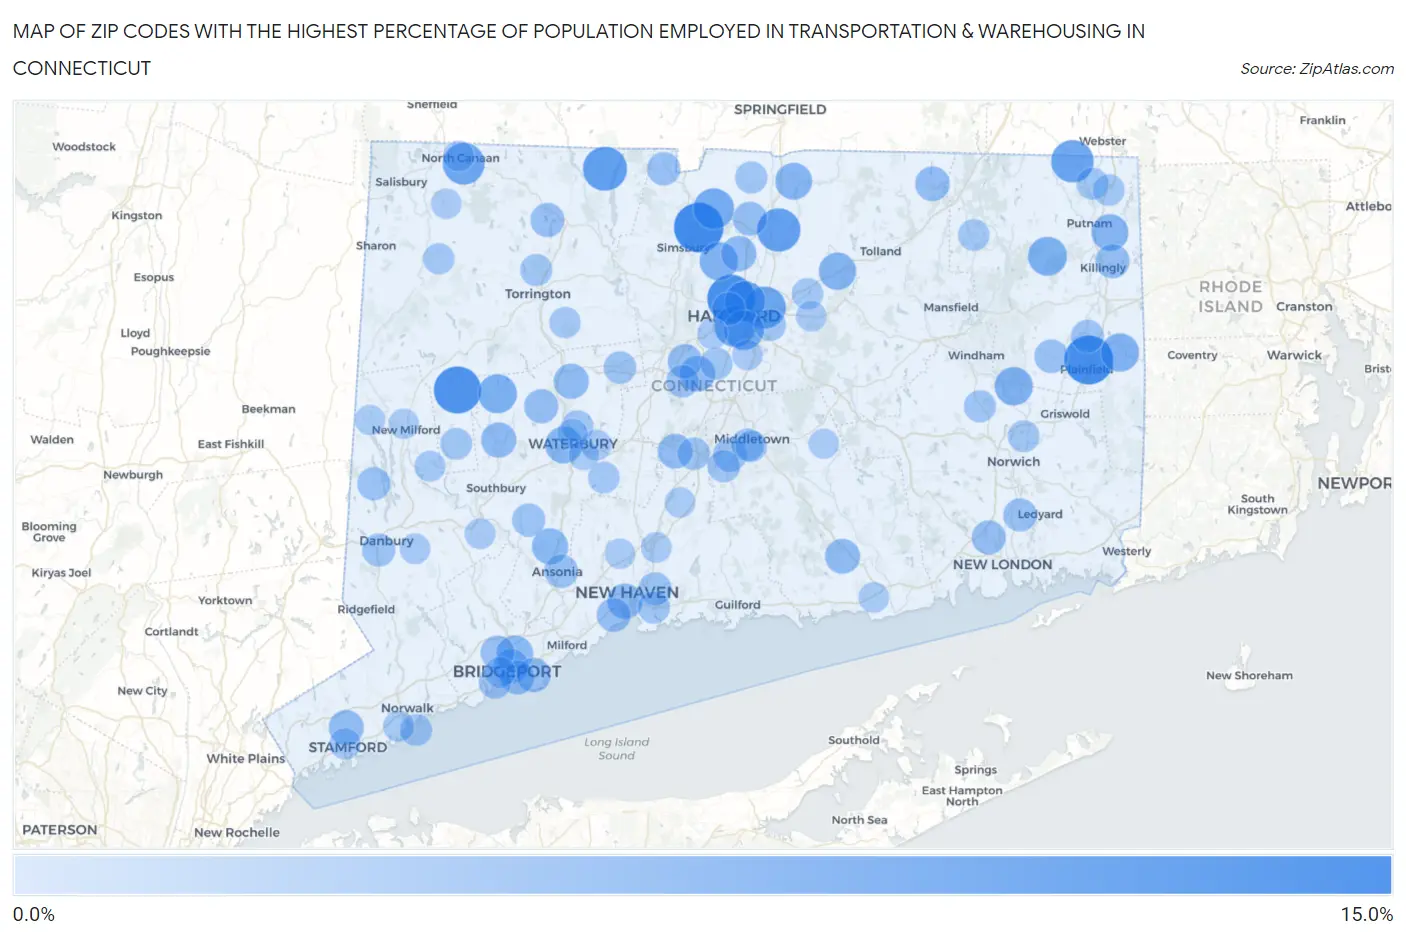
Map of Zip Codes with the Highest Percentage of Population Employed in Transportation & Warehousing in Connecticut
0.0%
15.0%
Zip Codes with the Highest Percentage of Population Employed in Transportation & Warehousing in Connecticut
| Zip Code | % Employed | vs State | vs National | |
| 1. | 06081 | 14.2% | 3.8%(+10.4)#1 | 4.9%(+9.26)#1,236 |
| 2. | 06374 | 13.8% | 3.8%(+10.0)#2 | 4.9%(+8.90)#1,314 |
| 3. | 06112 | 13.3% | 3.8%(+9.47)#3 | 4.9%(+8.31)#1,461 |
| 4. | 06793 | 12.9% | 3.8%(+9.11)#4 | 4.9%(+7.96)#1,561 |
| 5. | 06091 | 11.1% | 3.8%(+7.32)#5 | 4.9%(+6.16)#2,272 |
| 6. | 06088 | 10.7% | 3.8%(+6.93)#6 | 4.9%(+5.78)#2,460 |
| 7. | 06262 | 10.2% | 3.8%(+6.42)#7 | 4.9%(+5.27)#2,749 |
| 8. | 06108 | 9.9% | 3.8%(+6.08)#8 | 4.9%(+4.93)#2,966 |
| 9. | 06024 | 9.9% | 3.8%(+6.07)#9 | 4.9%(+4.92)#2,975 |
| 10. | 06106 | 9.6% | 3.8%(+5.76)#10 | 4.9%(+4.61)#3,199 |
| 11. | 06026 | 9.2% | 3.8%(+5.43)#11 | 4.9%(+4.28)#3,455 |
| 12. | 06120 | 9.1% | 3.8%(+5.34)#12 | 4.9%(+4.19)#3,557 |
| 13. | 06114 | 8.8% | 3.8%(+5.04)#13 | 4.9%(+3.89)#3,894 |
| 14. | 06259 | 8.3% | 3.8%(+4.53)#14 | 4.9%(+3.38)#4,486 |
| 15. | 06751 | 8.3% | 3.8%(+4.47)#15 | 4.9%(+3.32)#4,550 |
| 16. | 06002 | 7.9% | 3.8%(+4.15)#16 | 4.9%(+3.00)#4,965 |
| 17. | 06354 | 7.9% | 3.8%(+4.07)#17 | 4.9%(+2.92)#5,087 |
| 18. | 06330 | 7.9% | 3.8%(+4.07)#18 | 4.9%(+2.92)#5,092 |
| 19. | 06066 | 7.4% | 3.8%(+3.58)#19 | 4.9%(+2.43)#5,870 |
| 20. | 06708 | 7.2% | 3.8%(+3.45)#20 | 4.9%(+2.30)#6,110 |
| 21. | 06082 | 7.2% | 3.8%(+3.37)#21 | 4.9%(+2.21)#6,249 |
| 22. | 06260 | 7.1% | 3.8%(+3.33)#22 | 4.9%(+2.17)#6,315 |
| 23. | 06610 | 6.9% | 3.8%(+3.10)#23 | 4.9%(+1.95)#6,774 |
| 24. | 06483 | 6.8% | 3.8%(+2.96)#24 | 4.9%(+1.81)#7,054 |
| 25. | 06051 | 6.4% | 3.8%(+2.64)#25 | 4.9%(+1.49)#7,728 |
| 26. | 06519 | 6.4% | 3.8%(+2.59)#26 | 4.9%(+1.44)#7,840 |
| 27. | 06095 | 6.3% | 3.8%(+2.54)#27 | 4.9%(+1.38)#7,973 |
| 28. | 06798 | 6.3% | 3.8%(+2.47)#28 | 4.9%(+1.32)#8,128 |
| 29. | 06782 | 6.2% | 3.8%(+2.44)#29 | 4.9%(+1.29)#8,211 |
| 30. | 06905 | 6.2% | 3.8%(+2.39)#30 | 4.9%(+1.24)#8,322 |
| 31. | 06417 | 6.1% | 3.8%(+2.30)#31 | 4.9%(+1.15)#8,545 |
| 32. | 06451 | 5.9% | 3.8%(+2.15)#32 | 4.9%(+0.996)#8,918 |
| 33. | 06076 | 5.9% | 3.8%(+2.14)#33 | 4.9%(+0.983)#8,952 |
| 34. | 06608 | 5.9% | 3.8%(+2.12)#34 | 4.9%(+0.973)#8,983 |
| 35. | 06053 | 5.8% | 3.8%(+2.01)#35 | 4.9%(+0.859)#9,324 |
| 36. | 06615 | 5.8% | 3.8%(+1.99)#36 | 4.9%(+0.842)#9,380 |
| 37. | 06607 | 5.7% | 3.8%(+1.90)#37 | 4.9%(+0.751)#9,662 |
| 38. | 06241 | 5.7% | 3.8%(+1.90)#38 | 4.9%(+0.745)#9,680 |
| 39. | 06096 | 5.7% | 3.8%(+1.88)#39 | 4.9%(+0.725)#9,748 |
| 40. | 06795 | 5.7% | 3.8%(+1.86)#40 | 4.9%(+0.707)#9,805 |
| 41. | 06375 | 5.6% | 3.8%(+1.84)#41 | 4.9%(+0.685)#9,857 |
| 42. | 06516 | 5.6% | 3.8%(+1.82)#42 | 4.9%(+0.669)#9,916 |
| 43. | 06098 | 5.6% | 3.8%(+1.82)#43 | 4.9%(+0.667)#9,924 |
| 44. | 06606 | 5.5% | 3.8%(+1.75)#44 | 4.9%(+0.601)#10,116 |
| 45. | 06331 | 5.4% | 3.8%(+1.62)#45 | 4.9%(+0.467)#10,526 |
| 46. | 06401 | 5.4% | 3.8%(+1.56)#46 | 4.9%(+0.410)#10,731 |
| 47. | 06481 | 5.3% | 3.8%(+1.49)#47 | 4.9%(+0.333)#10,974 |
| 48. | 06335 | 5.2% | 3.8%(+1.42)#48 | 4.9%(+0.271)#11,180 |
| 49. | 06060 | 5.2% | 3.8%(+1.41)#49 | 4.9%(+0.261)#11,218 |
| 50. | 06812 | 5.2% | 3.8%(+1.37)#50 | 4.9%(+0.215)#11,395 |
| 51. | 06105 | 5.1% | 3.8%(+1.35)#51 | 4.9%(+0.201)#11,444 |
| 52. | 06478 | 5.1% | 3.8%(+1.33)#52 | 4.9%(+0.182)#11,510 |
| 53. | 06513 | 5.1% | 3.8%(+1.32)#53 | 4.9%(+0.168)#11,563 |
| 54. | 06810 | 5.1% | 3.8%(+1.31)#54 | 4.9%(+0.154)#11,611 |
| 55. | 06332 | 5.0% | 3.8%(+1.19)#55 | 4.9%(+0.043)#11,979 |
| 56. | 06459 | 4.9% | 3.8%(+1.11)#56 | 4.9%(-0.038)#12,246 |
| 57. | 06605 | 4.8% | 3.8%(+1.01)#57 | 4.9%(-0.137)#12,602 |
| 58. | 06450 | 4.8% | 3.8%(+1.01)#58 | 4.9%(-0.139)#12,614 |
| 59. | 06052 | 4.8% | 3.8%(+1.01)#59 | 4.9%(-0.142)#12,623 |
| 60. | 06010 | 4.8% | 3.8%(+1.01)#60 | 4.9%(-0.143)#12,629 |
| 61. | 06455 | 4.8% | 3.8%(+0.968)#61 | 4.9%(-0.184)#12,771 |
| 62. | 06512 | 4.7% | 3.8%(+0.870)#62 | 4.9%(-0.282)#13,155 |
| 63. | 06111 | 4.6% | 3.8%(+0.847)#63 | 4.9%(-0.305)#13,247 |
| 64. | 06078 | 4.6% | 3.8%(+0.814)#64 | 4.9%(-0.338)#13,363 |
| 65. | 06254 | 4.6% | 3.8%(+0.781)#65 | 4.9%(-0.371)#13,508 |
| 66. | 06790 | 4.5% | 3.8%(+0.739)#66 | 4.9%(-0.413)#13,683 |
| 67. | 06704 | 4.5% | 3.8%(+0.737)#67 | 4.9%(-0.415)#13,691 |
| 68. | 06255 | 4.5% | 3.8%(+0.728)#68 | 4.9%(-0.424)#13,719 |
| 69. | 06855 | 4.4% | 3.8%(+0.652)#69 | 4.9%(-0.499)#13,976 |
| 70. | 06380 | 4.4% | 3.8%(+0.609)#70 | 4.9%(-0.543)#14,152 |
| 71. | 06118 | 4.4% | 3.8%(+0.608)#71 | 4.9%(-0.544)#14,157 |
| 72. | 06783 | 4.4% | 3.8%(+0.568)#72 | 4.9%(-0.584)#14,334 |
| 73. | 06277 | 4.4% | 3.8%(+0.562)#73 | 4.9%(-0.590)#14,359 |
| 74. | 06712 | 4.3% | 3.8%(+0.534)#74 | 4.9%(-0.618)#14,482 |
| 75. | 06278 | 4.3% | 3.8%(+0.469)#75 | 4.9%(-0.683)#14,745 |
| 76. | 06457 | 4.2% | 3.8%(+0.431)#76 | 4.9%(-0.721)#14,914 |
| 77. | 06042 | 4.2% | 3.8%(+0.416)#77 | 4.9%(-0.736)#14,982 |
| 78. | 06796 | 4.2% | 3.8%(+0.362)#78 | 4.9%(-0.790)#15,233 |
| 79. | 06791 | 4.1% | 3.8%(+0.326)#79 | 4.9%(-0.826)#15,377 |
| 80. | 06604 | 4.1% | 3.8%(+0.319)#80 | 4.9%(-0.833)#15,408 |
| 81. | 06902 | 4.1% | 3.8%(+0.297)#81 | 4.9%(-0.855)#15,509 |
| 82. | 06854 | 4.1% | 3.8%(+0.278)#82 | 4.9%(-0.874)#15,594 |
| 83. | 06752 | 4.0% | 3.8%(+0.166)#83 | 4.9%(-0.986)#16,088 |
| 84. | 06705 | 3.9% | 3.8%(+0.113)#84 | 4.9%(-1.04)#16,329 |
| 85. | 06801 | 3.8% | 3.8%(+0.049)#85 | 4.9%(-1.10)#16,604 |
| 86. | 06473 | 3.8% | 3.8%(+0.036)#86 | 4.9%(-1.12)#16,655 |
| 87. | 06018 | 3.8% | 3.8%(+0.033)#87 | 4.9%(-1.12)#16,669 |
| 88. | 06482 | 3.8% | 3.8%(+0.003)#88 | 4.9%(-1.15)#16,811 |
| 89. | 06110 | 3.8% | 3.8%(-0.002)#89 | 4.9%(-1.15)#16,828 |
| 90. | 06109 | 3.8% | 3.8%(-0.029)#90 | 4.9%(-1.18)#16,937 |
| 91. | 06040 | 3.8% | 3.8%(-0.034)#91 | 4.9%(-1.19)#16,973 |
| 92. | 06475 | 3.7% | 3.8%(-0.046)#92 | 4.9%(-1.20)#17,033 |
| 93. | 06031 | 3.7% | 3.8%(-0.086)#93 | 4.9%(-1.24)#17,192 |
| 94. | 06492 | 3.7% | 3.8%(-0.092)#94 | 4.9%(-1.24)#17,227 |
| 95. | 06776 | 3.7% | 3.8%(-0.099)#95 | 4.9%(-1.25)#17,252 |
| 96. | 06514 | 3.6% | 3.8%(-0.145)#96 | 4.9%(-1.30)#17,431 |
| 97. | 06710 | 3.6% | 3.8%(-0.150)#97 | 4.9%(-1.30)#17,453 |
| 98. | 06784 | 3.6% | 3.8%(-0.164)#98 | 4.9%(-1.32)#17,526 |
| 99. | 06706 | 3.6% | 3.8%(-0.168)#99 | 4.9%(-1.32)#17,542 |
| 100. | 06424 | 3.6% | 3.8%(-0.178)#100 | 4.9%(-1.33)#17,583 |
Common Questions
What are the Top 10 Zip Codes with the Highest Percentage of Population Employed in Transportation & Warehousing in Connecticut?
Top 10 Zip Codes with the Highest Percentage of Population Employed in Transportation & Warehousing in Connecticut are:
What zip code has the Highest Percentage of Population Employed in Transportation & Warehousing in Connecticut?
06081 has the Highest Percentage of Population Employed in Transportation & Warehousing in Connecticut with 14.2%.
What is the Percentage of Population Employed in Transportation & Warehousing in the State of Connecticut?
Percentage of Population Employed in Transportation & Warehousing in Connecticut is 3.8%.
What is the Percentage of Population Employed in Transportation & Warehousing in the United States?
Percentage of Population Employed in Transportation & Warehousing in the United States is 4.9%.