Zip Codes with the Highest Percentage of Population Employed in Legal Services & Support in District Of Columbia
RELATED REPORTS & OPTIONS
Legal Services & Support
District Of Columbia
Compare Zip Codes
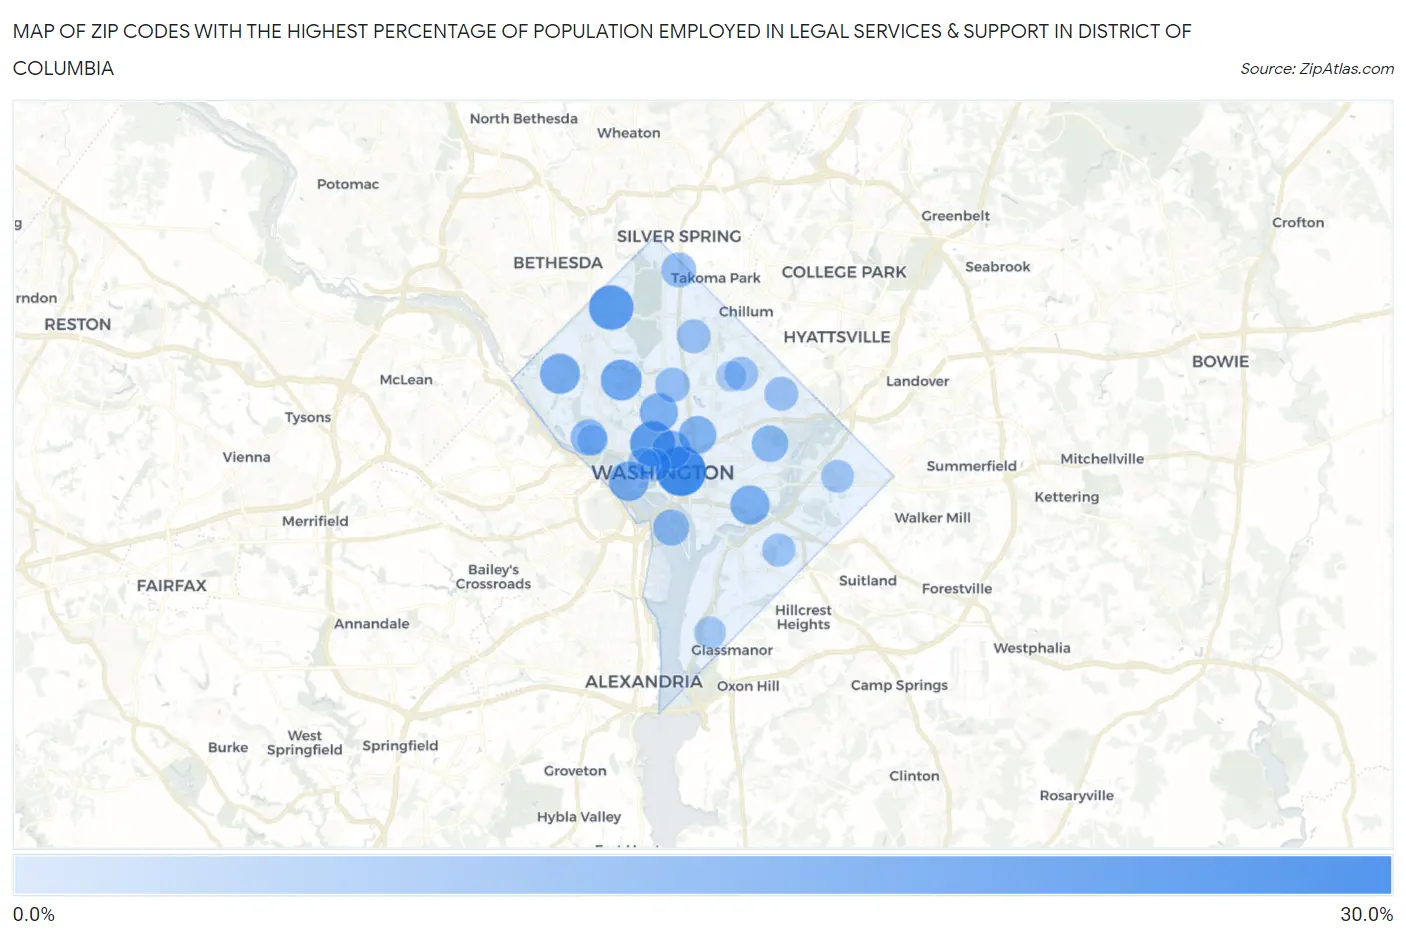
Map of Zip Codes with the Highest Percentage of Population Employed in Legal Services & Support in District Of Columbia
0.0%
30.0%
Zip Codes with the Highest Percentage of Population Employed in Legal Services & Support in District Of Columbia
| Zip Code | % Employed | vs State | vs National | |
| 1. | 20004 | 26.0% | 8.4%(+17.6)#1 | 1.2%(+24.8)#33 |
| 2. | 20036 | 19.4% | 8.4%(+11.1)#2 | 1.2%(+18.3)#52 |
| 3. | 20015 | 19.2% | 8.4%(+10.8)#3 | 1.2%(+18.0)#54 |
| 4. | 20008 | 14.2% | 8.4%(+5.87)#4 | 1.2%(+13.0)#89 |
| 5. | 20016 | 13.2% | 8.4%(+4.81)#5 | 1.2%(+12.0)#105 |
| 6. | 20037 | 12.6% | 8.4%(+4.19)#6 | 1.2%(+11.4)#111 |
| 7. | 20003 | 11.9% | 8.4%(+3.50)#7 | 1.2%(+10.7)#118 |
| 8. | 20005 | 11.1% | 8.4%(+2.70)#8 | 1.2%(+9.87)#130 |
| 9. | 20009 | 10.9% | 8.4%(+2.58)#9 | 1.2%(+9.76)#132 |
| 10. | 20001 | 10.0% | 8.4%(+1.65)#10 | 1.2%(+8.83)#156 |
| 11. | 20002 | 8.3% | 8.4%(-0.016)#11 | 1.2%(+7.16)#235 |
| 12. | 20007 | 7.8% | 8.4%(-0.522)#12 | 1.2%(+6.65)#279 |
| 13. | 20024 | 7.7% | 8.4%(-0.668)#13 | 1.2%(+6.51)#288 |
| 14. | 20012 | 6.2% | 8.4%(-2.15)#14 | 1.2%(+5.03)#442 |
| 15. | 20010 | 5.9% | 8.4%(-2.50)#15 | 1.2%(+4.67)#517 |
| 16. | 20011 | 4.8% | 8.4%(-3.51)#16 | 1.2%(+3.66)#763 |
| 17. | 20018 | 4.8% | 8.4%(-3.56)#17 | 1.2%(+3.62)#774 |
| 18. | 20017 | 4.7% | 8.4%(-3.69)#18 | 1.2%(+3.48)#821 |
| 19. | 20020 | 3.8% | 8.4%(-4.54)#19 | 1.2%(+2.64)#1,221 |
| 20. | 20006 | 3.8% | 8.4%(-4.55)#20 | 1.2%(+2.62)#1,229 |
| 21. | 20019 | 3.3% | 8.4%(-5.07)#21 | 1.2%(+2.10)#1,589 |
| 22. | 20052 | 2.1% | 8.4%(-6.27)#22 | 1.2%(+0.903)#3,249 |
| 23. | 20032 | 2.0% | 8.4%(-6.32)#23 | 1.2%(+0.853)#3,372 |
| 24. | 20057 | 0.92% | 8.4%(-7.44)#24 | 1.2%(-0.264)#8,431 |
| 25. | 20064 | 0.31% | 8.4%(-8.04)#25 | 1.2%(-0.869)#14,872 |
1
Common Questions
What are the Top 10 Zip Codes with the Highest Percentage of Population Employed in Legal Services & Support in District Of Columbia?
Top 10 Zip Codes with the Highest Percentage of Population Employed in Legal Services & Support in District Of Columbia are:
What zip code has the Highest Percentage of Population Employed in Legal Services & Support in District Of Columbia?
20004 has the Highest Percentage of Population Employed in Legal Services & Support in District Of Columbia with 26.0%.
What is the Percentage of Population Employed in Legal Services & Support in the State of District Of Columbia?
Percentage of Population Employed in Legal Services & Support in District Of Columbia is 8.4%.
What is the Percentage of Population Employed in Legal Services & Support in the United States?
Percentage of Population Employed in Legal Services & Support in the United States is 1.2%.