Zip Codes with the Highest Percentage of Population Employed in Legal Services & Support in Kansas
RELATED REPORTS & OPTIONS
Legal Services & Support
Kansas
Compare Zip Codes
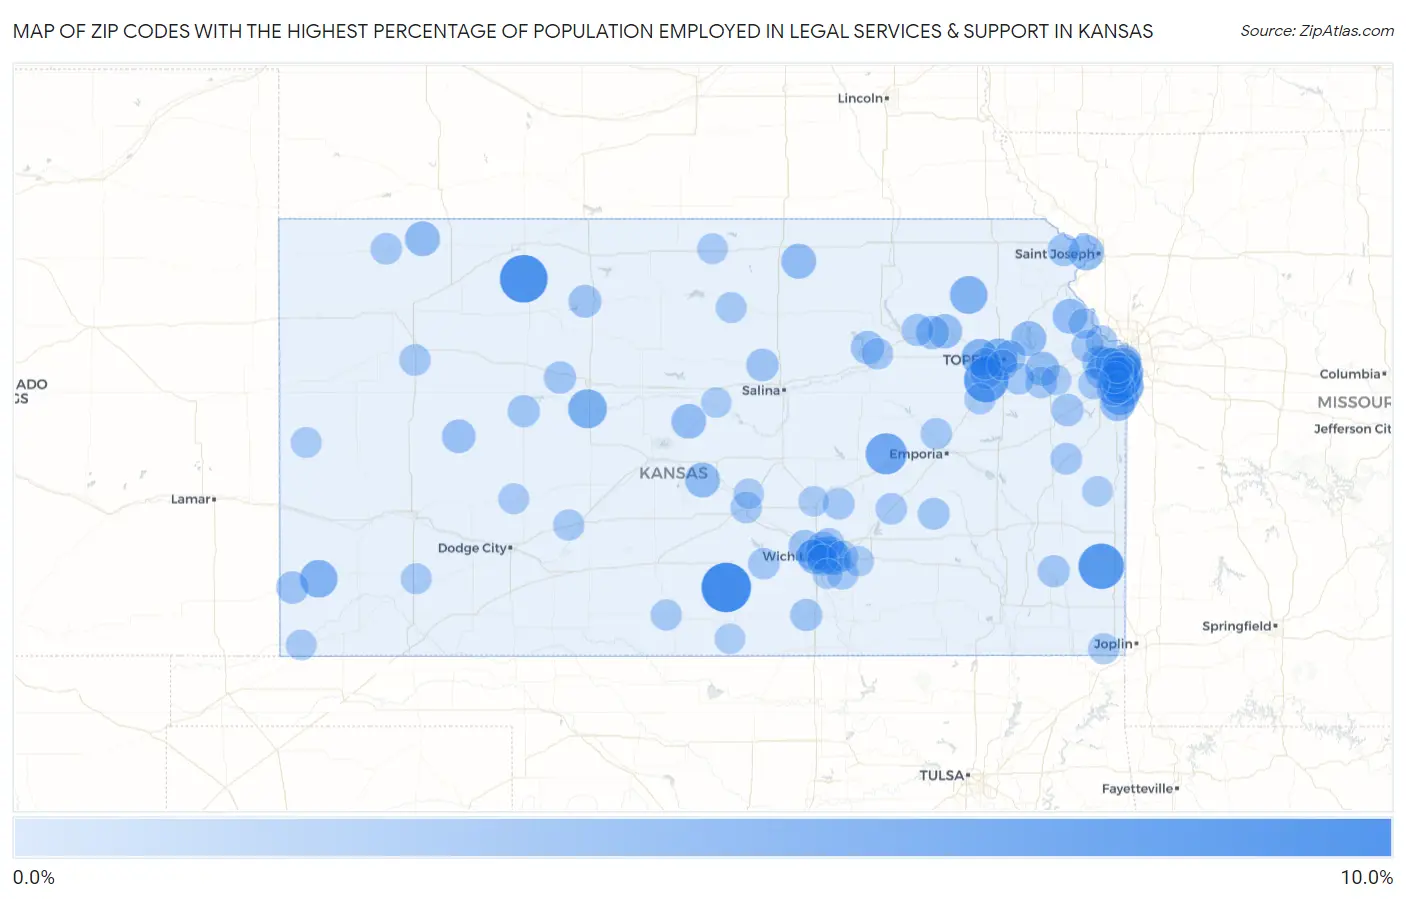
Map of Zip Codes with the Highest Percentage of Population Employed in Legal Services & Support in Kansas
0.0%
10.0%
Zip Codes with the Highest Percentage of Population Employed in Legal Services & Support in Kansas
| Zip Code | % Employed | vs State | vs National | |
| 1. | 67142 | 9.4% | 0.90%(+8.51)#1 | 1.2%(+8.23)#175 |
| 2. | 67645 | 8.6% | 0.90%(+7.70)#2 | 1.2%(+7.41)#222 |
| 3. | 66734 | 7.6% | 0.90%(+6.66)#3 | 1.2%(+6.38)#295 |
| 4. | 66402 | 7.1% | 0.90%(+6.19)#4 | 1.2%(+5.90)#339 |
| 5. | 66850 | 5.6% | 0.90%(+4.73)#5 | 1.2%(+4.45)#572 |
| 6. | 66211 | 5.1% | 0.90%(+4.17)#6 | 1.2%(+3.89)#699 |
| 7. | 66224 | 5.0% | 0.90%(+4.11)#7 | 1.2%(+3.82)#715 |
| 8. | 66206 | 4.7% | 0.90%(+3.76)#8 | 1.2%(+3.48)#824 |
| 9. | 67667 | 4.7% | 0.90%(+3.75)#9 | 1.2%(+3.47)#832 |
| 10. | 66606 | 4.2% | 0.90%(+3.28)#10 | 1.2%(+2.99)#1,033 |
| 11. | 66540 | 4.1% | 0.90%(+3.20)#11 | 1.2%(+2.91)#1,080 |
| 12. | 67855 | 4.1% | 0.90%(+3.16)#12 | 1.2%(+2.88)#1,096 |
| 13. | 66085 | 4.0% | 0.90%(+3.09)#13 | 1.2%(+2.81)#1,131 |
| 14. | 67206 | 3.9% | 0.90%(+3.02)#14 | 1.2%(+2.74)#1,170 |
| 15. | 66615 | 3.8% | 0.90%(+2.94)#15 | 1.2%(+2.65)#1,212 |
| 16. | 66208 | 3.6% | 0.90%(+2.69)#16 | 1.2%(+2.41)#1,351 |
| 17. | 66209 | 3.5% | 0.90%(+2.59)#17 | 1.2%(+2.30)#1,447 |
| 18. | 66217 | 3.4% | 0.90%(+2.54)#18 | 1.2%(+2.26)#1,478 |
| 19. | 66090 | 3.2% | 0.90%(+2.26)#19 | 1.2%(+1.98)#1,688 |
| 20. | 66205 | 3.1% | 0.90%(+2.21)#20 | 1.2%(+1.93)#1,735 |
| 21. | 67202 | 3.1% | 0.90%(+2.21)#21 | 1.2%(+1.92)#1,740 |
| 22. | 66070 | 3.0% | 0.90%(+2.06)#22 | 1.2%(+1.78)#1,892 |
| 23. | 66930 | 2.9% | 0.90%(+2.00)#23 | 1.2%(+1.71)#1,975 |
| 24. | 67739 | 2.9% | 0.90%(+1.98)#24 | 1.2%(+1.70)#1,988 |
| 25. | 67512 | 2.9% | 0.90%(+1.98)#25 | 1.2%(+1.70)#1,989 |
| 26. | 66020 | 2.9% | 0.90%(+1.96)#26 | 1.2%(+1.67)#2,013 |
| 27. | 66013 | 2.8% | 0.90%(+1.92)#27 | 1.2%(+1.63)#2,061 |
| 28. | 67450 | 2.8% | 0.90%(+1.91)#28 | 1.2%(+1.63)#2,071 |
| 29. | 67230 | 2.8% | 0.90%(+1.91)#29 | 1.2%(+1.62)#2,076 |
| 30. | 66213 | 2.7% | 0.90%(+1.79)#30 | 1.2%(+1.50)#2,226 |
| 31. | 66407 | 2.6% | 0.90%(+1.70)#31 | 1.2%(+1.42)#2,347 |
| 32. | 66207 | 2.6% | 0.90%(+1.68)#32 | 1.2%(+1.40)#2,385 |
| 33. | 66049 | 2.5% | 0.90%(+1.65)#33 | 1.2%(+1.36)#2,439 |
| 34. | 66221 | 2.5% | 0.90%(+1.63)#34 | 1.2%(+1.34)#2,466 |
| 35. | 67839 | 2.3% | 0.90%(+1.44)#35 | 1.2%(+1.15)#2,782 |
| 36. | 66547 | 2.2% | 0.90%(+1.34)#36 | 1.2%(+1.05)#2,963 |
| 37. | 66514 | 2.2% | 0.90%(+1.27)#37 | 1.2%(+0.982)#3,100 |
| 38. | 66226 | 2.1% | 0.90%(+1.24)#38 | 1.2%(+0.958)#3,156 |
| 39. | 66610 | 2.0% | 0.90%(+1.12)#39 | 1.2%(+0.836)#3,420 |
| 40. | 67669 | 2.0% | 0.90%(+1.08)#40 | 1.2%(+0.801)#3,525 |
| 41. | 67205 | 1.9% | 0.90%(+1.04)#41 | 1.2%(+0.760)#3,617 |
| 42. | 67484 | 1.9% | 0.90%(+0.958)#42 | 1.2%(+0.675)#3,845 |
| 43. | 67862 | 1.9% | 0.90%(+0.951)#43 | 1.2%(+0.668)#3,862 |
| 44. | 66092 | 1.8% | 0.90%(+0.943)#44 | 1.2%(+0.660)#3,878 |
| 45. | 67208 | 1.8% | 0.90%(+0.908)#45 | 1.2%(+0.625)#3,979 |
| 46. | 67637 | 1.8% | 0.90%(+0.859)#46 | 1.2%(+0.577)#4,109 |
| 47. | 66007 | 1.7% | 0.90%(+0.795)#47 | 1.2%(+0.512)#4,327 |
| 48. | 67572 | 1.7% | 0.90%(+0.794)#48 | 1.2%(+0.511)#4,336 |
| 49. | 67152 | 1.7% | 0.90%(+0.787)#49 | 1.2%(+0.504)#4,353 |
| 50. | 66087 | 1.7% | 0.90%(+0.776)#50 | 1.2%(+0.493)#4,392 |
| 51. | 66733 | 1.6% | 0.90%(+0.748)#51 | 1.2%(+0.465)#4,493 |
| 52. | 66535 | 1.6% | 0.90%(+0.732)#52 | 1.2%(+0.449)#4,559 |
| 53. | 67220 | 1.6% | 0.90%(+0.712)#53 | 1.2%(+0.429)#4,625 |
| 54. | 66220 | 1.6% | 0.90%(+0.701)#54 | 1.2%(+0.418)#4,667 |
| 55. | 66616 | 1.6% | 0.90%(+0.676)#55 | 1.2%(+0.393)#4,755 |
| 56. | 66109 | 1.6% | 0.90%(+0.674)#56 | 1.2%(+0.391)#4,762 |
| 57. | 66216 | 1.6% | 0.90%(+0.653)#57 | 1.2%(+0.370)#4,833 |
| 58. | 66853 | 1.6% | 0.90%(+0.650)#58 | 1.2%(+0.367)#4,845 |
| 59. | 66033 | 1.5% | 0.90%(+0.595)#59 | 1.2%(+0.312)#5,068 |
| 60. | 67041 | 1.5% | 0.90%(+0.592)#60 | 1.2%(+0.309)#5,077 |
| 61. | 66614 | 1.5% | 0.90%(+0.582)#61 | 1.2%(+0.299)#5,113 |
| 62. | 66047 | 1.4% | 0.90%(+0.525)#62 | 1.2%(+0.242)#5,342 |
| 63. | 67133 | 1.4% | 0.90%(+0.515)#63 | 1.2%(+0.232)#5,397 |
| 64. | 66223 | 1.4% | 0.90%(+0.511)#64 | 1.2%(+0.228)#5,415 |
| 65. | 67226 | 1.4% | 0.90%(+0.509)#65 | 1.2%(+0.226)#5,424 |
| 66. | 66842 | 1.4% | 0.90%(+0.508)#66 | 1.2%(+0.225)#5,435 |
| 67. | 67748 | 1.4% | 0.90%(+0.503)#67 | 1.2%(+0.220)#5,457 |
| 68. | 67730 | 1.4% | 0.90%(+0.500)#68 | 1.2%(+0.217)#5,475 |
| 69. | 66409 | 1.4% | 0.90%(+0.497)#69 | 1.2%(+0.214)#5,489 |
| 70. | 67505 | 1.4% | 0.90%(+0.490)#70 | 1.2%(+0.207)#5,518 |
| 71. | 66212 | 1.4% | 0.90%(+0.487)#71 | 1.2%(+0.204)#5,530 |
| 72. | 66442 | 1.4% | 0.90%(+0.483)#72 | 1.2%(+0.200)#5,546 |
| 73. | 67025 | 1.4% | 0.90%(+0.479)#73 | 1.2%(+0.196)#5,564 |
| 74. | 66835 | 1.4% | 0.90%(+0.463)#74 | 1.2%(+0.180)#5,637 |
| 75. | 66210 | 1.3% | 0.90%(+0.383)#75 | 1.2%(+0.100)#6,018 |
| 76. | 67203 | 1.3% | 0.90%(+0.378)#76 | 1.2%(+0.095)#6,043 |
| 77. | 66713 | 1.3% | 0.90%(+0.366)#77 | 1.2%(+0.083)#6,122 |
| 78. | 67547 | 1.3% | 0.90%(+0.359)#78 | 1.2%(+0.076)#6,153 |
| 79. | 67104 | 1.3% | 0.90%(+0.355)#79 | 1.2%(+0.072)#6,170 |
| 80. | 67002 | 1.2% | 0.90%(+0.344)#80 | 1.2%(+0.061)#6,242 |
| 81. | 66413 | 1.2% | 0.90%(+0.340)#81 | 1.2%(+0.057)#6,263 |
| 82. | 67218 | 1.2% | 0.90%(+0.339)#82 | 1.2%(+0.057)#6,264 |
| 83. | 66204 | 1.2% | 0.90%(+0.300)#83 | 1.2%(+0.017)#6,491 |
| 84. | 66061 | 1.2% | 0.90%(+0.291)#84 | 1.2%(+0.008)#6,551 |
| 85. | 67877 | 1.2% | 0.90%(+0.276)#85 | 1.2%(-0.007)#6,669 |
| 86. | 67420 | 1.2% | 0.90%(+0.272)#86 | 1.2%(-0.011)#6,696 |
| 87. | 67879 | 1.1% | 0.90%(+0.229)#87 | 1.2%(-0.054)#6,939 |
| 88. | 66611 | 1.1% | 0.90%(+0.226)#88 | 1.2%(-0.057)#6,966 |
| 89. | 67854 | 1.1% | 0.90%(+0.212)#89 | 1.2%(-0.071)#7,068 |
| 90. | 67950 | 1.1% | 0.90%(+0.183)#90 | 1.2%(-0.100)#7,277 |
| 91. | 66956 | 1.1% | 0.90%(+0.179)#91 | 1.2%(-0.104)#7,308 |
| 92. | 66048 | 1.1% | 0.90%(+0.159)#92 | 1.2%(-0.124)#7,432 |
| 93. | 67117 | 1.0% | 0.90%(+0.117)#93 | 1.2%(-0.165)#7,696 |
| 94. | 66056 | 1.0% | 0.90%(+0.109)#94 | 1.2%(-0.174)#7,752 |
| 95. | 67502 | 0.97% | 0.90%(+0.069)#95 | 1.2%(-0.214)#8,034 |
| 96. | 67003 | 0.97% | 0.90%(+0.067)#96 | 1.2%(-0.216)#8,053 |
| 97. | 67037 | 0.95% | 0.90%(+0.044)#97 | 1.2%(-0.239)#8,237 |
| 98. | 67439 | 0.94% | 0.90%(+0.042)#98 | 1.2%(-0.241)#8,257 |
| 99. | 66046 | 0.91% | 0.90%(+0.009)#99 | 1.2%(-0.274)#8,510 |
| 100. | 67010 | 0.91% | 0.90%(+0.008)#100 | 1.2%(-0.275)#8,516 |
Common Questions
What are the Top 10 Zip Codes with the Highest Percentage of Population Employed in Legal Services & Support in Kansas?
Top 10 Zip Codes with the Highest Percentage of Population Employed in Legal Services & Support in Kansas are:
What zip code has the Highest Percentage of Population Employed in Legal Services & Support in Kansas?
67142 has the Highest Percentage of Population Employed in Legal Services & Support in Kansas with 9.4%.
What is the Percentage of Population Employed in Legal Services & Support in the State of Kansas?
Percentage of Population Employed in Legal Services & Support in Kansas is 0.90%.
What is the Percentage of Population Employed in Legal Services & Support in the United States?
Percentage of Population Employed in Legal Services & Support in the United States is 1.2%.