Zip Codes with the Highest Percentage of Population Employed in Legal Services & Support in Hawaii
RELATED REPORTS & OPTIONS
Legal Services & Support
Hawaii
Compare Zip Codes
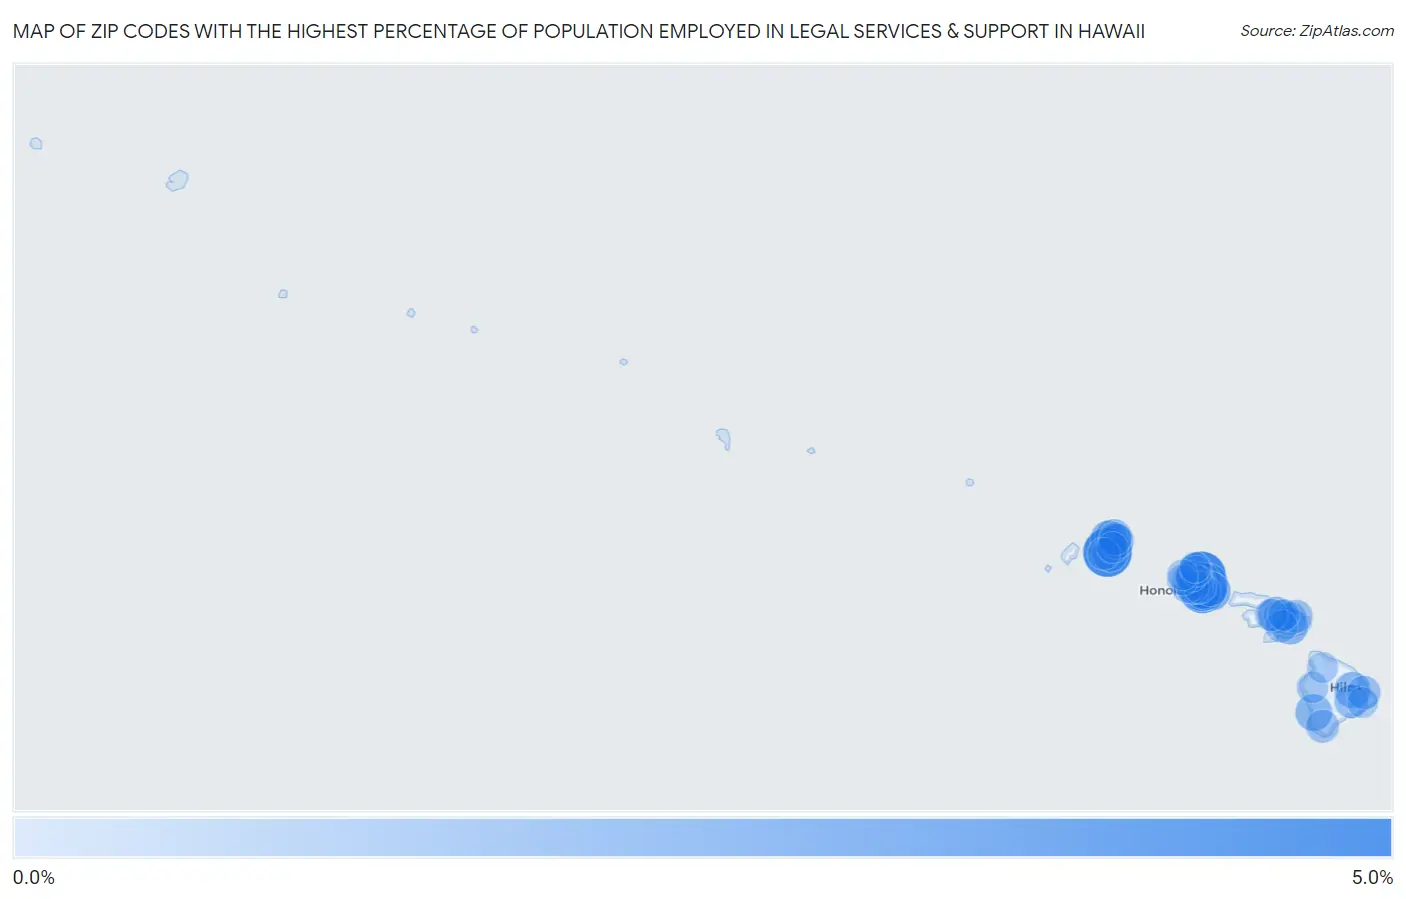
Map of Zip Codes with the Highest Percentage of Population Employed in Legal Services & Support in Hawaii
0.0%
5.0%
Zip Codes with the Highest Percentage of Population Employed in Legal Services & Support in Hawaii
| Zip Code | % Employed | vs State | vs National | |
| 1. | 96730 | 4.5% | 1.0%(+3.42)#1 | 1.2%(+3.27)#912 |
| 2. | 96765 | 4.3% | 1.0%(+3.22)#2 | 1.2%(+3.07)#998 |
| 3. | 96813 | 3.7% | 1.0%(+2.69)#3 | 1.2%(+2.54)#1,266 |
| 4. | 96734 | 2.4% | 1.0%(+1.32)#4 | 1.2%(+1.17)#2,744 |
| 5. | 96814 | 2.2% | 1.0%(+1.19)#5 | 1.2%(+1.05)#2,974 |
| 6. | 96822 | 2.2% | 1.0%(+1.17)#6 | 1.2%(+1.03)#3,019 |
| 7. | 96825 | 1.9% | 1.0%(+0.871)#7 | 1.2%(+0.727)#3,704 |
| 8. | 96817 | 1.7% | 1.0%(+0.678)#8 | 1.2%(+0.533)#4,266 |
| 9. | 96816 | 1.7% | 1.0%(+0.634)#9 | 1.2%(+0.490)#4,408 |
| 10. | 96821 | 1.7% | 1.0%(+0.629)#10 | 1.2%(+0.485)#4,431 |
| 11. | 96744 | 1.7% | 1.0%(+0.618)#11 | 1.2%(+0.474)#4,469 |
| 12. | 96815 | 1.6% | 1.0%(+0.571)#12 | 1.2%(+0.426)#4,642 |
| 13. | 96704 | 1.5% | 1.0%(+0.443)#13 | 1.2%(+0.299)#5,115 |
| 14. | 96754 | 1.4% | 1.0%(+0.408)#14 | 1.2%(+0.263)#5,259 |
| 15. | 96793 | 1.4% | 1.0%(+0.386)#15 | 1.2%(+0.241)#5,349 |
| 16. | 96722 | 1.4% | 1.0%(+0.378)#16 | 1.2%(+0.234)#5,383 |
| 17. | 96790 | 1.4% | 1.0%(+0.371)#17 | 1.2%(+0.226)#5,426 |
| 18. | 96720 | 1.3% | 1.0%(+0.302)#18 | 1.2%(+0.158)#5,726 |
| 19. | 96756 | 1.3% | 1.0%(+0.240)#19 | 1.2%(+0.095)#6,042 |
| 20. | 96701 | 1.2% | 1.0%(+0.177)#20 | 1.2%(+0.032)#6,393 |
| 21. | 96826 | 1.2% | 1.0%(+0.157)#21 | 1.2%(+0.013)#6,520 |
| 22. | 96746 | 1.1% | 1.0%(+0.053)#22 | 1.2%(-0.092)#7,227 |
| 23. | 96795 | 1.1% | 1.0%(+0.031)#23 | 1.2%(-0.113)#7,363 |
| 24. | 96782 | 0.96% | 1.0%(-0.077)#24 | 1.2%(-0.222)#8,113 |
| 25. | 96797 | 0.79% | 1.0%(-0.251)#25 | 1.2%(-0.396)#9,579 |
| 26. | 96785 | 0.77% | 1.0%(-0.266)#26 | 1.2%(-0.411)#9,711 |
| 27. | 96768 | 0.75% | 1.0%(-0.288)#27 | 1.2%(-0.432)#9,908 |
| 28. | 96749 | 0.70% | 1.0%(-0.340)#28 | 1.2%(-0.484)#10,408 |
| 29. | 96789 | 0.66% | 1.0%(-0.377)#29 | 1.2%(-0.522)#10,818 |
| 30. | 96732 | 0.65% | 1.0%(-0.393)#30 | 1.2%(-0.538)#10,973 |
| 31. | 96772 | 0.64% | 1.0%(-0.396)#31 | 1.2%(-0.541)#11,006 |
| 32. | 96818 | 0.62% | 1.0%(-0.420)#32 | 1.2%(-0.564)#11,247 |
| 33. | 96707 | 0.61% | 1.0%(-0.425)#33 | 1.2%(-0.569)#11,307 |
| 34. | 96708 | 0.60% | 1.0%(-0.436)#34 | 1.2%(-0.581)#11,425 |
| 35. | 96703 | 0.57% | 1.0%(-0.473)#35 | 1.2%(-0.618)#11,879 |
| 36. | 96753 | 0.51% | 1.0%(-0.534)#36 | 1.2%(-0.678)#12,562 |
| 37. | 96706 | 0.49% | 1.0%(-0.548)#37 | 1.2%(-0.693)#12,743 |
| 38. | 96761 | 0.47% | 1.0%(-0.572)#38 | 1.2%(-0.717)#13,042 |
| 39. | 96819 | 0.43% | 1.0%(-0.611)#39 | 1.2%(-0.756)#13,519 |
| 40. | 96705 | 0.42% | 1.0%(-0.624)#40 | 1.2%(-0.769)#13,667 |
| 41. | 96779 | 0.28% | 1.0%(-0.758)#41 | 1.2%(-0.903)#15,246 |
| 42. | 96740 | 0.28% | 1.0%(-0.764)#42 | 1.2%(-0.909)#15,318 |
| 43. | 96766 | 0.22% | 1.0%(-0.824)#43 | 1.2%(-0.968)#16,031 |
| 44. | 96786 | 0.18% | 1.0%(-0.857)#44 | 1.2%(-1.00)#16,384 |
| 45. | 96762 | 0.17% | 1.0%(-0.869)#45 | 1.2%(-1.01)#16,484 |
| 46. | 96743 | 0.17% | 1.0%(-0.870)#46 | 1.2%(-1.01)#16,488 |
| 47. | 96792 | 0.14% | 1.0%(-0.903)#47 | 1.2%(-1.05)#16,820 |
| 48. | 96778 | 0.11% | 1.0%(-0.934)#48 | 1.2%(-1.08)#17,067 |
| 49. | 96791 | 0.093% | 1.0%(-0.946)#49 | 1.2%(-1.09)#17,179 |
| 50. | 96731 | 0.091% | 1.0%(-0.949)#50 | 1.2%(-1.09)#17,198 |
1
Common Questions
What are the Top 10 Zip Codes with the Highest Percentage of Population Employed in Legal Services & Support in Hawaii?
Top 10 Zip Codes with the Highest Percentage of Population Employed in Legal Services & Support in Hawaii are:
What zip code has the Highest Percentage of Population Employed in Legal Services & Support in Hawaii?
96730 has the Highest Percentage of Population Employed in Legal Services & Support in Hawaii with 4.5%.
What is the Percentage of Population Employed in Legal Services & Support in the State of Hawaii?
Percentage of Population Employed in Legal Services & Support in Hawaii is 1.0%.
What is the Percentage of Population Employed in Legal Services & Support in the United States?
Percentage of Population Employed in Legal Services & Support in the United States is 1.2%.