Fox Farm College, WY Map & Demographics
Fox Farm College Map
Fox Farm College Overview
$25,647
PER CAPITA INCOME
$50,872
AVG FAMILY INCOME
$53,486
AVG HOUSEHOLD INCOME
2.4%
WAGE / INCOME GAP [ % ]
97.6¢/ $1
WAGE / INCOME GAP [ $ ]
0.49
INEQUALITY / GINI INDEX
4,226
TOTAL POPULATION
2,287
MALE POPULATION
1,939
FEMALE POPULATION
117.95
MALES / 100 FEMALES
84.78
FEMALES / 100 MALES
29.5
MEDIAN AGE
3.0
AVG FAMILY SIZE
2.8
AVG HOUSEHOLD SIZE
2,026
LABOR FORCE [ PEOPLE ]
63.6%
PERCENT IN LABOR FORCE
1.9%
UNEMPLOYMENT RATE
Income in Fox Farm College
Income Overview in Fox Farm College
Per Capita Income in Fox Farm College is $25,647, while median incomes of families and households are $50,872 and $53,486 respectively.
| Characteristic | Number | Measure |
| Per Capita Income | 4,226 | $25,647 |
| Median Family Income | 951 | $50,872 |
| Mean Family Income | 951 | $85,062 |
| Median Household Income | 1,439 | $53,486 |
| Mean Household Income | 1,439 | $71,656 |
| Income Deficit | 951 | $0 |
| Wage / Income Gap (%) | 4,226 | 2.39% |
| Wage / Income Gap ($) | 4,226 | 97.61¢ per $1 |
| Gini / Inequality Index | 4,226 | 0.49 |
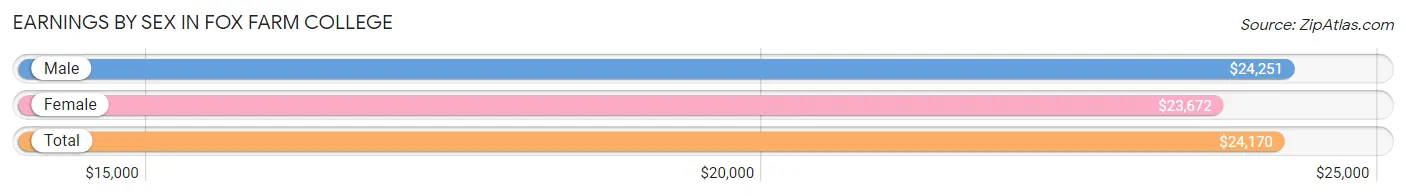
Earnings by Sex in Fox Farm College
Average Earnings in Fox Farm College are $24,170, $24,251 for men and $23,672 for women, a difference of 2.4%.
| Sex | Number | Average Earnings |
| Male | 1,224 (51.9%) | $24,251 |
| Female | 1,132 (48.0%) | $23,672 |
| Total | 2,356 (100.0%) | $24,170 |
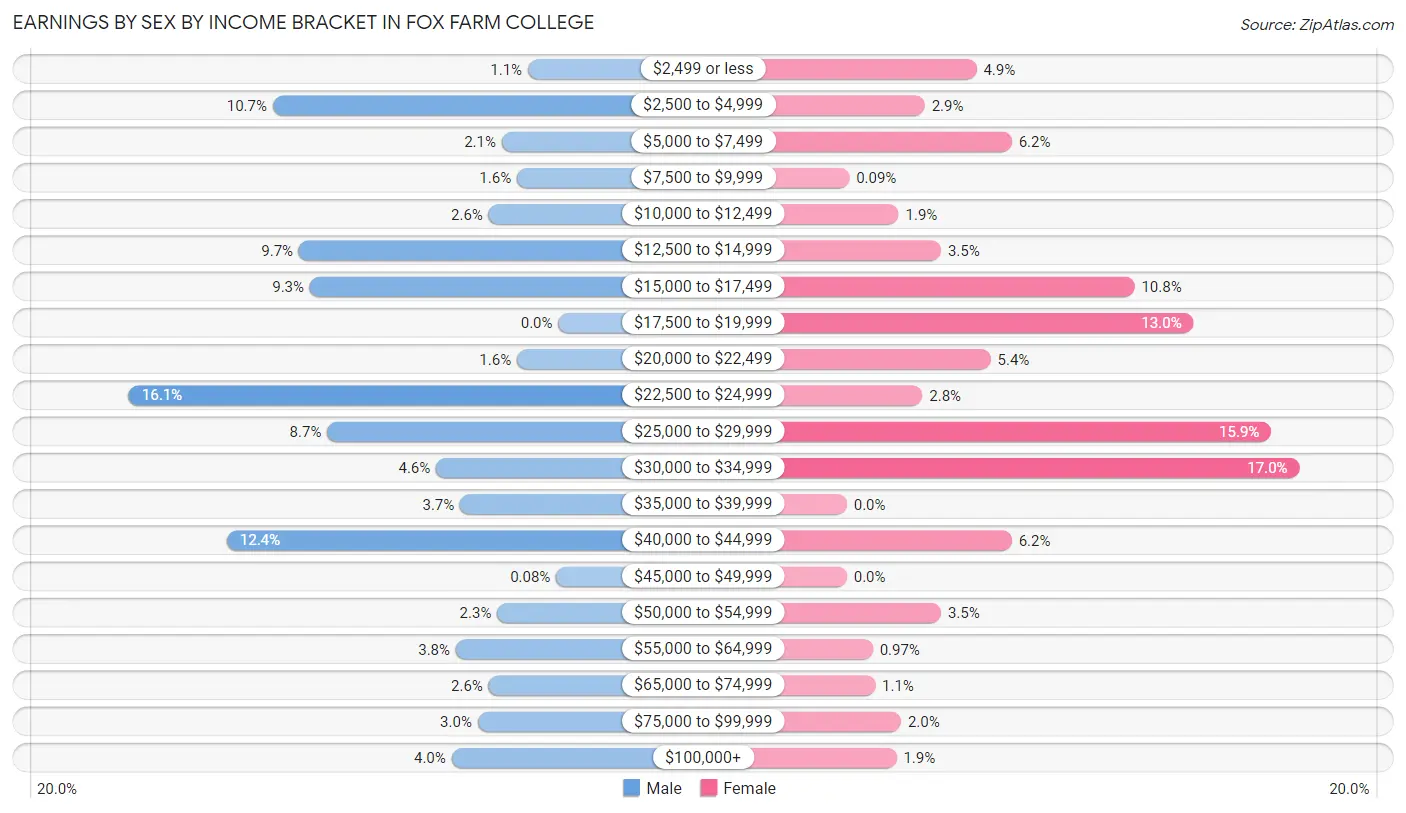
Earnings by Sex by Income Bracket in Fox Farm College
The most common earnings brackets in Fox Farm College are $22,500 to $24,999 for men (197 | 16.1%) and $30,000 to $34,999 for women (192 | 17.0%).
| Income | Male | Female |
| $2,499 or less | 14 (1.1%) | 55 (4.9%) |
| $2,500 to $4,999 | 131 (10.7%) | 33 (2.9%) |
| $5,000 to $7,499 | 26 (2.1%) | 70 (6.2%) |
| $7,500 to $9,999 | 19 (1.5%) | 1 (0.1%) |
| $10,000 to $12,499 | 32 (2.6%) | 22 (1.9%) |
| $12,500 to $14,999 | 119 (9.7%) | 40 (3.5%) |
| $15,000 to $17,499 | 114 (9.3%) | 122 (10.8%) |
| $17,500 to $19,999 | 0 (0.0%) | 147 (13.0%) |
| $20,000 to $22,499 | 19 (1.5%) | 61 (5.4%) |
| $22,500 to $24,999 | 197 (16.1%) | 32 (2.8%) |
| $25,000 to $29,999 | 106 (8.7%) | 180 (15.9%) |
| $30,000 to $34,999 | 56 (4.6%) | 192 (17.0%) |
| $35,000 to $39,999 | 45 (3.7%) | 0 (0.0%) |
| $40,000 to $44,999 | 152 (12.4%) | 70 (6.2%) |
| $45,000 to $49,999 | 1 (0.1%) | 0 (0.0%) |
| $50,000 to $54,999 | 28 (2.3%) | 40 (3.5%) |
| $55,000 to $64,999 | 47 (3.8%) | 11 (1.0%) |
| $65,000 to $74,999 | 32 (2.6%) | 12 (1.1%) |
| $75,000 to $99,999 | 37 (3.0%) | 23 (2.0%) |
| $100,000+ | 49 (4.0%) | 21 (1.9%) |
| Total | 1,224 (100.0%) | 1,132 (100.0%) |
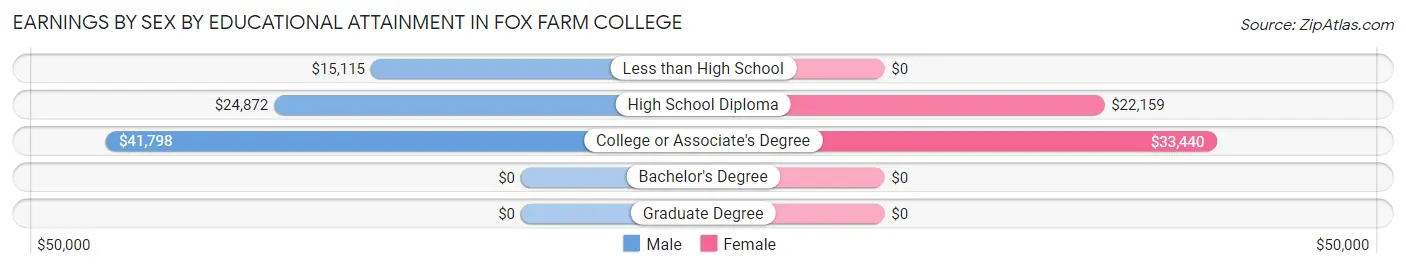
Earnings by Sex by Educational Attainment in Fox Farm College
Average earnings in Fox Farm College are $29,050 for men and $27,083 for women, a difference of 6.8%. Men with an educational attainment of college or associate's degree enjoy the highest average annual earnings of $41,798, while those with less than high school education earn the least with $15,115. Women with an educational attainment of college or associate's degree earn the most with the average annual earnings of $33,440, while those with high school diploma education have the smallest earnings of $22,159.
| Educational Attainment | Male Income | Female Income |
| Less than High School | $15,115 | $0 |
| High School Diploma | $24,872 | $22,159 |
| College or Associate's Degree | $41,798 | $33,440 |
| Bachelor's Degree | - | - |
| Graduate Degree | - | - |
| Total | $29,050 | $27,083 |
Family Income in Fox Farm College
Family Income Brackets in Fox Farm College
According to the Fox Farm College family income data, there are 271 families falling into the $50,000 to $74,999 income range, which is the most common income bracket and makes up 28.5% of all families.
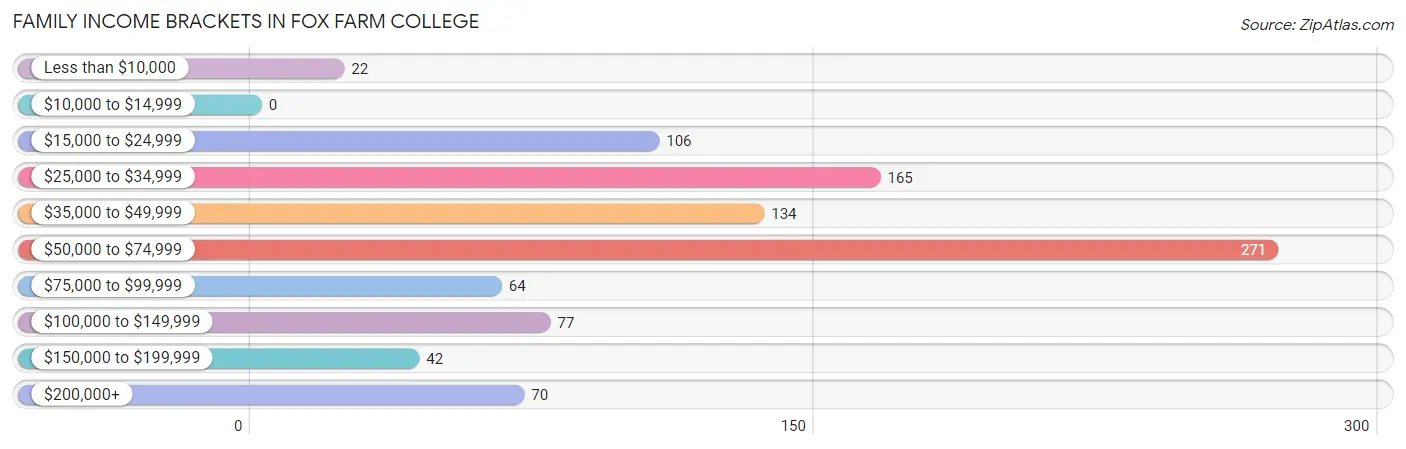
| Income Bracket | # Families | % Families |
| Less than $10,000 | 22 | 2.3% |
| $10,000 to $14,999 | 0 | 0.0% |
| $15,000 to $24,999 | 106 | 11.1% |
| $25,000 to $34,999 | 165 | 17.4% |
| $35,000 to $49,999 | 134 | 14.1% |
| $50,000 to $74,999 | 271 | 28.5% |
| $75,000 to $99,999 | 64 | 6.7% |
| $100,000 to $149,999 | 77 | 8.1% |
| $150,000 to $199,999 | 42 | 4.4% |
| $200,000+ | 70 | 7.4% |
Family Income by Famaliy Size in Fox Farm College
2-person families (318 | 33.4%) account for the highest median family income in Fox Farm College with $67,845 per family, while 2-person families (318 | 33.4%) have the highest median income of $33,922 per family member.
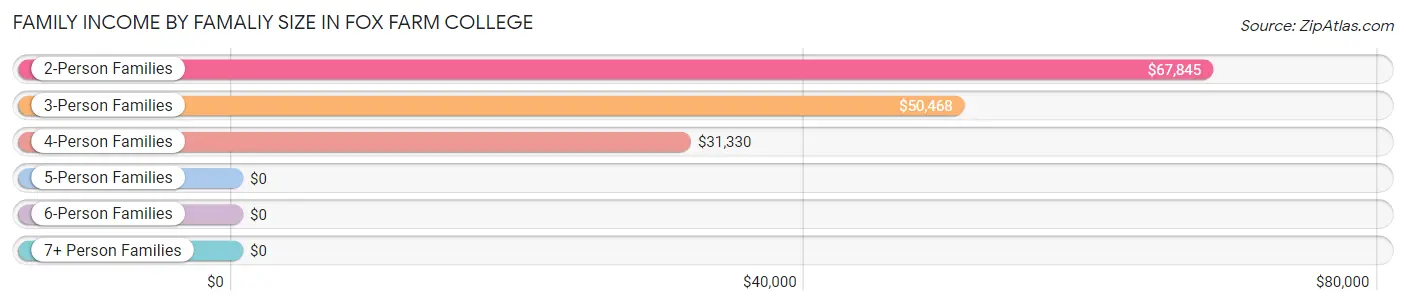
| Income Bracket | # Families | Median Income |
| 2-Person Families | 318 (33.4%) | $67,845 |
| 3-Person Families | 418 (44.0%) | $50,468 |
| 4-Person Families | 160 (16.8%) | $31,330 |
| 5-Person Families | 32 (3.4%) | $0 |
| 6-Person Families | 23 (2.4%) | $0 |
| 7+ Person Families | 0 (0.0%) | $0 |
| Total | 951 (100.0%) | $50,872 |
Family Income by Number of Earners in Fox Farm College
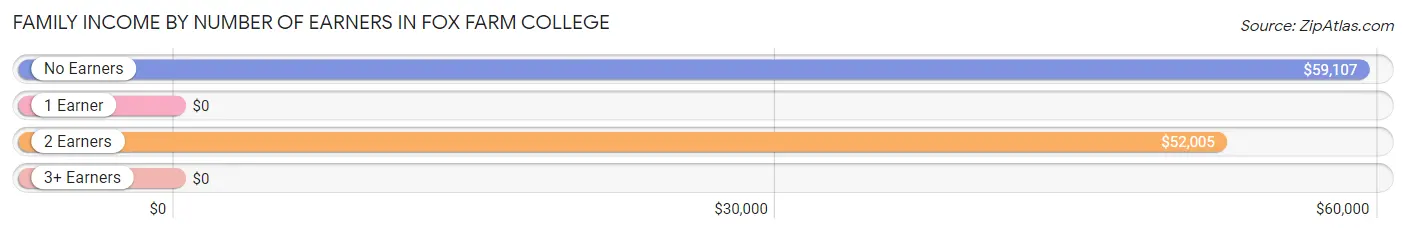
| Number of Earners | # Families | Median Income |
| No Earners | 67 (7.0%) | $59,107 |
| 1 Earner | 254 (26.7%) | $0 |
| 2 Earners | 621 (65.3%) | $52,005 |
| 3+ Earners | 9 (0.9%) | $0 |
| Total | 951 (100.0%) | $50,872 |
Household Income in Fox Farm College
Household Income Brackets in Fox Farm College
With 538 households falling in the category, the $50,000 to $74,999 income range is the most frequent in Fox Farm College, accounting for 37.4% of all households. In contrast, only 17 households (1.2%) fall into the $15,000 to $24,999 income bracket, making it the least populous group.
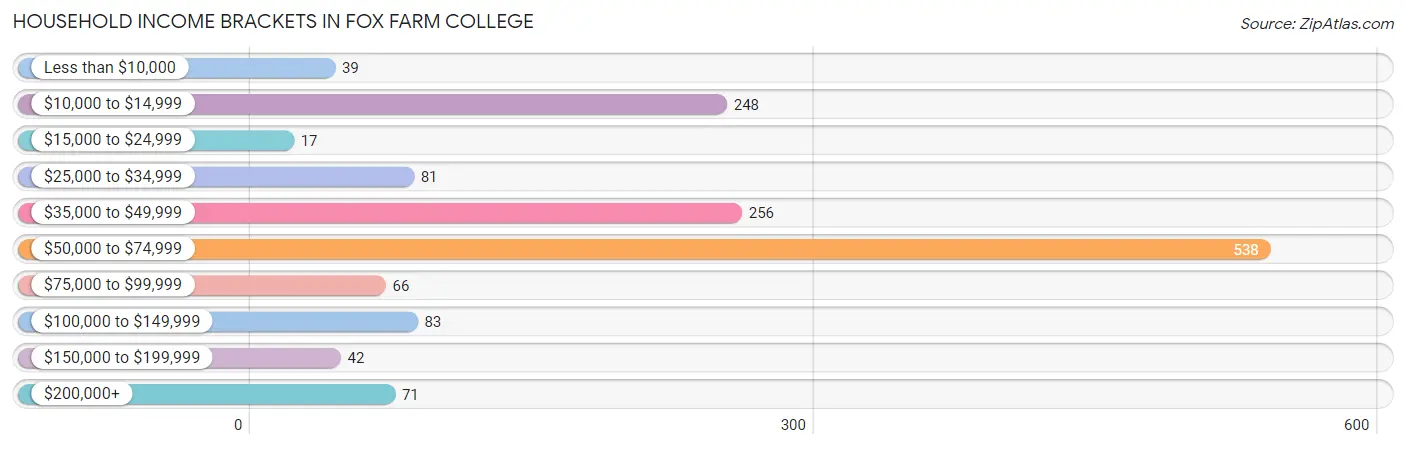
| Income Bracket | # Households | % Households |
| Less than $10,000 | 39 | 2.7% |
| $10,000 to $14,999 | 248 | 17.2% |
| $15,000 to $24,999 | 17 | 1.2% |
| $25,000 to $34,999 | 81 | 5.6% |
| $35,000 to $49,999 | 256 | 17.8% |
| $50,000 to $74,999 | 538 | 37.4% |
| $75,000 to $99,999 | 66 | 4.6% |
| $100,000 to $149,999 | 83 | 5.8% |
| $150,000 to $199,999 | 42 | 2.9% |
| $200,000+ | 71 | 4.9% |
Household Income by Householder Age in Fox Farm College
The median household income in Fox Farm College is $53,486, with the highest median household income of $58,255 found in the 15 to 24 years age bracket for the primary householder. A total of 190 households (13.2%) fall into this category. Meanwhile, the 45 to 64 years age bracket for the primary householder has the lowest median household income of $39,063, with 724 households (50.3%) in this group.
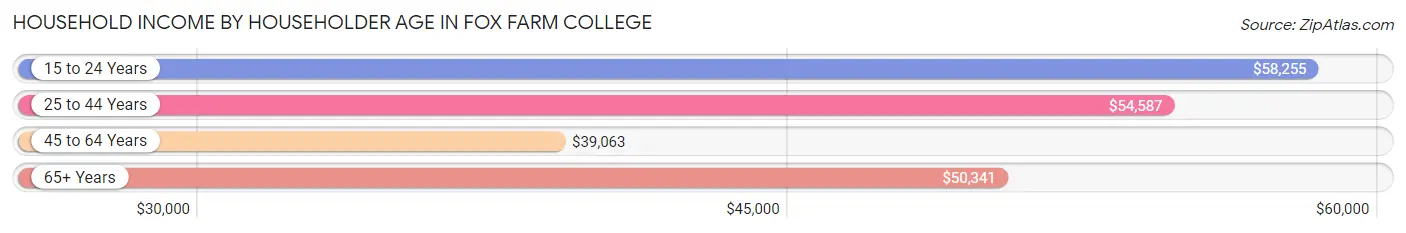
| Income Bracket | # Households | Median Income |
| 15 to 24 Years | 190 (13.2%) | $58,255 |
| 25 to 44 Years | 250 (17.4%) | $54,587 |
| 45 to 64 Years | 724 (50.3%) | $39,063 |
| 65+ Years | 275 (19.1%) | $50,341 |
| Total | 1,439 (100.0%) | $53,486 |
Poverty in Fox Farm College
Income Below Poverty by Sex and Age in Fox Farm College
With 22.6% poverty level for males and 22.5% for females among the residents of Fox Farm College, under 5 year old males and 18 to 24 year old females are the most vulnerable to poverty, with 33 males (82.5%) and 151 females (64.5%) in their respective age groups living below the poverty level.
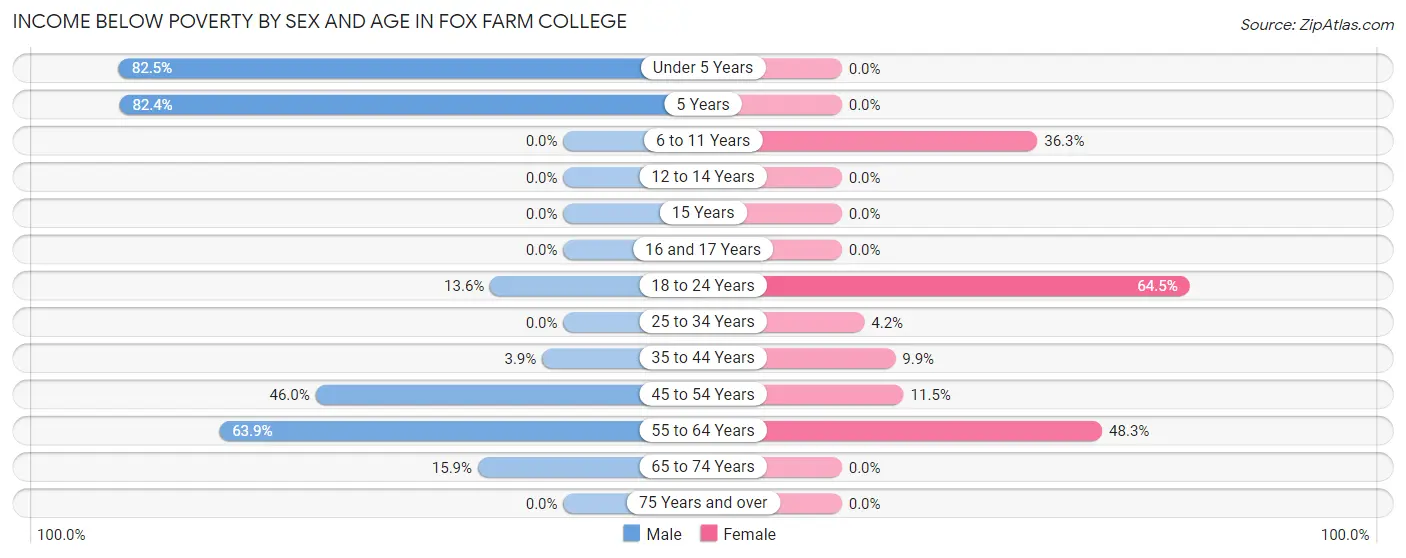
| Age Bracket | Male | Female |
| Under 5 Years | 33 (82.5%) | 0 (0.0%) |
| 5 Years | 145 (82.4%) | 0 (0.0%) |
| 6 to 11 Years | 0 (0.0%) | 86 (36.3%) |
| 12 to 14 Years | 0 (0.0%) | 0 (0.0%) |
| 15 Years | 0 (0.0%) | 0 (0.0%) |
| 16 and 17 Years | 0 (0.0%) | 0 (0.0%) |
| 18 to 24 Years | 39 (13.6%) | 151 (64.5%) |
| 25 to 34 Years | 0 (0.0%) | 11 (4.2%) |
| 35 to 44 Years | 10 (3.9%) | 18 (9.9%) |
| 45 to 54 Years | 115 (46.0%) | 38 (11.5%) |
| 55 to 64 Years | 122 (63.9%) | 101 (48.3%) |
| 65 to 74 Years | 20 (15.9%) | 0 (0.0%) |
| 75 Years and over | 0 (0.0%) | 0 (0.0%) |
| Total | 484 (22.6%) | 405 (22.5%) |
Income Above Poverty by Sex and Age in Fox Farm College
According to the poverty statistics in Fox Farm College, males aged 6 to 11 years and females aged under 5 years are the age groups that are most secure financially, with 100.0% of males and 100.0% of females in these age groups living above the poverty line.
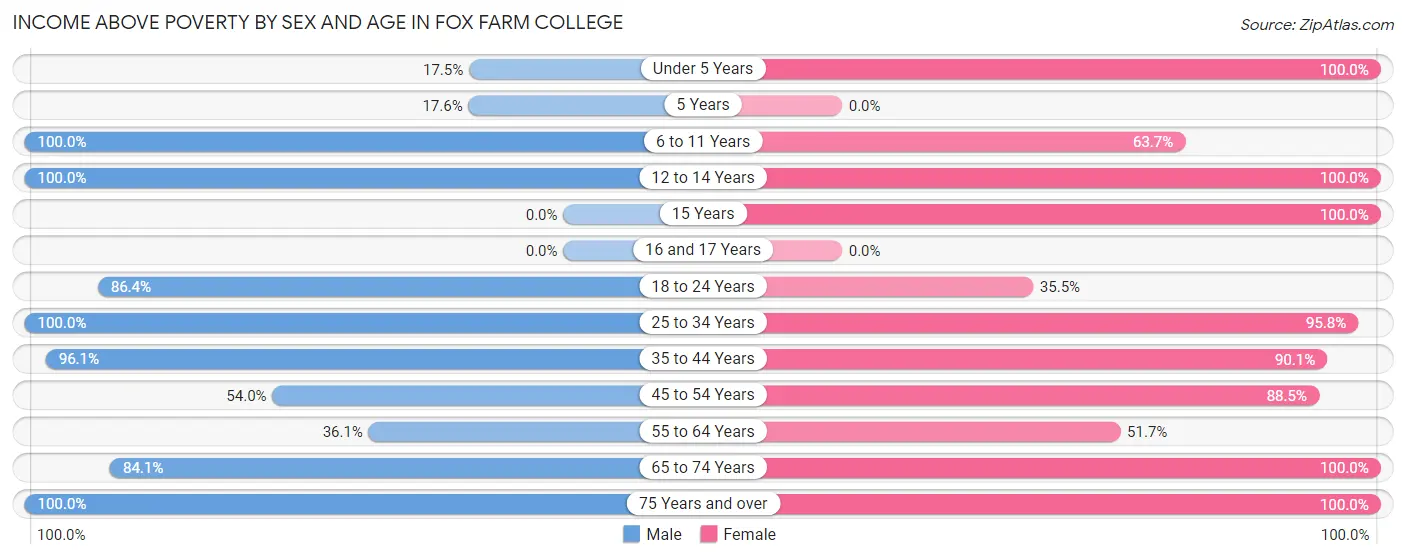
| Age Bracket | Male | Female |
| Under 5 Years | 7 (17.5%) | 24 (100.0%) |
| 5 Years | 31 (17.6%) | 0 (0.0%) |
| 6 to 11 Years | 202 (100.0%) | 151 (63.7%) |
| 12 to 14 Years | 171 (100.0%) | 96 (100.0%) |
| 15 Years | 0 (0.0%) | 32 (100.0%) |
| 16 and 17 Years | 0 (0.0%) | 0 (0.0%) |
| 18 to 24 Years | 248 (86.4%) | 83 (35.5%) |
| 25 to 34 Years | 332 (100.0%) | 252 (95.8%) |
| 35 to 44 Years | 244 (96.1%) | 163 (90.1%) |
| 45 to 54 Years | 135 (54.0%) | 293 (88.5%) |
| 55 to 64 Years | 69 (36.1%) | 108 (51.7%) |
| 65 to 74 Years | 106 (84.1%) | 115 (100.0%) |
| 75 Years and over | 113 (100.0%) | 75 (100.0%) |
| Total | 1,658 (77.4%) | 1,392 (77.5%) |
Income Below Poverty Among Married-Couple Families in Fox Farm College
The poverty statistics for married-couple families in Fox Farm College show that 5.0% or 22 of the total 440 families live below the poverty line. Families with 1 or 2 children have the highest poverty rate of 25.9%, comprising of 22 families. On the other hand, families with no children have the lowest poverty rate of 0.0%, which includes 0 families.
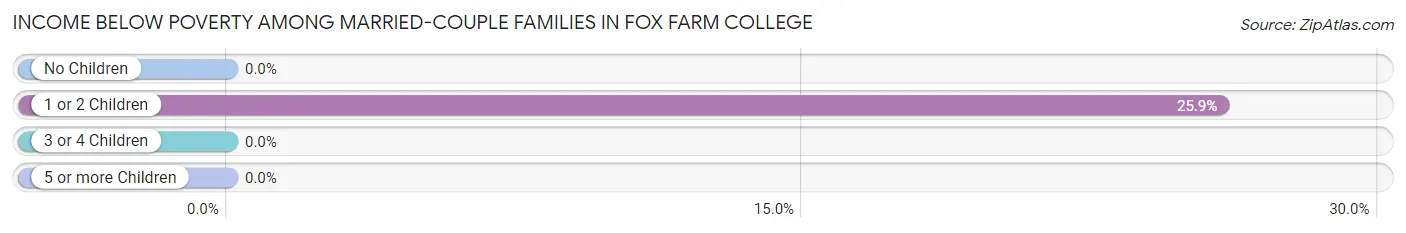
| Children | Above Poverty | Below Poverty |
| No Children | 302 (100.0%) | 0 (0.0%) |
| 1 or 2 Children | 63 (74.1%) | 22 (25.9%) |
| 3 or 4 Children | 53 (100.0%) | 0 (0.0%) |
| 5 or more Children | 0 (0.0%) | 0 (0.0%) |
| Total | 418 (95.0%) | 22 (5.0%) |
Income Below Poverty Among Single-Parent Households in Fox Farm College
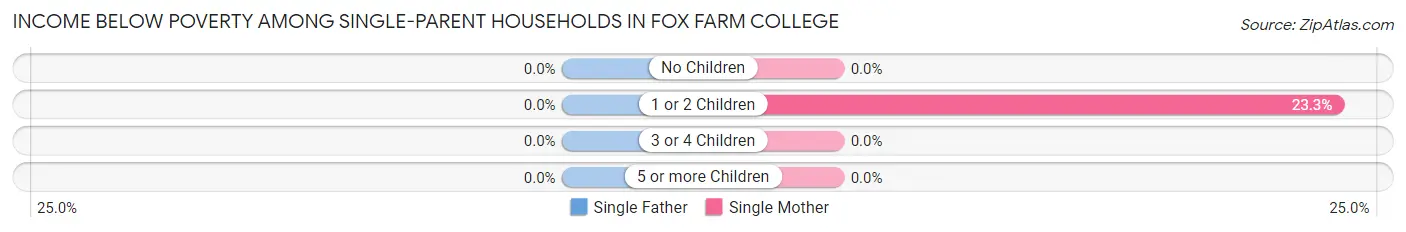
| Children | Single Father | Single Mother |
| No Children | 0 (0.0%) | 0 (0.0%) |
| 1 or 2 Children | 0 (0.0%) | 106 (23.3%) |
| 3 or 4 Children | 0 (0.0%) | 0 (0.0%) |
| 5 or more Children | 0 (0.0%) | 0 (0.0%) |
| Total | 0 (0.0%) | 106 (22.4%) |
Income Below Poverty Among Married-Couple vs Single-Parent Households in Fox Farm College
The poverty data for Fox Farm College shows that 22 of the married-couple family households (5.0%) and 106 of the single-parent households (20.7%) are living below the poverty level. Within the married-couple family households, those with 1 or 2 children have the highest poverty rate, with 22 households (25.9%) falling below the poverty line. Among the single-parent households, those with 1 or 2 children have the highest poverty rate, with 106 household (22.8%) living below poverty.
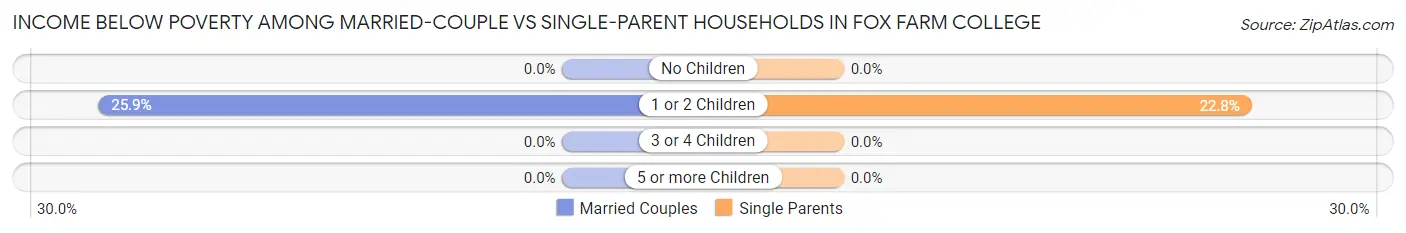
| Children | Married-Couple Families | Single-Parent Households |
| No Children | 0 (0.0%) | 0 (0.0%) |
| 1 or 2 Children | 22 (25.9%) | 106 (22.8%) |
| 3 or 4 Children | 0 (0.0%) | 0 (0.0%) |
| 5 or more Children | 0 (0.0%) | 0 (0.0%) |
| Total | 22 (5.0%) | 106 (20.7%) |
Race in Fox Farm College
The most populous races in Fox Farm College are White / Caucasian (3,724 | 88.1%), Hispanic or Latino (1,315 | 31.1%), and Two or more Races (184 | 4.3%).
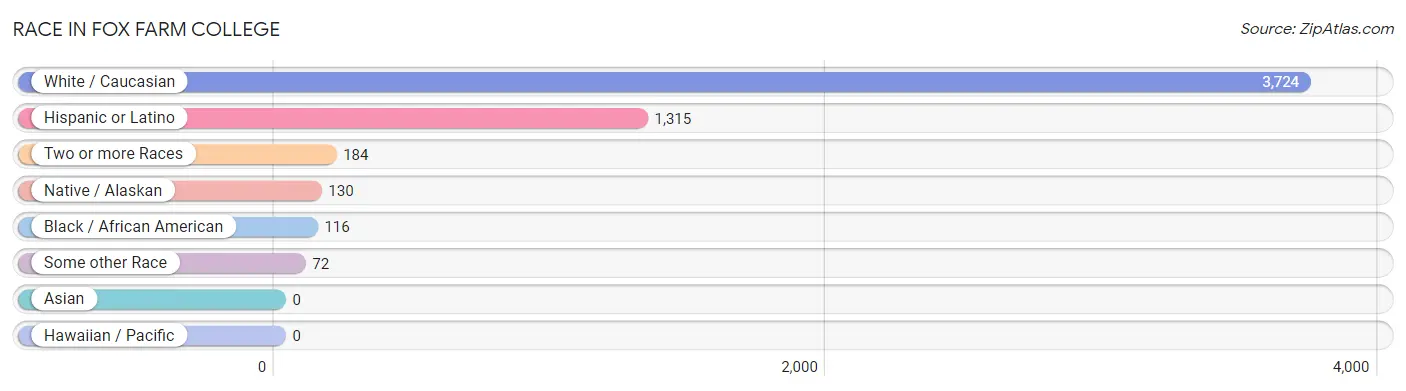
| Race | # Population | % Population |
| Asian | 0 | 0.0% |
| Black / African American | 116 | 2.7% |
| Hawaiian / Pacific | 0 | 0.0% |
| Hispanic or Latino | 1,315 | 31.1% |
| Native / Alaskan | 130 | 3.1% |
| White / Caucasian | 3,724 | 88.1% |
| Two or more Races | 184 | 4.3% |
| Some other Race | 72 | 1.7% |
| Total | 4,226 | 100.0% |
Ancestry in Fox Farm College
The most populous ancestries reported in Fox Farm College are Mexican (1,017 | 24.1%), German (967 | 22.9%), English (575 | 13.6%), Irish (453 | 10.7%), and Lithuanian (223 | 5.3%), together accounting for 76.6% of all Fox Farm College residents.
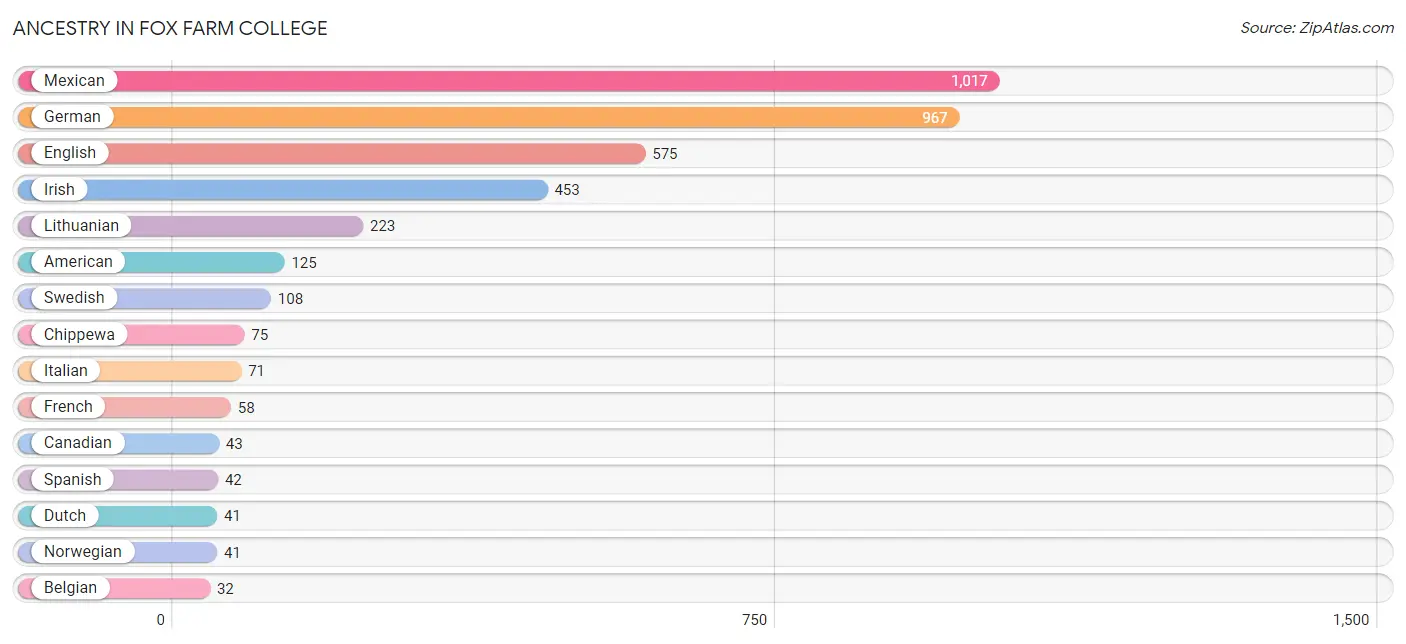
| Ancestry | # Population | % Population |
| Albanian | 1 | 0.0% |
| American | 125 | 3.0% |
| Apache | 24 | 0.6% |
| Arapaho | 1 | 0.0% |
| Belgian | 32 | 0.8% |
| Canadian | 43 | 1.0% |
| Cherokee | 19 | 0.4% |
| Chippewa | 75 | 1.8% |
| Czech | 2 | 0.1% |
| Danish | 2 | 0.1% |
| Dutch | 41 | 1.0% |
| English | 575 | 13.6% |
| European | 5 | 0.1% |
| Finnish | 11 | 0.3% |
| French | 58 | 1.4% |
| French Canadian | 2 | 0.1% |
| German | 967 | 22.9% |
| Greek | 14 | 0.3% |
| Irish | 453 | 10.7% |
| Iroquois | 2 | 0.1% |
| Italian | 71 | 1.7% |
| Lithuanian | 223 | 5.3% |
| Mexican | 1,017 | 24.1% |
| Native Hawaiian | 1 | 0.0% |
| Norwegian | 41 | 1.0% |
| Polish | 2 | 0.1% |
| Russian | 7 | 0.2% |
| Scandinavian | 2 | 0.1% |
| Scotch-Irish | 25 | 0.6% |
| Scottish | 4 | 0.1% |
| Shoshone | 15 | 0.4% |
| Slavic | 2 | 0.1% |
| Slovene | 2 | 0.1% |
| Spanish | 42 | 1.0% |
| Swedish | 108 | 2.6% |
| Swiss | 13 | 0.3% |
| Ukrainian | 2 | 0.1% |
| Welsh | 16 | 0.4% | View All 38 Rows |
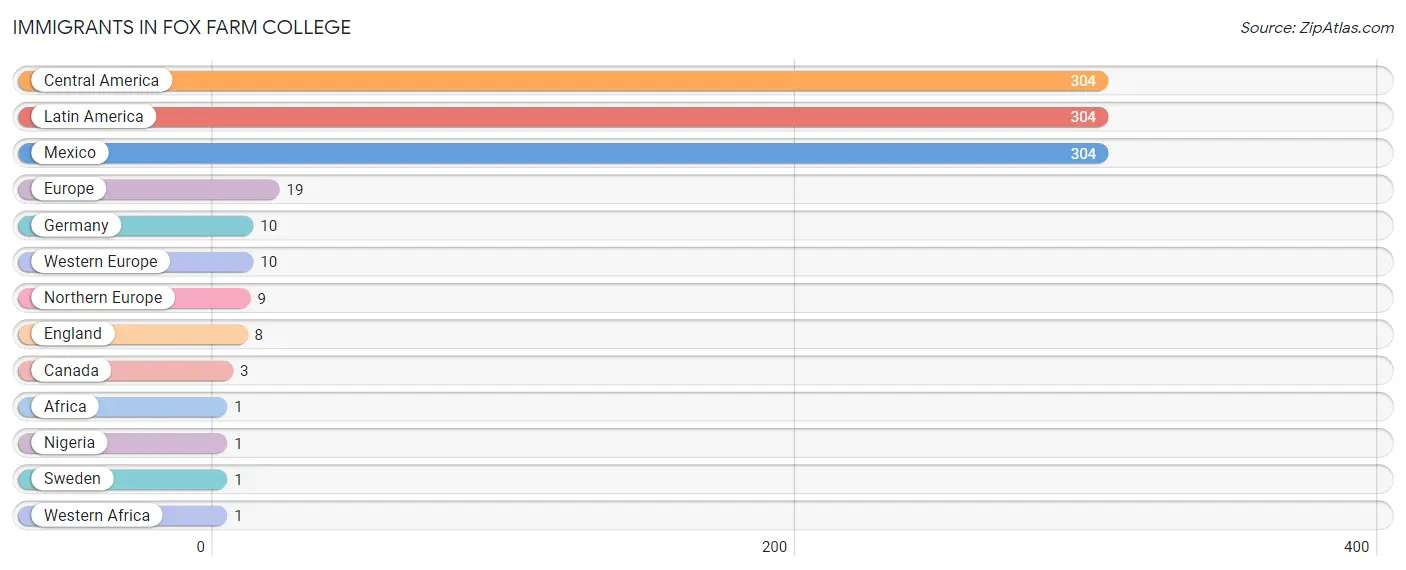
Immigrants in Fox Farm College
The most numerous immigrant groups reported in Fox Farm College came from Central America (304 | 7.2%), Latin America (304 | 7.2%), Mexico (304 | 7.2%), Europe (19 | 0.4%), and Germany (10 | 0.2%), together accounting for 22.3% of all Fox Farm College residents.
| Immigration Origin | # Population | % Population |
| Africa | 1 | 0.0% |
| Canada | 3 | 0.1% |
| Central America | 304 | 7.2% |
| England | 8 | 0.2% |
| Europe | 19 | 0.4% |
| Germany | 10 | 0.2% |
| Latin America | 304 | 7.2% |
| Mexico | 304 | 7.2% |
| Nigeria | 1 | 0.0% |
| Northern Europe | 9 | 0.2% |
| Sweden | 1 | 0.0% |
| Western Africa | 1 | 0.0% |
| Western Europe | 10 | 0.2% | View All 13 Rows |
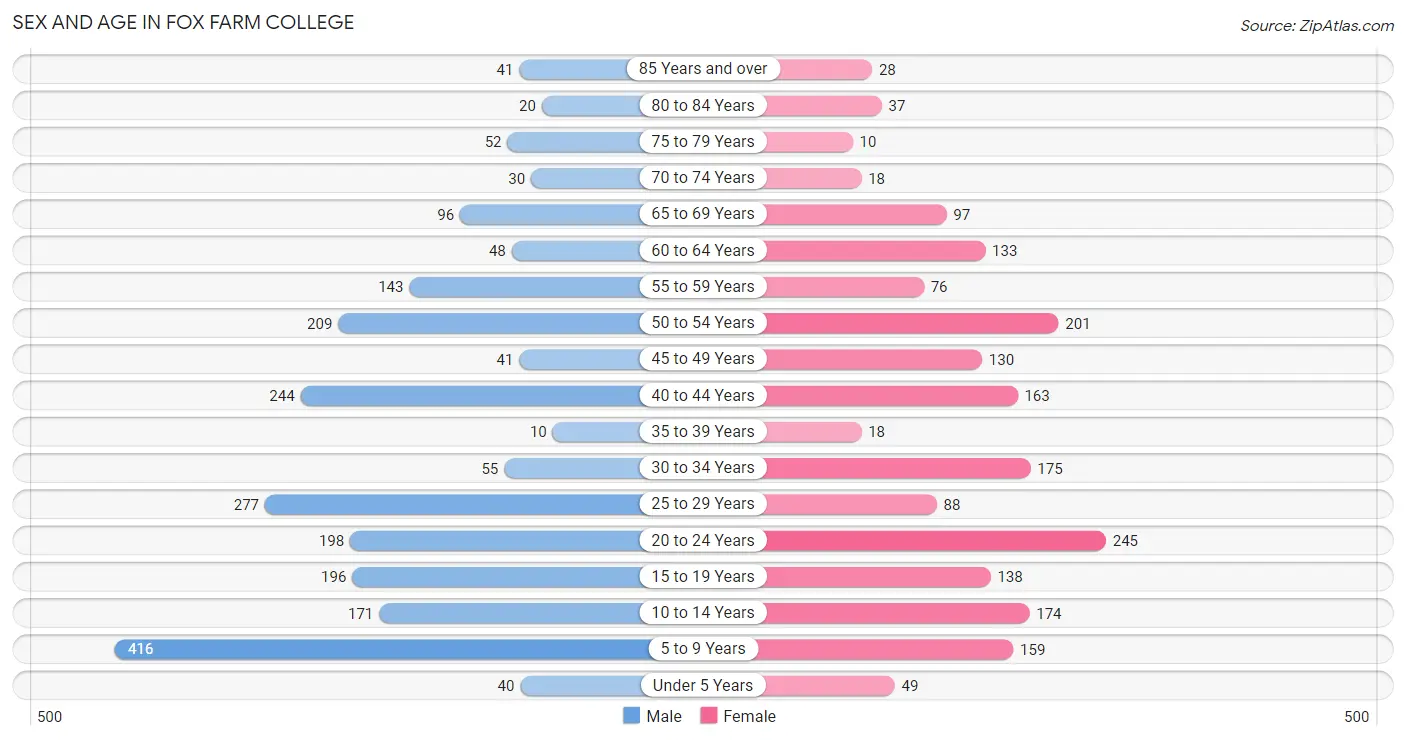
Sex and Age in Fox Farm College
Sex and Age in Fox Farm College
The most populous age groups in Fox Farm College are 5 to 9 Years (416 | 18.2%) for men and 20 to 24 Years (245 | 12.6%) for women.
| Age Bracket | Male | Female |
| Under 5 Years | 40 (1.8%) | 49 (2.5%) |
| 5 to 9 Years | 416 (18.2%) | 159 (8.2%) |
| 10 to 14 Years | 171 (7.5%) | 174 (9.0%) |
| 15 to 19 Years | 196 (8.6%) | 138 (7.1%) |
| 20 to 24 Years | 198 (8.7%) | 245 (12.6%) |
| 25 to 29 Years | 277 (12.1%) | 88 (4.5%) |
| 30 to 34 Years | 55 (2.4%) | 175 (9.0%) |
| 35 to 39 Years | 10 (0.4%) | 18 (0.9%) |
| 40 to 44 Years | 244 (10.7%) | 163 (8.4%) |
| 45 to 49 Years | 41 (1.8%) | 130 (6.7%) |
| 50 to 54 Years | 209 (9.1%) | 201 (10.4%) |
| 55 to 59 Years | 143 (6.2%) | 76 (3.9%) |
| 60 to 64 Years | 48 (2.1%) | 133 (6.9%) |
| 65 to 69 Years | 96 (4.2%) | 97 (5.0%) |
| 70 to 74 Years | 30 (1.3%) | 18 (0.9%) |
| 75 to 79 Years | 52 (2.3%) | 10 (0.5%) |
| 80 to 84 Years | 20 (0.9%) | 37 (1.9%) |
| 85 Years and over | 41 (1.8%) | 28 (1.4%) |
| Total | 2,287 (100.0%) | 1,939 (100.0%) |
Families and Households in Fox Farm College
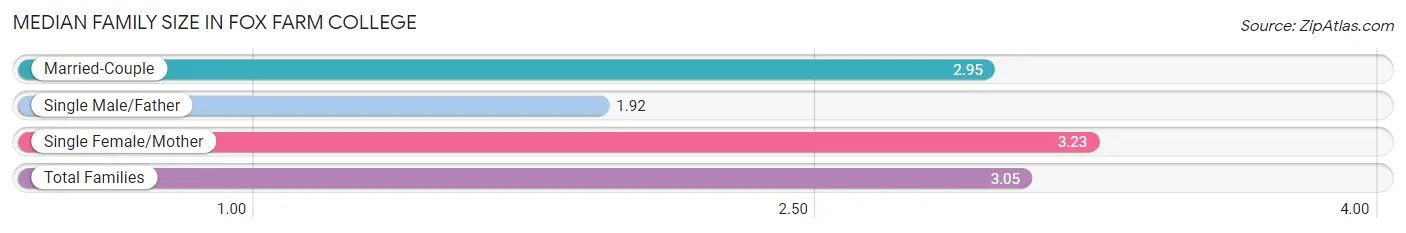
Median Family Size in Fox Farm College
The median family size in Fox Farm College is 3.05 persons per family, with single female/mother families (473 | 49.7%) accounting for the largest median family size of 3.23 persons per family. On the other hand, single male/father families (38 | 4.0%) represent the smallest median family size with 1.92 persons per family.
| Family Type | # Families | Family Size |
| Married-Couple | 440 (46.3%) | 2.95 |
| Single Male/Father | 38 (4.0%) | 1.92 |
| Single Female/Mother | 473 (49.7%) | 3.23 |
| Total Families | 951 (100.0%) | 3.05 |
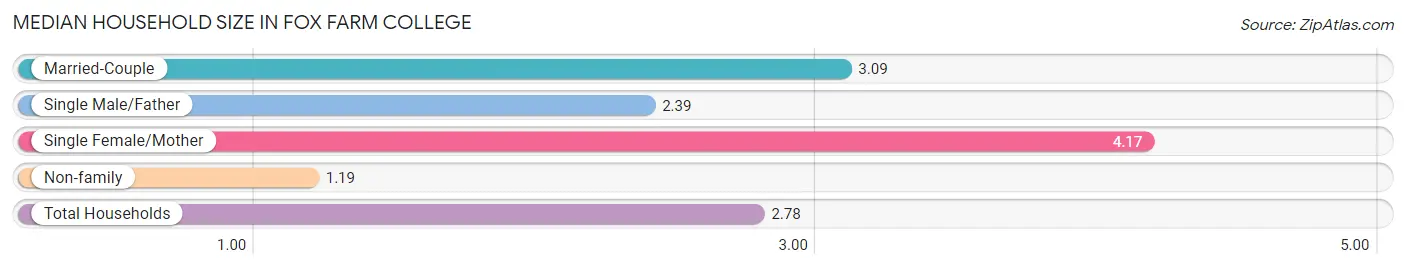
Median Household Size in Fox Farm College
The median household size in Fox Farm College is 2.78 persons per household, with single female/mother households (473 | 32.9%) accounting for the largest median household size of 4.17 persons per household. non-family households (488 | 33.9%) represent the smallest median household size with 1.19 persons per household.
| Household Type | # Households | Household Size |
| Married-Couple | 440 (30.6%) | 3.09 |
| Single Male/Father | 38 (2.6%) | 2.39 |
| Single Female/Mother | 473 (32.9%) | 4.17 |
| Non-family | 488 (33.9%) | 1.19 |
| Total Households | 1,439 (100.0%) | 2.78 |
Household Size by Marriage Status in Fox Farm College
Out of a total of 1,439 households in Fox Farm College, 951 (66.1%) are family households, while 488 (33.9%) are nonfamily households. The most numerous type of family households are 4-person households, comprising 296, and the most common type of nonfamily households are 1-person households, comprising 428.
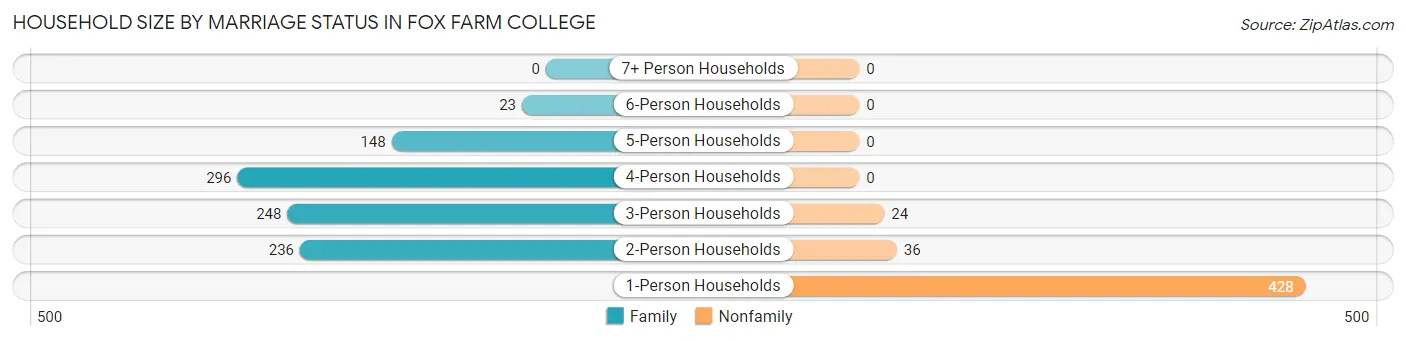
| Household Size | Family Households | Nonfamily Households |
| 1-Person Households | - | 428 (29.7%) |
| 2-Person Households | 236 (16.4%) | 36 (2.5%) |
| 3-Person Households | 248 (17.2%) | 24 (1.7%) |
| 4-Person Households | 296 (20.6%) | 0 (0.0%) |
| 5-Person Households | 148 (10.3%) | 0 (0.0%) |
| 6-Person Households | 23 (1.6%) | 0 (0.0%) |
| 7+ Person Households | 0 (0.0%) | 0 (0.0%) |
| Total | 951 (66.1%) | 488 (33.9%) |
Female Fertility in Fox Farm College
Fertility by Age in Fox Farm College
Average fertility rate in Fox Farm College is 9.0 births per 1,000 women. Women in the age bracket of 20 to 34 years have the highest fertility rate with 18.0 births per 1,000 women. Women in the age bracket of 20 to 34 years acount for 100.0% of all women with births.
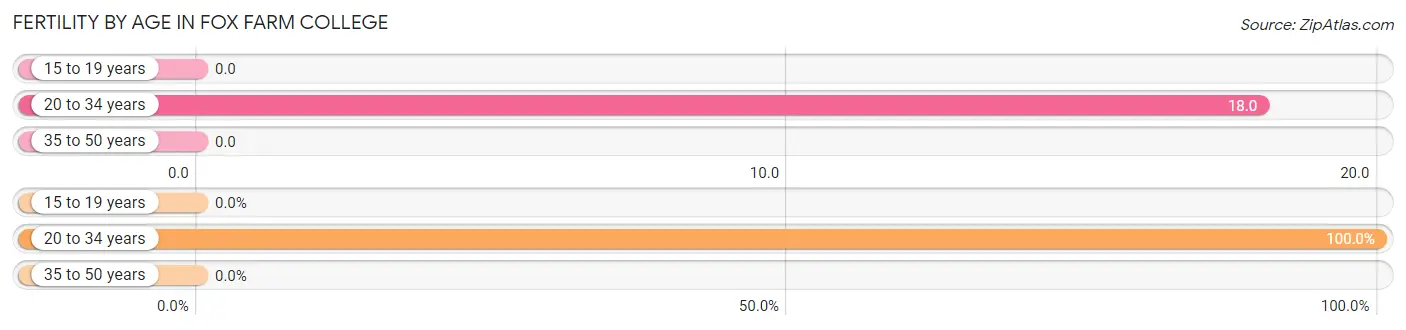
| Age Bracket | Women with Births | Births / 1,000 Women |
| 15 to 19 years | 0 (0.0%) | 0.0 |
| 20 to 34 years | 9 (100.0%) | 18.0 |
| 35 to 50 years | 0 (0.0%) | 0.0 |
| Total | 9 (100.0%) | 9.0 |
Fertility by Age by Marriage Status in Fox Farm College
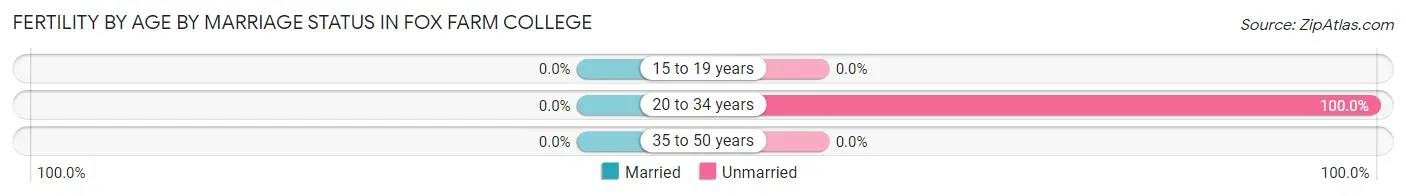
| Age Bracket | Married | Unmarried |
| 15 to 19 years | 0 (0.0%) | 0 (0.0%) |
| 20 to 34 years | 0 (0.0%) | 9 (100.0%) |
| 35 to 50 years | 0 (0.0%) | 0 (0.0%) |
| Total | 0 (0.0%) | 9 (100.0%) |
Fertility by Education in Fox Farm College
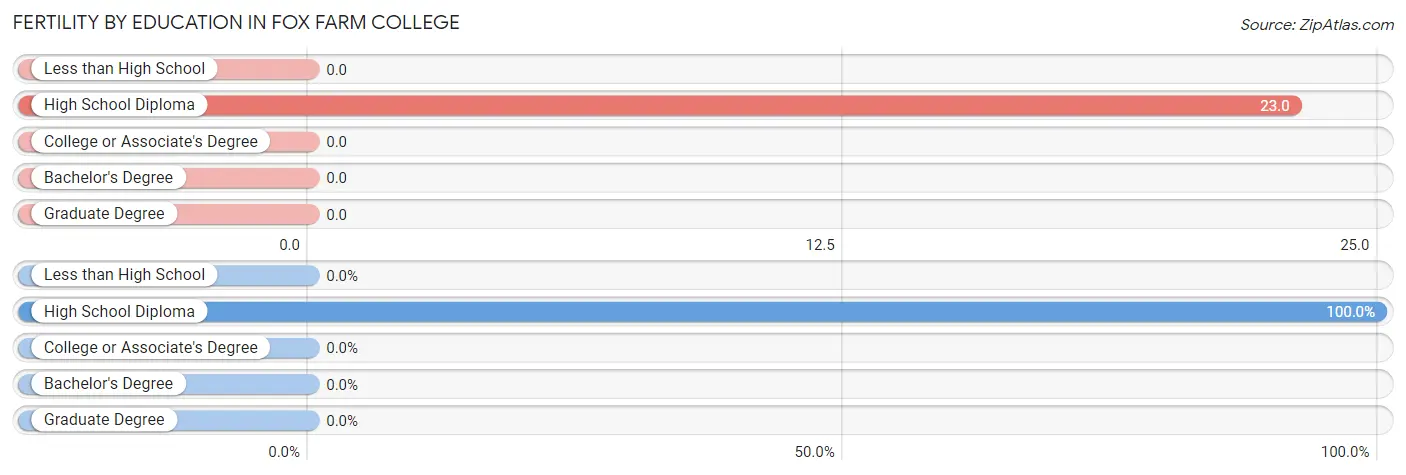
| Educational Attainment | Women with Births | Births / 1,000 Women |
| Less than High School | 0 (0.0%) | 0.0 |
| High School Diploma | 9 (100.0%) | 23.0 |
| College or Associate's Degree | 0 (0.0%) | 0.0 |
| Bachelor's Degree | 0 (0.0%) | 0.0 |
| Graduate Degree | 0 (0.0%) | 0.0 |
| Total | 9 (100.0%) | 9.0 |
Fertility by Education by Marriage Status in Fox Farm College
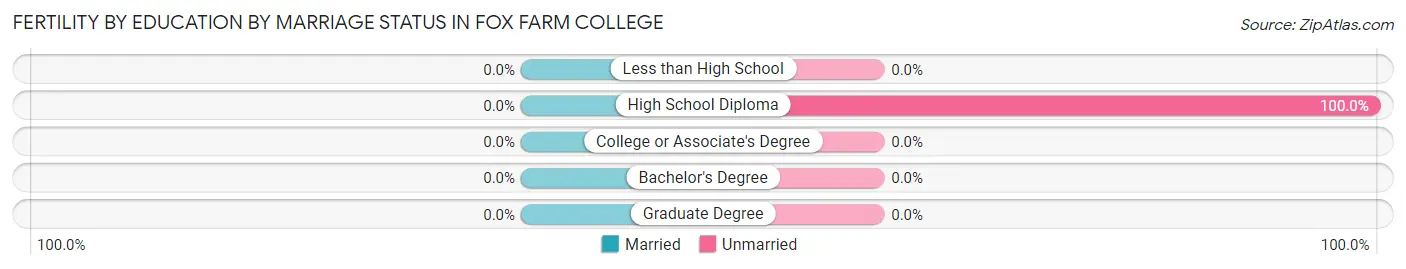
| Educational Attainment | Married | Unmarried |
| Less than High School | 0 (0.0%) | 0 (0.0%) |
| High School Diploma | 0 (0.0%) | 9 (100.0%) |
| College or Associate's Degree | 0 (0.0%) | 0 (0.0%) |
| Bachelor's Degree | 0 (0.0%) | 0 (0.0%) |
| Graduate Degree | 0 (0.0%) | 0 (0.0%) |
| Total | 0 (0.0%) | 9 (100.0%) |
Employment Characteristics in Fox Farm College
Employment by Class of Employer in Fox Farm College
Among the 1,964 employed individuals in Fox Farm College, private company employees (1,469 | 74.8%), not-for-profit organizations (288 | 14.7%), and self-employed (not incorporated) (83 | 4.2%) make up the most common classes of employment.
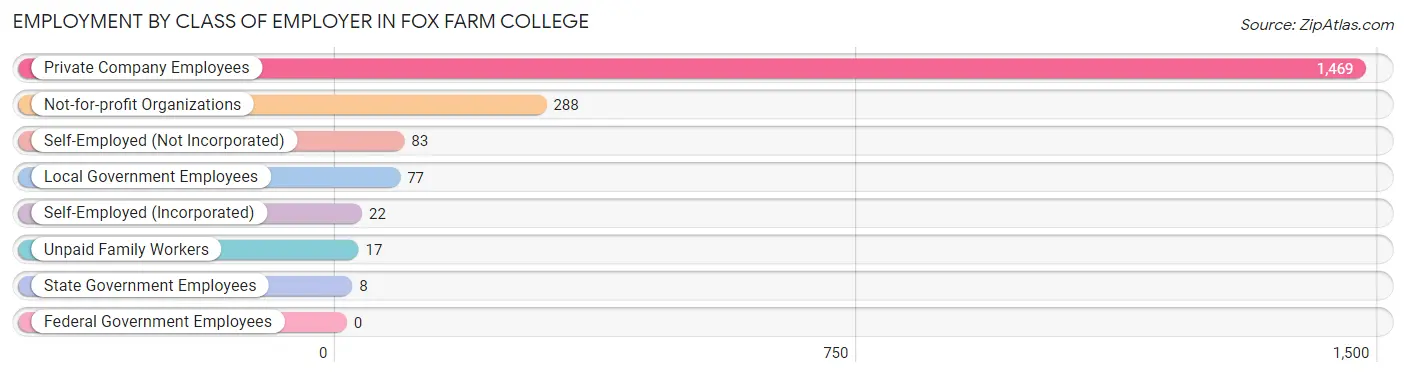
| Employer Class | # Employees | % Employees |
| Private Company Employees | 1,469 | 74.8% |
| Self-Employed (Incorporated) | 22 | 1.1% |
| Self-Employed (Not Incorporated) | 83 | 4.2% |
| Not-for-profit Organizations | 288 | 14.7% |
| Local Government Employees | 77 | 3.9% |
| State Government Employees | 8 | 0.4% |
| Federal Government Employees | 0 | 0.0% |
| Unpaid Family Workers | 17 | 0.9% |
| Total | 1,964 | 100.0% |
Employment Status by Age in Fox Farm College
According to the labor force statistics for Fox Farm College, out of the total population over 16 years of age (3,185), 63.6% or 2,026 individuals are in the labor force, with 1.9% or 38 of them unemployed. The age group with the highest labor force participation rate is 30 to 34 years, with 100.0% or 230 individuals in the labor force. Within the labor force, the 16 to 19 years age range has the highest percentage of unemployed individuals, with 14.3% or 15 of them being unemployed.
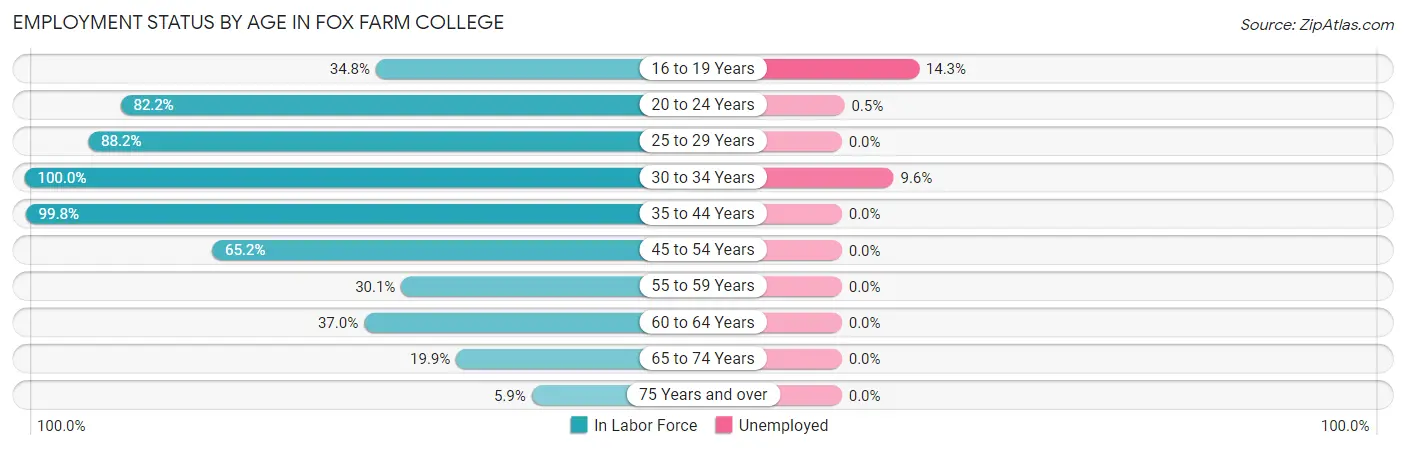
| Age Bracket | In Labor Force | Unemployed |
| 16 to 19 Years | 105 (34.8%) | 15 (14.3%) |
| 20 to 24 Years | 364 (82.2%) | 2 (0.5%) |
| 25 to 29 Years | 322 (88.2%) | 0 (0.0%) |
| 30 to 34 Years | 230 (100.0%) | 22 (9.6%) |
| 35 to 44 Years | 434 (99.8%) | 0 (0.0%) |
| 45 to 54 Years | 379 (65.2%) | 0 (0.0%) |
| 55 to 59 Years | 66 (30.1%) | 0 (0.0%) |
| 60 to 64 Years | 67 (37.0%) | 0 (0.0%) |
| 65 to 74 Years | 48 (19.9%) | 0 (0.0%) |
| 75 Years and over | 11 (5.9%) | 0 (0.0%) |
| Total | 2,026 (63.6%) | 38 (1.9%) |
Employment Status by Educational Attainment in Fox Farm College
According to labor force statistics for Fox Farm College, 74.5% of individuals (1,498) out of the total population between 25 and 64 years of age (2,011) are in the labor force, with 1.5% or 22 of them being unemployed. The group with the highest labor force participation rate are those with the educational attainment of college / associate degree, with 86.2% or 606 individuals in the labor force. Within the labor force, individuals with high school diploma education have the highest percentage of unemployment, with 3.2% or 22 of them being unemployed.
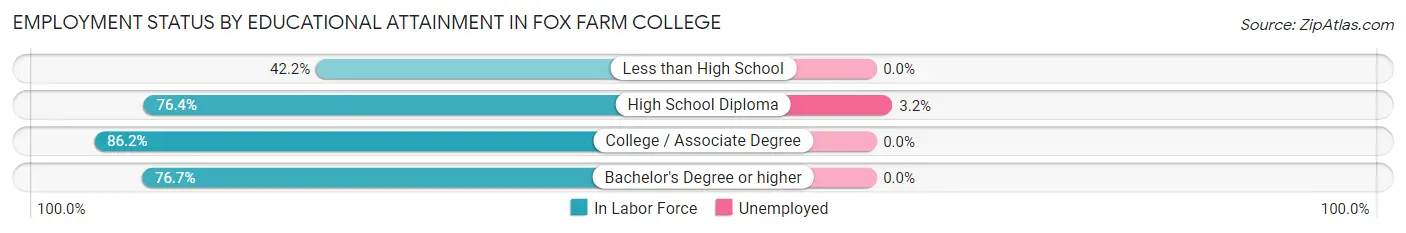
| Educational Attainment | In Labor Force | Unemployed |
| Less than High School | 133 (42.2%) | 0 (0.0%) |
| High School Diploma | 680 (76.4%) | 28 (3.2%) |
| College / Associate Degree | 606 (86.2%) | 0 (0.0%) |
| Bachelor's Degree or higher | 79 (76.7%) | 0 (0.0%) |
| Total | 1,498 (74.5%) | 30 (1.5%) |
Employment Occupations by Sex in Fox Farm College
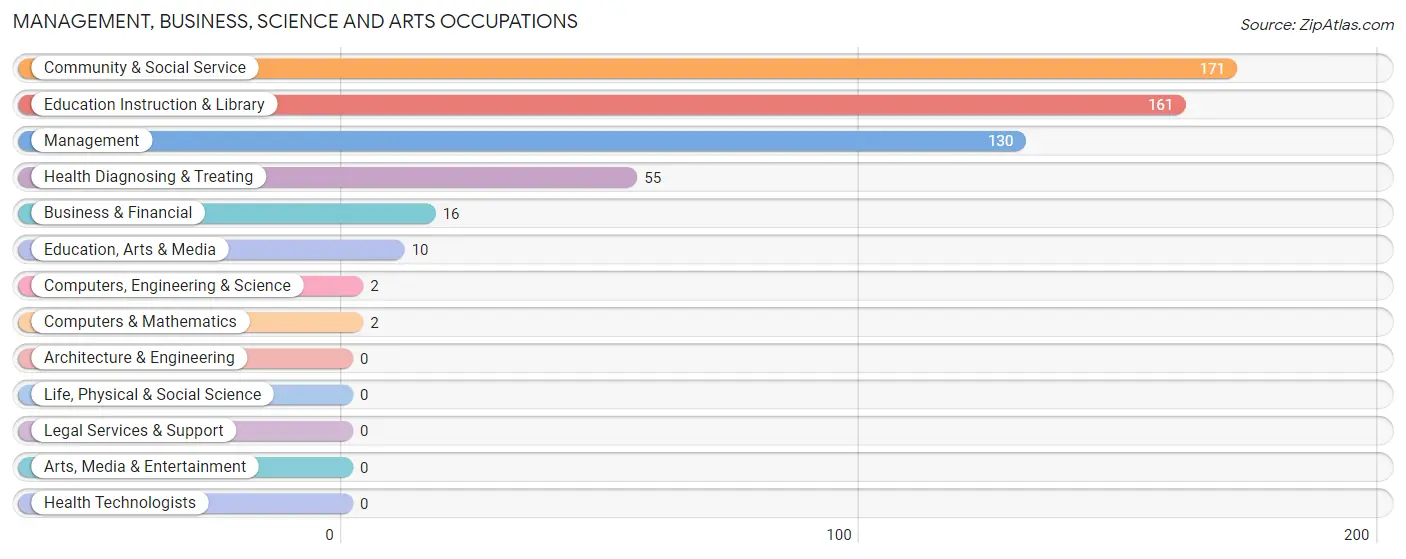
Management, Business, Science and Arts Occupations
The most common Management, Business, Science and Arts occupations in Fox Farm College are Community & Social Service (171 | 8.6%), Education Instruction & Library (161 | 8.1%), Management (130 | 6.5%), Health Diagnosing & Treating (55 | 2.8%), and Business & Financial (16 | 0.8%).
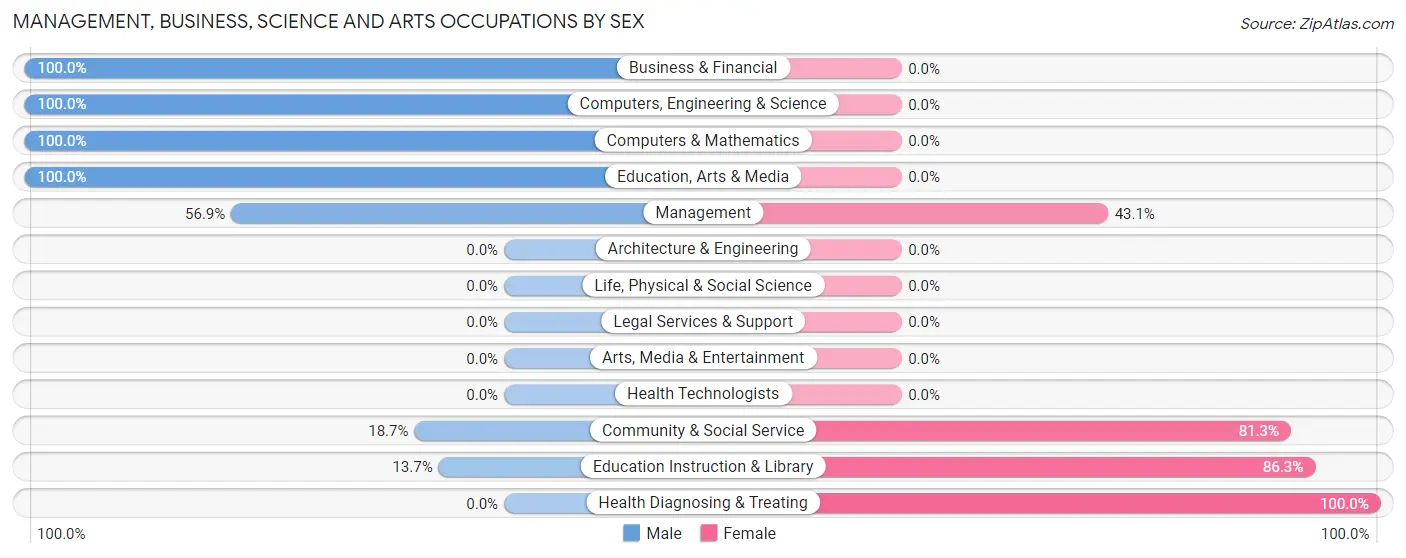
Management, Business, Science and Arts Occupations by Sex
Within the Management, Business, Science and Arts occupations in Fox Farm College, the most male-oriented occupations are Business & Financial (100.0%), Computers, Engineering & Science (100.0%), and Computers & Mathematics (100.0%), while the most female-oriented occupations are Health Diagnosing & Treating (100.0%), Education Instruction & Library (86.3%), and Community & Social Service (81.3%).
| Occupation | Male | Female |
| Management | 74 (56.9%) | 56 (43.1%) |
| Business & Financial | 16 (100.0%) | 0 (0.0%) |
| Computers, Engineering & Science | 2 (100.0%) | 0 (0.0%) |
| Computers & Mathematics | 2 (100.0%) | 0 (0.0%) |
| Architecture & Engineering | 0 (0.0%) | 0 (0.0%) |
| Life, Physical & Social Science | 0 (0.0%) | 0 (0.0%) |
| Community & Social Service | 32 (18.7%) | 139 (81.3%) |
| Education, Arts & Media | 10 (100.0%) | 0 (0.0%) |
| Legal Services & Support | 0 (0.0%) | 0 (0.0%) |
| Education Instruction & Library | 22 (13.7%) | 139 (86.3%) |
| Arts, Media & Entertainment | 0 (0.0%) | 0 (0.0%) |
| Health Diagnosing & Treating | 0 (0.0%) | 55 (100.0%) |
| Health Technologists | 0 (0.0%) | 0 (0.0%) |
| Total (Category) | 124 (33.2%) | 250 (66.8%) |
| Total (Overall) | 896 (45.1%) | 1,091 (54.9%) |
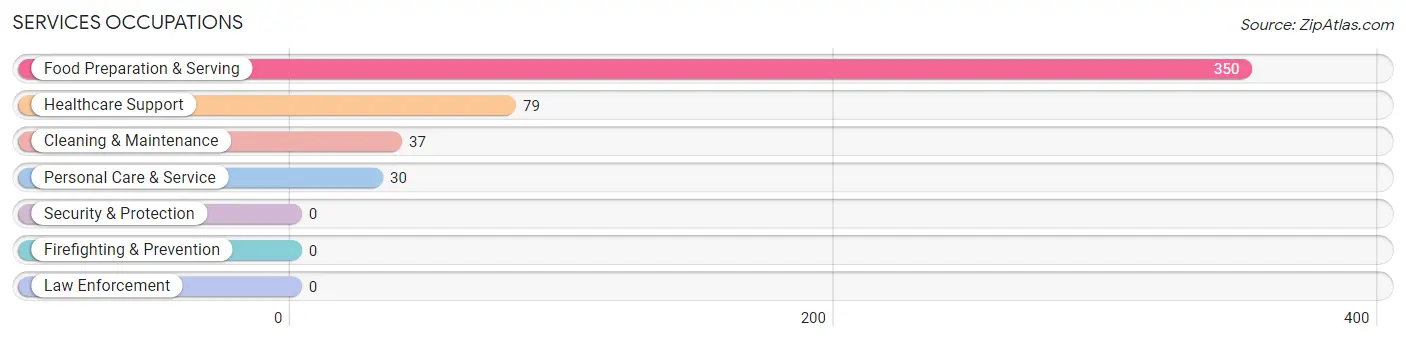
Services Occupations
The most common Services occupations in Fox Farm College are Food Preparation & Serving (350 | 17.6%), Healthcare Support (79 | 4.0%), Cleaning & Maintenance (37 | 1.9%), and Personal Care & Service (30 | 1.5%).
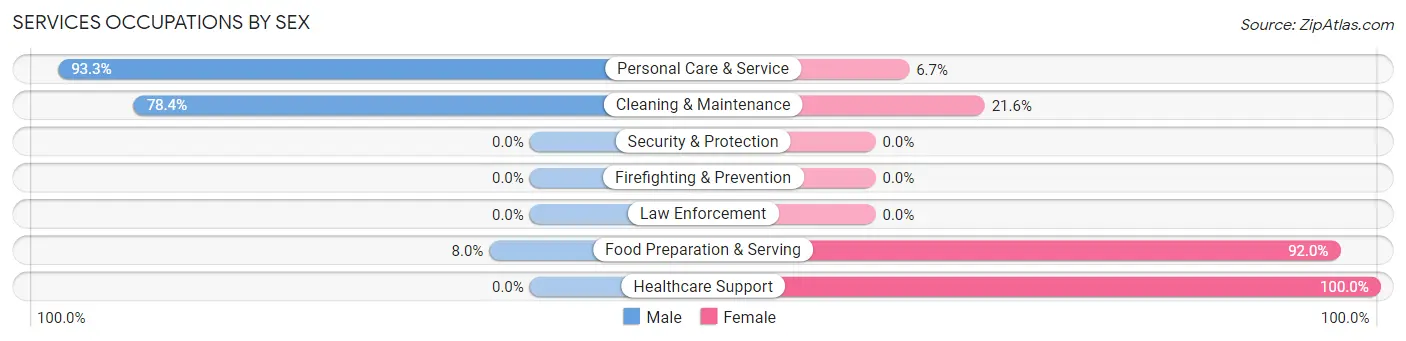
Services Occupations by Sex
Within the Services occupations in Fox Farm College, the most male-oriented occupations are Personal Care & Service (93.3%), Cleaning & Maintenance (78.4%), and Food Preparation & Serving (8.0%), while the most female-oriented occupations are Healthcare Support (100.0%), Food Preparation & Serving (92.0%), and Cleaning & Maintenance (21.6%).
| Occupation | Male | Female |
| Healthcare Support | 0 (0.0%) | 79 (100.0%) |
| Security & Protection | 0 (0.0%) | 0 (0.0%) |
| Firefighting & Prevention | 0 (0.0%) | 0 (0.0%) |
| Law Enforcement | 0 (0.0%) | 0 (0.0%) |
| Food Preparation & Serving | 28 (8.0%) | 322 (92.0%) |
| Cleaning & Maintenance | 29 (78.4%) | 8 (21.6%) |
| Personal Care & Service | 28 (93.3%) | 2 (6.7%) |
| Total (Category) | 85 (17.1%) | 411 (82.9%) |
| Total (Overall) | 896 (45.1%) | 1,091 (54.9%) |
Sales and Office Occupations
The most common Sales and Office occupations in Fox Farm College are Office & Administration (325 | 16.4%), and Sales & Related (271 | 13.6%).

Sales and Office Occupations by Sex
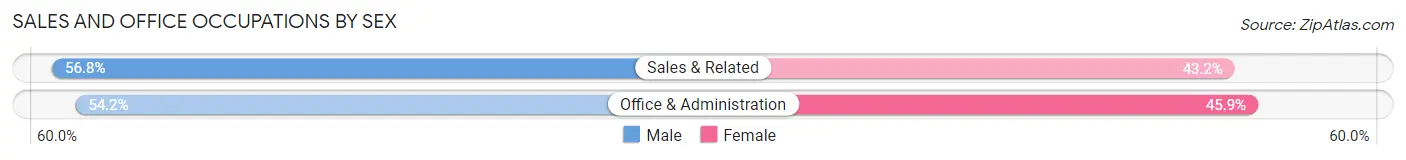
| Occupation | Male | Female |
| Sales & Related | 154 (56.8%) | 117 (43.2%) |
| Office & Administration | 176 (54.1%) | 149 (45.9%) |
| Total (Category) | 330 (55.4%) | 266 (44.6%) |
| Total (Overall) | 896 (45.1%) | 1,091 (54.9%) |
Natural Resources, Construction and Maintenance Occupations
The most common Natural Resources, Construction and Maintenance occupations in Fox Farm College are Construction & Extraction (237 | 11.9%), Installation, Maintenance & Repair (15 | 0.7%), and Farming, Fishing & Forestry (2 | 0.1%).

Natural Resources, Construction and Maintenance Occupations by Sex
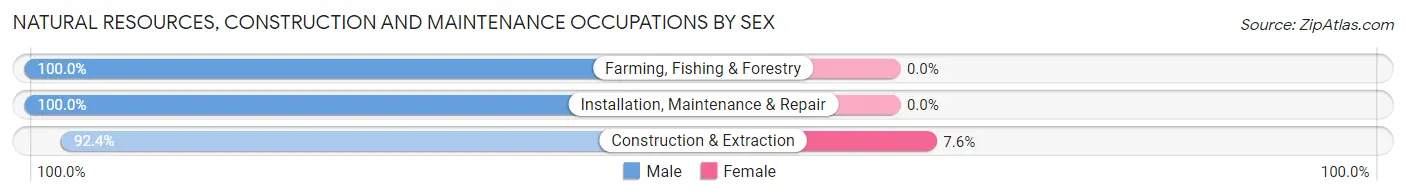
| Occupation | Male | Female |
| Farming, Fishing & Forestry | 2 (100.0%) | 0 (0.0%) |
| Construction & Extraction | 219 (92.4%) | 18 (7.6%) |
| Installation, Maintenance & Repair | 15 (100.0%) | 0 (0.0%) |
| Total (Category) | 236 (92.9%) | 18 (7.1%) |
| Total (Overall) | 896 (45.1%) | 1,091 (54.9%) |
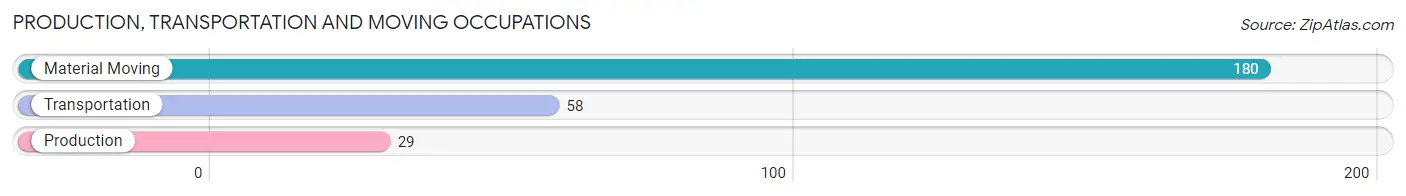
Production, Transportation and Moving Occupations
The most common Production, Transportation and Moving occupations in Fox Farm College are Material Moving (180 | 9.1%), Transportation (58 | 2.9%), and Production (29 | 1.5%).
Production, Transportation and Moving Occupations by Sex
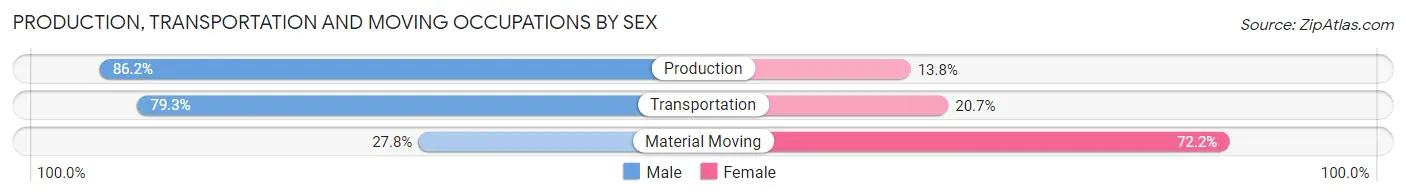
| Occupation | Male | Female |
| Production | 25 (86.2%) | 4 (13.8%) |
| Transportation | 46 (79.3%) | 12 (20.7%) |
| Material Moving | 50 (27.8%) | 130 (72.2%) |
| Total (Category) | 121 (45.3%) | 146 (54.7%) |
| Total (Overall) | 896 (45.1%) | 1,091 (54.9%) |
Employment Industries by Sex in Fox Farm College
Employment Industries in Fox Farm College
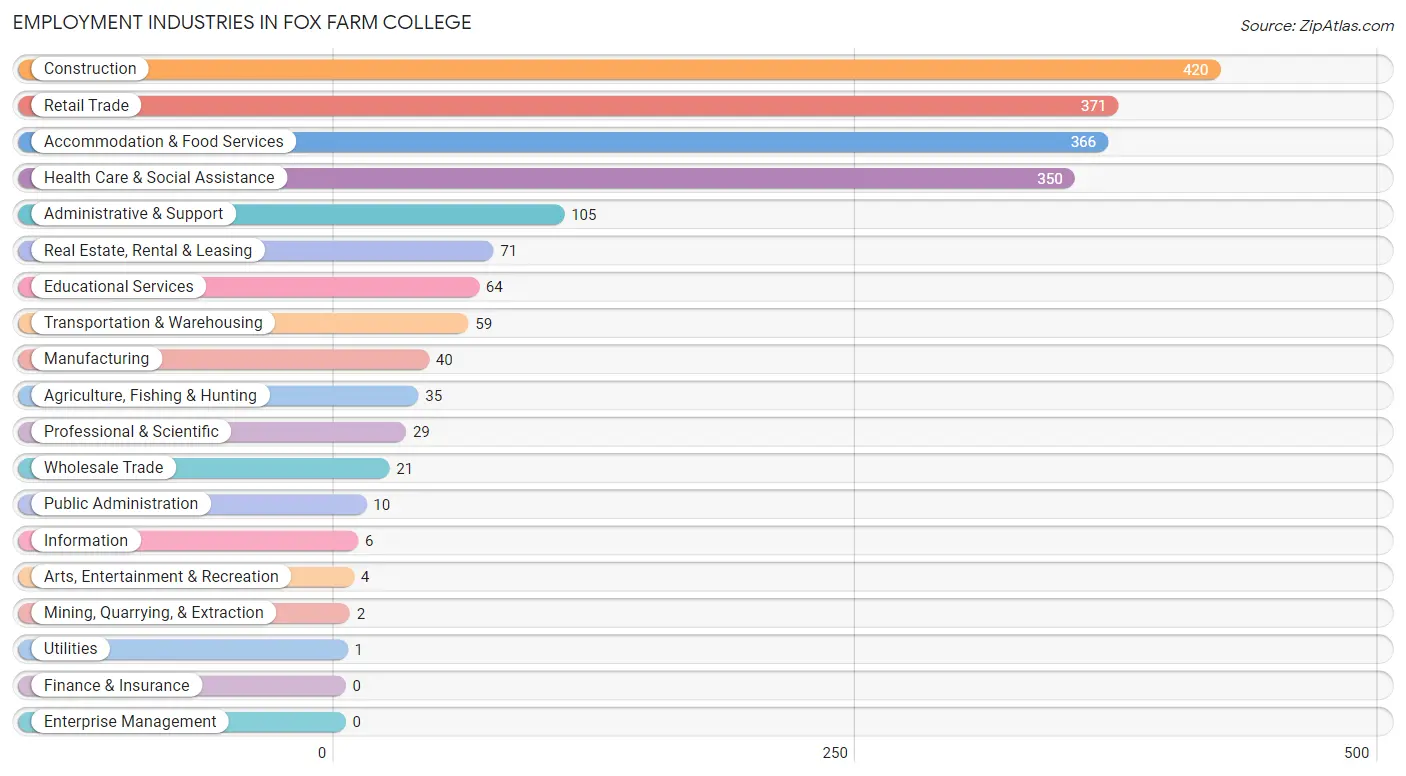
The major employment industries in Fox Farm College include Construction (420 | 21.1%), Retail Trade (371 | 18.7%), Accommodation & Food Services (366 | 18.4%), Health Care & Social Assistance (350 | 17.6%), and Administrative & Support (105 | 5.3%).
Employment Industries by Sex in Fox Farm College
The Fox Farm College industries that see more men than women are Mining, Quarrying, & Extraction (100.0%), Manufacturing (100.0%), and Wholesale Trade (100.0%), whereas the industries that tend to have a higher number of women are Professional & Scientific (100.0%), Accommodation & Food Services (92.3%), and Health Care & Social Assistance (80.9%).
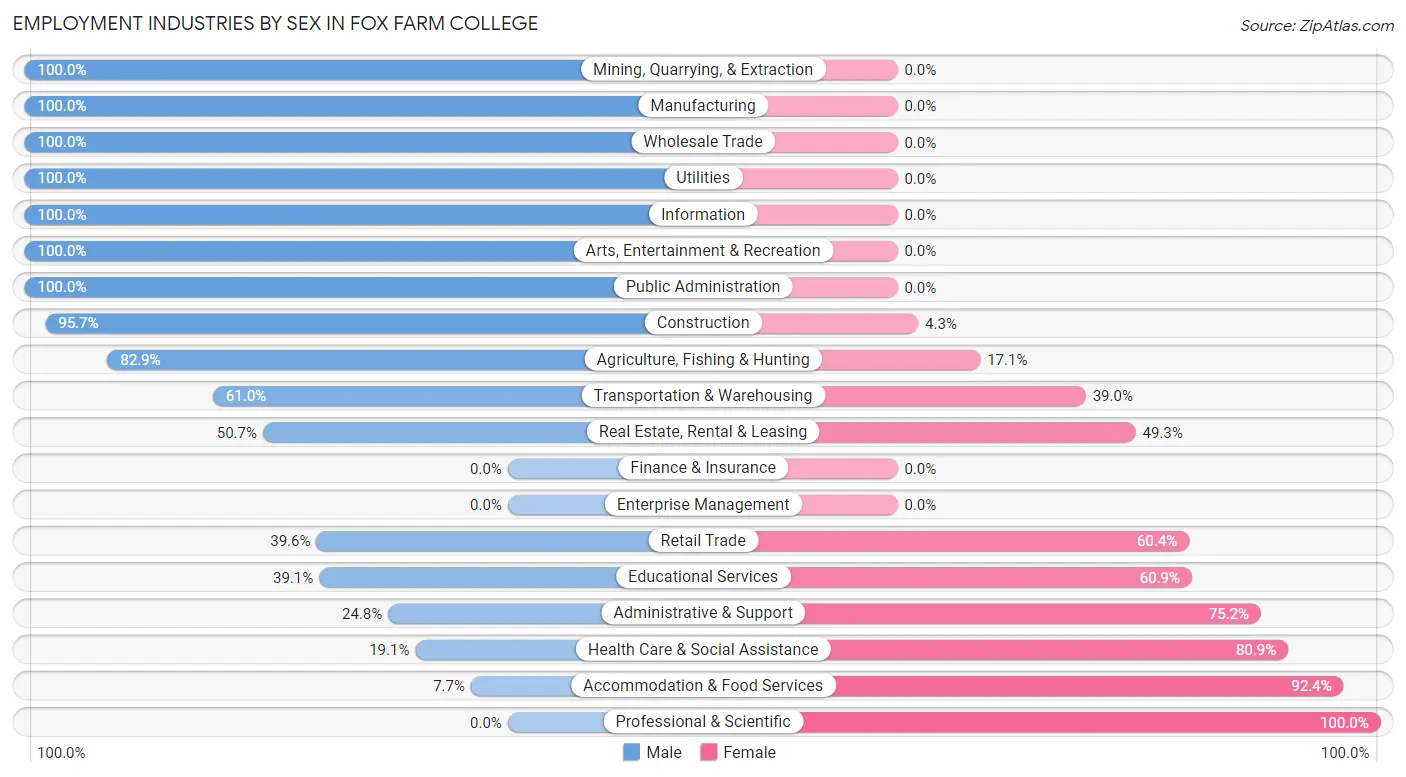
| Industry | Male | Female |
| Agriculture, Fishing & Hunting | 29 (82.9%) | 6 (17.1%) |
| Mining, Quarrying, & Extraction | 2 (100.0%) | 0 (0.0%) |
| Construction | 402 (95.7%) | 18 (4.3%) |
| Manufacturing | 40 (100.0%) | 0 (0.0%) |
| Wholesale Trade | 21 (100.0%) | 0 (0.0%) |
| Retail Trade | 147 (39.6%) | 224 (60.4%) |
| Transportation & Warehousing | 36 (61.0%) | 23 (39.0%) |
| Utilities | 1 (100.0%) | 0 (0.0%) |
| Information | 6 (100.0%) | 0 (0.0%) |
| Finance & Insurance | 0 (0.0%) | 0 (0.0%) |
| Real Estate, Rental & Leasing | 36 (50.7%) | 35 (49.3%) |
| Professional & Scientific | 0 (0.0%) | 29 (100.0%) |
| Enterprise Management | 0 (0.0%) | 0 (0.0%) |
| Administrative & Support | 26 (24.8%) | 79 (75.2%) |
| Educational Services | 25 (39.1%) | 39 (60.9%) |
| Health Care & Social Assistance | 67 (19.1%) | 283 (80.9%) |
| Arts, Entertainment & Recreation | 4 (100.0%) | 0 (0.0%) |
| Accommodation & Food Services | 28 (7.6%) | 338 (92.3%) |
| Public Administration | 10 (100.0%) | 0 (0.0%) |
| Total | 896 (45.1%) | 1,091 (54.9%) |
Education in Fox Farm College
School Enrollment in Fox Farm College
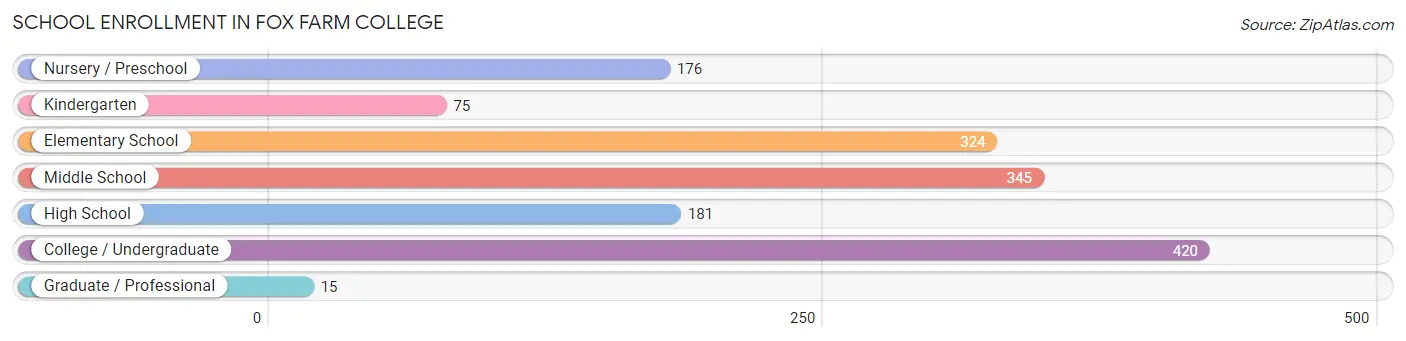
The most common levels of schooling among the 1,536 students in Fox Farm College are college / undergraduate (420 | 27.3%), middle school (345 | 22.5%), and elementary school (324 | 21.1%).
| School Level | # Students | % Students |
| Nursery / Preschool | 176 | 11.5% |
| Kindergarten | 75 | 4.9% |
| Elementary School | 324 | 21.1% |
| Middle School | 345 | 22.5% |
| High School | 181 | 11.8% |
| College / Undergraduate | 420 | 27.3% |
| Graduate / Professional | 15 | 1.0% |
| Total | 1,536 | 100.0% |
School Enrollment by Age by Funding Source in Fox Farm College
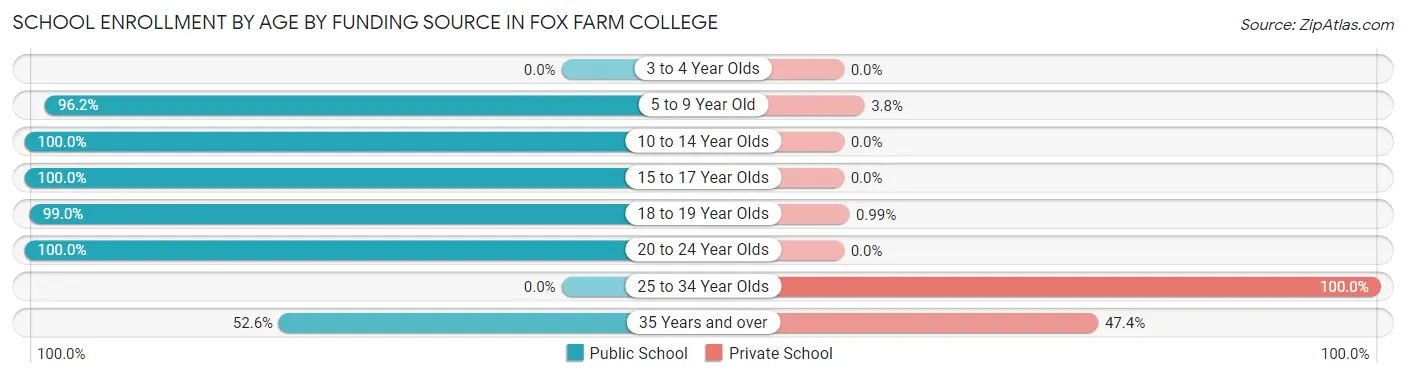
Out of a total of 1,536 students who are enrolled in schools in Fox Farm College, 68 (4.4%) attend a private institution, while the remaining 1,468 (95.6%) are enrolled in public schools. The age group of 25 to 34 year olds has the highest likelihood of being enrolled in private schools, with 34 (100.0% in the age bracket) enrolled. Conversely, the age group of 10 to 14 year olds has the lowest likelihood of being enrolled in a private school, with 345 (100.0% in the age bracket) attending a public institution.
| Age Bracket | Public School | Private School |
| 3 to 4 Year Olds | 0 (0.0%) | 0 (0.0%) |
| 5 to 9 Year Old | 553 (96.2%) | 22 (3.8%) |
| 10 to 14 Year Olds | 345 (100.0%) | 0 (0.0%) |
| 15 to 17 Year Olds | 32 (100.0%) | 0 (0.0%) |
| 18 to 19 Year Olds | 299 (99.0%) | 3 (1.0%) |
| 20 to 24 Year Olds | 229 (100.0%) | 0 (0.0%) |
| 25 to 34 Year Olds | 0 (0.0%) | 34 (100.0%) |
| 35 Years and over | 10 (52.6%) | 9 (47.4%) |
| Total | 1,468 (95.6%) | 68 (4.4%) |
Educational Attainment by Field of Study in Fox Farm College
Psychology (47 | 39.2%), liberal arts & history (35 | 29.2%), arts & humanities (23 | 19.2%), science & technology (8 | 6.7%), and education (7 | 5.8%) are the most common fields of study among 120 individuals in Fox Farm College who have obtained a bachelor's degree or higher.
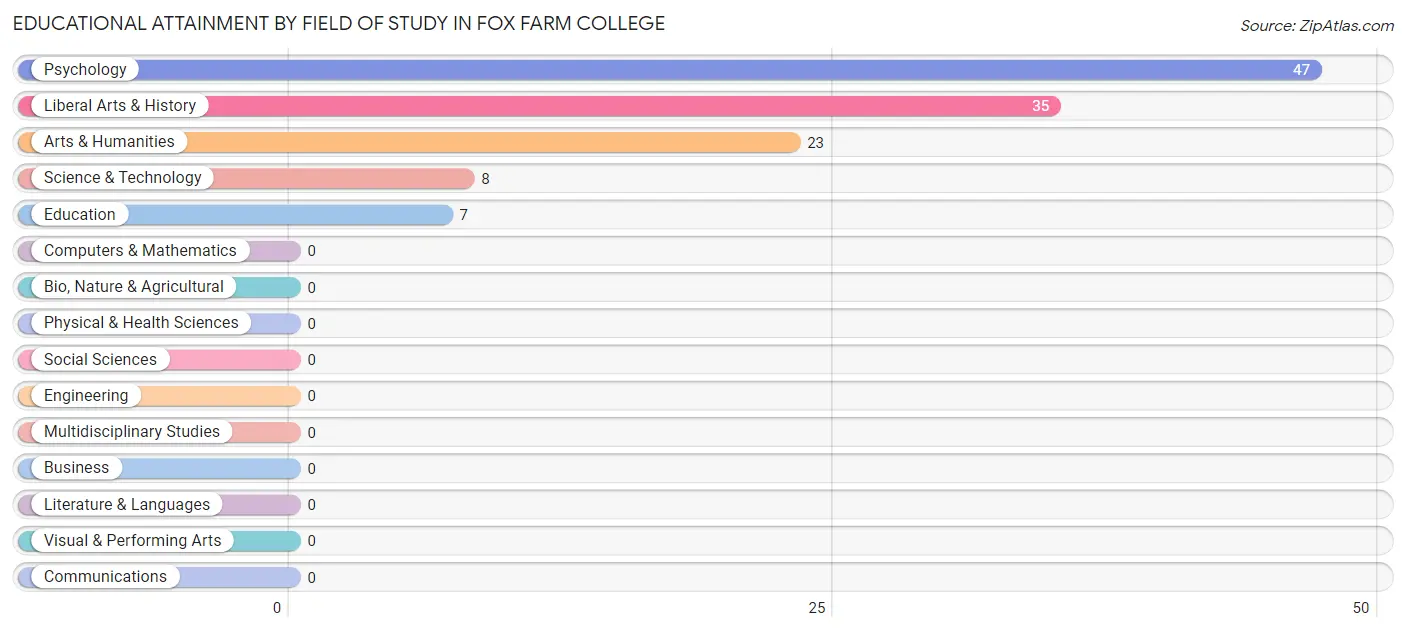
| Field of Study | # Graduates | % Graduates |
| Computers & Mathematics | 0 | 0.0% |
| Bio, Nature & Agricultural | 0 | 0.0% |
| Physical & Health Sciences | 0 | 0.0% |
| Psychology | 47 | 39.2% |
| Social Sciences | 0 | 0.0% |
| Engineering | 0 | 0.0% |
| Multidisciplinary Studies | 0 | 0.0% |
| Science & Technology | 8 | 6.7% |
| Business | 0 | 0.0% |
| Education | 7 | 5.8% |
| Literature & Languages | 0 | 0.0% |
| Liberal Arts & History | 35 | 29.2% |
| Visual & Performing Arts | 0 | 0.0% |
| Communications | 0 | 0.0% |
| Arts & Humanities | 23 | 19.2% |
| Total | 120 | 100.0% |
Transportation & Commute in Fox Farm College
Vehicle Availability by Sex in Fox Farm College
The most prevalent vehicle ownership categories in Fox Farm College are males with 2 vehicles (355, accounting for 42.5%) and females with 2 vehicles (603, making up 34.3%).
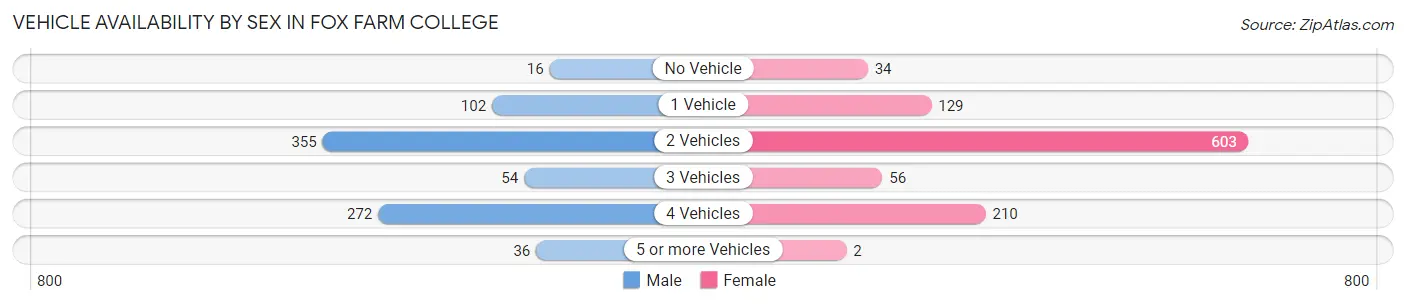
| Vehicles Available | Male | Female |
| No Vehicle | 16 (1.9%) | 34 (3.3%) |
| 1 Vehicle | 102 (12.2%) | 129 (12.5%) |
| 2 Vehicles | 355 (42.5%) | 603 (58.3%) |
| 3 Vehicles | 54 (6.5%) | 56 (5.4%) |
| 4 Vehicles | 272 (32.6%) | 210 (20.3%) |
| 5 or more Vehicles | 36 (4.3%) | 2 (0.2%) |
| Total | 835 (100.0%) | 1,034 (100.0%) |
Commute Time in Fox Farm College
The most frequently occuring commute durations in Fox Farm College are 10 to 14 minutes (562 commuters, 29.9%), 15 to 19 minutes (493 commuters, 26.2%), and 5 to 9 minutes (394 commuters, 20.9%).
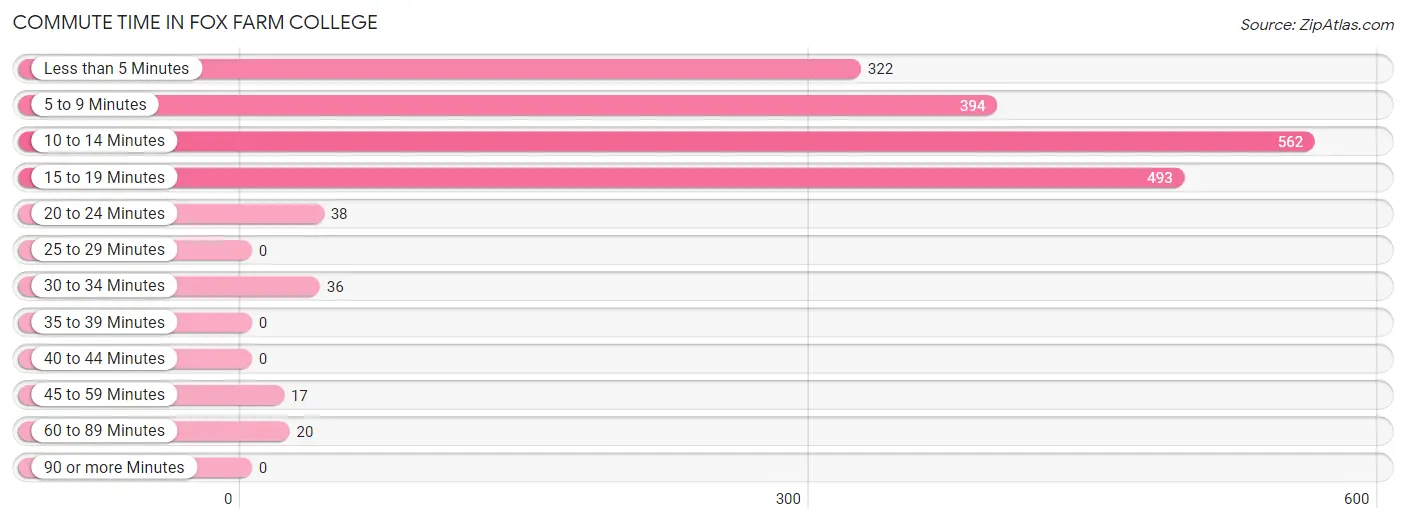
| Commute Time | # Commuters | % Commuters |
| Less than 5 Minutes | 322 | 17.1% |
| 5 to 9 Minutes | 394 | 20.9% |
| 10 to 14 Minutes | 562 | 29.9% |
| 15 to 19 Minutes | 493 | 26.2% |
| 20 to 24 Minutes | 38 | 2.0% |
| 25 to 29 Minutes | 0 | 0.0% |
| 30 to 34 Minutes | 36 | 1.9% |
| 35 to 39 Minutes | 0 | 0.0% |
| 40 to 44 Minutes | 0 | 0.0% |
| 45 to 59 Minutes | 17 | 0.9% |
| 60 to 89 Minutes | 20 | 1.1% |
| 90 or more Minutes | 0 | 0.0% |
Commute Time by Sex in Fox Farm College
The most common commute times in Fox Farm College are 10 to 14 minutes (353 commuters, 42.9%) for males and less than 5 minutes (305 commuters, 28.8%) for females.
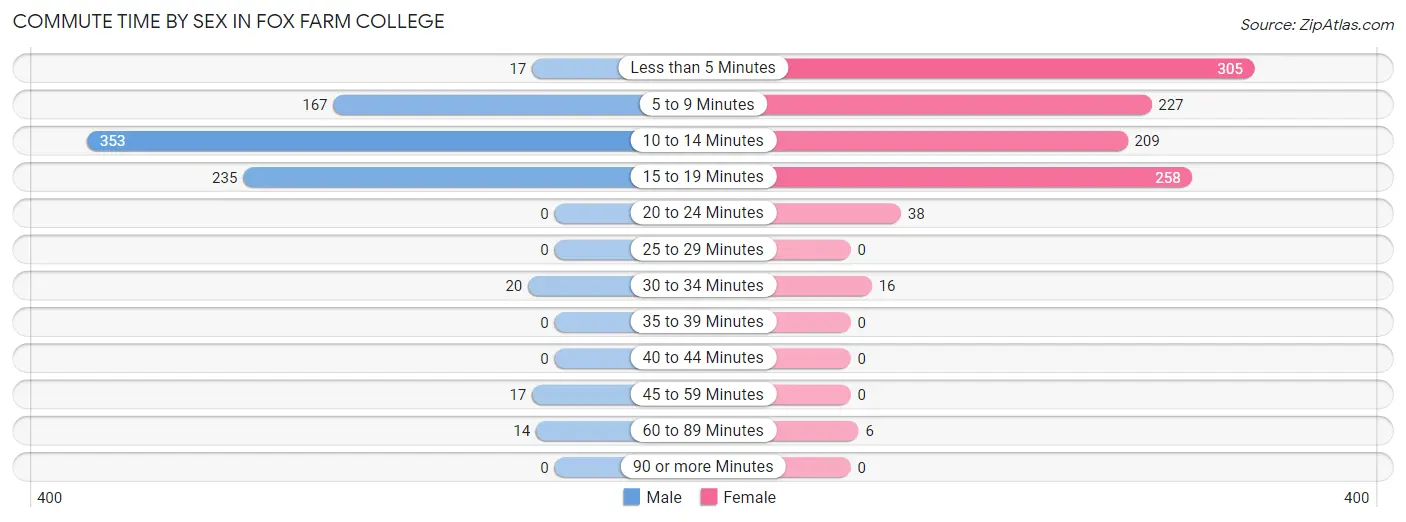
| Commute Time | Male | Female |
| Less than 5 Minutes | 17 (2.1%) | 305 (28.8%) |
| 5 to 9 Minutes | 167 (20.3%) | 227 (21.4%) |
| 10 to 14 Minutes | 353 (42.9%) | 209 (19.7%) |
| 15 to 19 Minutes | 235 (28.5%) | 258 (24.4%) |
| 20 to 24 Minutes | 0 (0.0%) | 38 (3.6%) |
| 25 to 29 Minutes | 0 (0.0%) | 0 (0.0%) |
| 30 to 34 Minutes | 20 (2.4%) | 16 (1.5%) |
| 35 to 39 Minutes | 0 (0.0%) | 0 (0.0%) |
| 40 to 44 Minutes | 0 (0.0%) | 0 (0.0%) |
| 45 to 59 Minutes | 17 (2.1%) | 0 (0.0%) |
| 60 to 89 Minutes | 14 (1.7%) | 6 (0.6%) |
| 90 or more Minutes | 0 (0.0%) | 0 (0.0%) |
Time of Departure to Work by Sex in Fox Farm College
The most frequent times of departure to work in Fox Farm College are 8:00 AM to 8:29 AM (262, 31.8%) for males and 5:00 AM to 5:29 AM (269, 25.4%) for females.
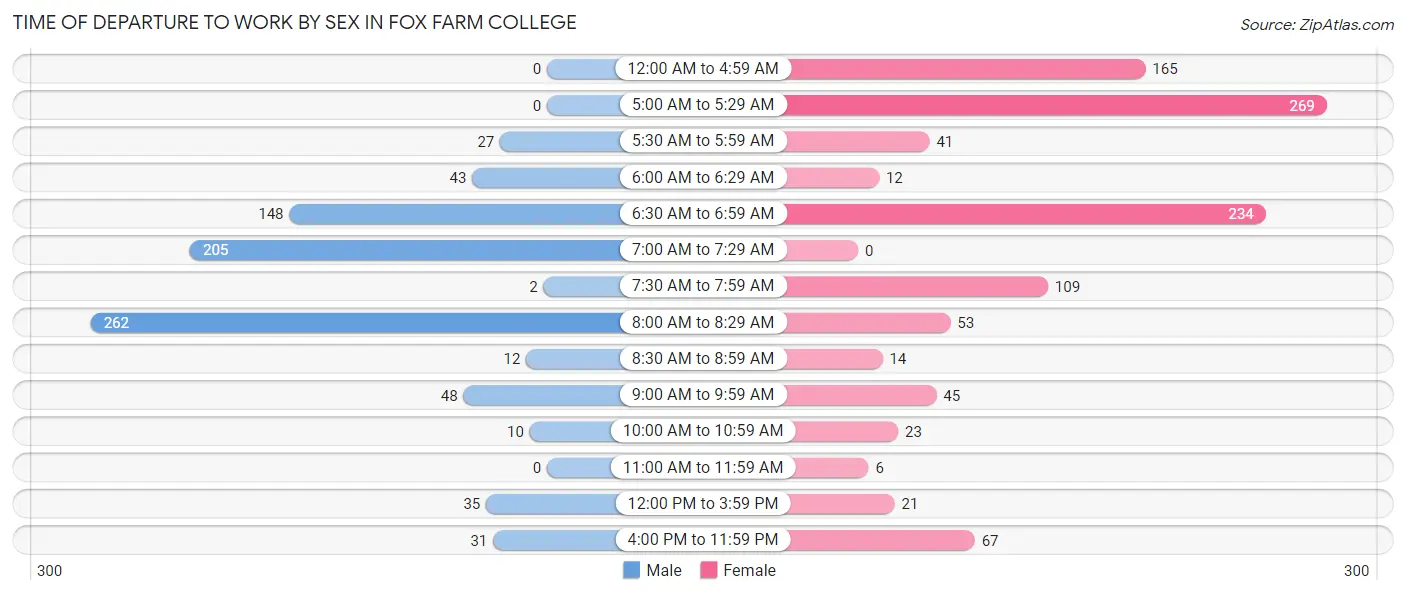
| Time of Departure | Male | Female |
| 12:00 AM to 4:59 AM | 0 (0.0%) | 165 (15.6%) |
| 5:00 AM to 5:29 AM | 0 (0.0%) | 269 (25.4%) |
| 5:30 AM to 5:59 AM | 27 (3.3%) | 41 (3.9%) |
| 6:00 AM to 6:29 AM | 43 (5.2%) | 12 (1.1%) |
| 6:30 AM to 6:59 AM | 148 (18.0%) | 234 (22.1%) |
| 7:00 AM to 7:29 AM | 205 (24.9%) | 0 (0.0%) |
| 7:30 AM to 7:59 AM | 2 (0.2%) | 109 (10.3%) |
| 8:00 AM to 8:29 AM | 262 (31.8%) | 53 (5.0%) |
| 8:30 AM to 8:59 AM | 12 (1.5%) | 14 (1.3%) |
| 9:00 AM to 9:59 AM | 48 (5.8%) | 45 (4.3%) |
| 10:00 AM to 10:59 AM | 10 (1.2%) | 23 (2.2%) |
| 11:00 AM to 11:59 AM | 0 (0.0%) | 6 (0.6%) |
| 12:00 PM to 3:59 PM | 35 (4.3%) | 21 (2.0%) |
| 4:00 PM to 11:59 PM | 31 (3.8%) | 67 (6.3%) |
| Total | 823 (100.0%) | 1,059 (100.0%) |
Housing Occupancy in Fox Farm College
Occupancy by Ownership in Fox Farm College
Of the total 1,439 dwellings in Fox Farm College, owner-occupied units account for 819 (56.9%), while renter-occupied units make up 620 (43.1%).
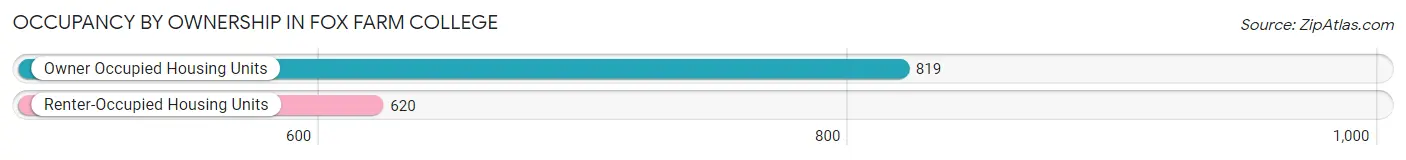
| Occupancy | # Housing Units | % Housing Units |
| Owner Occupied Housing Units | 819 | 56.9% |
| Renter-Occupied Housing Units | 620 | 43.1% |
| Total Occupied Housing Units | 1,439 | 100.0% |
Occupancy by Household Size in Fox Farm College
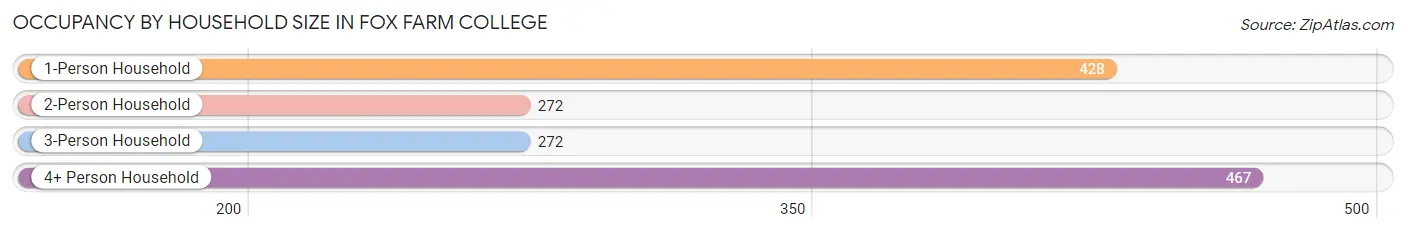
| Household Size | # Housing Units | % Housing Units |
| 1-Person Household | 428 | 29.7% |
| 2-Person Household | 272 | 18.9% |
| 3-Person Household | 272 | 18.9% |
| 4+ Person Household | 467 | 32.5% |
| Total Housing Units | 1,439 | 100.0% |
Occupancy by Ownership by Household Size in Fox Farm College
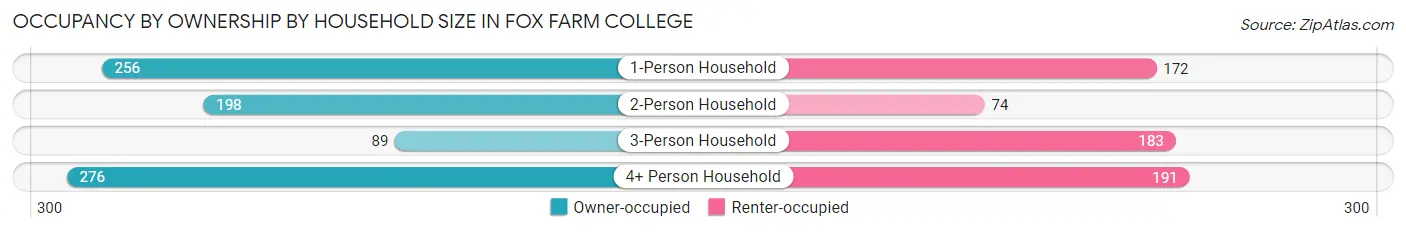
| Household Size | Owner-occupied | Renter-occupied |
| 1-Person Household | 256 (59.8%) | 172 (40.2%) |
| 2-Person Household | 198 (72.8%) | 74 (27.2%) |
| 3-Person Household | 89 (32.7%) | 183 (67.3%) |
| 4+ Person Household | 276 (59.1%) | 191 (40.9%) |
| Total Housing Units | 819 (56.9%) | 620 (43.1%) |
Occupancy by Educational Attainment in Fox Farm College
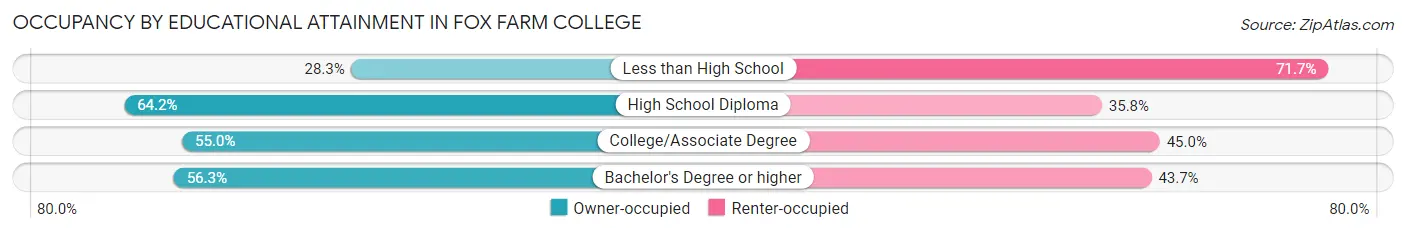
| Household Size | Owner-occupied | Renter-occupied |
| Less than High School | 30 (28.3%) | 76 (71.7%) |
| High School Diploma | 382 (64.2%) | 213 (35.8%) |
| College/Associate Degree | 367 (55.0%) | 300 (45.0%) |
| Bachelor's Degree or higher | 40 (56.3%) | 31 (43.7%) |
Occupancy by Age of Householder in Fox Farm College
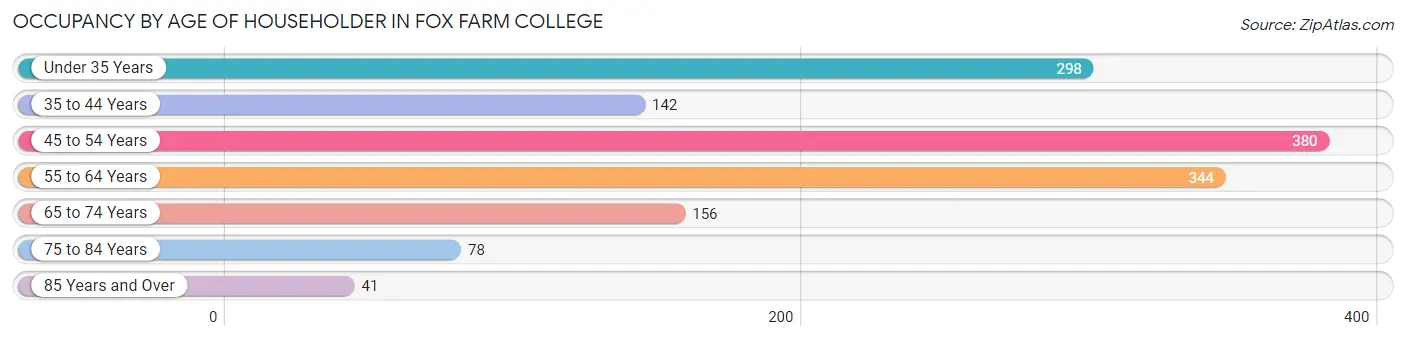
| Age Bracket | # Households | % Households |
| Under 35 Years | 298 | 20.7% |
| 35 to 44 Years | 142 | 9.9% |
| 45 to 54 Years | 380 | 26.4% |
| 55 to 64 Years | 344 | 23.9% |
| 65 to 74 Years | 156 | 10.8% |
| 75 to 84 Years | 78 | 5.4% |
| 85 Years and Over | 41 | 2.9% |
| Total | 1,439 | 100.0% |
Housing Finances in Fox Farm College
Median Income by Occupancy in Fox Farm College
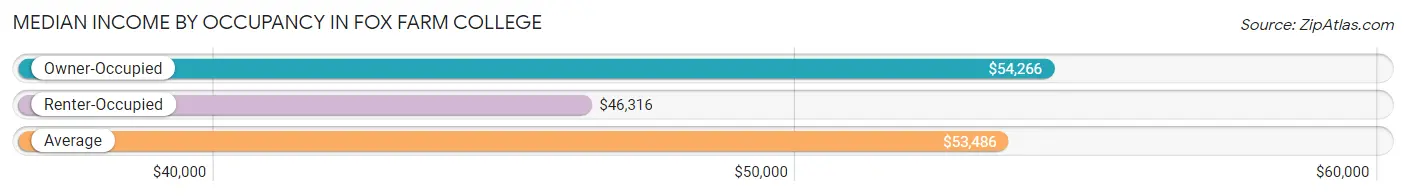
| Occupancy Type | # Households | Median Income |
| Owner-Occupied | 819 (56.9%) | $54,266 |
| Renter-Occupied | 620 (43.1%) | $46,316 |
| Average | 1,439 (100.0%) | $53,486 |
Occupancy by Householder Income Bracket in Fox Farm College
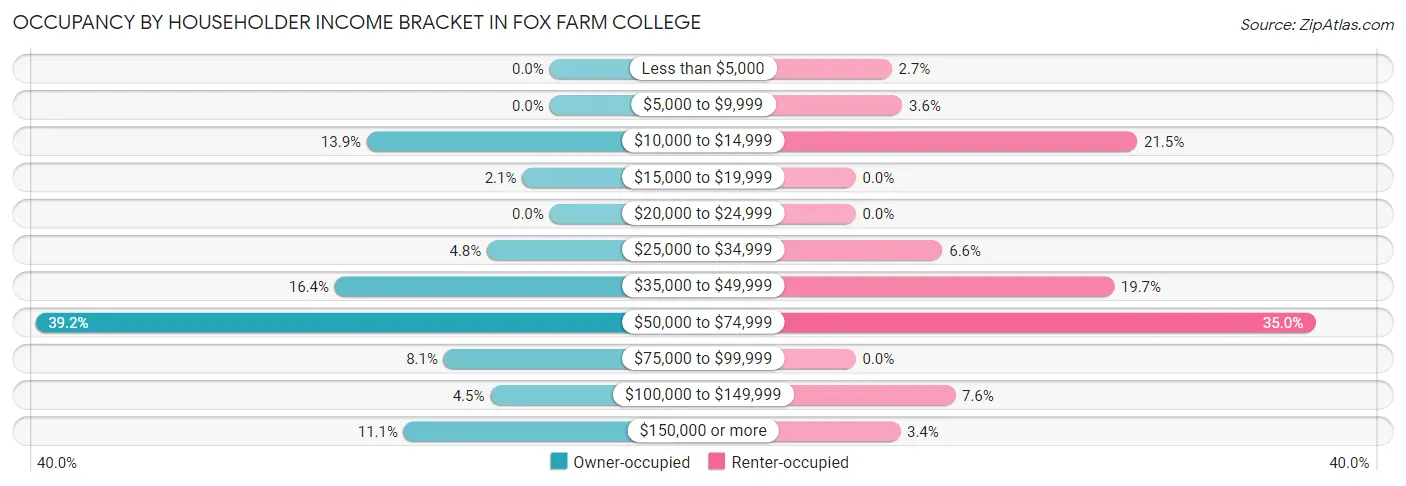
| Income Bracket | Owner-occupied | Renter-occupied |
| Less than $5,000 | 0 (0.0%) | 17 (2.7%) |
| $5,000 to $9,999 | 0 (0.0%) | 22 (3.5%) |
| $10,000 to $14,999 | 114 (13.9%) | 133 (21.4%) |
| $15,000 to $19,999 | 17 (2.1%) | 0 (0.0%) |
| $20,000 to $24,999 | 0 (0.0%) | 0 (0.0%) |
| $25,000 to $34,999 | 39 (4.8%) | 41 (6.6%) |
| $35,000 to $49,999 | 134 (16.4%) | 122 (19.7%) |
| $50,000 to $74,999 | 321 (39.2%) | 217 (35.0%) |
| $75,000 to $99,999 | 66 (8.1%) | 0 (0.0%) |
| $100,000 to $149,999 | 37 (4.5%) | 47 (7.6%) |
| $150,000 or more | 91 (11.1%) | 21 (3.4%) |
| Total | 819 (100.0%) | 620 (100.0%) |
Monthly Housing Cost Tiers in Fox Farm College
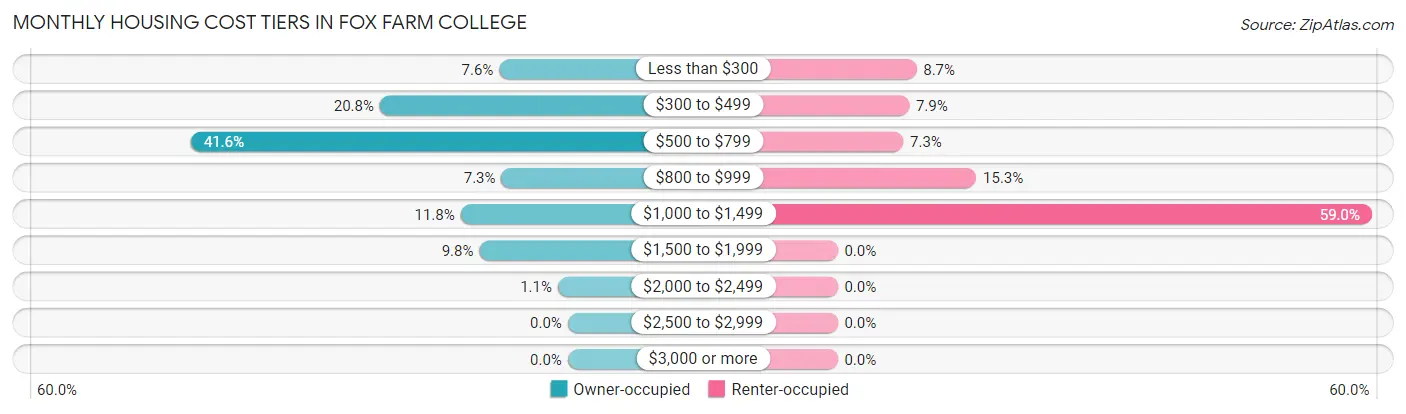
| Monthly Cost | Owner-occupied | Renter-occupied |
| Less than $300 | 62 (7.6%) | 54 (8.7%) |
| $300 to $499 | 170 (20.8%) | 49 (7.9%) |
| $500 to $799 | 341 (41.6%) | 45 (7.3%) |
| $800 to $999 | 60 (7.3%) | 95 (15.3%) |
| $1,000 to $1,499 | 97 (11.8%) | 366 (59.0%) |
| $1,500 to $1,999 | 80 (9.8%) | 0 (0.0%) |
| $2,000 to $2,499 | 9 (1.1%) | 0 (0.0%) |
| $2,500 to $2,999 | 0 (0.0%) | 0 (0.0%) |
| $3,000 or more | 0 (0.0%) | 0 (0.0%) |
| Total | 819 (100.0%) | 620 (100.0%) |
Physical Housing Characteristics in Fox Farm College
Housing Structures in Fox Farm College
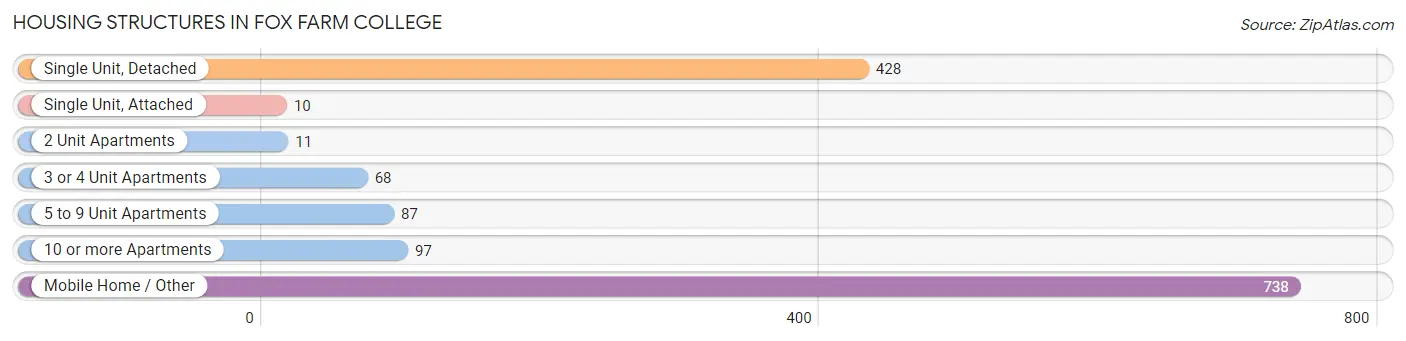
| Structure Type | # Housing Units | % Housing Units |
| Single Unit, Detached | 428 | 29.7% |
| Single Unit, Attached | 10 | 0.7% |
| 2 Unit Apartments | 11 | 0.8% |
| 3 or 4 Unit Apartments | 68 | 4.7% |
| 5 to 9 Unit Apartments | 87 | 6.0% |
| 10 or more Apartments | 97 | 6.7% |
| Mobile Home / Other | 738 | 51.3% |
| Total | 1,439 | 100.0% |
Housing Structures by Occupancy in Fox Farm College
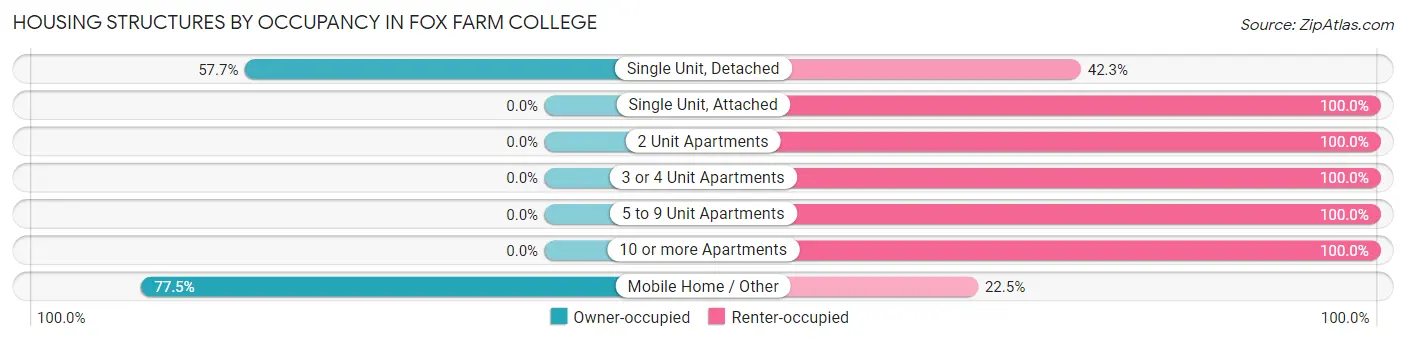
| Structure Type | Owner-occupied | Renter-occupied |
| Single Unit, Detached | 247 (57.7%) | 181 (42.3%) |
| Single Unit, Attached | 0 (0.0%) | 10 (100.0%) |
| 2 Unit Apartments | 0 (0.0%) | 11 (100.0%) |
| 3 or 4 Unit Apartments | 0 (0.0%) | 68 (100.0%) |
| 5 to 9 Unit Apartments | 0 (0.0%) | 87 (100.0%) |
| 10 or more Apartments | 0 (0.0%) | 97 (100.0%) |
| Mobile Home / Other | 572 (77.5%) | 166 (22.5%) |
| Total | 819 (56.9%) | 620 (43.1%) |
Housing Structures by Number of Rooms in Fox Farm College
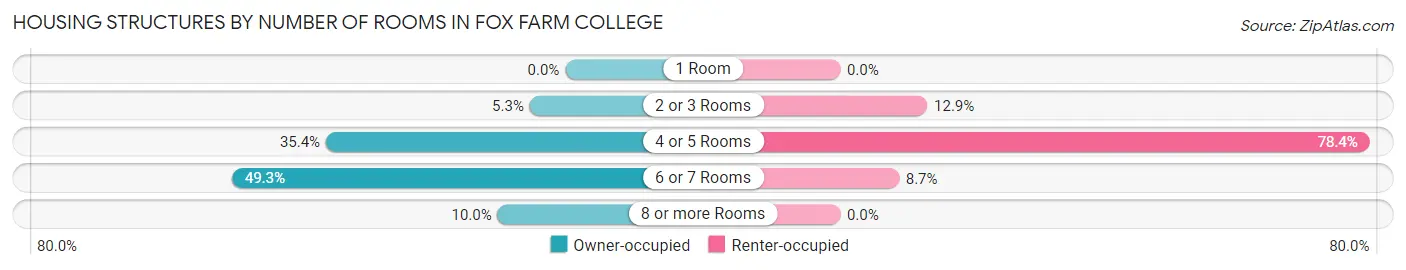
| Number of Rooms | Owner-occupied | Renter-occupied |
| 1 Room | 0 (0.0%) | 0 (0.0%) |
| 2 or 3 Rooms | 43 (5.2%) | 80 (12.9%) |
| 4 or 5 Rooms | 290 (35.4%) | 486 (78.4%) |
| 6 or 7 Rooms | 404 (49.3%) | 54 (8.7%) |
| 8 or more Rooms | 82 (10.0%) | 0 (0.0%) |
| Total | 819 (100.0%) | 620 (100.0%) |
Housing Structure by Heating Type in Fox Farm College

| Heating Type | Owner-occupied | Renter-occupied |
| Utility Gas | 733 (89.5%) | 412 (66.4%) |
| Bottled, Tank, or LP Gas | 20 (2.4%) | 0 (0.0%) |
| Electricity | 65 (7.9%) | 208 (33.6%) |
| Fuel Oil or Kerosene | 0 (0.0%) | 0 (0.0%) |
| Coal or Coke | 0 (0.0%) | 0 (0.0%) |
| All other Fuels | 1 (0.1%) | 0 (0.0%) |
| No Fuel Used | 0 (0.0%) | 0 (0.0%) |
| Total | 819 (100.0%) | 620 (100.0%) |
Household Vehicle Usage in Fox Farm College
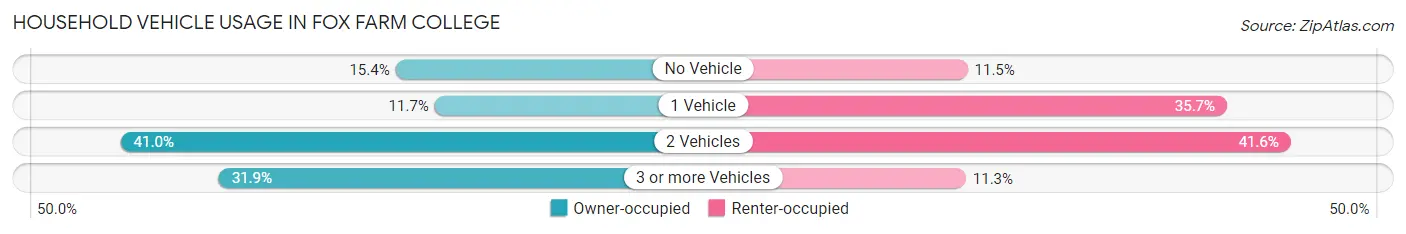
| Vehicles per Household | Owner-occupied | Renter-occupied |
| No Vehicle | 126 (15.4%) | 71 (11.5%) |
| 1 Vehicle | 96 (11.7%) | 221 (35.6%) |
| 2 Vehicles | 336 (41.0%) | 258 (41.6%) |
| 3 or more Vehicles | 261 (31.9%) | 70 (11.3%) |
| Total | 819 (100.0%) | 620 (100.0%) |
Real Estate & Mortgages in Fox Farm College
Real Estate and Mortgage Overview in Fox Farm College
| Characteristic | Without Mortgage | With Mortgage |
| Housing Units | 595 | 224 |
| Median Property Value | $20,300 | $235,800 |
| Median Household Income | $52,557 | $91 |
| Monthly Housing Costs | $526 | $0 |
| Real Estate Taxes | $268 | $0 |
Property Value by Mortgage Status in Fox Farm College
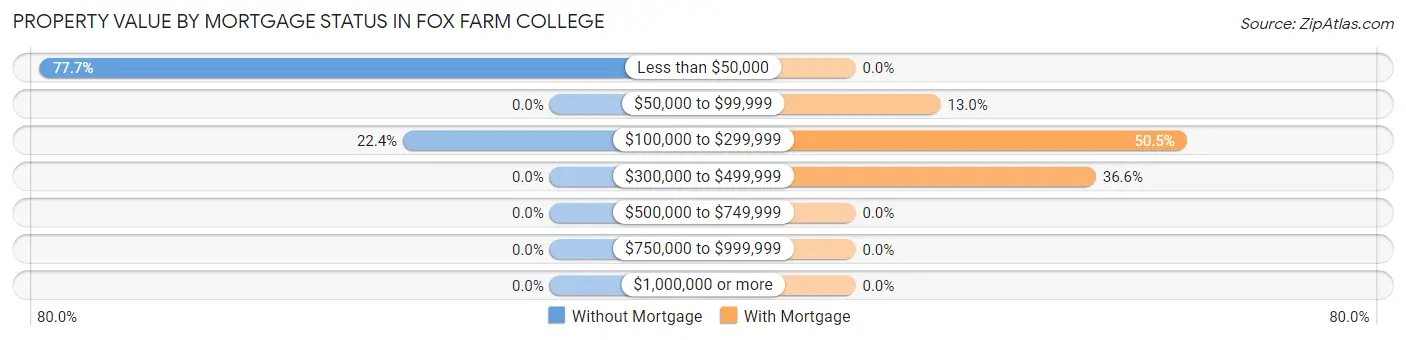
| Property Value | Without Mortgage | With Mortgage |
| Less than $50,000 | 462 (77.6%) | 0 (0.0%) |
| $50,000 to $99,999 | 0 (0.0%) | 29 (13.0%) |
| $100,000 to $299,999 | 133 (22.4%) | 113 (50.4%) |
| $300,000 to $499,999 | 0 (0.0%) | 82 (36.6%) |
| $500,000 to $749,999 | 0 (0.0%) | 0 (0.0%) |
| $750,000 to $999,999 | 0 (0.0%) | 0 (0.0%) |
| $1,000,000 or more | 0 (0.0%) | 0 (0.0%) |
| Total | 595 (100.0%) | 224 (100.0%) |
Household Income by Mortgage Status in Fox Farm College
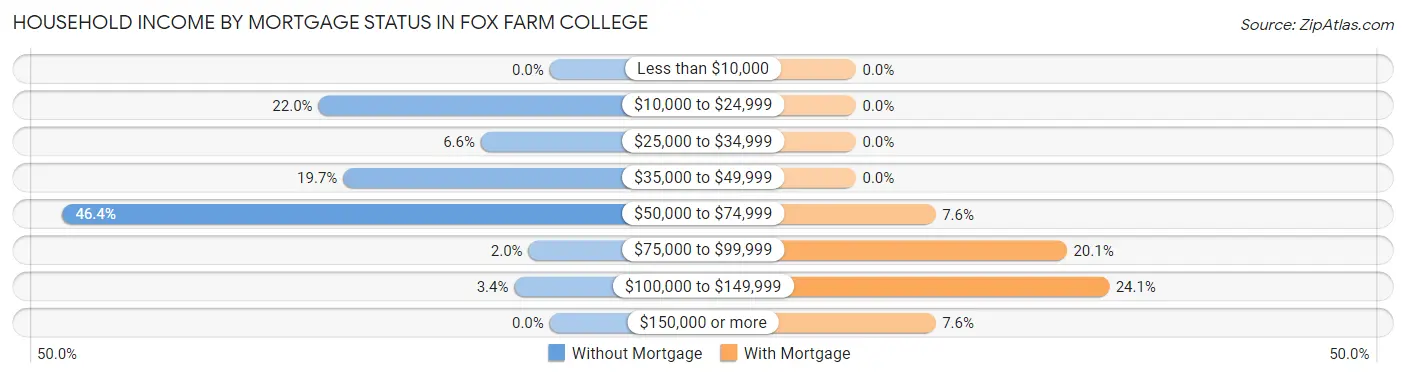
| Household Income | Without Mortgage | With Mortgage |
| Less than $10,000 | 0 (0.0%) | 0 (0.0%) |
| $10,000 to $24,999 | 131 (22.0%) | 0 (0.0%) |
| $25,000 to $34,999 | 39 (6.6%) | 0 (0.0%) |
| $35,000 to $49,999 | 117 (19.7%) | 0 (0.0%) |
| $50,000 to $74,999 | 276 (46.4%) | 17 (7.6%) |
| $75,000 to $99,999 | 12 (2.0%) | 45 (20.1%) |
| $100,000 to $149,999 | 20 (3.4%) | 54 (24.1%) |
| $150,000 or more | 0 (0.0%) | 17 (7.6%) |
| Total | 595 (100.0%) | 224 (100.0%) |
Property Value to Household Income Ratio in Fox Farm College
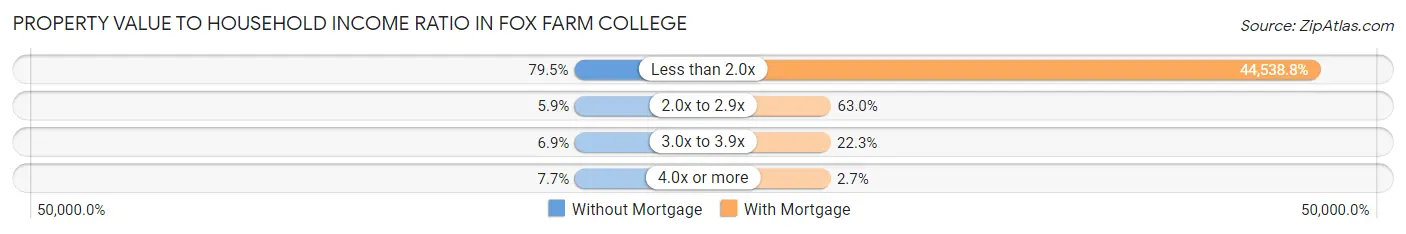
| Value-to-Income Ratio | Without Mortgage | With Mortgage |
| Less than 2.0x | 473 (79.5%) | 99,767 (44,538.8%) |
| 2.0x to 2.9x | 35 (5.9%) | 141 (62.9%) |
| 3.0x to 3.9x | 41 (6.9%) | 50 (22.3%) |
| 4.0x or more | 46 (7.7%) | 6 (2.7%) |
| Total | 595 (100.0%) | 224 (100.0%) |
Real Estate Taxes by Mortgage Status in Fox Farm College
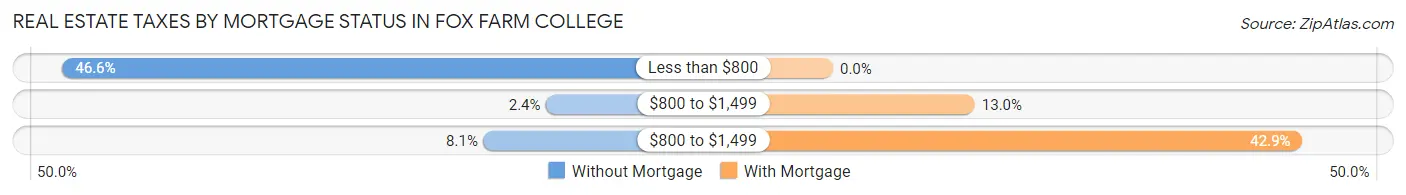
| Property Taxes | Without Mortgage | With Mortgage |
| Less than $800 | 277 (46.6%) | 0 (0.0%) |
| $800 to $1,499 | 14 (2.4%) | 29 (13.0%) |
| $800 to $1,499 | 48 (8.1%) | 96 (42.9%) |
| Total | 595 (100.0%) | 224 (100.0%) |
Health & Disability in Fox Farm College
Health Insurance Coverage by Age in Fox Farm College
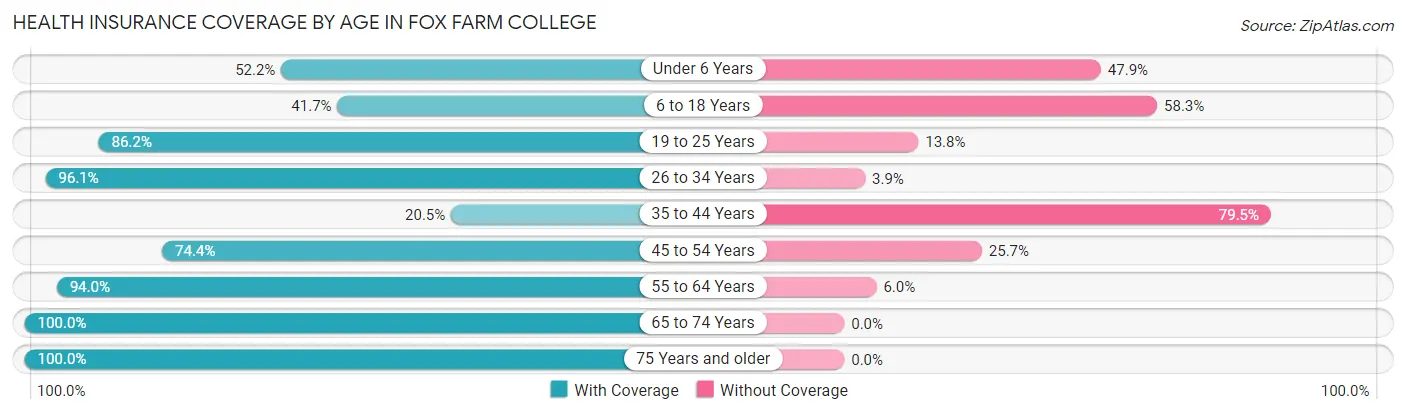
| Age Bracket | With Coverage | Without Coverage |
| Under 6 Years | 158 (52.1%) | 145 (47.8%) |
| 6 to 18 Years | 385 (41.7%) | 539 (58.3%) |
| 19 to 25 Years | 506 (86.2%) | 81 (13.8%) |
| 26 to 34 Years | 545 (96.1%) | 22 (3.9%) |
| 35 to 44 Years | 89 (20.5%) | 346 (79.5%) |
| 45 to 54 Years | 432 (74.4%) | 149 (25.7%) |
| 55 to 64 Years | 376 (94.0%) | 24 (6.0%) |
| 65 to 74 Years | 241 (100.0%) | 0 (0.0%) |
| 75 Years and older | 188 (100.0%) | 0 (0.0%) |
| Total | 2,920 (69.1%) | 1,306 (30.9%) |
Health Insurance Coverage by Citizenship Status in Fox Farm College
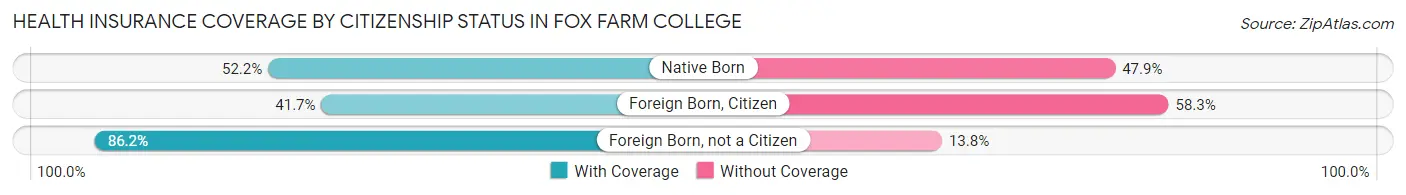
| Citizenship Status | With Coverage | Without Coverage |
| Native Born | 158 (52.1%) | 145 (47.8%) |
| Foreign Born, Citizen | 385 (41.7%) | 539 (58.3%) |
| Foreign Born, not a Citizen | 506 (86.2%) | 81 (13.8%) |
Health Insurance Coverage by Household Income in Fox Farm College
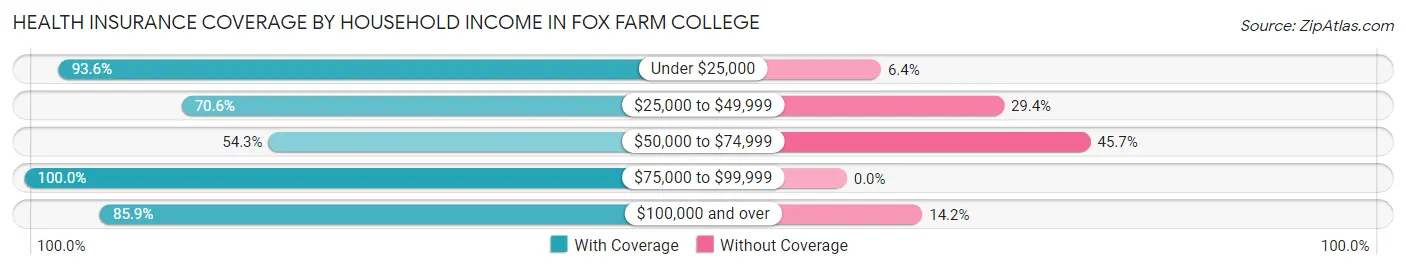
| Household Income | With Coverage | Without Coverage |
| Under $25,000 | 351 (93.6%) | 24 (6.4%) |
| $25,000 to $49,999 | 592 (70.6%) | 247 (29.4%) |
| $50,000 to $74,999 | 1,097 (54.3%) | 922 (45.7%) |
| $75,000 to $99,999 | 154 (100.0%) | 0 (0.0%) |
| $100,000 and over | 528 (85.9%) | 87 (14.1%) |
Public vs Private Health Insurance Coverage by Age in Fox Farm College
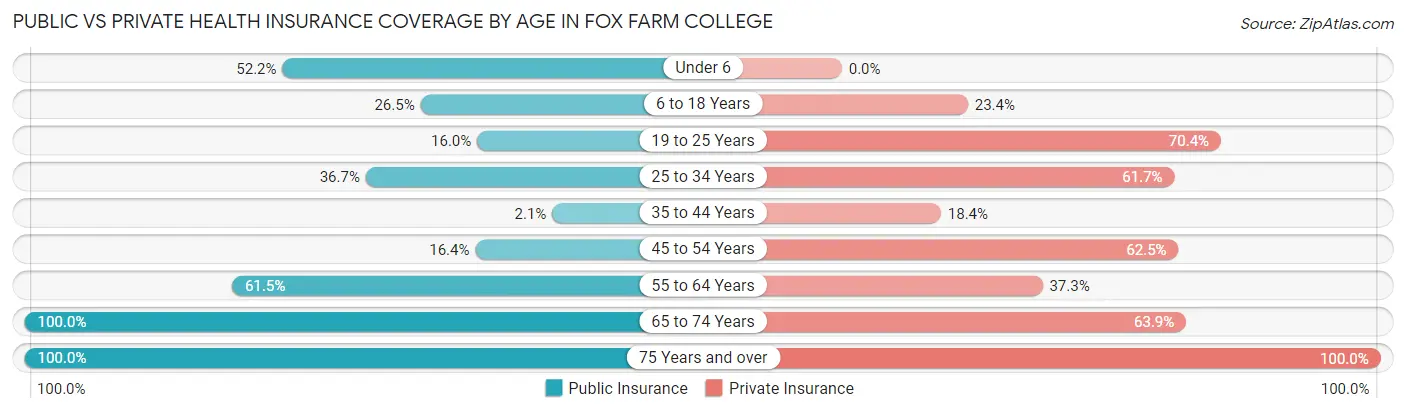
| Age Bracket | Public Insurance | Private Insurance |
| Under 6 | 158 (52.1%) | 0 (0.0%) |
| 6 to 18 Years | 245 (26.5%) | 216 (23.4%) |
| 19 to 25 Years | 94 (16.0%) | 413 (70.4%) |
| 25 to 34 Years | 208 (36.7%) | 350 (61.7%) |
| 35 to 44 Years | 9 (2.1%) | 80 (18.4%) |
| 45 to 54 Years | 95 (16.4%) | 363 (62.5%) |
| 55 to 64 Years | 246 (61.5%) | 149 (37.2%) |
| 65 to 74 Years | 241 (100.0%) | 154 (63.9%) |
| 75 Years and over | 188 (100.0%) | 188 (100.0%) |
| Total | 1,484 (35.1%) | 1,913 (45.3%) |
Disability Status by Sex by Age in Fox Farm College
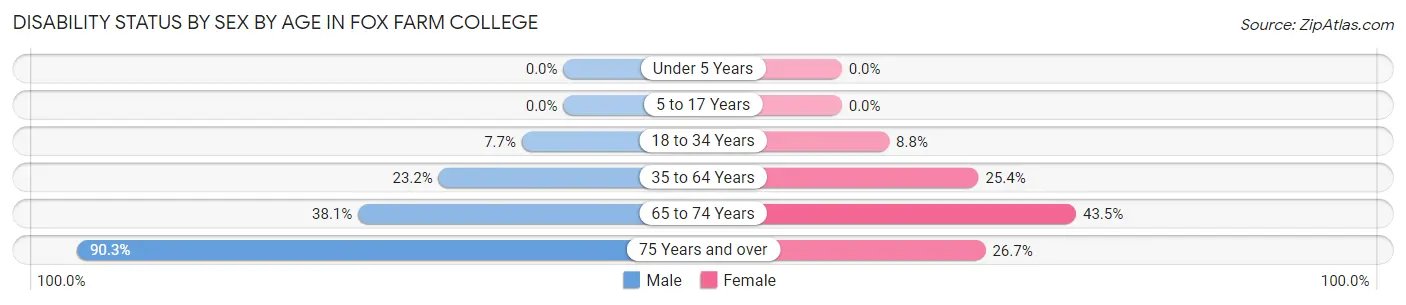
| Age Bracket | Male | Female |
| Under 5 Years | 0 (0.0%) | 0 (0.0%) |
| 5 to 17 Years | 0 (0.0%) | 0 (0.0%) |
| 18 to 34 Years | 56 (7.7%) | 54 (8.8%) |
| 35 to 64 Years | 161 (23.2%) | 183 (25.4%) |
| 65 to 74 Years | 48 (38.1%) | 50 (43.5%) |
| 75 Years and over | 102 (90.3%) | 20 (26.7%) |
Disability Class by Sex by Age in Fox Farm College
Disability Class: Hearing Difficulty
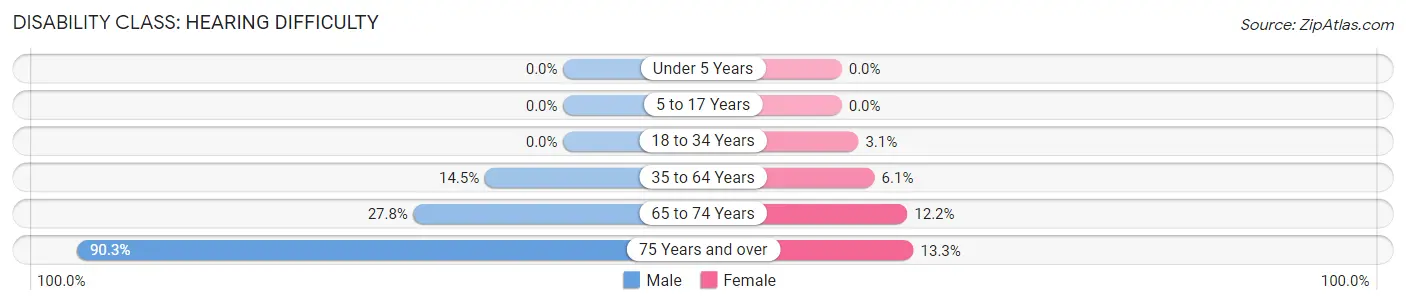
| Age Bracket | Male | Female |
| Under 5 Years | 0 (0.0%) | 0 (0.0%) |
| 5 to 17 Years | 0 (0.0%) | 0 (0.0%) |
| 18 to 34 Years | 0 (0.0%) | 19 (3.1%) |
| 35 to 64 Years | 101 (14.5%) | 44 (6.1%) |
| 65 to 74 Years | 35 (27.8%) | 14 (12.2%) |
| 75 Years and over | 102 (90.3%) | 10 (13.3%) |
Disability Class: Vision Difficulty
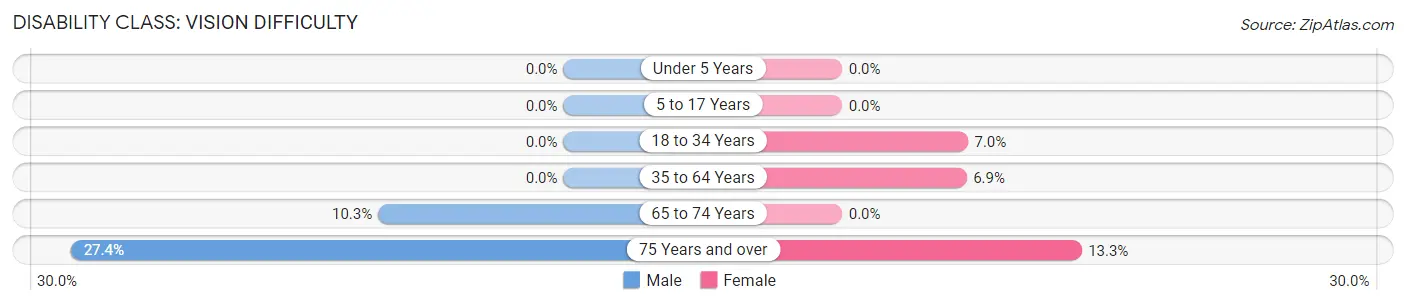
| Age Bracket | Male | Female |
| Under 5 Years | 0 (0.0%) | 0 (0.0%) |
| 5 to 17 Years | 0 (0.0%) | 0 (0.0%) |
| 18 to 34 Years | 0 (0.0%) | 43 (7.0%) |
| 35 to 64 Years | 0 (0.0%) | 50 (6.9%) |
| 65 to 74 Years | 13 (10.3%) | 0 (0.0%) |
| 75 Years and over | 31 (27.4%) | 10 (13.3%) |
Disability Class: Cognitive Difficulty
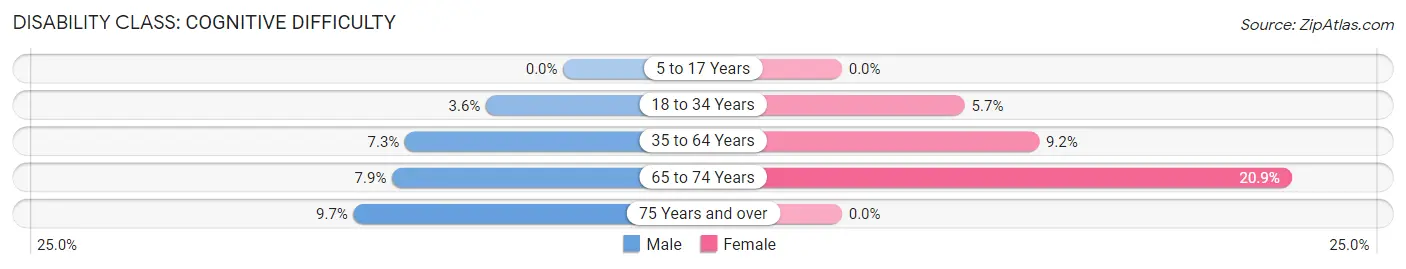
| Age Bracket | Male | Female |
| 5 to 17 Years | 0 (0.0%) | 0 (0.0%) |
| 18 to 34 Years | 26 (3.6%) | 35 (5.7%) |
| 35 to 64 Years | 51 (7.3%) | 66 (9.1%) |
| 65 to 74 Years | 10 (7.9%) | 24 (20.9%) |
| 75 Years and over | 11 (9.7%) | 0 (0.0%) |
Disability Class: Ambulatory Difficulty
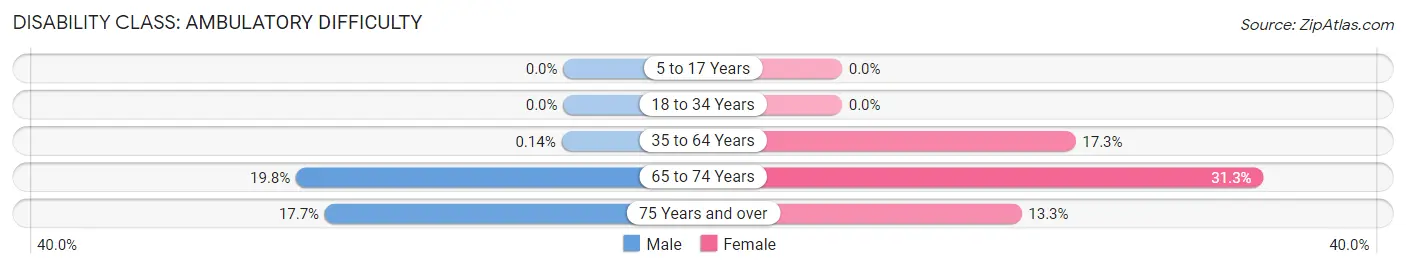
| Age Bracket | Male | Female |
| 5 to 17 Years | 0 (0.0%) | 0 (0.0%) |
| 18 to 34 Years | 0 (0.0%) | 0 (0.0%) |
| 35 to 64 Years | 1 (0.1%) | 125 (17.3%) |
| 65 to 74 Years | 25 (19.8%) | 36 (31.3%) |
| 75 Years and over | 20 (17.7%) | 10 (13.3%) |
Disability Class: Self-Care Difficulty
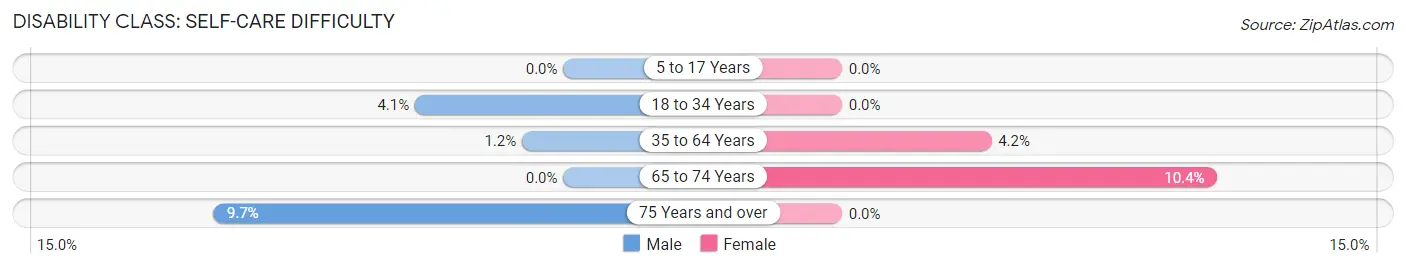
| Age Bracket | Male | Female |
| 5 to 17 Years | 0 (0.0%) | 0 (0.0%) |
| 18 to 34 Years | 30 (4.1%) | 0 (0.0%) |
| 35 to 64 Years | 8 (1.1%) | 30 (4.2%) |
| 65 to 74 Years | 0 (0.0%) | 12 (10.4%) |
| 75 Years and over | 11 (9.7%) | 0 (0.0%) |
Technology Access in Fox Farm College
Computing Device Access in Fox Farm College
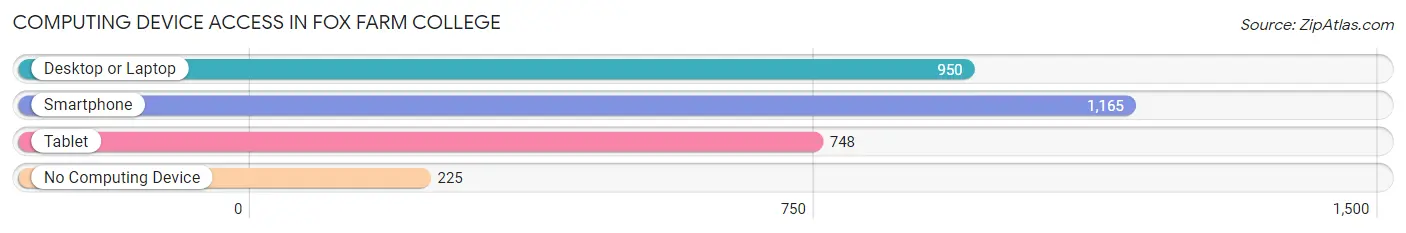
| Device Type | # Households | % Households |
| Desktop or Laptop | 950 | 66.0% |
| Smartphone | 1,165 | 81.0% |
| Tablet | 748 | 52.0% |
| No Computing Device | 225 | 15.6% |
| Total | 1,439 | 100.0% |
Internet Access in Fox Farm College
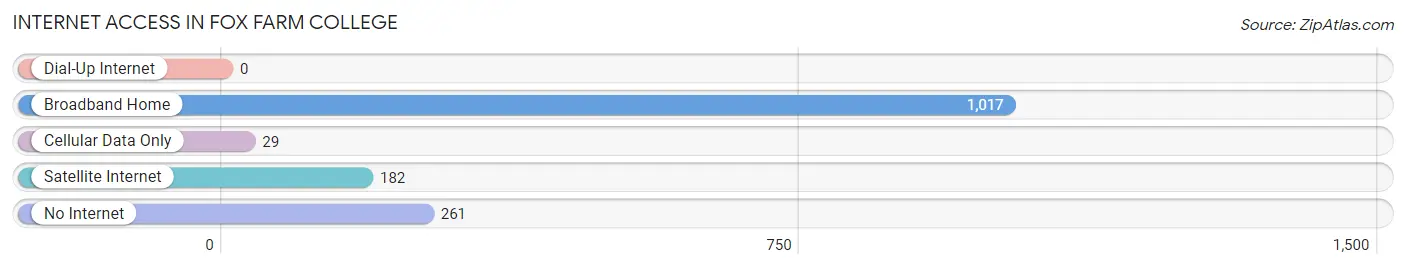
| Internet Type | # Households | % Households |
| Dial-Up Internet | 0 | 0.0% |
| Broadband Home | 1,017 | 70.7% |
| Cellular Data Only | 29 | 2.0% |
| Satellite Internet | 182 | 12.7% |
| No Internet | 261 | 18.1% |
| Total | 1,439 | 100.0% |
Fox Farm College Summary
History
Fox Farm College is a small college located in Wyoming, United States. It was founded in 1887 by a group of local ranchers and farmers who wanted to provide educational opportunities for their children. The college was originally named Fox Farm Institute, and it was the first college in Wyoming to offer a four-year degree program.
The college was founded on the principles of hard work, self-reliance, and a commitment to the land. The founders wanted to create an educational institution that would provide a quality education to the people of Wyoming and the surrounding area.
The college has a long and proud history of providing educational opportunities to the people of Wyoming. In the early years, the college offered courses in agriculture, animal husbandry, and home economics. As the college grew, it began to offer more courses in the sciences, humanities, and business.
In the late 1960s, the college began to expand its offerings to include more liberal arts courses. This expansion allowed the college to attract more students from outside of Wyoming. Today, Fox Farm College offers a wide range of degree programs, including bachelor's, master's, and doctoral degrees.
Geography
Fox Farm College is located in the small town of Fox Farm, Wyoming. The town is situated in the foothills of the Rocky Mountains, and it is surrounded by rolling hills and open plains. The college is located on the banks of the Fox River, which is a tributary of the Snake River.
The college is located in a rural area, and the surrounding area is mostly agricultural. The town of Fox Farm is home to a few small businesses, including a grocery store, a hardware store, and a few restaurants.
Economy
The economy of Fox Farm is largely based on agriculture. The town is home to several large farms, and the surrounding area is mostly agricultural. The college also has a small farm that provides food for the students and faculty.
The college also provides jobs for the local community. The college employs faculty and staff, and it also provides jobs for students who work on campus.
Demographics
As of the 2010 census, the population of Fox Farm was 1,845. The population is mostly white (94.3%), with a small percentage of African Americans (2.2%), Native Americans (1.2%), and Asians (1.1%). The median household income in Fox Farm is $45,000, and the median age is 37.
Conclusion
Fox Farm College is a small college located in Wyoming, United States. It was founded in 1887 by a group of local ranchers and farmers who wanted to provide educational opportunities for their children. The college is located in a rural area, and the surrounding area is mostly agricultural. The college has a long and proud history of providing educational opportunities to the people of Wyoming. The college also provides jobs for the local community, and it has a small farm that provides food for the students and faculty. As of the 2010 census, the population of Fox Farm was 1,845, and the median household income is $45,000.
Common Questions
What is Per Capita Income in Fox Farm College?
Per Capita income in Fox Farm College is $25,647.
What is the Median Family Income in Fox Farm College?
Median Family Income in Fox Farm College is $50,872.
What is the Median Household income in Fox Farm College?
Median Household Income in Fox Farm College is $53,486.
What is Income or Wage Gap in Fox Farm College?
Income or Wage Gap in Fox Farm College is 2.4%.
Women in Fox Farm College earn 97.6 cents for every dollar earned by a man.
What is Inequality or Gini Index in Fox Farm College?
Inequality or Gini Index in Fox Farm College is 0.49.
What is the Total Population of Fox Farm College?
Total Population of Fox Farm College is 4,226.
What is the Total Male Population of Fox Farm College?
Total Male Population of Fox Farm College is 2,287.
What is the Total Female Population of Fox Farm College?
Total Female Population of Fox Farm College is 1,939.
What is the Ratio of Males per 100 Females in Fox Farm College?
There are 117.95 Males per 100 Females in Fox Farm College.
What is the Ratio of Females per 100 Males in Fox Farm College?
There are 84.78 Females per 100 Males in Fox Farm College.
What is the Median Population Age in Fox Farm College?
Median Population Age in Fox Farm College is 29.5 Years.
What is the Average Family Size in Fox Farm College
Average Family Size in Fox Farm College is 3.0 People.
What is the Average Household Size in Fox Farm College
Average Household Size in Fox Farm College is 2.8 People.
How Large is the Labor Force in Fox Farm College?
There are 2,026 People in the Labor Forcein in Fox Farm College.
What is the Percentage of People in the Labor Force in Fox Farm College?
63.6% of People are in the Labor Force in Fox Farm College.
What is the Unemployment Rate in Fox Farm College?
Unemployment Rate in Fox Farm College is 1.9%.