James Town, WY Map & Demographics
James Town Map
James Town Overview
$54,342
PER CAPITA INCOME
$110,688
AVG HOUSEHOLD INCOME
58.2%
WAGE / INCOME GAP [ % ]
41.8¢/ $1
WAGE / INCOME GAP [ $ ]
0.27
INEQUALITY / GINI INDEX
508
TOTAL POPULATION
249
MALE POPULATION
259
FEMALE POPULATION
96.14
MALES / 100 FEMALES
104.02
FEMALES / 100 MALES
49.0
MEDIAN AGE
3.0
AVG FAMILY SIZE
2.8
AVG HOUSEHOLD SIZE
267
LABOR FORCE [ PEOPLE ]
59.5%
PERCENT IN LABOR FORCE
Income in James Town
Income Overview in James Town
| Characteristic | Number | Measure |
| Per Capita Income | 508 | $54,342 |
| Median Family Income | 160 | $0 |
| Mean Family Income | 160 | $144,153 |
| Median Household Income | 181 | $110,688 |
| Mean Household Income | 181 | $135,148 |
| Income Deficit | 160 | $0 |
| Wage / Income Gap (%) | 508 | 58.17% |
| Wage / Income Gap ($) | 508 | 41.83¢ per $1 |
| Gini / Inequality Index | 508 | 0.27 |
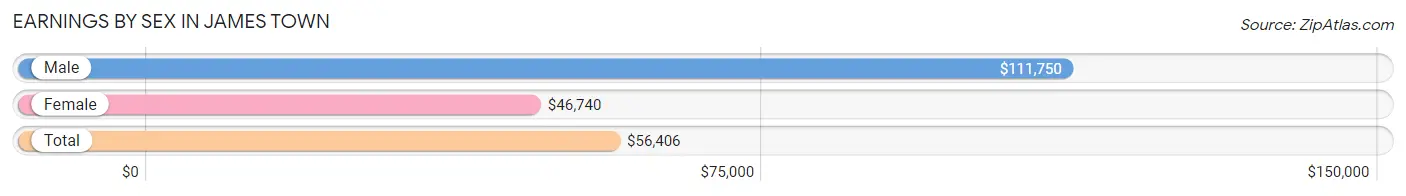
Earnings by Sex in James Town
Average Earnings in James Town are $56,406, $111,750 for men and $46,740 for women, a difference of 58.2%.
| Sex | Number | Average Earnings |
| Male | 148 (54.6%) | $111,750 |
| Female | 123 (45.4%) | $46,740 |
| Total | 271 (100.0%) | $56,406 |
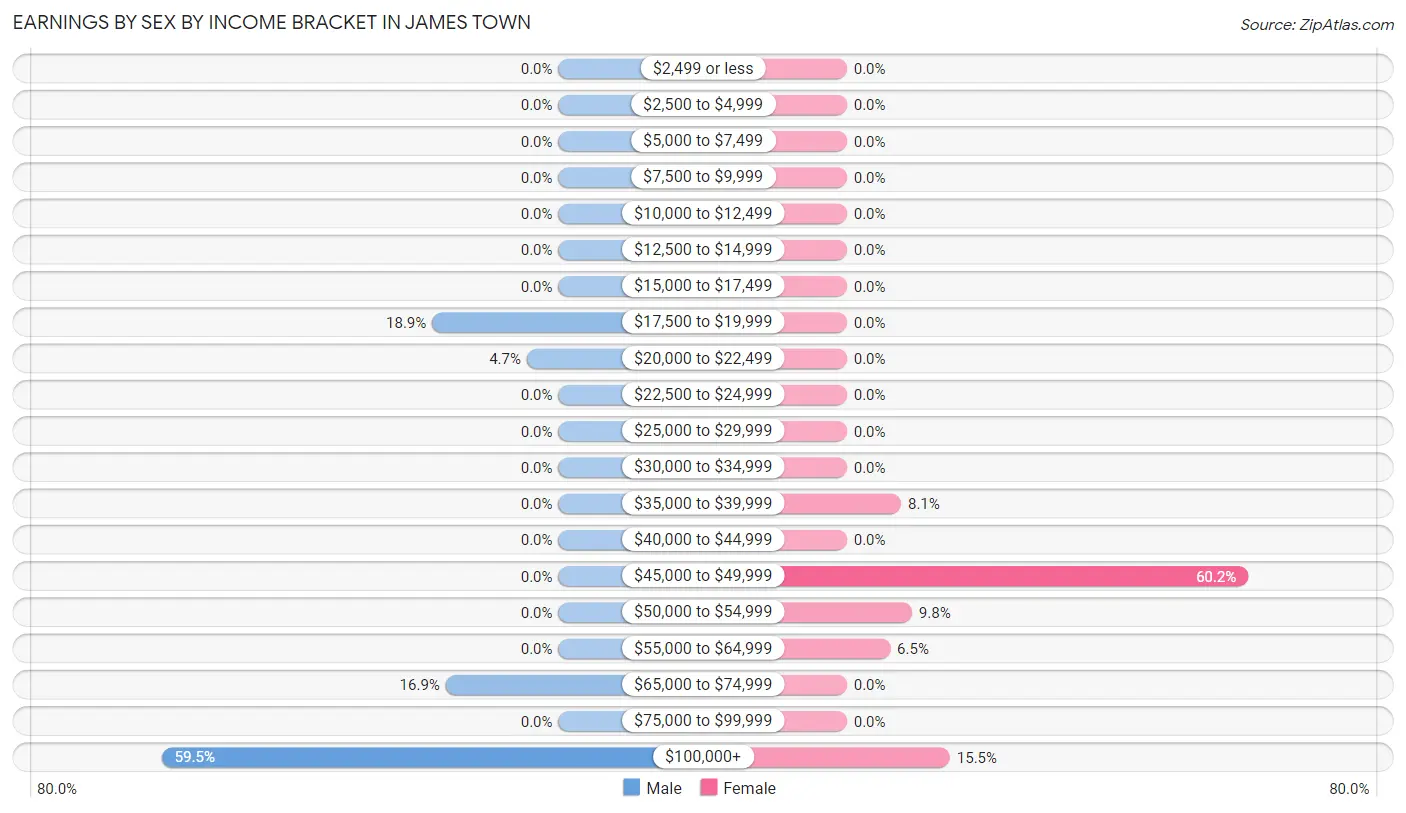
Earnings by Sex by Income Bracket in James Town
The most common earnings brackets in James Town are $100,000+ for men (88 | 59.5%) and $45,000 to $49,999 for women (74 | 60.2%).
| Income | Male | Female |
| $2,499 or less | 0 (0.0%) | 0 (0.0%) |
| $2,500 to $4,999 | 0 (0.0%) | 0 (0.0%) |
| $5,000 to $7,499 | 0 (0.0%) | 0 (0.0%) |
| $7,500 to $9,999 | 0 (0.0%) | 0 (0.0%) |
| $10,000 to $12,499 | 0 (0.0%) | 0 (0.0%) |
| $12,500 to $14,999 | 0 (0.0%) | 0 (0.0%) |
| $15,000 to $17,499 | 0 (0.0%) | 0 (0.0%) |
| $17,500 to $19,999 | 28 (18.9%) | 0 (0.0%) |
| $20,000 to $22,499 | 7 (4.7%) | 0 (0.0%) |
| $22,500 to $24,999 | 0 (0.0%) | 0 (0.0%) |
| $25,000 to $29,999 | 0 (0.0%) | 0 (0.0%) |
| $30,000 to $34,999 | 0 (0.0%) | 0 (0.0%) |
| $35,000 to $39,999 | 0 (0.0%) | 10 (8.1%) |
| $40,000 to $44,999 | 0 (0.0%) | 0 (0.0%) |
| $45,000 to $49,999 | 0 (0.0%) | 74 (60.2%) |
| $50,000 to $54,999 | 0 (0.0%) | 12 (9.8%) |
| $55,000 to $64,999 | 0 (0.0%) | 8 (6.5%) |
| $65,000 to $74,999 | 25 (16.9%) | 0 (0.0%) |
| $75,000 to $99,999 | 0 (0.0%) | 0 (0.0%) |
| $100,000+ | 88 (59.5%) | 19 (15.4%) |
| Total | 148 (100.0%) | 123 (100.0%) |
Earnings by Sex by Educational Attainment in James Town
| Educational Attainment | Male Income | Female Income |
| Less than High School | - | - |
| High School Diploma | - | - |
| College or Associate's Degree | - | - |
| Bachelor's Degree | - | - |
| Graduate Degree | - | - |
| Total | - | - |
Family Income in James Town
Family Income Brackets in James Town
According to the James Town family income data, there are 57 families falling into the $200,000+ income range, which is the most common income bracket and makes up 35.6% of all families.
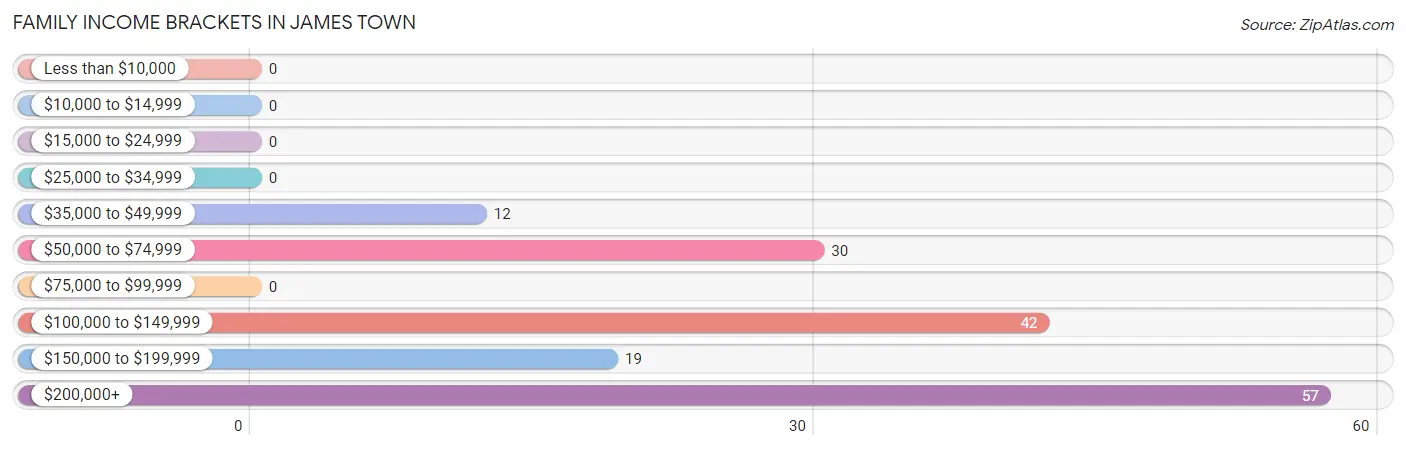
| Income Bracket | # Families | % Families |
| Less than $10,000 | 0 | 0.0% |
| $10,000 to $14,999 | 0 | 0.0% |
| $15,000 to $24,999 | 0 | 0.0% |
| $25,000 to $34,999 | 0 | 0.0% |
| $35,000 to $49,999 | 12 | 7.5% |
| $50,000 to $74,999 | 30 | 18.8% |
| $75,000 to $99,999 | 0 | 0.0% |
| $100,000 to $149,999 | 42 | 26.3% |
| $150,000 to $199,999 | 19 | 11.9% |
| $200,000+ | 57 | 35.6% |
Family Income by Famaliy Size in James Town
3-person families (89 | 55.6%) account for the highest median family income in James Town with $215,028 per family, while 3-person families (89 | 55.6%) have the highest median income of $71,676 per family member.
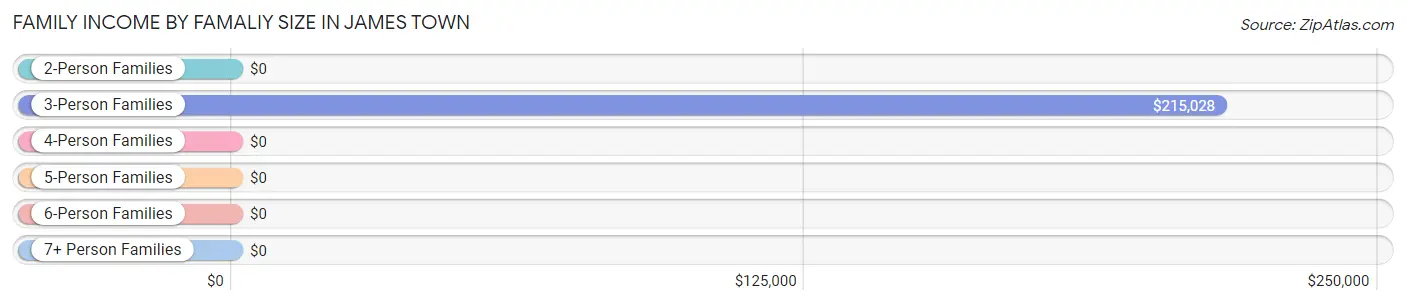
| Income Bracket | # Families | Median Income |
| 2-Person Families | 71 (44.4%) | $0 |
| 3-Person Families | 89 (55.6%) | $215,028 |
| 4-Person Families | 0 (0.0%) | $0 |
| 5-Person Families | 0 (0.0%) | $0 |
| 6-Person Families | 0 (0.0%) | $0 |
| 7+ Person Families | 0 (0.0%) | $0 |
| Total | 160 (100.0%) | $0 |
Family Income by Number of Earners in James Town
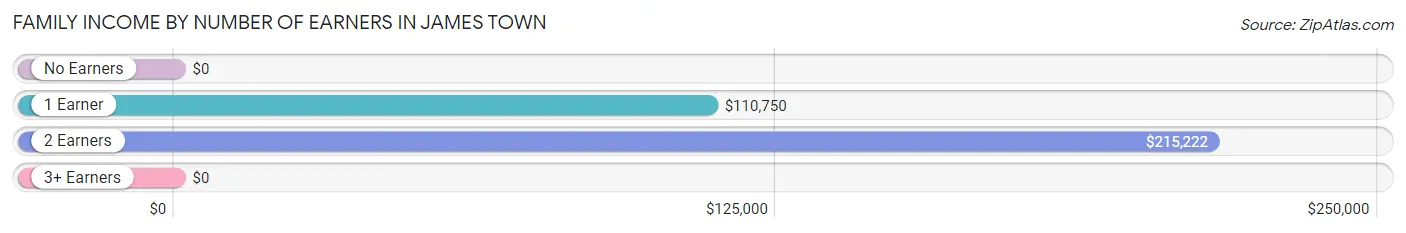
| Number of Earners | # Families | Median Income |
| No Earners | 42 (26.3%) | $0 |
| 1 Earner | 36 (22.5%) | $110,750 |
| 2 Earners | 82 (51.2%) | $215,222 |
| 3+ Earners | 0 (0.0%) | $0 |
| Total | 160 (100.0%) | $0 |
Household Income in James Town
Household Income Brackets in James Town
With 57 households falling in the category, the $200,000+ income range is the most frequent in James Town, accounting for 31.5% of all households.
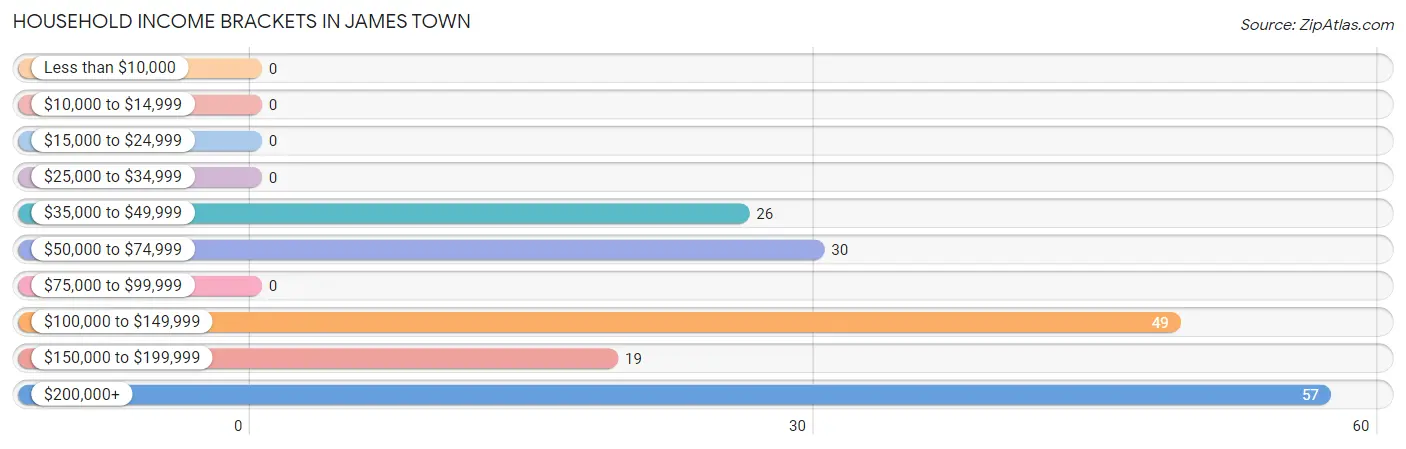
| Income Bracket | # Households | % Households |
| Less than $10,000 | 0 | 0.0% |
| $10,000 to $14,999 | 0 | 0.0% |
| $15,000 to $24,999 | 0 | 0.0% |
| $25,000 to $34,999 | 0 | 0.0% |
| $35,000 to $49,999 | 26 | 14.4% |
| $50,000 to $74,999 | 30 | 16.6% |
| $75,000 to $99,999 | 0 | 0.0% |
| $100,000 to $149,999 | 49 | 27.1% |
| $150,000 to $199,999 | 19 | 10.5% |
| $200,000+ | 57 | 31.5% |
Household Income by Householder Age in James Town
The median household income in James Town is $110,688, with the highest median household income of $168,750 found in the 45 to 64 years age bracket for the primary householder. A total of 58 households (32.0%) fall into this category. Meanwhile, the 15 to 24 years age bracket for the primary householder has the lowest median household income of $0, with 10 households (5.5%) in this group.
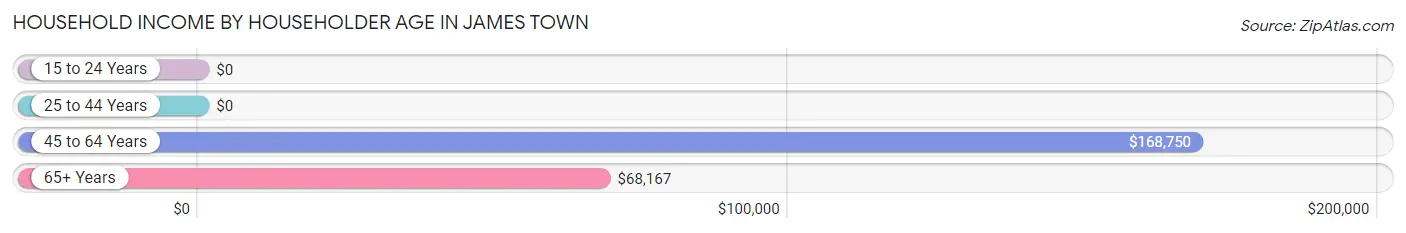
| Income Bracket | # Households | Median Income |
| 15 to 24 Years | 10 (5.5%) | $0 |
| 25 to 44 Years | 45 (24.9%) | $0 |
| 45 to 64 Years | 58 (32.0%) | $168,750 |
| 65+ Years | 68 (37.6%) | $68,167 |
| Total | 181 (100.0%) | $110,688 |
Poverty in James Town
Income Below Poverty by Sex and Age in James Town
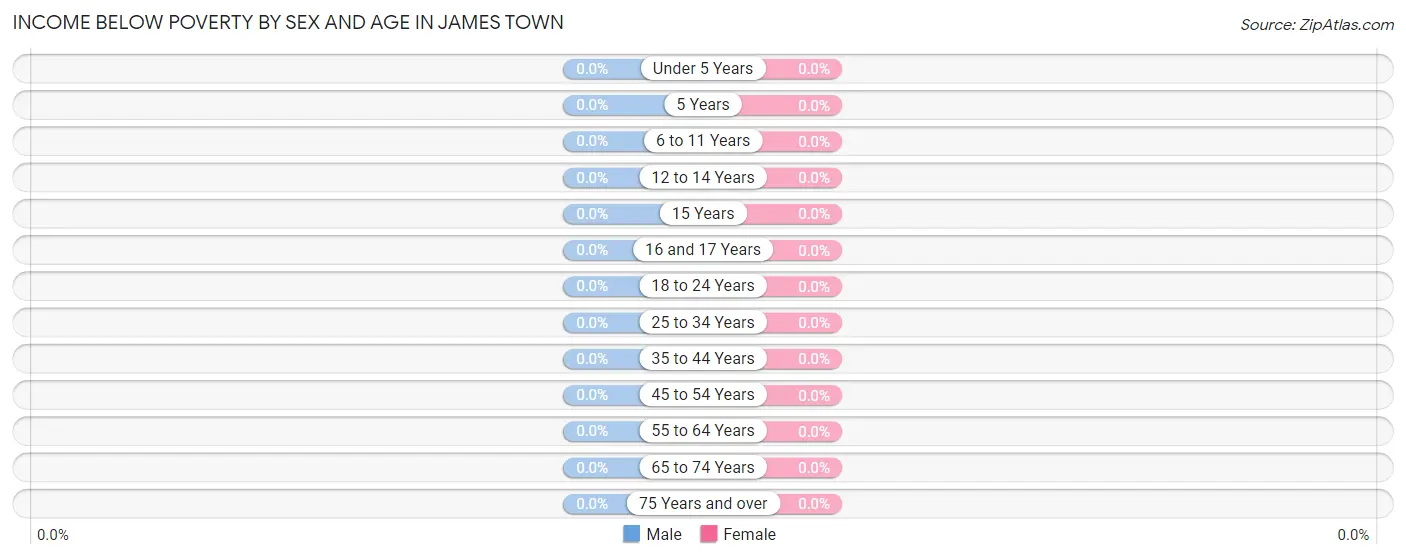
| Age Bracket | Male | Female |
| Under 5 Years | 0 (0.0%) | 0 (0.0%) |
| 5 Years | 0 (0.0%) | 0 (0.0%) |
| 6 to 11 Years | 0 (0.0%) | 0 (0.0%) |
| 12 to 14 Years | 0 (0.0%) | 0 (0.0%) |
| 15 Years | 0 (0.0%) | 0 (0.0%) |
| 16 and 17 Years | 0 (0.0%) | 0 (0.0%) |
| 18 to 24 Years | 0 (0.0%) | 0 (0.0%) |
| 25 to 34 Years | 0 (0.0%) | 0 (0.0%) |
| 35 to 44 Years | 0 (0.0%) | 0 (0.0%) |
| 45 to 54 Years | 0 (0.0%) | 0 (0.0%) |
| 55 to 64 Years | 0 (0.0%) | 0 (0.0%) |
| 65 to 74 Years | 0 (0.0%) | 0 (0.0%) |
| 75 Years and over | 0 (0.0%) | 0 (0.0%) |
| Total | 0 (0.0%) | 0 (0.0%) |
Income Above Poverty by Sex and Age in James Town
According to the poverty statistics in James Town, males aged 18 to 24 years and females aged 5 years are the age groups that are most secure financially, with 100.0% of males and 100.0% of females in these age groups living above the poverty line.
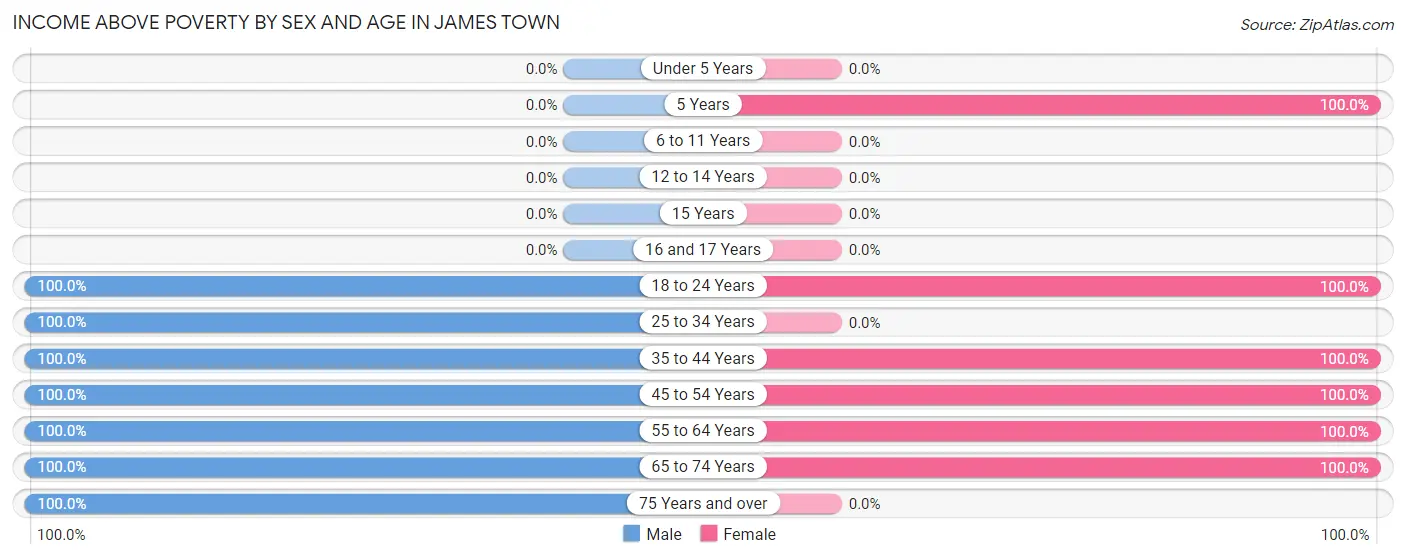
| Age Bracket | Male | Female |
| Under 5 Years | 0 (0.0%) | 0 (0.0%) |
| 5 Years | 0 (0.0%) | 59 (100.0%) |
| 6 to 11 Years | 0 (0.0%) | 0 (0.0%) |
| 12 to 14 Years | 0 (0.0%) | 0 (0.0%) |
| 15 Years | 0 (0.0%) | 0 (0.0%) |
| 16 and 17 Years | 0 (0.0%) | 0 (0.0%) |
| 18 to 24 Years | 38 (100.0%) | 10 (100.0%) |
| 25 to 34 Years | 12 (100.0%) | 0 (0.0%) |
| 35 to 44 Years | 45 (100.0%) | 74 (100.0%) |
| 45 to 54 Years | 61 (100.0%) | 36 (100.0%) |
| 55 to 64 Years | 13 (100.0%) | 24 (100.0%) |
| 65 to 74 Years | 27 (100.0%) | 56 (100.0%) |
| 75 Years and over | 53 (100.0%) | 0 (0.0%) |
| Total | 249 (100.0%) | 259 (100.0%) |
Income Below Poverty Among Married-Couple Families in James Town
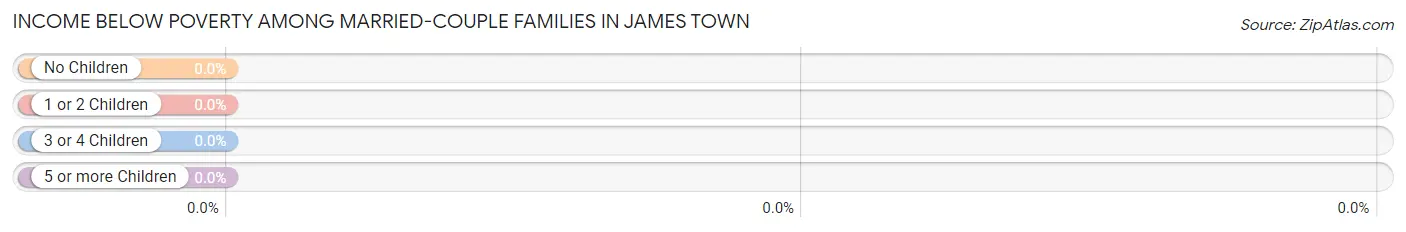
| Children | Above Poverty | Below Poverty |
| No Children | 115 (100.0%) | 0 (0.0%) |
| 1 or 2 Children | 45 (100.0%) | 0 (0.0%) |
| 3 or 4 Children | 0 (0.0%) | 0 (0.0%) |
| 5 or more Children | 0 (0.0%) | 0 (0.0%) |
| Total | 160 (100.0%) | 0 (0.0%) |
Income Below Poverty Among Single-Parent Households in James Town
| Children | Single Father | Single Mother |
| No Children | 0 (0.0%) | 0 (0.0%) |
| 1 or 2 Children | 0 (0.0%) | 0 (0.0%) |
| 3 or 4 Children | 0 (0.0%) | 0 (0.0%) |
| 5 or more Children | 0 (0.0%) | 0 (0.0%) |
| Total | 0 (0.0%) | 0 (0.0%) |
Income Below Poverty Among Married-Couple vs Single-Parent Households in James Town
| Children | Married-Couple Families | Single-Parent Households |
| No Children | 0 (0.0%) | 0 (0.0%) |
| 1 or 2 Children | 0 (0.0%) | 0 (0.0%) |
| 3 or 4 Children | 0 (0.0%) | 0 (0.0%) |
| 5 or more Children | 0 (0.0%) | 0 (0.0%) |
| Total | 0 (0.0%) | 0 (0.0%) |
Race in James Town
The most populous races in James Town are White / Caucasian (473 | 93.1%), Two or more Races (35 | 6.9%), and Hispanic or Latino (21 | 4.1%).
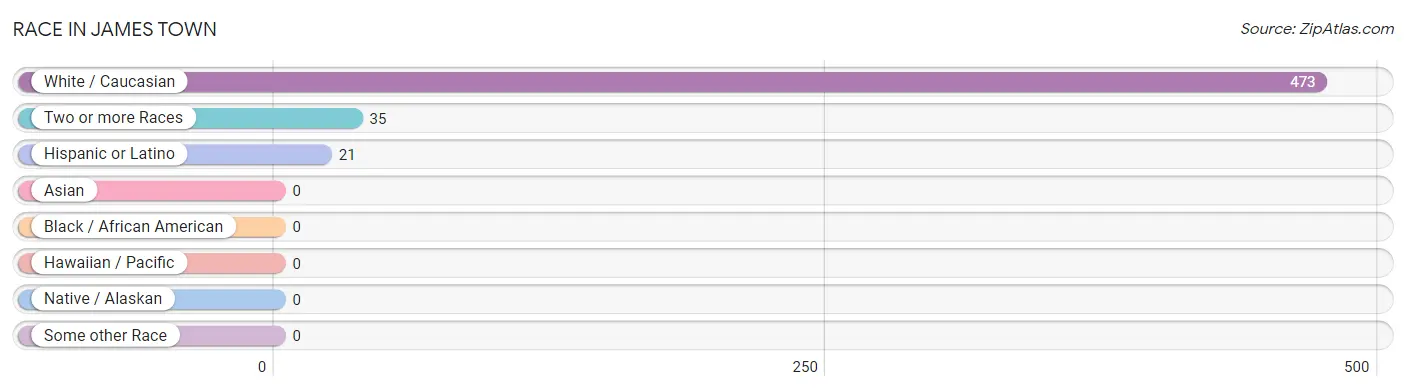
| Race | # Population | % Population |
| Asian | 0 | 0.0% |
| Black / African American | 0 | 0.0% |
| Hawaiian / Pacific | 0 | 0.0% |
| Hispanic or Latino | 21 | 4.1% |
| Native / Alaskan | 0 | 0.0% |
| White / Caucasian | 473 | 93.1% |
| Two or more Races | 35 | 6.9% |
| Some other Race | 0 | 0.0% |
| Total | 508 | 100.0% |
Ancestry in James Town
The most populous ancestries reported in James Town are Irish (226 | 44.5%), German (125 | 24.6%), French (47 | 9.2%), Eastern European (41 | 8.1%), and English (41 | 8.1%), together accounting for 94.5% of all James Town residents.
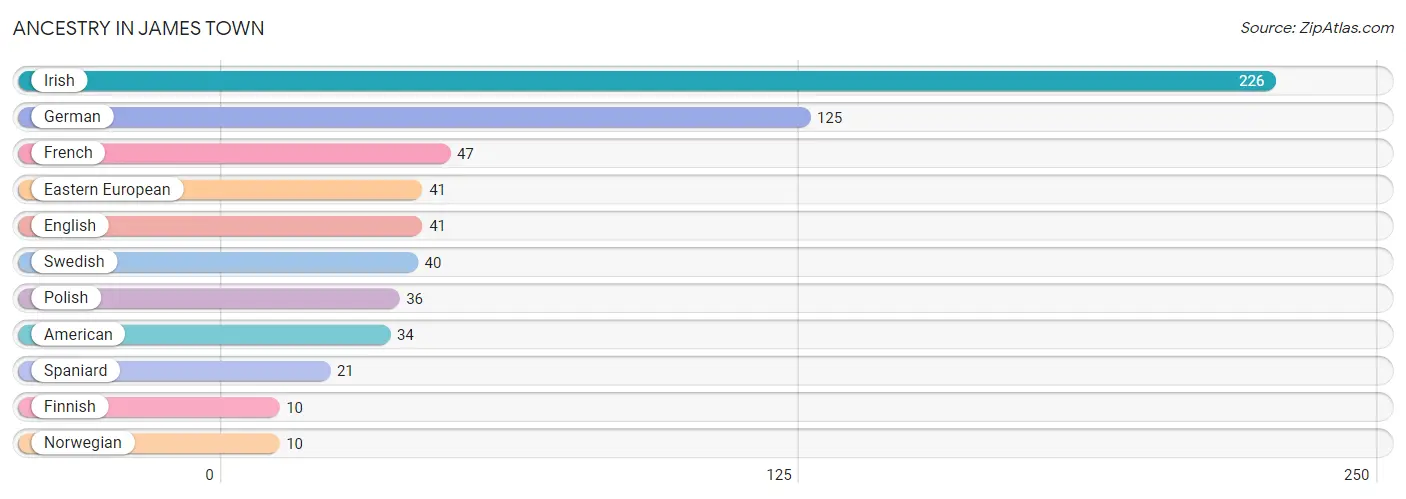
| Ancestry | # Population | % Population |
| American | 34 | 6.7% |
| Eastern European | 41 | 8.1% |
| English | 41 | 8.1% |
| Finnish | 10 | 2.0% |
| French | 47 | 9.2% |
| German | 125 | 24.6% |
| Irish | 226 | 44.5% |
| Norwegian | 10 | 2.0% |
| Polish | 36 | 7.1% |
| Spaniard | 21 | 4.1% |
| Swedish | 40 | 7.9% | View All 11 Rows |
Immigrants in James Town
The most numerous immigrant groups reported in James Town came from Europe (21 | 4.1%), Northern Europe (21 | 4.1%), and Sweden (21 | 4.1%), together accounting for 12.4% of all James Town residents.
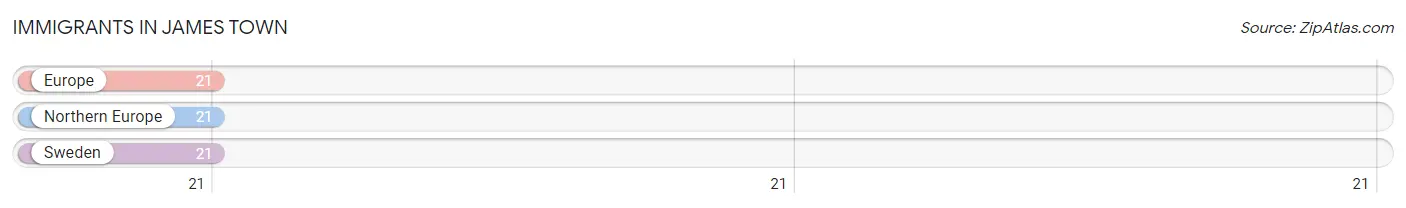
| Immigration Origin | # Population | % Population |
| Europe | 21 | 4.1% |
| Northern Europe | 21 | 4.1% |
| Sweden | 21 | 4.1% | View All 3 Rows |
Sex and Age in James Town
Sex and Age in James Town
The most populous age groups in James Town are 45 to 49 Years (48 | 19.3%) for men and 40 to 44 Years (74 | 28.6%) for women.
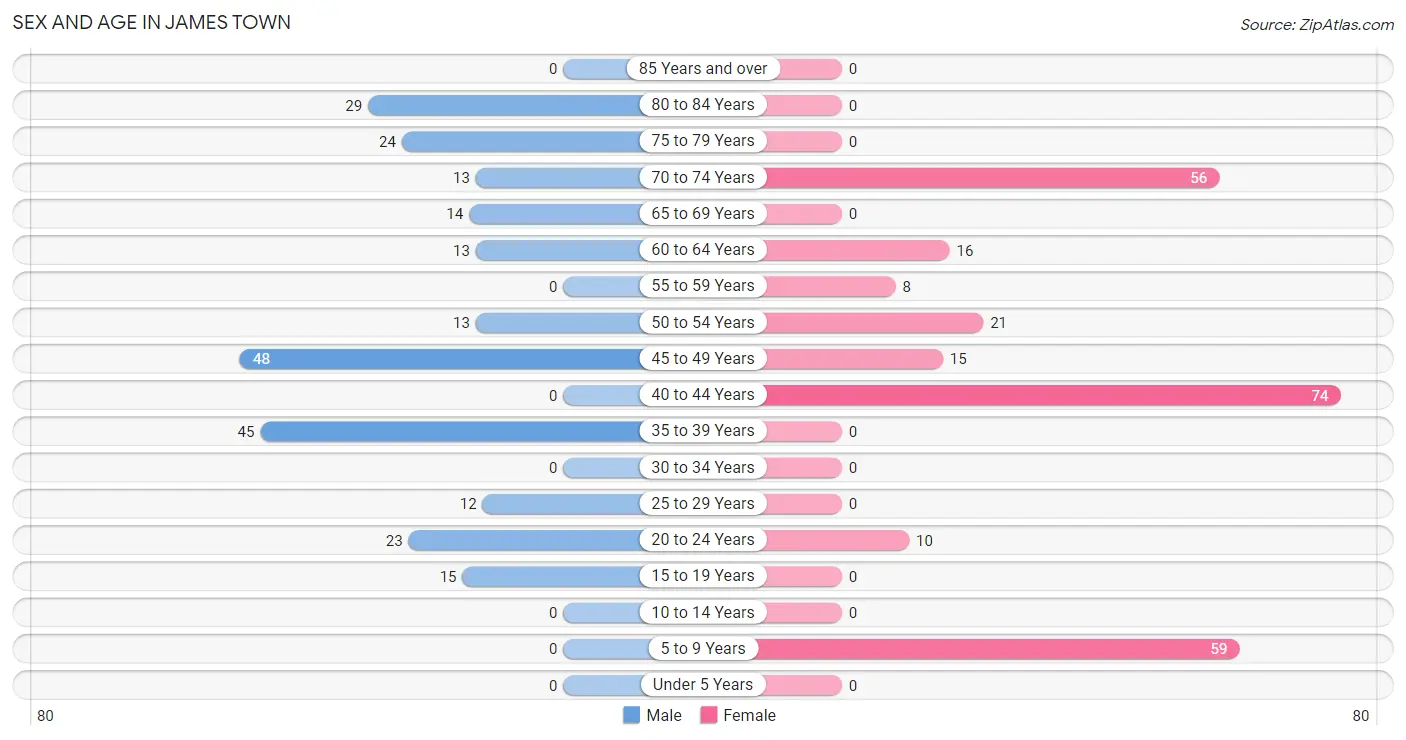
| Age Bracket | Male | Female |
| Under 5 Years | 0 (0.0%) | 0 (0.0%) |
| 5 to 9 Years | 0 (0.0%) | 59 (22.8%) |
| 10 to 14 Years | 0 (0.0%) | 0 (0.0%) |
| 15 to 19 Years | 15 (6.0%) | 0 (0.0%) |
| 20 to 24 Years | 23 (9.2%) | 10 (3.9%) |
| 25 to 29 Years | 12 (4.8%) | 0 (0.0%) |
| 30 to 34 Years | 0 (0.0%) | 0 (0.0%) |
| 35 to 39 Years | 45 (18.1%) | 0 (0.0%) |
| 40 to 44 Years | 0 (0.0%) | 74 (28.6%) |
| 45 to 49 Years | 48 (19.3%) | 15 (5.8%) |
| 50 to 54 Years | 13 (5.2%) | 21 (8.1%) |
| 55 to 59 Years | 0 (0.0%) | 8 (3.1%) |
| 60 to 64 Years | 13 (5.2%) | 16 (6.2%) |
| 65 to 69 Years | 14 (5.6%) | 0 (0.0%) |
| 70 to 74 Years | 13 (5.2%) | 56 (21.6%) |
| 75 to 79 Years | 24 (9.6%) | 0 (0.0%) |
| 80 to 84 Years | 29 (11.7%) | 0 (0.0%) |
| 85 Years and over | 0 (0.0%) | 0 (0.0%) |
| Total | 249 (100.0%) | 259 (100.0%) |
Families and Households in James Town
Median Family Size in James Town
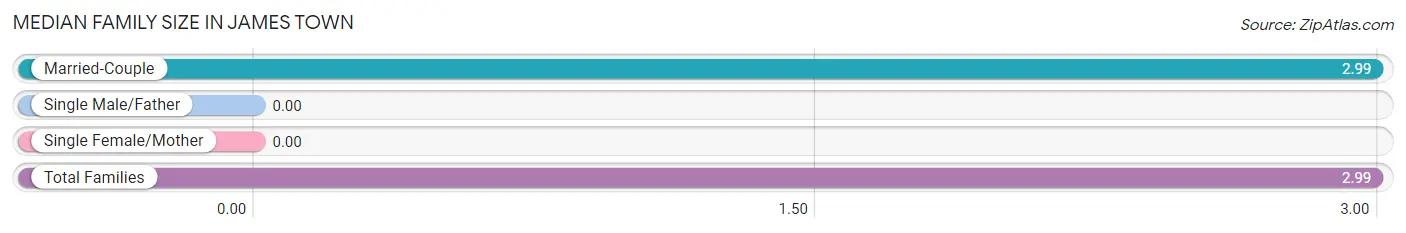
| Family Type | # Families | Family Size |
| Married-Couple | 160 (100.0%) | 2.99 |
| Single Male/Father | 0 (0.0%) | - |
| Single Female/Mother | 0 (0.0%) | - |
| Total Families | 160 (100.0%) | 2.99 |
Median Household Size in James Town
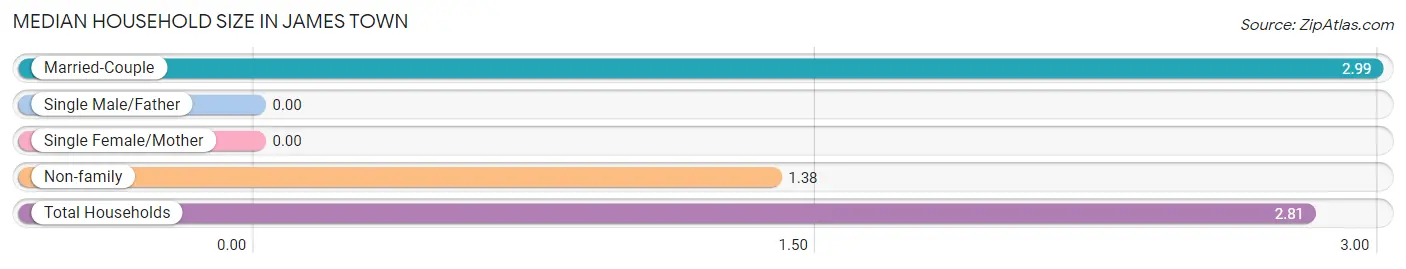
| Household Type | # Households | Household Size |
| Married-Couple | 160 (88.4%) | 2.99 |
| Single Male/Father | 0 (0.0%) | - |
| Single Female/Mother | 0 (0.0%) | - |
| Non-family | 21 (11.6%) | 1.38 |
| Total Households | 181 (100.0%) | 2.81 |
Household Size by Marriage Status in James Town
Out of a total of 181 households in James Town, 160 (88.4%) are family households, while 21 (11.6%) are nonfamily households. The most numerous type of family households are 3-person households, comprising 89, and the most common type of nonfamily households are 1-person households, comprising 14.
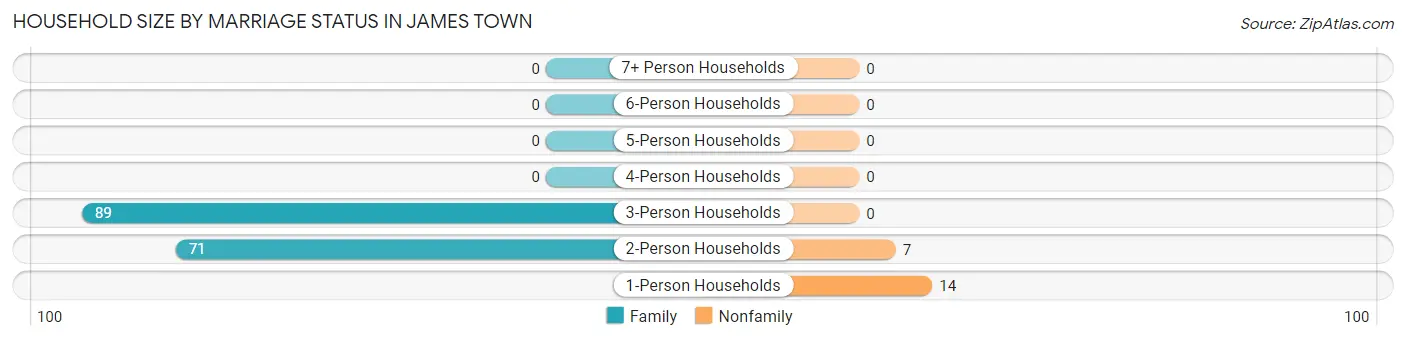
| Household Size | Family Households | Nonfamily Households |
| 1-Person Households | - | 14 (7.7%) |
| 2-Person Households | 71 (39.2%) | 7 (3.9%) |
| 3-Person Households | 89 (49.2%) | 0 (0.0%) |
| 4-Person Households | 0 (0.0%) | 0 (0.0%) |
| 5-Person Households | 0 (0.0%) | 0 (0.0%) |
| 6-Person Households | 0 (0.0%) | 0 (0.0%) |
| 7+ Person Households | 0 (0.0%) | 0 (0.0%) |
| Total | 160 (88.4%) | 21 (11.6%) |
Female Fertility in James Town
Fertility by Age in James Town
| Age Bracket | Women with Births | Births / 1,000 Women |
| 15 to 19 years | 0 (0.0%) | 0.0 |
| 20 to 34 years | 0 (0.0%) | 0.0 |
| 35 to 50 years | 0 (0.0%) | 0.0 |
| Total | 0 (0.0%) | 0.0 |
Fertility by Age by Marriage Status in James Town
| Age Bracket | Married | Unmarried |
| 15 to 19 years | 0 (0.0%) | 0 (0.0%) |
| 20 to 34 years | 0 (0.0%) | 0 (0.0%) |
| 35 to 50 years | 0 (0.0%) | 0 (0.0%) |
| Total | 0 (0.0%) | 0 (0.0%) |
Fertility by Education in James Town
| Educational Attainment | Women with Births | Births / 1,000 Women |
| Less than High School | 0 (0.0%) | 0.0 |
| High School Diploma | 0 (0.0%) | 0.0 |
| College or Associate's Degree | 0 (0.0%) | 0.0 |
| Bachelor's Degree | 0 (0.0%) | 0.0 |
| Graduate Degree | 0 (0.0%) | 0.0 |
| Total | 0 (0.0%) | 0.0 |
Fertility by Education by Marriage Status in James Town
| Educational Attainment | Married | Unmarried |
| Less than High School | 0 (0.0%) | 0 (0.0%) |
| High School Diploma | 0 (0.0%) | 0 (0.0%) |
| College or Associate's Degree | 0 (0.0%) | 0 (0.0%) |
| Bachelor's Degree | 0 (0.0%) | 0 (0.0%) |
| Graduate Degree | 0 (0.0%) | 0 (0.0%) |
| Total | 0 (0.0%) | 0 (0.0%) |
Employment Characteristics in James Town
Employment by Class of Employer in James Town
Among the 267 employed individuals in James Town, private company employees (225 | 84.3%), self-employed (not incorporated) (34 | 12.7%), and federal government employees (8 | 3.0%) make up the most common classes of employment.
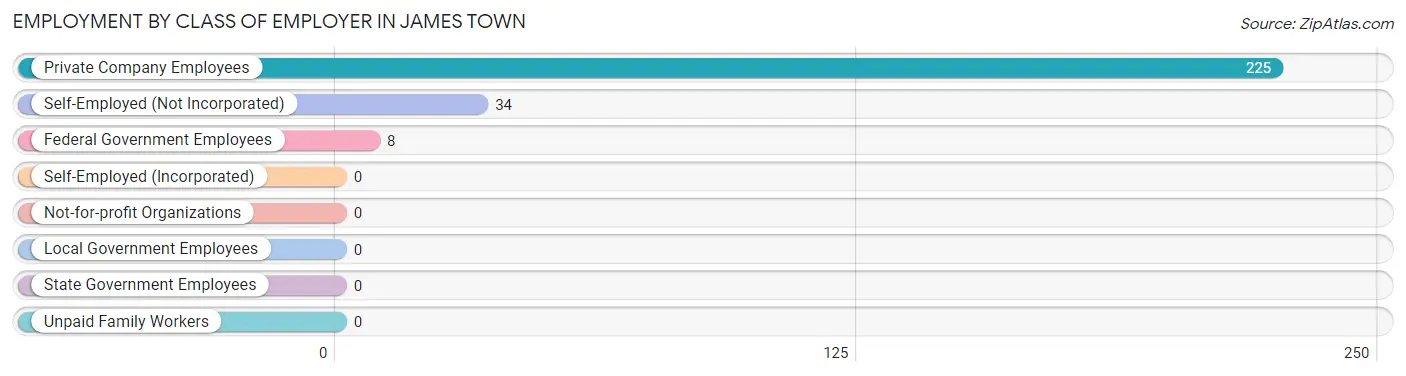
| Employer Class | # Employees | % Employees |
| Private Company Employees | 225 | 84.3% |
| Self-Employed (Incorporated) | 0 | 0.0% |
| Self-Employed (Not Incorporated) | 34 | 12.7% |
| Not-for-profit Organizations | 0 | 0.0% |
| Local Government Employees | 0 | 0.0% |
| State Government Employees | 0 | 0.0% |
| Federal Government Employees | 8 | 3.0% |
| Unpaid Family Workers | 0 | 0.0% |
| Total | 267 | 100.0% |
Employment Status by Age in James Town
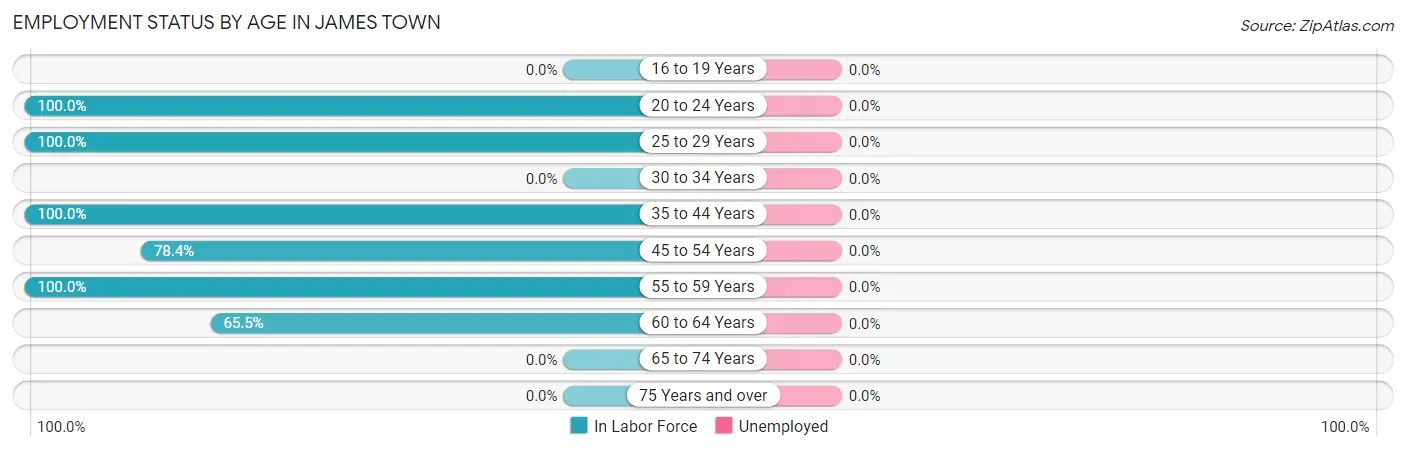
| Age Bracket | In Labor Force | Unemployed |
| 16 to 19 Years | 0 (0.0%) | 0 (0.0%) |
| 20 to 24 Years | 33 (100.0%) | 0 (0.0%) |
| 25 to 29 Years | 12 (100.0%) | 0 (0.0%) |
| 30 to 34 Years | 0 (0.0%) | 0 (0.0%) |
| 35 to 44 Years | 119 (100.0%) | 0 (0.0%) |
| 45 to 54 Years | 76 (78.4%) | 0 (0.0%) |
| 55 to 59 Years | 8 (100.0%) | 0 (0.0%) |
| 60 to 64 Years | 19 (65.5%) | 0 (0.0%) |
| 65 to 74 Years | 0 (0.0%) | 0 (0.0%) |
| 75 Years and over | 0 (0.0%) | 0 (0.0%) |
| Total | 267 (59.5%) | 0 (0.0%) |
Employment Status by Educational Attainment in James Town
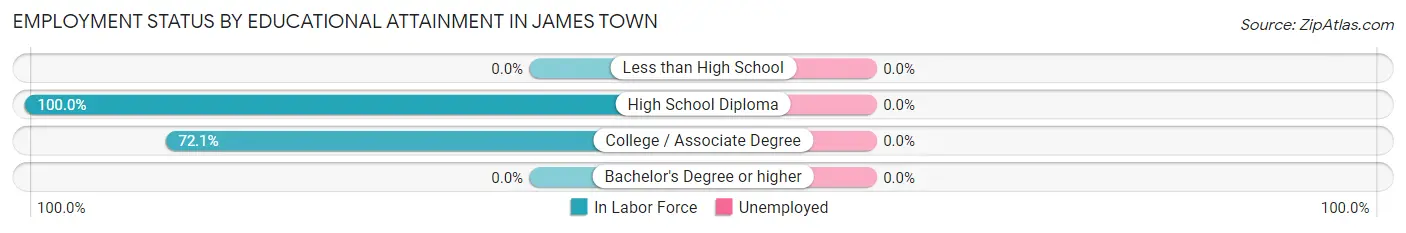
| Educational Attainment | In Labor Force | Unemployed |
| Less than High School | 0 (0.0%) | 0 (0.0%) |
| High School Diploma | 154 (100.0%) | 0 (0.0%) |
| College / Associate Degree | 80 (72.1%) | 0 (0.0%) |
| Bachelor's Degree or higher | 0 (0.0%) | 0 (0.0%) |
| Total | 234 (88.3%) | 0 (0.0%) |
Employment Occupations by Sex in James Town
Management, Business, Science and Arts Occupations
The most common Management, Business, Science and Arts occupations in James Town are Computers, Engineering & Science (20 | 7.5%), and Computers & Mathematics (20 | 7.5%).
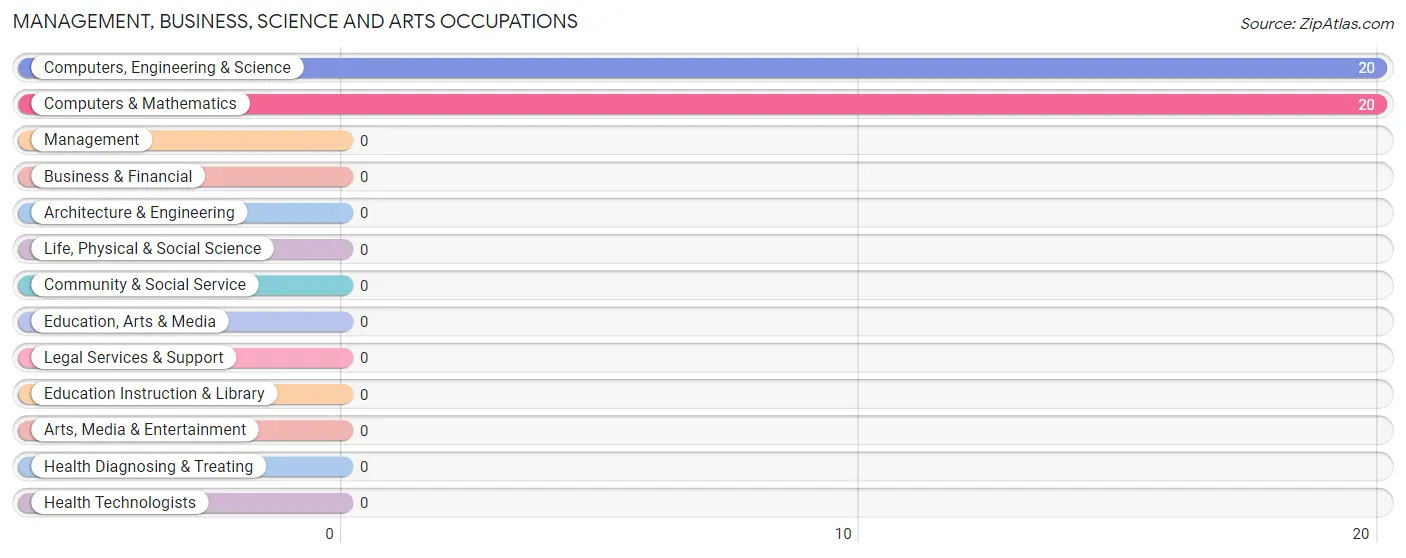
Management, Business, Science and Arts Occupations by Sex
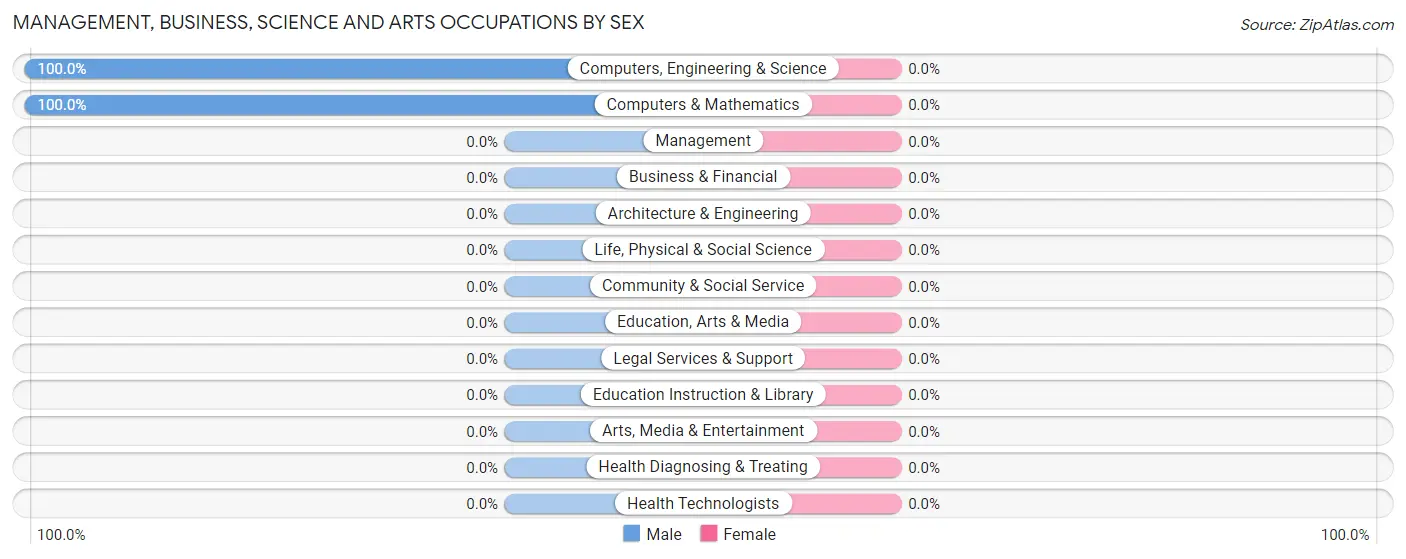
| Occupation | Male | Female |
| Management | 0 (0.0%) | 0 (0.0%) |
| Business & Financial | 0 (0.0%) | 0 (0.0%) |
| Computers, Engineering & Science | 20 (100.0%) | 0 (0.0%) |
| Computers & Mathematics | 20 (100.0%) | 0 (0.0%) |
| Architecture & Engineering | 0 (0.0%) | 0 (0.0%) |
| Life, Physical & Social Science | 0 (0.0%) | 0 (0.0%) |
| Community & Social Service | 0 (0.0%) | 0 (0.0%) |
| Education, Arts & Media | 0 (0.0%) | 0 (0.0%) |
| Legal Services & Support | 0 (0.0%) | 0 (0.0%) |
| Education Instruction & Library | 0 (0.0%) | 0 (0.0%) |
| Arts, Media & Entertainment | 0 (0.0%) | 0 (0.0%) |
| Health Diagnosing & Treating | 0 (0.0%) | 0 (0.0%) |
| Health Technologists | 0 (0.0%) | 0 (0.0%) |
| Total (Category) | 20 (100.0%) | 0 (0.0%) |
| Total (Overall) | 148 (55.4%) | 119 (44.6%) |
Services Occupations
The most common Services occupations in James Town are , and Healthcare Support (12 | 4.5%).
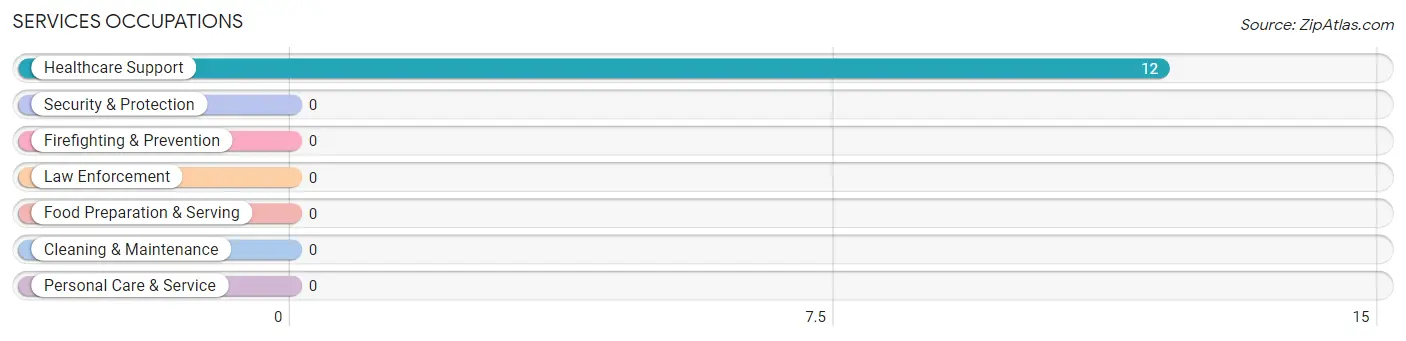
Services Occupations by Sex
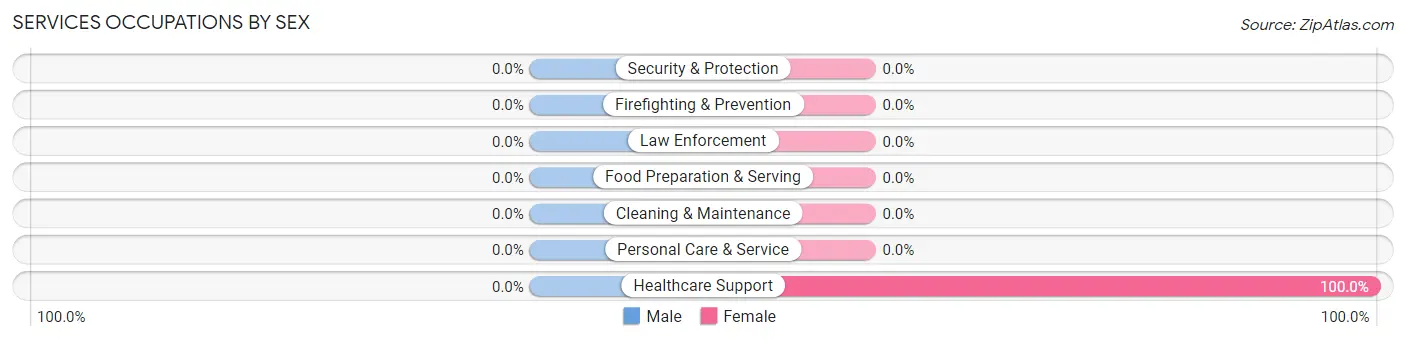
| Occupation | Male | Female |
| Healthcare Support | 0 (0.0%) | 12 (100.0%) |
| Security & Protection | 0 (0.0%) | 0 (0.0%) |
| Firefighting & Prevention | 0 (0.0%) | 0 (0.0%) |
| Law Enforcement | 0 (0.0%) | 0 (0.0%) |
| Food Preparation & Serving | 0 (0.0%) | 0 (0.0%) |
| Cleaning & Maintenance | 0 (0.0%) | 0 (0.0%) |
| Personal Care & Service | 0 (0.0%) | 0 (0.0%) |
| Total (Category) | 0 (0.0%) | 12 (100.0%) |
| Total (Overall) | 148 (55.4%) | 119 (44.6%) |
Sales and Office Occupations
The most common Sales and Office occupations in James Town are Office & Administration (74 | 27.7%), and Sales & Related (22 | 8.2%).
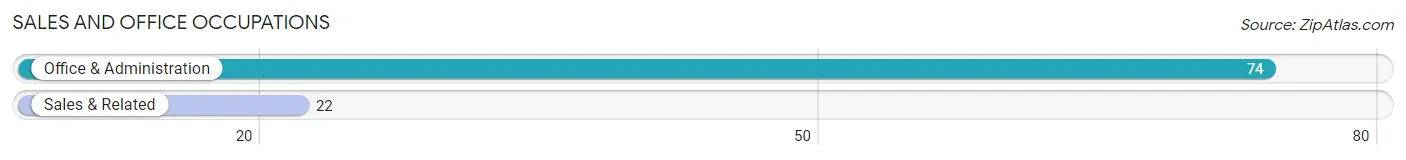
Sales and Office Occupations by Sex
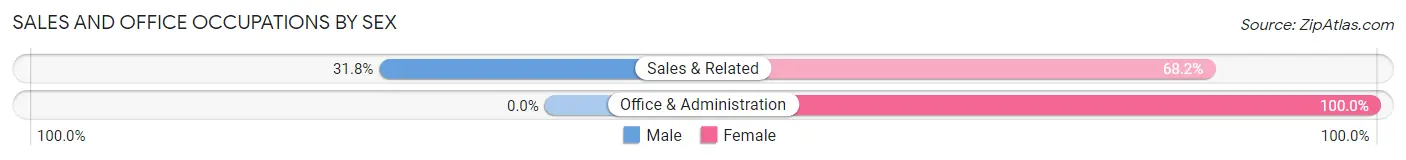
| Occupation | Male | Female |
| Sales & Related | 7 (31.8%) | 15 (68.2%) |
| Office & Administration | 0 (0.0%) | 74 (100.0%) |
| Total (Category) | 7 (7.3%) | 89 (92.7%) |
| Total (Overall) | 148 (55.4%) | 119 (44.6%) |
Natural Resources, Construction and Maintenance Occupations
The most common Natural Resources, Construction and Maintenance occupations in James Town are Construction & Extraction (23 | 8.6%), and Installation, Maintenance & Repair (23 | 8.6%).
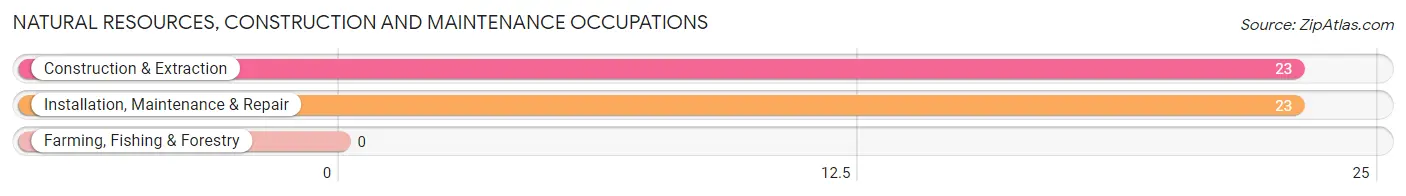
Natural Resources, Construction and Maintenance Occupations by Sex
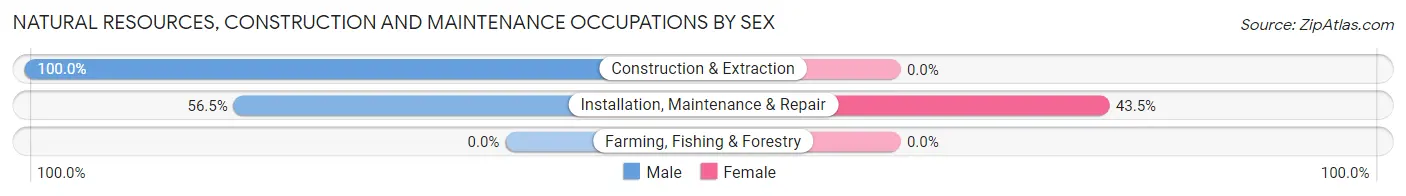
| Occupation | Male | Female |
| Farming, Fishing & Forestry | 0 (0.0%) | 0 (0.0%) |
| Construction & Extraction | 23 (100.0%) | 0 (0.0%) |
| Installation, Maintenance & Repair | 13 (56.5%) | 10 (43.5%) |
| Total (Category) | 36 (78.3%) | 10 (21.7%) |
| Total (Overall) | 148 (55.4%) | 119 (44.6%) |
Production, Transportation and Moving Occupations
The most common Production, Transportation and Moving occupations in James Town are Production (45 | 16.9%), Transportation (40 | 15.0%), and Material Moving (8 | 3.0%).
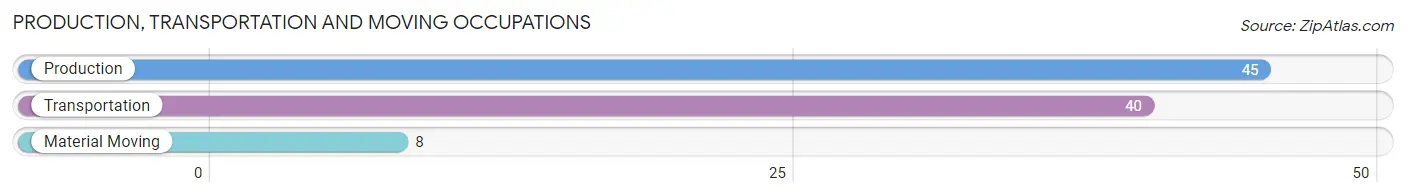
Production, Transportation and Moving Occupations by Sex
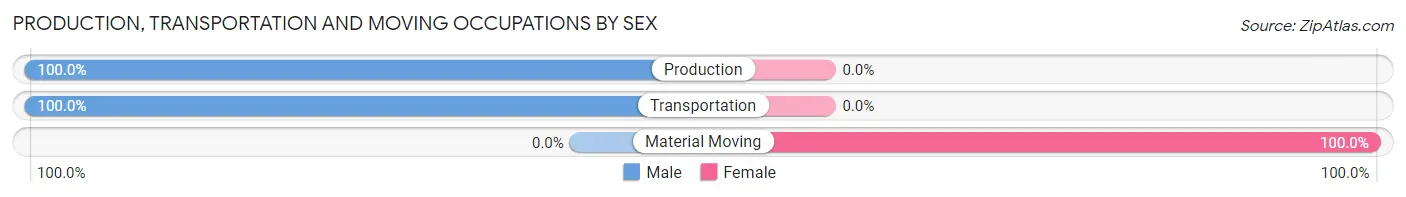
| Occupation | Male | Female |
| Production | 45 (100.0%) | 0 (0.0%) |
| Transportation | 40 (100.0%) | 0 (0.0%) |
| Material Moving | 0 (0.0%) | 8 (100.0%) |
| Total (Category) | 85 (91.4%) | 8 (8.6%) |
| Total (Overall) | 148 (55.4%) | 119 (44.6%) |
Employment Industries by Sex in James Town
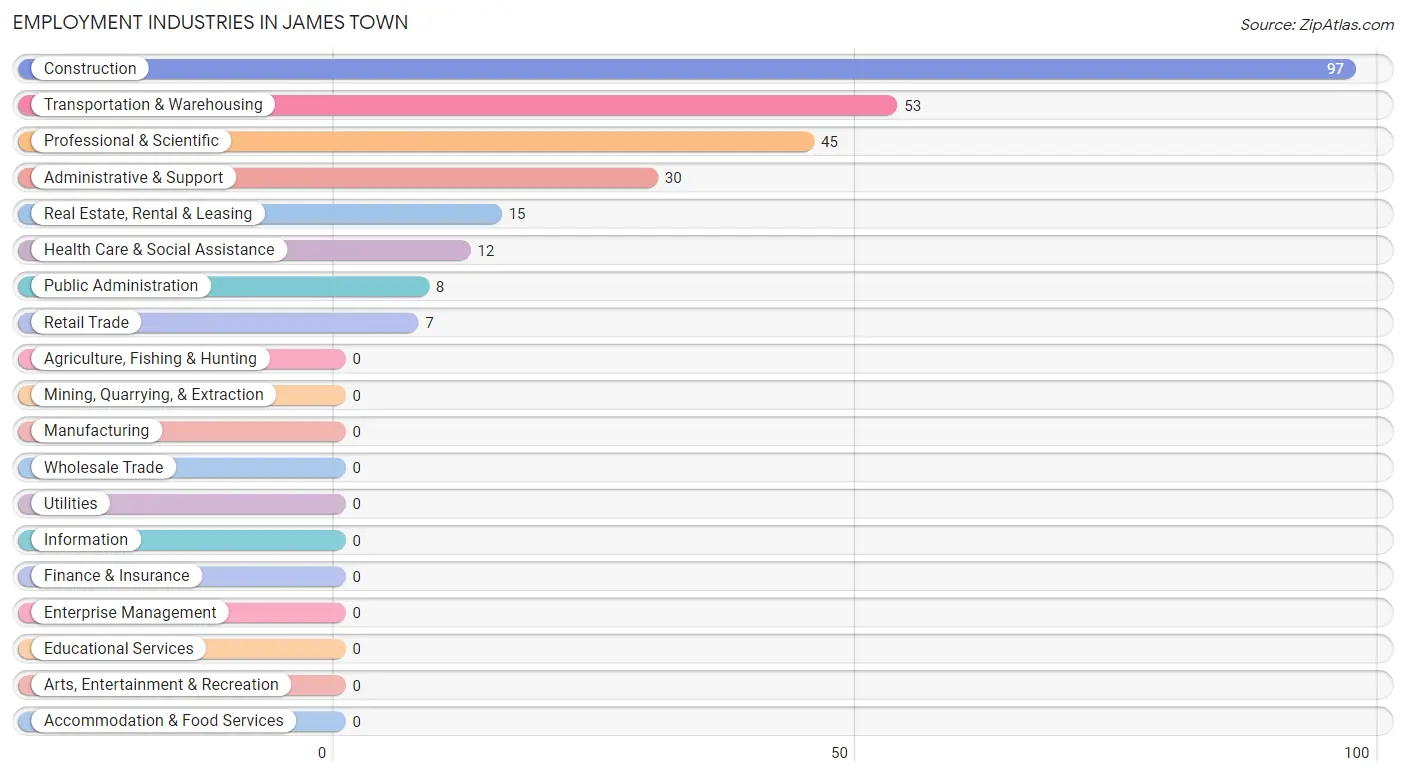
Employment Industries in James Town
The major employment industries in James Town include Construction (97 | 36.3%), Transportation & Warehousing (53 | 19.9%), Professional & Scientific (45 | 16.9%), Administrative & Support (30 | 11.2%), and Real Estate, Rental & Leasing (15 | 5.6%).
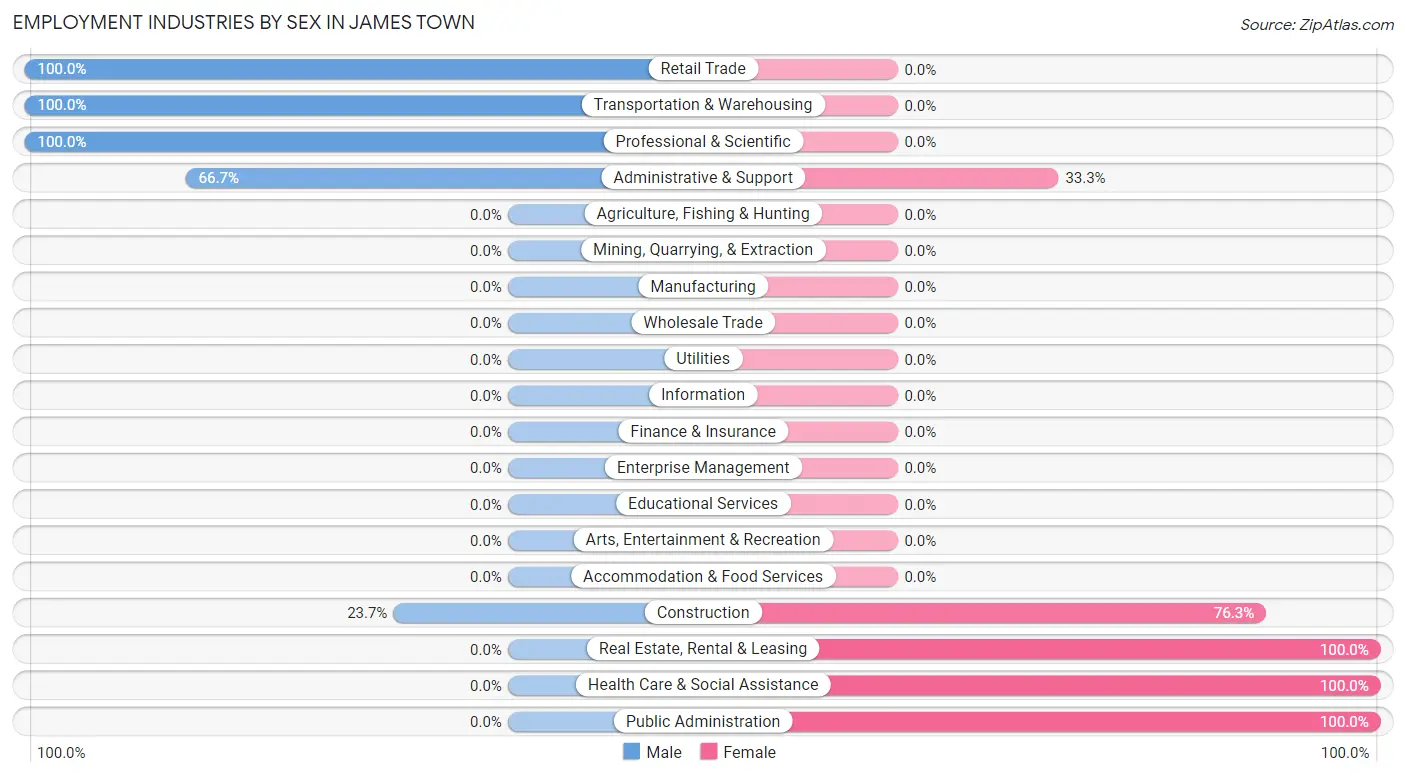
Employment Industries by Sex in James Town
The James Town industries that see more men than women are Retail Trade (100.0%), Transportation & Warehousing (100.0%), and Professional & Scientific (100.0%), whereas the industries that tend to have a higher number of women are Real Estate, Rental & Leasing (100.0%), Health Care & Social Assistance (100.0%), and Public Administration (100.0%).
| Industry | Male | Female |
| Agriculture, Fishing & Hunting | 0 (0.0%) | 0 (0.0%) |
| Mining, Quarrying, & Extraction | 0 (0.0%) | 0 (0.0%) |
| Construction | 23 (23.7%) | 74 (76.3%) |
| Manufacturing | 0 (0.0%) | 0 (0.0%) |
| Wholesale Trade | 0 (0.0%) | 0 (0.0%) |
| Retail Trade | 7 (100.0%) | 0 (0.0%) |
| Transportation & Warehousing | 53 (100.0%) | 0 (0.0%) |
| Utilities | 0 (0.0%) | 0 (0.0%) |
| Information | 0 (0.0%) | 0 (0.0%) |
| Finance & Insurance | 0 (0.0%) | 0 (0.0%) |
| Real Estate, Rental & Leasing | 0 (0.0%) | 15 (100.0%) |
| Professional & Scientific | 45 (100.0%) | 0 (0.0%) |
| Enterprise Management | 0 (0.0%) | 0 (0.0%) |
| Administrative & Support | 20 (66.7%) | 10 (33.3%) |
| Educational Services | 0 (0.0%) | 0 (0.0%) |
| Health Care & Social Assistance | 0 (0.0%) | 12 (100.0%) |
| Arts, Entertainment & Recreation | 0 (0.0%) | 0 (0.0%) |
| Accommodation & Food Services | 0 (0.0%) | 0 (0.0%) |
| Public Administration | 0 (0.0%) | 8 (100.0%) |
| Total | 148 (55.4%) | 119 (44.6%) |
Education in James Town
School Enrollment in James Town
The most common levels of schooling among the 82 students in James Town are kindergarten (59 | 72.0%), high school (15 | 18.3%), and college / undergraduate (8 | 9.8%).
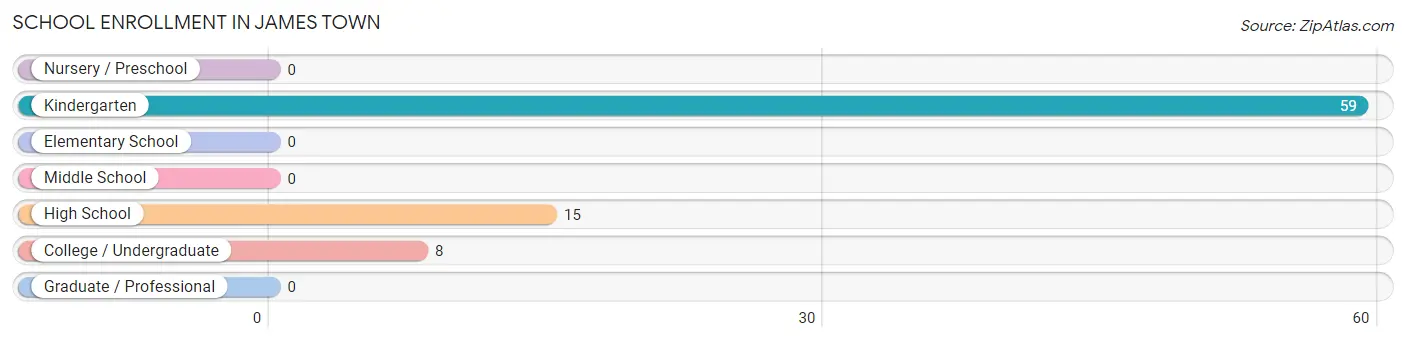
| School Level | # Students | % Students |
| Nursery / Preschool | 0 | 0.0% |
| Kindergarten | 59 | 72.0% |
| Elementary School | 0 | 0.0% |
| Middle School | 0 | 0.0% |
| High School | 15 | 18.3% |
| College / Undergraduate | 8 | 9.8% |
| Graduate / Professional | 0 | 0.0% |
| Total | 82 | 100.0% |
School Enrollment by Age by Funding Source in James Town
Out of a total of 82 students who are enrolled in schools in James Town, 59 (72.0%) attend a private institution, while the remaining 23 (28.0%) are enrolled in public schools. The age group of 5 to 9 year old has the highest likelihood of being enrolled in private schools, with 59 (100.0% in the age bracket) enrolled. Conversely, the age group of 18 to 19 year olds has the lowest likelihood of being enrolled in a private school, with 15 (100.0% in the age bracket) attending a public institution.
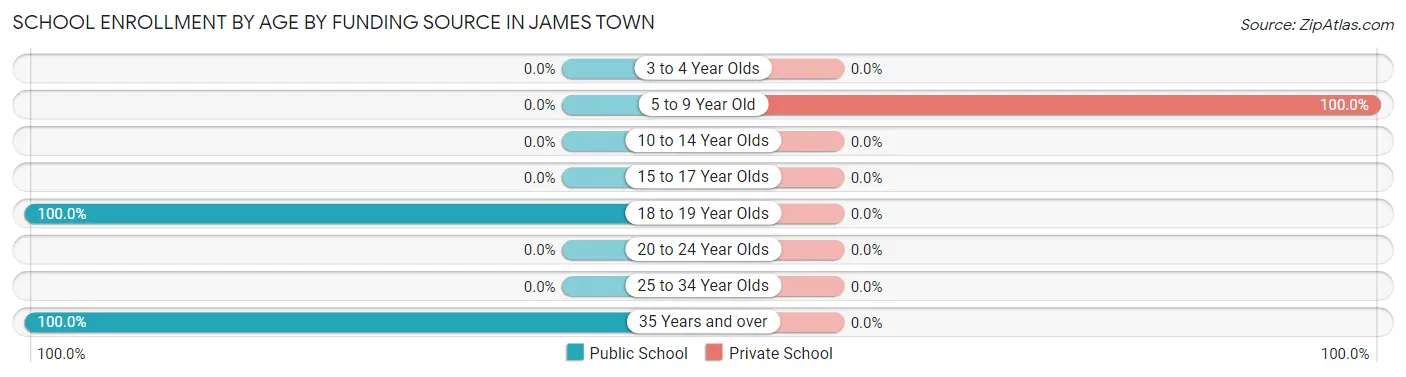
| Age Bracket | Public School | Private School |
| 3 to 4 Year Olds | 0 (0.0%) | 0 (0.0%) |
| 5 to 9 Year Old | 0 (0.0%) | 59 (100.0%) |
| 10 to 14 Year Olds | 0 (0.0%) | 0 (0.0%) |
| 15 to 17 Year Olds | 0 (0.0%) | 0 (0.0%) |
| 18 to 19 Year Olds | 15 (100.0%) | 0 (0.0%) |
| 20 to 24 Year Olds | 0 (0.0%) | 0 (0.0%) |
| 25 to 34 Year Olds | 0 (0.0%) | 0 (0.0%) |
| 35 Years and over | 8 (100.0%) | 0 (0.0%) |
| Total | 23 (28.0%) | 59 (72.0%) |
Educational Attainment by Field of Study in James Town
Science & technology (29 | 53.7%), arts & humanities (13 | 24.1%), and engineering (12 | 22.2%) are the most common fields of study among 54 individuals in James Town who have obtained a bachelor's degree or higher.
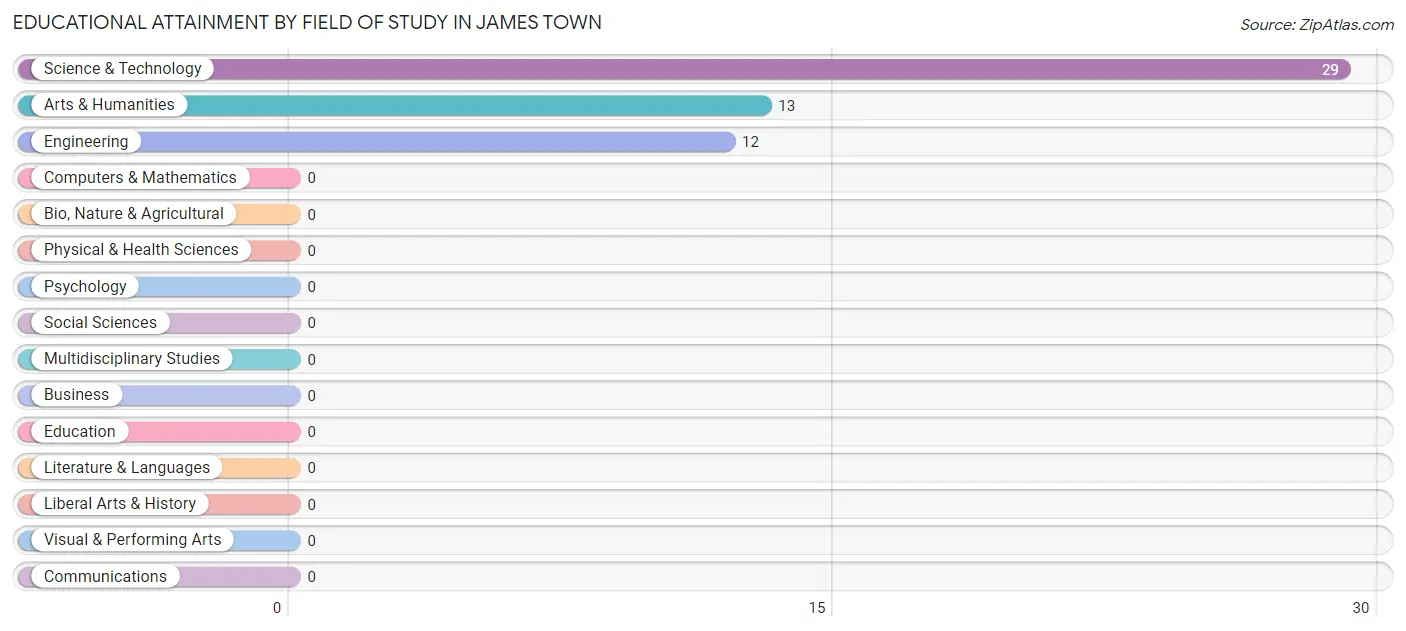
| Field of Study | # Graduates | % Graduates |
| Computers & Mathematics | 0 | 0.0% |
| Bio, Nature & Agricultural | 0 | 0.0% |
| Physical & Health Sciences | 0 | 0.0% |
| Psychology | 0 | 0.0% |
| Social Sciences | 0 | 0.0% |
| Engineering | 12 | 22.2% |
| Multidisciplinary Studies | 0 | 0.0% |
| Science & Technology | 29 | 53.7% |
| Business | 0 | 0.0% |
| Education | 0 | 0.0% |
| Literature & Languages | 0 | 0.0% |
| Liberal Arts & History | 0 | 0.0% |
| Visual & Performing Arts | 0 | 0.0% |
| Communications | 0 | 0.0% |
| Arts & Humanities | 13 | 24.1% |
| Total | 54 | 100.0% |
Transportation & Commute in James Town
Vehicle Availability by Sex in James Town
The most prevalent vehicle ownership categories in James Town are males with 3 vehicles (50, accounting for 33.8%) and females with 3 vehicles (20, making up 42.0%).
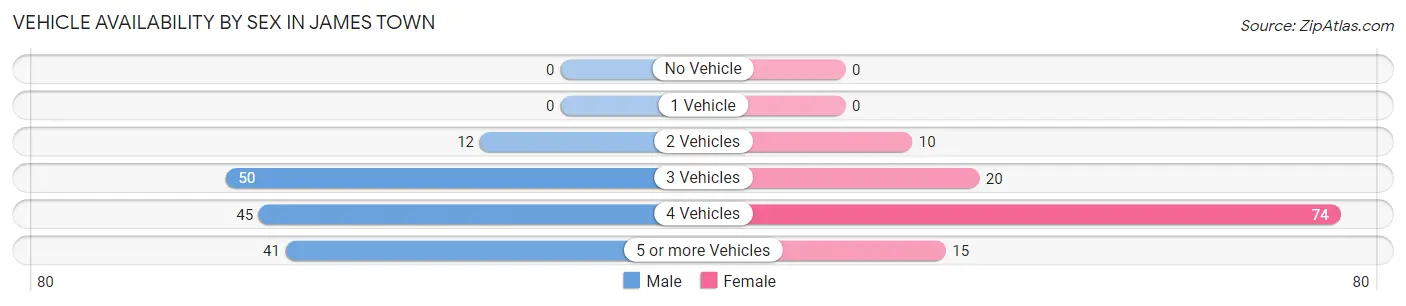
| Vehicles Available | Male | Female |
| No Vehicle | 0 (0.0%) | 0 (0.0%) |
| 1 Vehicle | 0 (0.0%) | 0 (0.0%) |
| 2 Vehicles | 12 (8.1%) | 10 (8.4%) |
| 3 Vehicles | 50 (33.8%) | 20 (16.8%) |
| 4 Vehicles | 45 (30.4%) | 74 (62.2%) |
| 5 or more Vehicles | 41 (27.7%) | 15 (12.6%) |
| Total | 148 (100.0%) | 119 (100.0%) |
Commute Time in James Town
The most frequently occuring commute durations in James Town are 5 to 9 minutes (110 commuters, 45.8%), less than 5 minutes (45 commuters, 18.8%), and 30 to 34 minutes (28 commuters, 11.7%).
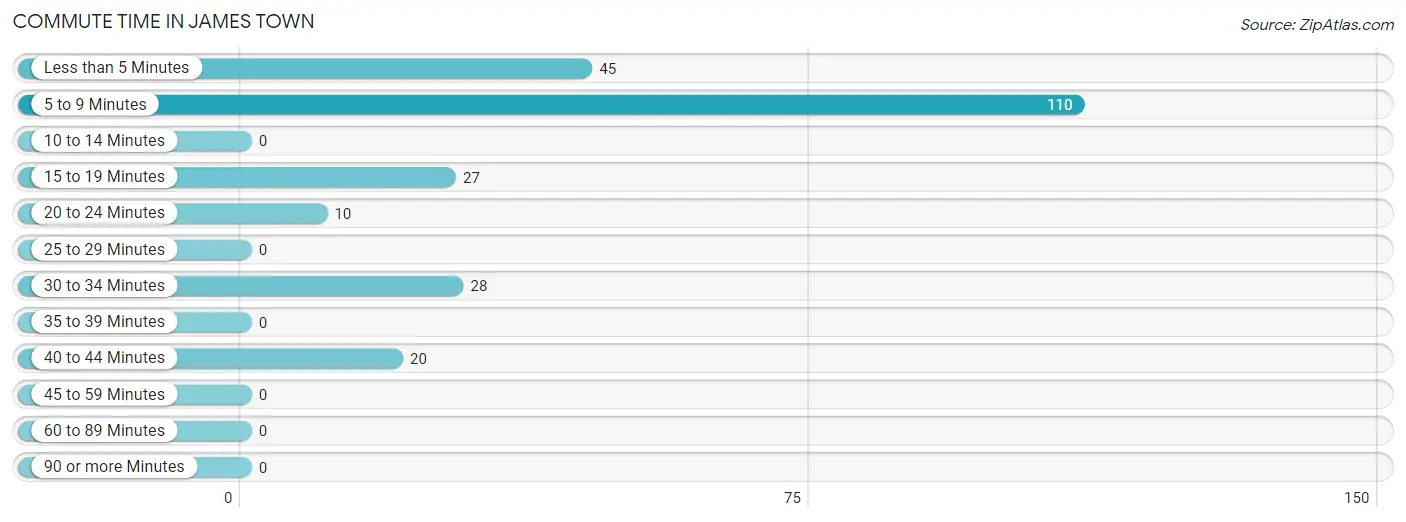
| Commute Time | # Commuters | % Commuters |
| Less than 5 Minutes | 45 | 18.8% |
| 5 to 9 Minutes | 110 | 45.8% |
| 10 to 14 Minutes | 0 | 0.0% |
| 15 to 19 Minutes | 27 | 11.3% |
| 20 to 24 Minutes | 10 | 4.2% |
| 25 to 29 Minutes | 0 | 0.0% |
| 30 to 34 Minutes | 28 | 11.7% |
| 35 to 39 Minutes | 0 | 0.0% |
| 40 to 44 Minutes | 20 | 8.3% |
| 45 to 59 Minutes | 0 | 0.0% |
| 60 to 89 Minutes | 0 | 0.0% |
| 90 or more Minutes | 0 | 0.0% |
Commute Time by Sex in James Town
The most common commute times in James Town are less than 5 minutes (45 commuters, 31.9%) for males and 5 to 9 minutes (74 commuters, 74.8%) for females.
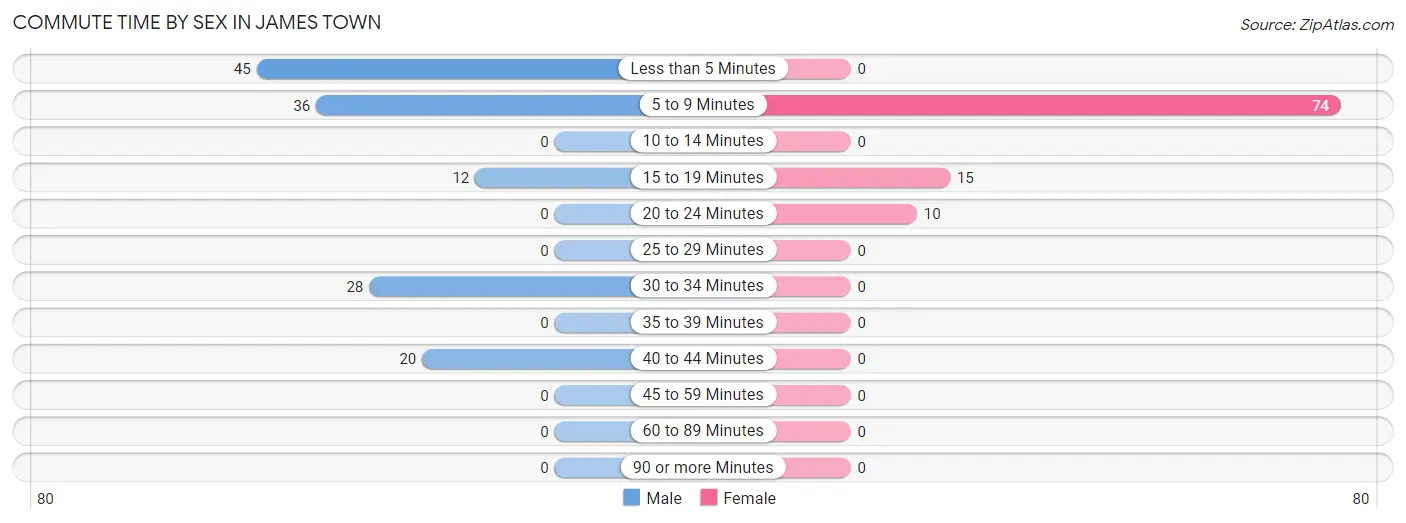
| Commute Time | Male | Female |
| Less than 5 Minutes | 45 (31.9%) | 0 (0.0%) |
| 5 to 9 Minutes | 36 (25.5%) | 74 (74.8%) |
| 10 to 14 Minutes | 0 (0.0%) | 0 (0.0%) |
| 15 to 19 Minutes | 12 (8.5%) | 15 (15.1%) |
| 20 to 24 Minutes | 0 (0.0%) | 10 (10.1%) |
| 25 to 29 Minutes | 0 (0.0%) | 0 (0.0%) |
| 30 to 34 Minutes | 28 (19.9%) | 0 (0.0%) |
| 35 to 39 Minutes | 0 (0.0%) | 0 (0.0%) |
| 40 to 44 Minutes | 20 (14.2%) | 0 (0.0%) |
| 45 to 59 Minutes | 0 (0.0%) | 0 (0.0%) |
| 60 to 89 Minutes | 0 (0.0%) | 0 (0.0%) |
| 90 or more Minutes | 0 (0.0%) | 0 (0.0%) |
Time of Departure to Work by Sex in James Town
The most frequent times of departure to work in James Town are 5:30 AM to 5:59 AM (48, 34.0%) for males and 7:30 AM to 7:59 AM (74, 74.8%) for females.
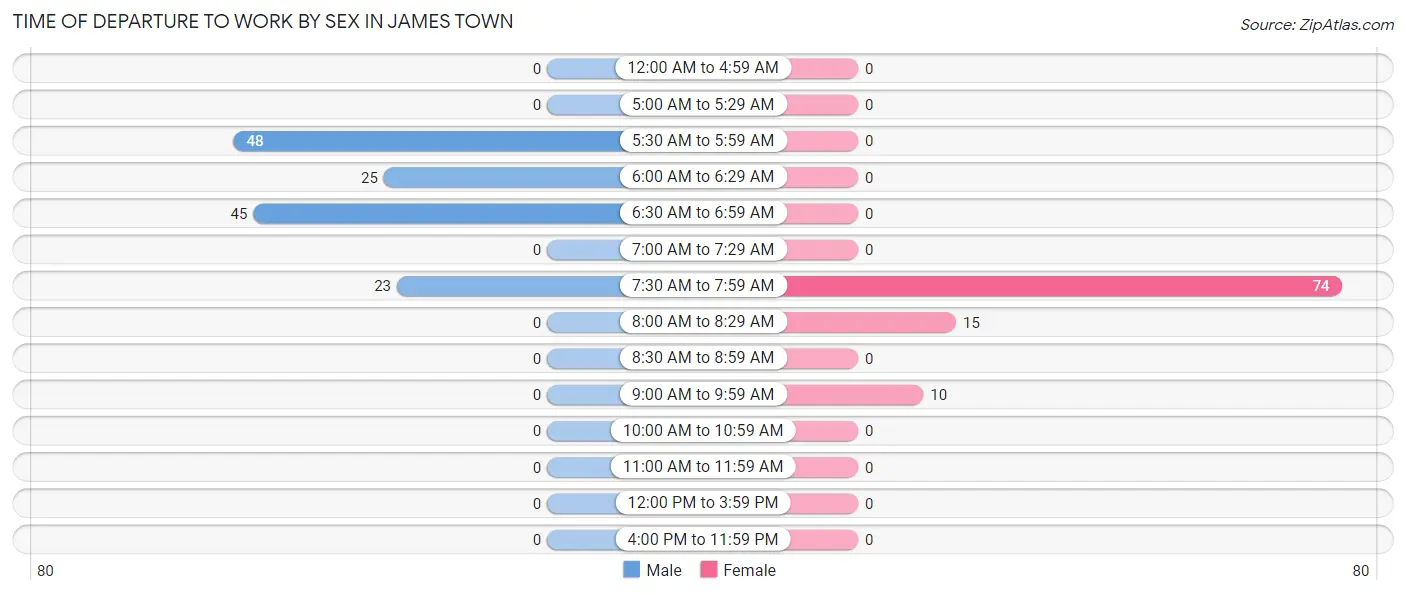
| Time of Departure | Male | Female |
| 12:00 AM to 4:59 AM | 0 (0.0%) | 0 (0.0%) |
| 5:00 AM to 5:29 AM | 0 (0.0%) | 0 (0.0%) |
| 5:30 AM to 5:59 AM | 48 (34.0%) | 0 (0.0%) |
| 6:00 AM to 6:29 AM | 25 (17.7%) | 0 (0.0%) |
| 6:30 AM to 6:59 AM | 45 (31.9%) | 0 (0.0%) |
| 7:00 AM to 7:29 AM | 0 (0.0%) | 0 (0.0%) |
| 7:30 AM to 7:59 AM | 23 (16.3%) | 74 (74.8%) |
| 8:00 AM to 8:29 AM | 0 (0.0%) | 15 (15.1%) |
| 8:30 AM to 8:59 AM | 0 (0.0%) | 0 (0.0%) |
| 9:00 AM to 9:59 AM | 0 (0.0%) | 10 (10.1%) |
| 10:00 AM to 10:59 AM | 0 (0.0%) | 0 (0.0%) |
| 11:00 AM to 11:59 AM | 0 (0.0%) | 0 (0.0%) |
| 12:00 PM to 3:59 PM | 0 (0.0%) | 0 (0.0%) |
| 4:00 PM to 11:59 PM | 0 (0.0%) | 0 (0.0%) |
| Total | 141 (100.0%) | 99 (100.0%) |
Housing Occupancy in James Town
Occupancy by Ownership in James Town
Of the total 181 dwellings in James Town, owner-occupied units account for 181 (100.0%), while renter-occupied units make up 0 (0.0%).
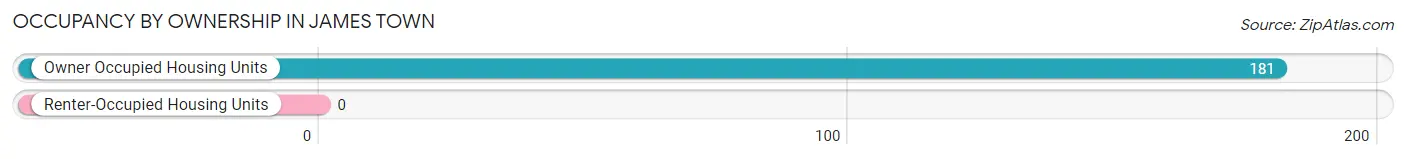
| Occupancy | # Housing Units | % Housing Units |
| Owner Occupied Housing Units | 181 | 100.0% |
| Renter-Occupied Housing Units | 0 | 0.0% |
| Total Occupied Housing Units | 181 | 100.0% |
Occupancy by Household Size in James Town
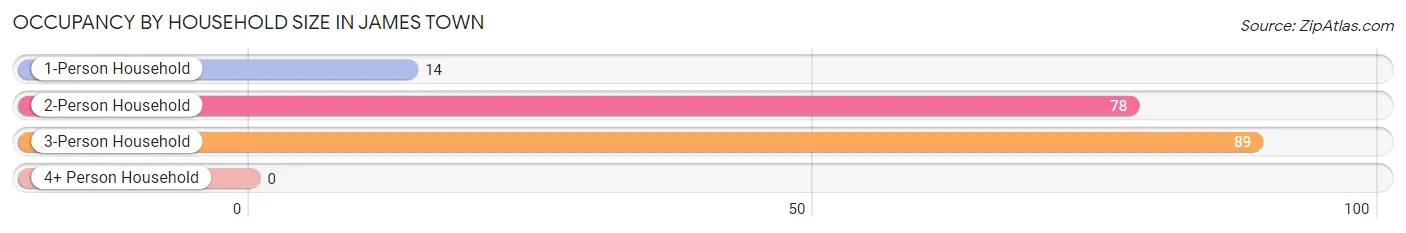
| Household Size | # Housing Units | % Housing Units |
| 1-Person Household | 14 | 7.7% |
| 2-Person Household | 78 | 43.1% |
| 3-Person Household | 89 | 49.2% |
| 4+ Person Household | 0 | 0.0% |
| Total Housing Units | 181 | 100.0% |
Occupancy by Ownership by Household Size in James Town
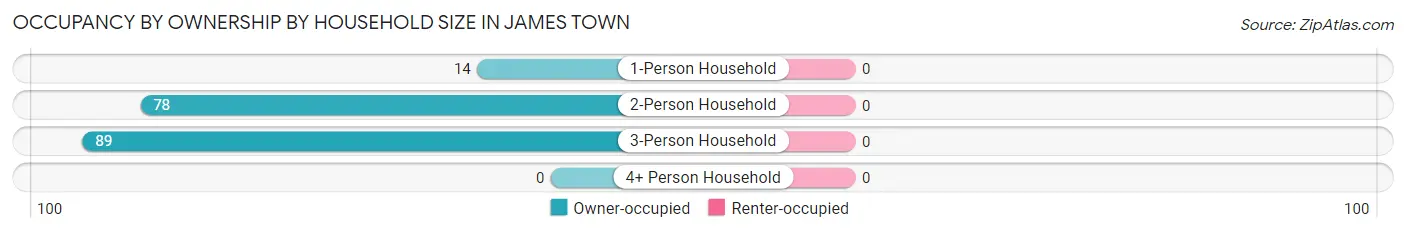
| Household Size | Owner-occupied | Renter-occupied |
| 1-Person Household | 14 (100.0%) | 0 (0.0%) |
| 2-Person Household | 78 (100.0%) | 0 (0.0%) |
| 3-Person Household | 89 (100.0%) | 0 (0.0%) |
| 4+ Person Household | 0 (0.0%) | 0 (0.0%) |
| Total Housing Units | 181 (100.0%) | 0 (0.0%) |
Occupancy by Educational Attainment in James Town
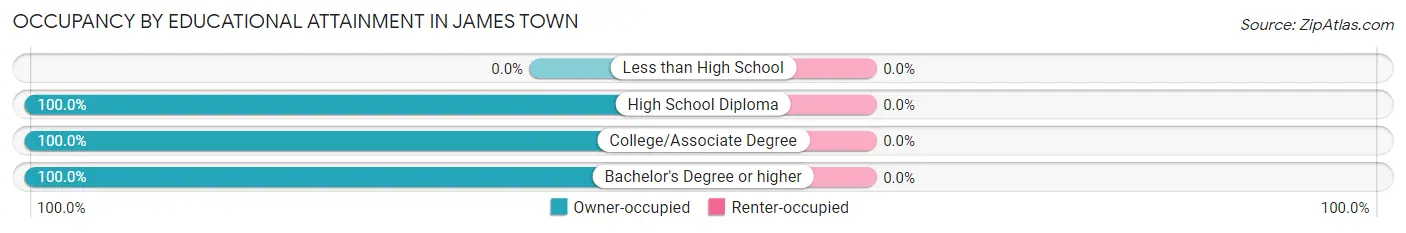
| Household Size | Owner-occupied | Renter-occupied |
| Less than High School | 0 (0.0%) | 0 (0.0%) |
| High School Diploma | 66 (100.0%) | 0 (0.0%) |
| College/Associate Degree | 103 (100.0%) | 0 (0.0%) |
| Bachelor's Degree or higher | 12 (100.0%) | 0 (0.0%) |
Occupancy by Age of Householder in James Town
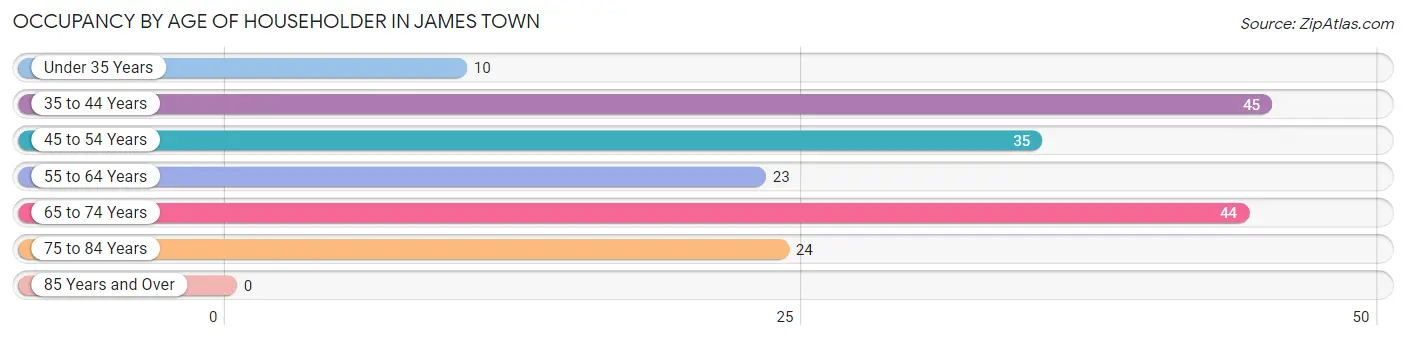
| Age Bracket | # Households | % Households |
| Under 35 Years | 10 | 5.5% |
| 35 to 44 Years | 45 | 24.9% |
| 45 to 54 Years | 35 | 19.3% |
| 55 to 64 Years | 23 | 12.7% |
| 65 to 74 Years | 44 | 24.3% |
| 75 to 84 Years | 24 | 13.3% |
| 85 Years and Over | 0 | 0.0% |
| Total | 181 | 100.0% |
Housing Finances in James Town
Median Income by Occupancy in James Town
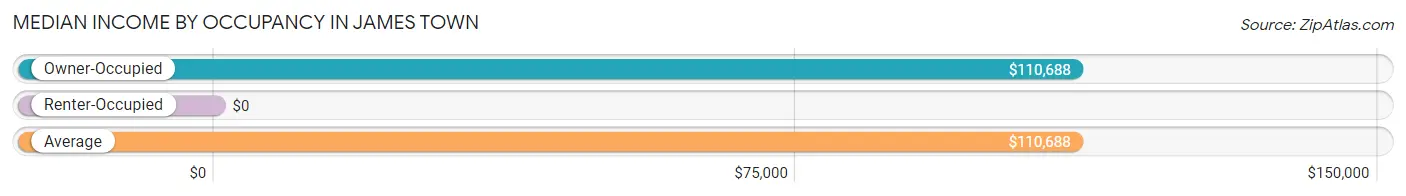
| Occupancy Type | # Households | Median Income |
| Owner-Occupied | 181 (100.0%) | $110,688 |
| Renter-Occupied | 0 (0.0%) | $0 |
| Average | 181 (100.0%) | $110,688 |
Occupancy by Householder Income Bracket in James Town
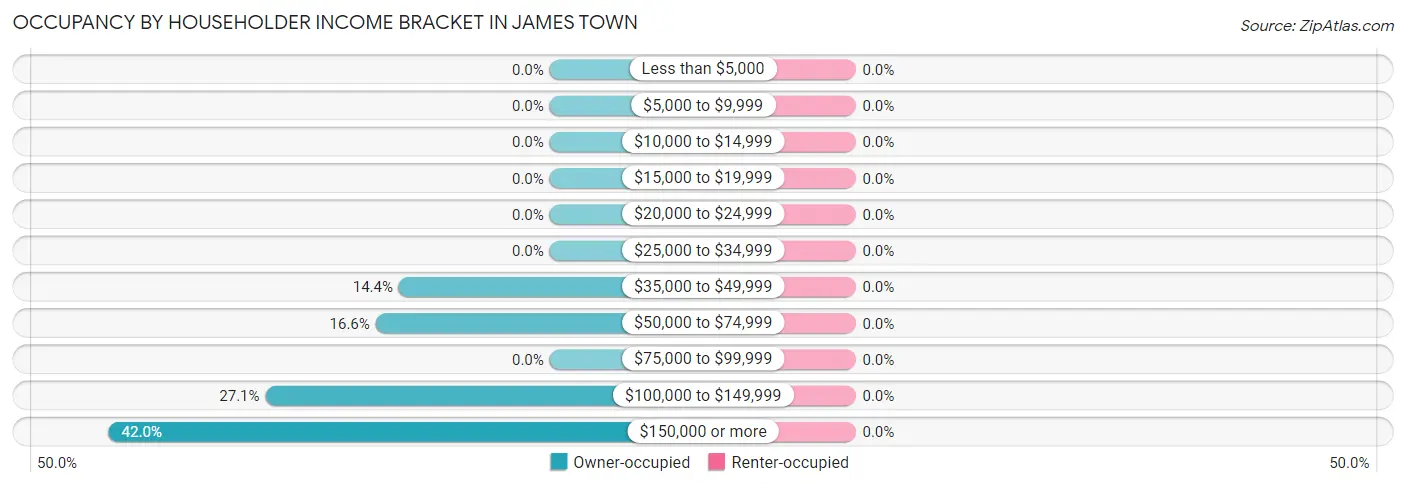
| Income Bracket | Owner-occupied | Renter-occupied |
| Less than $5,000 | 0 (0.0%) | 0 (0.0%) |
| $5,000 to $9,999 | 0 (0.0%) | 0 (0.0%) |
| $10,000 to $14,999 | 0 (0.0%) | 0 (0.0%) |
| $15,000 to $19,999 | 0 (0.0%) | 0 (0.0%) |
| $20,000 to $24,999 | 0 (0.0%) | 0 (0.0%) |
| $25,000 to $34,999 | 0 (0.0%) | 0 (0.0%) |
| $35,000 to $49,999 | 26 (14.4%) | 0 (0.0%) |
| $50,000 to $74,999 | 30 (16.6%) | 0 (0.0%) |
| $75,000 to $99,999 | 0 (0.0%) | 0 (0.0%) |
| $100,000 to $149,999 | 49 (27.1%) | 0 (0.0%) |
| $150,000 or more | 76 (42.0%) | 0 (0.0%) |
| Total | 181 (100.0%) | 0 (0.0%) |
Monthly Housing Cost Tiers in James Town
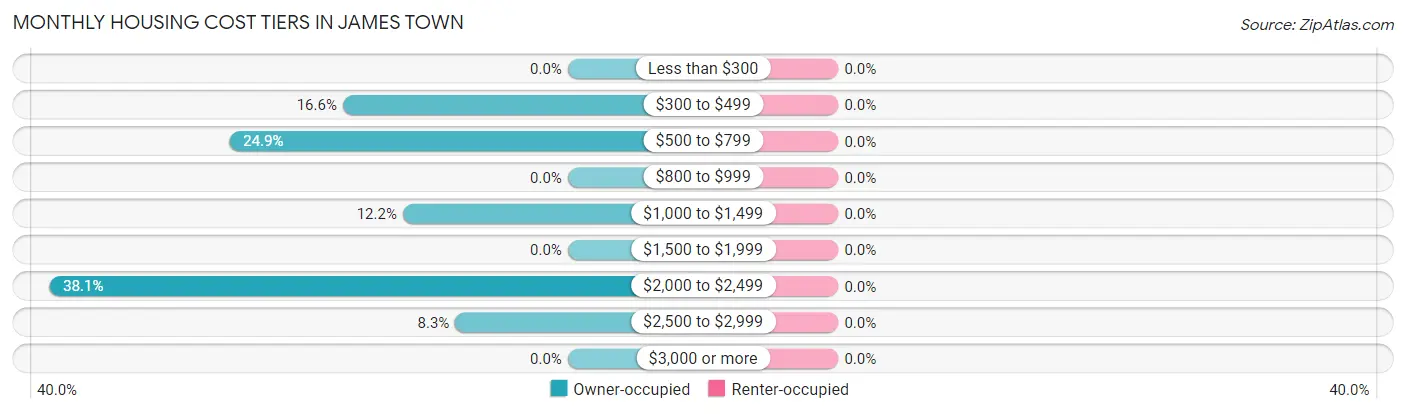
| Monthly Cost | Owner-occupied | Renter-occupied |
| Less than $300 | 0 (0.0%) | 0 (0.0%) |
| $300 to $499 | 30 (16.6%) | 0 (0.0%) |
| $500 to $799 | 45 (24.9%) | 0 (0.0%) |
| $800 to $999 | 0 (0.0%) | 0 (0.0%) |
| $1,000 to $1,499 | 22 (12.1%) | 0 (0.0%) |
| $1,500 to $1,999 | 0 (0.0%) | 0 (0.0%) |
| $2,000 to $2,499 | 69 (38.1%) | 0 (0.0%) |
| $2,500 to $2,999 | 15 (8.3%) | 0 (0.0%) |
| $3,000 or more | 0 (0.0%) | 0 (0.0%) |
| Total | 181 (100.0%) | 0 (0.0%) |
Physical Housing Characteristics in James Town
Housing Structures in James Town
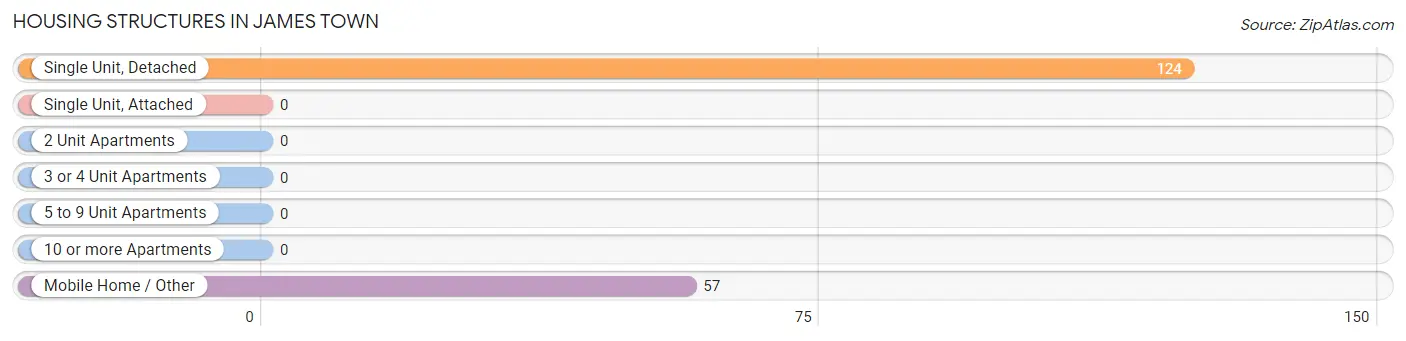
| Structure Type | # Housing Units | % Housing Units |
| Single Unit, Detached | 124 | 68.5% |
| Single Unit, Attached | 0 | 0.0% |
| 2 Unit Apartments | 0 | 0.0% |
| 3 or 4 Unit Apartments | 0 | 0.0% |
| 5 to 9 Unit Apartments | 0 | 0.0% |
| 10 or more Apartments | 0 | 0.0% |
| Mobile Home / Other | 57 | 31.5% |
| Total | 181 | 100.0% |
Housing Structures by Occupancy in James Town
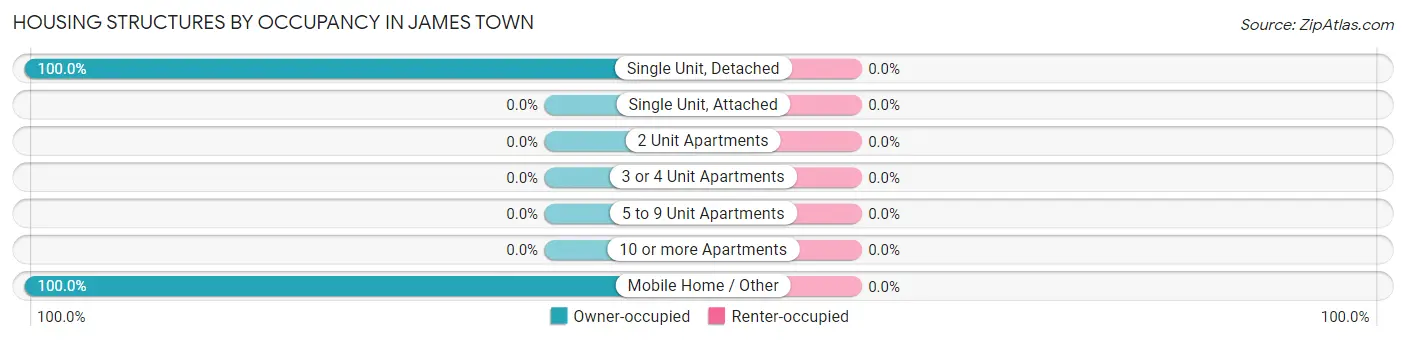
| Structure Type | Owner-occupied | Renter-occupied |
| Single Unit, Detached | 124 (100.0%) | 0 (0.0%) |
| Single Unit, Attached | 0 (0.0%) | 0 (0.0%) |
| 2 Unit Apartments | 0 (0.0%) | 0 (0.0%) |
| 3 or 4 Unit Apartments | 0 (0.0%) | 0 (0.0%) |
| 5 to 9 Unit Apartments | 0 (0.0%) | 0 (0.0%) |
| 10 or more Apartments | 0 (0.0%) | 0 (0.0%) |
| Mobile Home / Other | 57 (100.0%) | 0 (0.0%) |
| Total | 181 (100.0%) | 0 (0.0%) |
Housing Structures by Number of Rooms in James Town
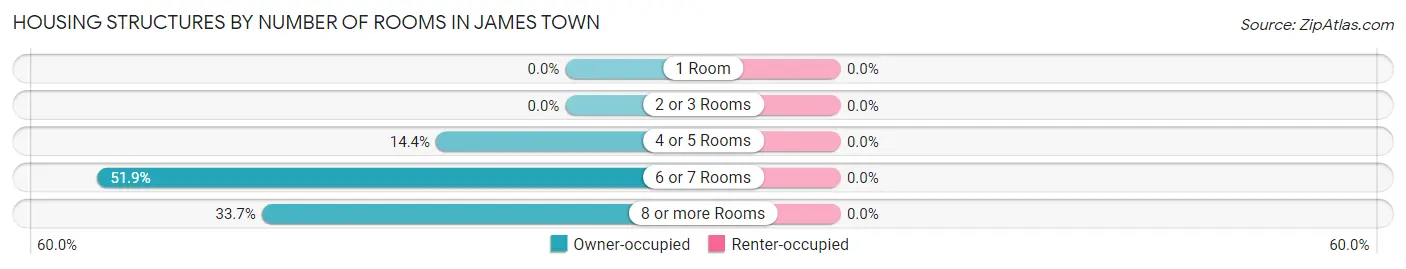
| Number of Rooms | Owner-occupied | Renter-occupied |
| 1 Room | 0 (0.0%) | 0 (0.0%) |
| 2 or 3 Rooms | 0 (0.0%) | 0 (0.0%) |
| 4 or 5 Rooms | 26 (14.4%) | 0 (0.0%) |
| 6 or 7 Rooms | 94 (51.9%) | 0 (0.0%) |
| 8 or more Rooms | 61 (33.7%) | 0 (0.0%) |
| Total | 181 (100.0%) | 0 (0.0%) |
Housing Structure by Heating Type in James Town
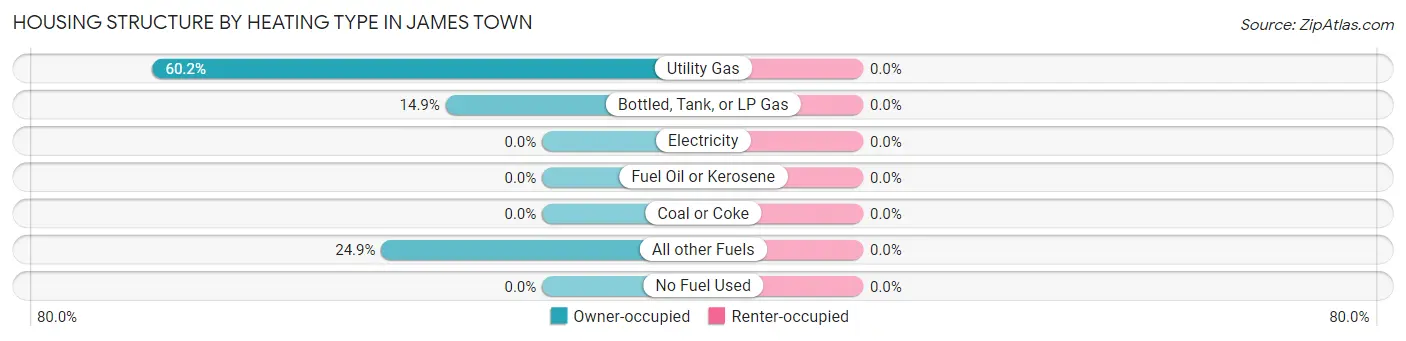
| Heating Type | Owner-occupied | Renter-occupied |
| Utility Gas | 109 (60.2%) | 0 (0.0%) |
| Bottled, Tank, or LP Gas | 27 (14.9%) | 0 (0.0%) |
| Electricity | 0 (0.0%) | 0 (0.0%) |
| Fuel Oil or Kerosene | 0 (0.0%) | 0 (0.0%) |
| Coal or Coke | 0 (0.0%) | 0 (0.0%) |
| All other Fuels | 45 (24.9%) | 0 (0.0%) |
| No Fuel Used | 0 (0.0%) | 0 (0.0%) |
| Total | 181 (100.0%) | 0 (0.0%) |
Household Vehicle Usage in James Town
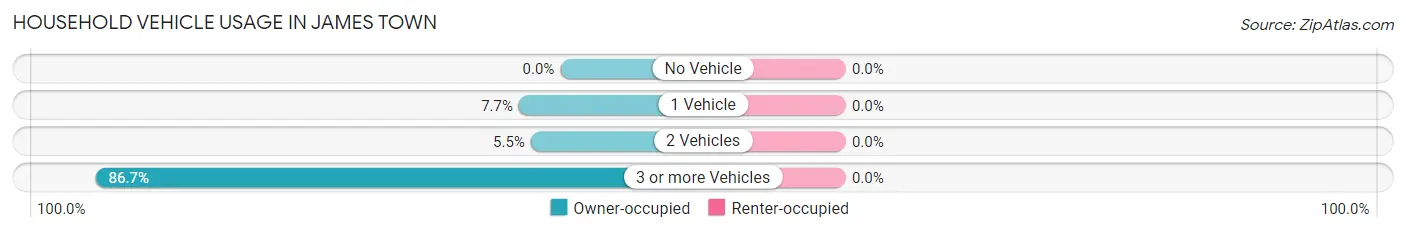
| Vehicles per Household | Owner-occupied | Renter-occupied |
| No Vehicle | 0 (0.0%) | 0 (0.0%) |
| 1 Vehicle | 14 (7.7%) | 0 (0.0%) |
| 2 Vehicles | 10 (5.5%) | 0 (0.0%) |
| 3 or more Vehicles | 157 (86.7%) | 0 (0.0%) |
| Total | 181 (100.0%) | 0 (0.0%) |
Real Estate & Mortgages in James Town
Real Estate and Mortgage Overview in James Town
| Characteristic | Without Mortgage | With Mortgage |
| Housing Units | 61 | 120 |
| Median Property Value | $444,000 | $335,600 |
| Median Household Income | $69,042 | $64 |
| Monthly Housing Costs | $503 | $0 |
| Real Estate Taxes | - | - |
Property Value by Mortgage Status in James Town
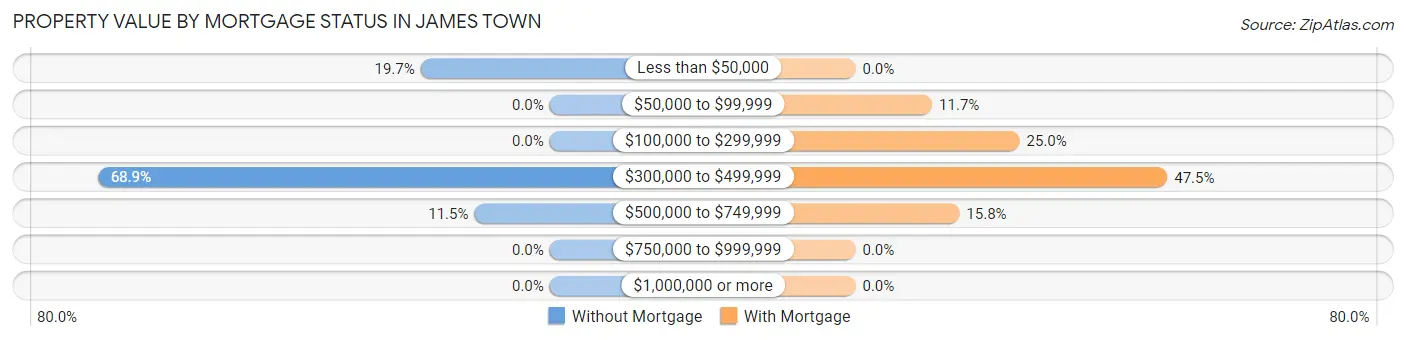
| Property Value | Without Mortgage | With Mortgage |
| Less than $50,000 | 12 (19.7%) | 0 (0.0%) |
| $50,000 to $99,999 | 0 (0.0%) | 14 (11.7%) |
| $100,000 to $299,999 | 0 (0.0%) | 30 (25.0%) |
| $300,000 to $499,999 | 42 (68.9%) | 57 (47.5%) |
| $500,000 to $749,999 | 7 (11.5%) | 19 (15.8%) |
| $750,000 to $999,999 | 0 (0.0%) | 0 (0.0%) |
| $1,000,000 or more | 0 (0.0%) | 0 (0.0%) |
| Total | 61 (100.0%) | 120 (100.0%) |
Household Income by Mortgage Status in James Town
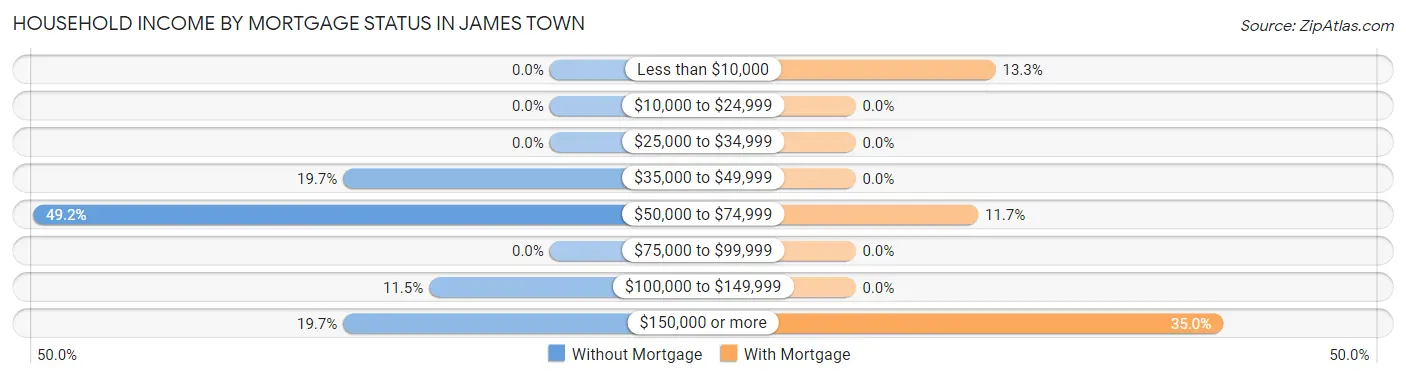
| Household Income | Without Mortgage | With Mortgage |
| Less than $10,000 | 0 (0.0%) | 16 (13.3%) |
| $10,000 to $24,999 | 0 (0.0%) | 0 (0.0%) |
| $25,000 to $34,999 | 0 (0.0%) | 0 (0.0%) |
| $35,000 to $49,999 | 12 (19.7%) | 0 (0.0%) |
| $50,000 to $74,999 | 30 (49.2%) | 14 (11.7%) |
| $75,000 to $99,999 | 0 (0.0%) | 0 (0.0%) |
| $100,000 to $149,999 | 7 (11.5%) | 0 (0.0%) |
| $150,000 or more | 12 (19.7%) | 42 (35.0%) |
| Total | 61 (100.0%) | 120 (100.0%) |
Property Value to Household Income Ratio in James Town
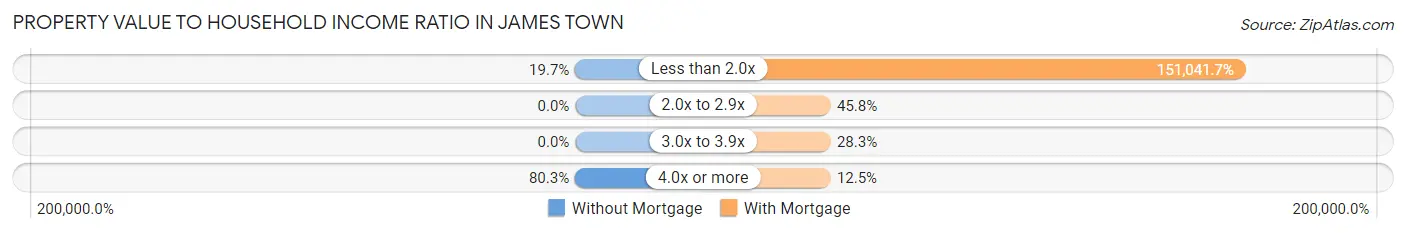
| Value-to-Income Ratio | Without Mortgage | With Mortgage |
| Less than 2.0x | 12 (19.7%) | 181,250 (151,041.7%) |
| 2.0x to 2.9x | 0 (0.0%) | 55 (45.8%) |
| 3.0x to 3.9x | 0 (0.0%) | 34 (28.3%) |
| 4.0x or more | 49 (80.3%) | 15 (12.5%) |
| Total | 61 (100.0%) | 120 (100.0%) |
Real Estate Taxes by Mortgage Status in James Town
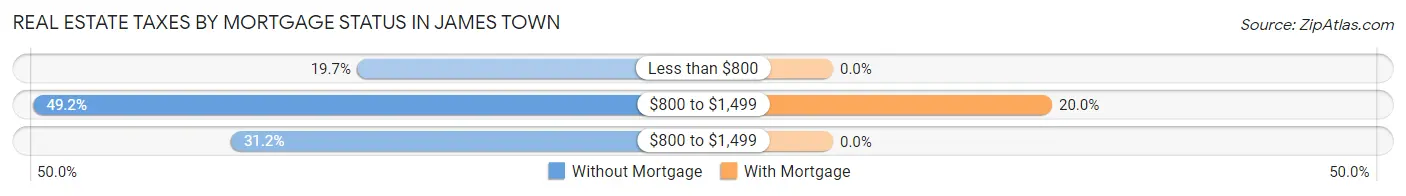
| Property Taxes | Without Mortgage | With Mortgage |
| Less than $800 | 12 (19.7%) | 0 (0.0%) |
| $800 to $1,499 | 30 (49.2%) | 24 (20.0%) |
| $800 to $1,499 | 19 (31.1%) | 0 (0.0%) |
| Total | 61 (100.0%) | 120 (100.0%) |
Health & Disability in James Town
Health Insurance Coverage by Age in James Town
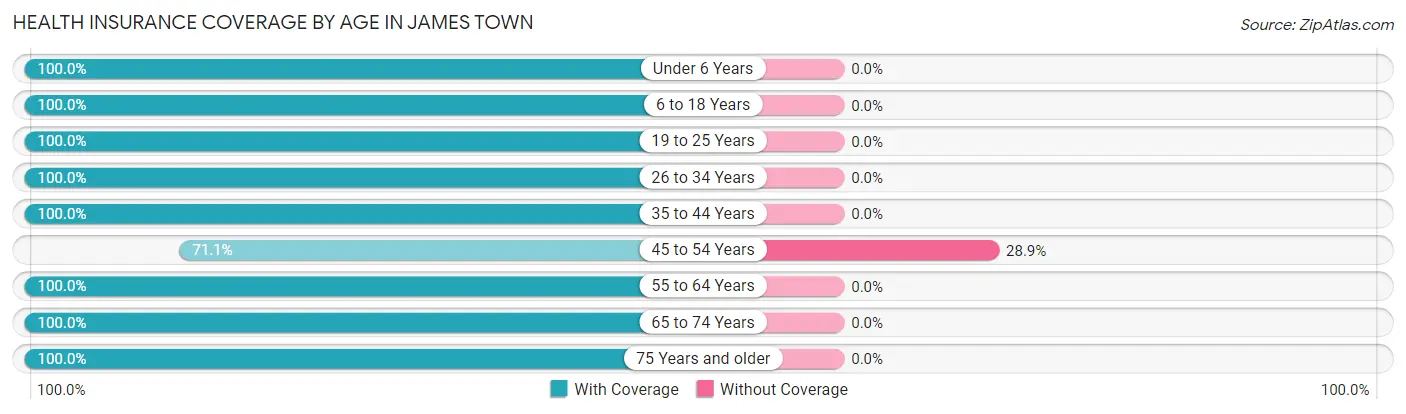
| Age Bracket | With Coverage | Without Coverage |
| Under 6 Years | 59 (100.0%) | 0 (0.0%) |
| 6 to 18 Years | 15 (100.0%) | 0 (0.0%) |
| 19 to 25 Years | 33 (100.0%) | 0 (0.0%) |
| 26 to 34 Years | 12 (100.0%) | 0 (0.0%) |
| 35 to 44 Years | 119 (100.0%) | 0 (0.0%) |
| 45 to 54 Years | 69 (71.1%) | 28 (28.9%) |
| 55 to 64 Years | 37 (100.0%) | 0 (0.0%) |
| 65 to 74 Years | 83 (100.0%) | 0 (0.0%) |
| 75 Years and older | 53 (100.0%) | 0 (0.0%) |
| Total | 480 (94.5%) | 28 (5.5%) |
Health Insurance Coverage by Citizenship Status in James Town
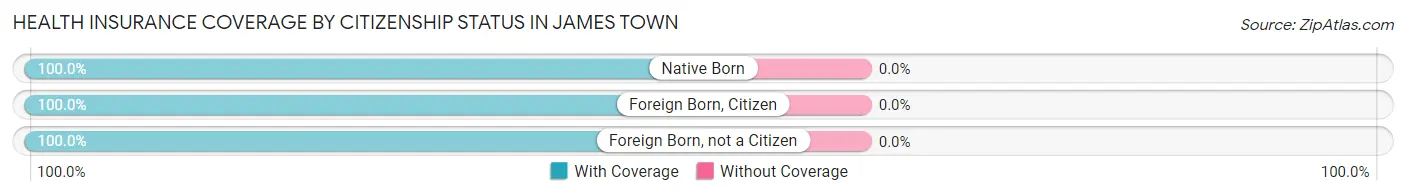
| Citizenship Status | With Coverage | Without Coverage |
| Native Born | 59 (100.0%) | 0 (0.0%) |
| Foreign Born, Citizen | 15 (100.0%) | 0 (0.0%) |
| Foreign Born, not a Citizen | 33 (100.0%) | 0 (0.0%) |
Health Insurance Coverage by Household Income in James Town
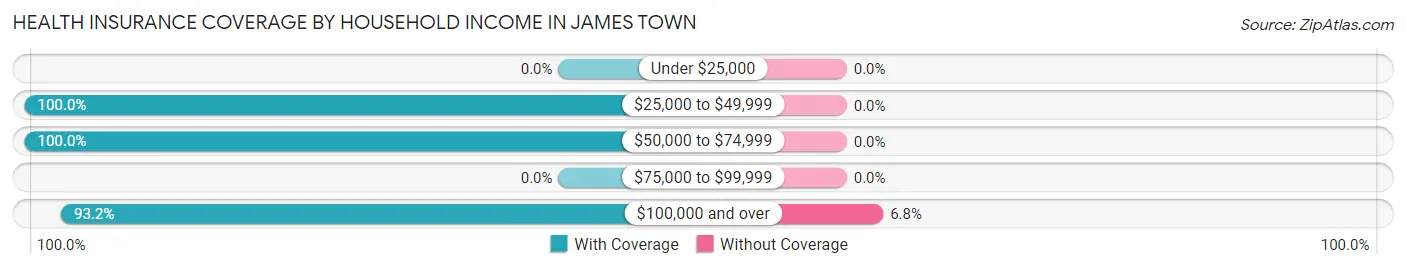
| Household Income | With Coverage | Without Coverage |
| Under $25,000 | 0 (0.0%) | 0 (0.0%) |
| $25,000 to $49,999 | 39 (100.0%) | 0 (0.0%) |
| $50,000 to $74,999 | 59 (100.0%) | 0 (0.0%) |
| $75,000 to $99,999 | 0 (0.0%) | 0 (0.0%) |
| $100,000 and over | 382 (93.2%) | 28 (6.8%) |
Public vs Private Health Insurance Coverage by Age in James Town
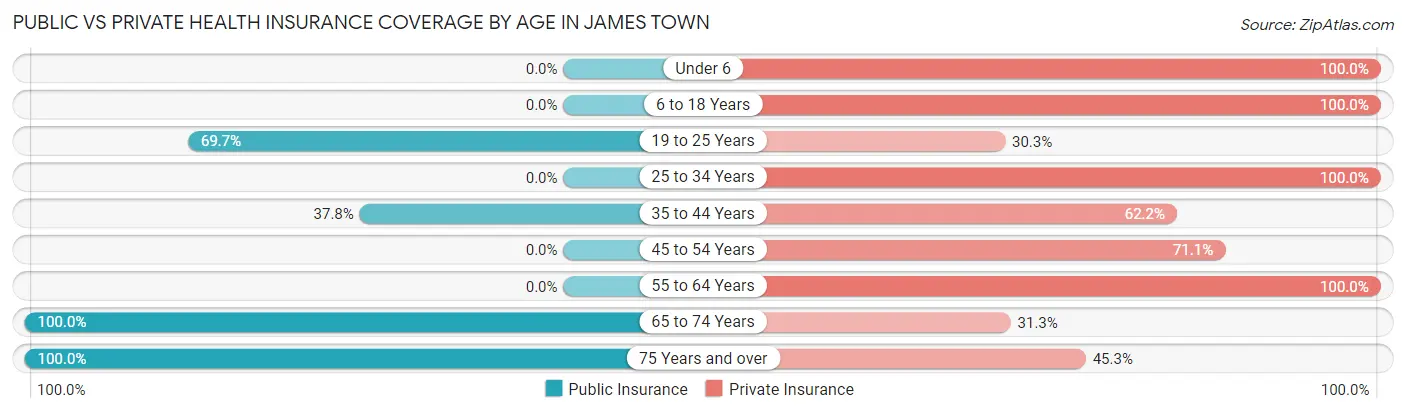
| Age Bracket | Public Insurance | Private Insurance |
| Under 6 | 0 (0.0%) | 59 (100.0%) |
| 6 to 18 Years | 0 (0.0%) | 15 (100.0%) |
| 19 to 25 Years | 23 (69.7%) | 10 (30.3%) |
| 25 to 34 Years | 0 (0.0%) | 12 (100.0%) |
| 35 to 44 Years | 45 (37.8%) | 74 (62.2%) |
| 45 to 54 Years | 0 (0.0%) | 69 (71.1%) |
| 55 to 64 Years | 0 (0.0%) | 37 (100.0%) |
| 65 to 74 Years | 83 (100.0%) | 26 (31.3%) |
| 75 Years and over | 53 (100.0%) | 24 (45.3%) |
| Total | 204 (40.2%) | 326 (64.2%) |
Disability Status by Sex by Age in James Town
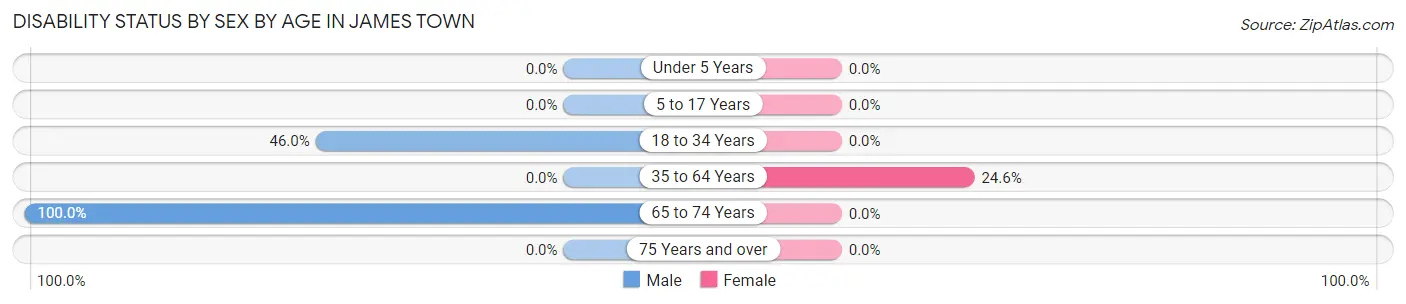
| Age Bracket | Male | Female |
| Under 5 Years | 0 (0.0%) | 0 (0.0%) |
| 5 to 17 Years | 0 (0.0%) | 0 (0.0%) |
| 18 to 34 Years | 23 (46.0%) | 0 (0.0%) |
| 35 to 64 Years | 0 (0.0%) | 33 (24.6%) |
| 65 to 74 Years | 27 (100.0%) | 0 (0.0%) |
| 75 Years and over | 0 (0.0%) | 0 (0.0%) |
Disability Class by Sex by Age in James Town
Disability Class: Hearing Difficulty
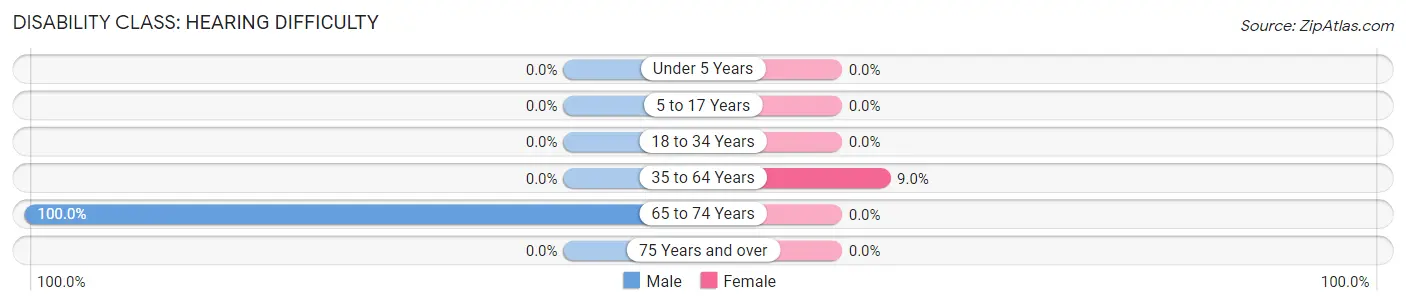
| Age Bracket | Male | Female |
| Under 5 Years | 0 (0.0%) | 0 (0.0%) |
| 5 to 17 Years | 0 (0.0%) | 0 (0.0%) |
| 18 to 34 Years | 0 (0.0%) | 0 (0.0%) |
| 35 to 64 Years | 0 (0.0%) | 12 (9.0%) |
| 65 to 74 Years | 27 (100.0%) | 0 (0.0%) |
| 75 Years and over | 0 (0.0%) | 0 (0.0%) |
Disability Class: Vision Difficulty
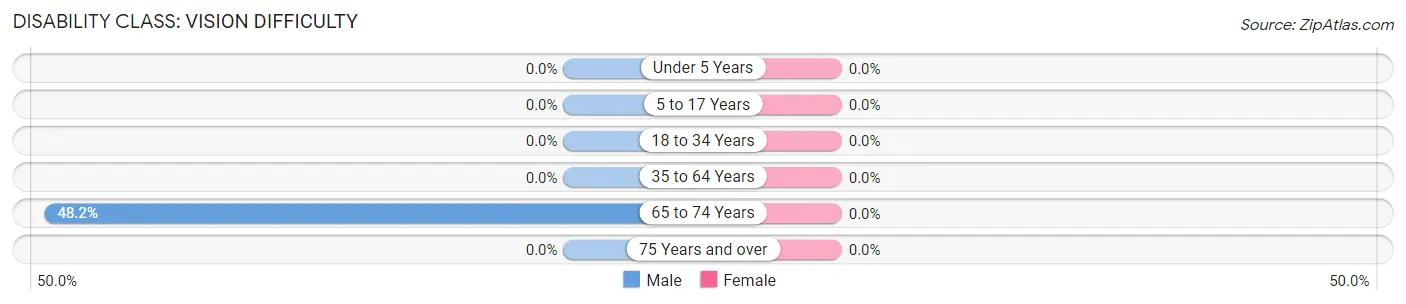
| Age Bracket | Male | Female |
| Under 5 Years | 0 (0.0%) | 0 (0.0%) |
| 5 to 17 Years | 0 (0.0%) | 0 (0.0%) |
| 18 to 34 Years | 0 (0.0%) | 0 (0.0%) |
| 35 to 64 Years | 0 (0.0%) | 0 (0.0%) |
| 65 to 74 Years | 13 (48.1%) | 0 (0.0%) |
| 75 Years and over | 0 (0.0%) | 0 (0.0%) |
Disability Class: Cognitive Difficulty
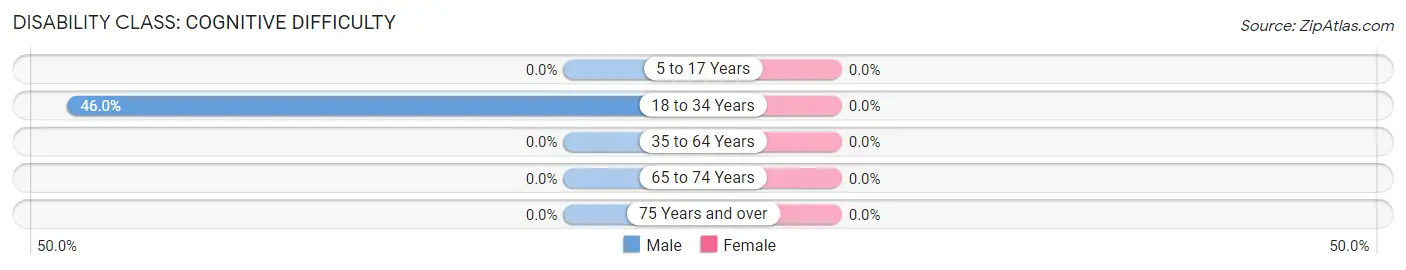
| Age Bracket | Male | Female |
| 5 to 17 Years | 0 (0.0%) | 0 (0.0%) |
| 18 to 34 Years | 23 (46.0%) | 0 (0.0%) |
| 35 to 64 Years | 0 (0.0%) | 0 (0.0%) |
| 65 to 74 Years | 0 (0.0%) | 0 (0.0%) |
| 75 Years and over | 0 (0.0%) | 0 (0.0%) |
Disability Class: Ambulatory Difficulty
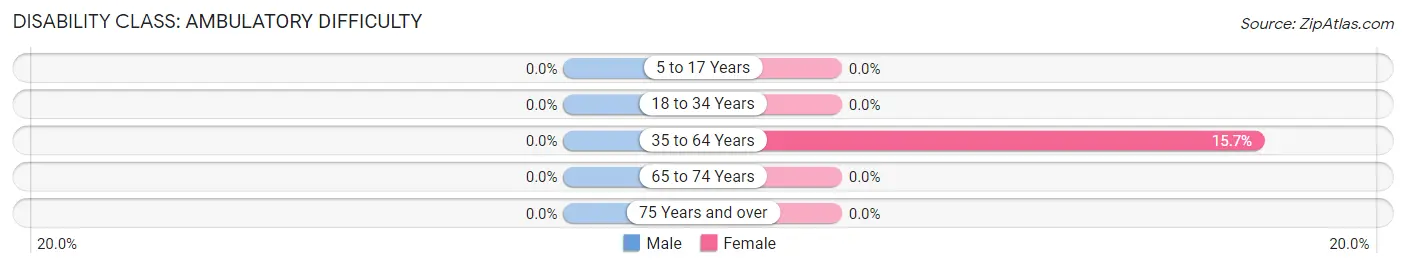
| Age Bracket | Male | Female |
| 5 to 17 Years | 0 (0.0%) | 0 (0.0%) |
| 18 to 34 Years | 0 (0.0%) | 0 (0.0%) |
| 35 to 64 Years | 0 (0.0%) | 21 (15.7%) |
| 65 to 74 Years | 0 (0.0%) | 0 (0.0%) |
| 75 Years and over | 0 (0.0%) | 0 (0.0%) |
Disability Class: Self-Care Difficulty
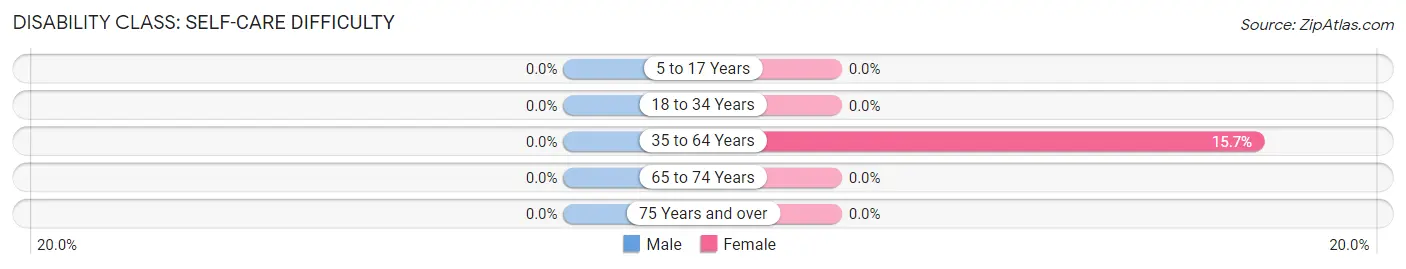
| Age Bracket | Male | Female |
| 5 to 17 Years | 0 (0.0%) | 0 (0.0%) |
| 18 to 34 Years | 0 (0.0%) | 0 (0.0%) |
| 35 to 64 Years | 0 (0.0%) | 21 (15.7%) |
| 65 to 74 Years | 0 (0.0%) | 0 (0.0%) |
| 75 Years and over | 0 (0.0%) | 0 (0.0%) |
Technology Access in James Town
Computing Device Access in James Town
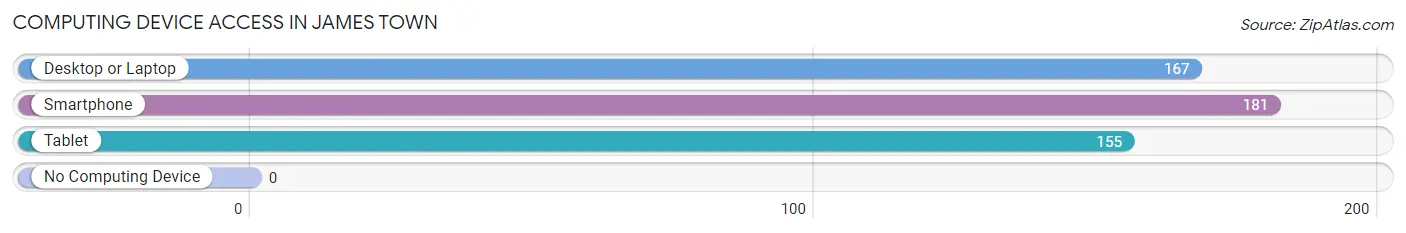
| Device Type | # Households | % Households |
| Desktop or Laptop | 167 | 92.3% |
| Smartphone | 181 | 100.0% |
| Tablet | 155 | 85.6% |
| No Computing Device | 0 | 0.0% |
| Total | 181 | 100.0% |
Internet Access in James Town
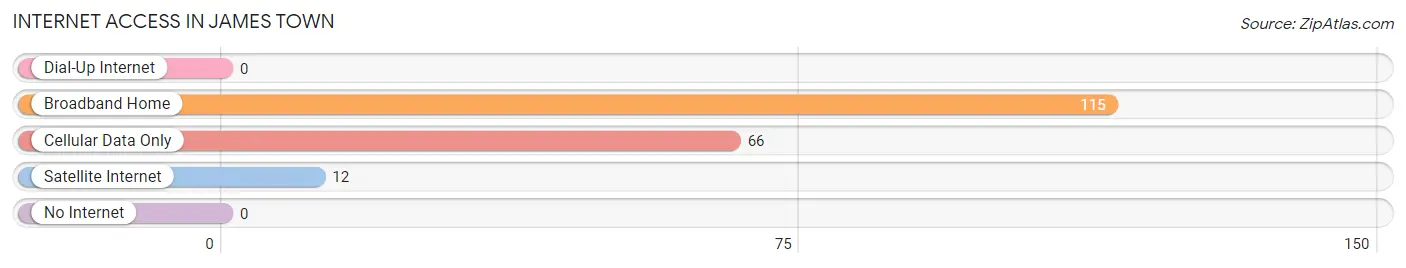
| Internet Type | # Households | % Households |
| Dial-Up Internet | 0 | 0.0% |
| Broadband Home | 115 | 63.5% |
| Cellular Data Only | 66 | 36.5% |
| Satellite Internet | 12 | 6.6% |
| No Internet | 0 | 0.0% |
| Total | 181 | 100.0% |
James Town Summary
Introduction
James Town is a small town located in the state of Wyoming, United States. It is situated in the northern part of the state, near the border with Montana. The town has a population of just over 500 people, and is a rural community with a strong agricultural base. The town is known for its scenic beauty, and is a popular destination for tourists and outdoor enthusiasts.
History
James Town was founded in 1882 by James and Mary Ann Smith, who were homesteaders from Iowa. The town was named after James Smith, and the Smiths were the first settlers in the area. The town grew slowly, and by the early 1900s, it had a population of around 200 people.
In the early 1900s, the town was a center for the cattle industry, and many of the local ranchers raised cattle for sale. The town also had a number of small businesses, including a general store, a blacksmith, and a saloon.
In the 1920s, the town began to experience a decline in population, as many of the local ranchers moved away. The town was also affected by the Great Depression, and many of the businesses closed.
In the 1950s, the town began to experience a resurgence, as the local economy began to diversify. The town was now home to a number of small businesses, including a grocery store, a hardware store, and a gas station.
Geography
James Town is located in the northern part of Wyoming, near the border with Montana. The town is situated in a valley, surrounded by mountains and hills. The town is located at an elevation of 4,800 feet, and the climate is semi-arid, with hot summers and cold winters.
The town is located near the Big Horn River, which is a popular destination for fishing and other outdoor activities. The town is also located near the Big Horn National Forest, which is a popular destination for camping, hiking, and other outdoor activities.
Economy
The economy of James Town is largely based on agriculture and tourism. The town is home to a number of small businesses, including a grocery store, a hardware store, and a gas station. The town is also home to a number of tourist attractions, including the Big Horn National Forest and the Big Horn River.
The town is also home to a number of small manufacturing businesses, including a furniture factory and a woodworking shop. The town is also home to a number of small farms, which produce a variety of crops, including wheat, corn, and hay.
Demographics
As of the 2010 census, the population of James Town was 514 people. The town is predominantly white, with a small Hispanic population. The median age of the population is 44 years, and the median household income is $41,000.
Conclusion
James Town is a small town located in the northern part of Wyoming, near the border with Montana. The town has a population of just over 500 people, and is a rural community with a strong agricultural base. The town is known for its scenic beauty, and is a popular destination for tourists and outdoor enthusiasts. The economy of the town is largely based on agriculture and tourism, and the town is home to a number of small businesses and tourist attractions. The town is predominantly white, with a small Hispanic population, and the median age of the population is 44 years.
Common Questions
What is Per Capita Income in James Town?
Per Capita income in James Town is $54,342.
What is the Median Household income in James Town?
Median Household Income in James Town is $110,688.
What is Income or Wage Gap in James Town?
Income or Wage Gap in James Town is 58.2%.
Women in James Town earn 41.8 cents for every dollar earned by a man.
What is Inequality or Gini Index in James Town?
Inequality or Gini Index in James Town is 0.27.
What is the Total Population of James Town?
Total Population of James Town is 508.
What is the Total Male Population of James Town?
Total Male Population of James Town is 249.
What is the Total Female Population of James Town?
Total Female Population of James Town is 259.
What is the Ratio of Males per 100 Females in James Town?
There are 96.14 Males per 100 Females in James Town.
What is the Ratio of Females per 100 Males in James Town?
There are 104.02 Females per 100 Males in James Town.
What is the Median Population Age in James Town?
Median Population Age in James Town is 49.0 Years.
What is the Average Family Size in James Town
Average Family Size in James Town is 3.0 People.
What is the Average Household Size in James Town
Average Household Size in James Town is 2.8 People.
How Large is the Labor Force in James Town?
There are 267 People in the Labor Forcein in James Town.
What is the Percentage of People in the Labor Force in James Town?
59.5% of People are in the Labor Force in James Town.