La Grange, WY Map & Demographics
La Grange Overview
$19,748
PER CAPITA INCOME
$46,912
AVG FAMILY INCOME
$45,478
AVG HOUSEHOLD INCOME
0.41
INEQUALITY / GINI INDEX
356
TOTAL POPULATION
228
MALE POPULATION
128
FEMALE POPULATION
178.12
MALES / 100 FEMALES
56.14
FEMALES / 100 MALES
25.3
MEDIAN AGE
2.4
AVG FAMILY SIZE
1.9
AVG HOUSEHOLD SIZE
178
LABOR FORCE [ PEOPLE ]
57.2%
PERCENT IN LABOR FORCE
3.4%
UNEMPLOYMENT RATE
Income in La Grange
Income Overview in La Grange
Per Capita Income in La Grange is $19,748, while median incomes of families and households are $46,912 and $45,478 respectively.
| Characteristic | Number | Measure |
| Per Capita Income | 356 | $19,748 |
| Median Family Income | 82 | $46,912 |
| Mean Family Income | 82 | $69,472 |
| Median Household Income | 137 | $45,478 |
| Mean Household Income | 137 | $51,993 |
| Income Deficit | 82 | $0 |
| Wage / Income Gap (%) | 356 | 0.00% |
| Wage / Income Gap ($) | 356 | 100.00¢ per $1 |
| Gini / Inequality Index | 356 | 0.41 |
Earnings by Sex in La Grange
| Sex | Number | Average Earnings |
| Male | 138 (62.7%) | $0 |
| Female | 82 (37.3%) | $0 |
| Total | 220 (100.0%) | $0 |
Earnings by Sex by Income Bracket in La Grange
The most common earnings brackets in La Grange are $5,000 to $7,499 for men (47 | 34.1%) and $2,499 or less for women (17 | 20.7%).
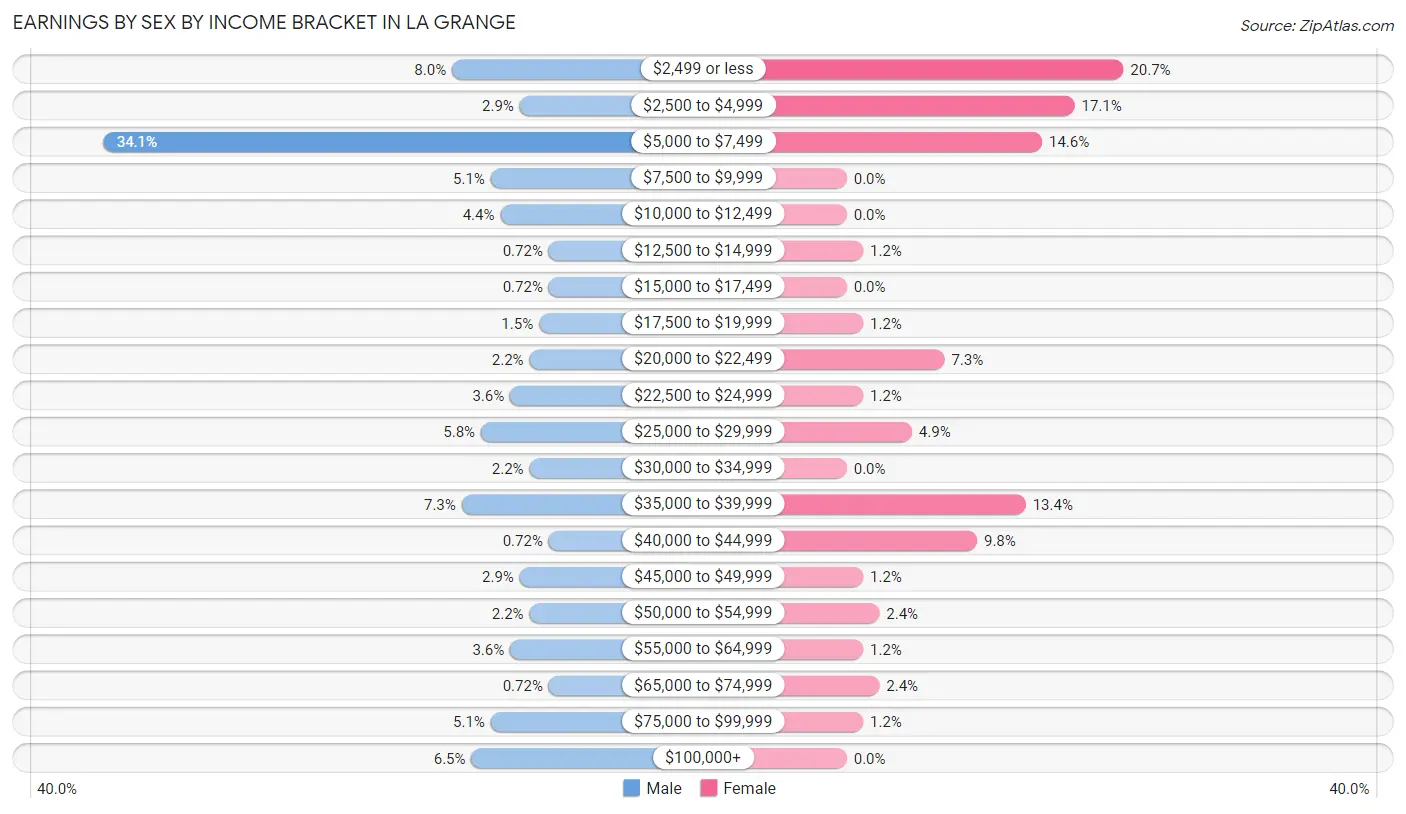
| Income | Male | Female |
| $2,499 or less | 11 (8.0%) | 17 (20.7%) |
| $2,500 to $4,999 | 4 (2.9%) | 14 (17.1%) |
| $5,000 to $7,499 | 47 (34.1%) | 12 (14.6%) |
| $7,500 to $9,999 | 7 (5.1%) | 0 (0.0%) |
| $10,000 to $12,499 | 6 (4.3%) | 0 (0.0%) |
| $12,500 to $14,999 | 1 (0.7%) | 1 (1.2%) |
| $15,000 to $17,499 | 1 (0.7%) | 0 (0.0%) |
| $17,500 to $19,999 | 2 (1.5%) | 1 (1.2%) |
| $20,000 to $22,499 | 3 (2.2%) | 6 (7.3%) |
| $22,500 to $24,999 | 5 (3.6%) | 1 (1.2%) |
| $25,000 to $29,999 | 8 (5.8%) | 4 (4.9%) |
| $30,000 to $34,999 | 3 (2.2%) | 0 (0.0%) |
| $35,000 to $39,999 | 10 (7.2%) | 11 (13.4%) |
| $40,000 to $44,999 | 1 (0.7%) | 8 (9.8%) |
| $45,000 to $49,999 | 4 (2.9%) | 1 (1.2%) |
| $50,000 to $54,999 | 3 (2.2%) | 2 (2.4%) |
| $55,000 to $64,999 | 5 (3.6%) | 1 (1.2%) |
| $65,000 to $74,999 | 1 (0.7%) | 2 (2.4%) |
| $75,000 to $99,999 | 7 (5.1%) | 1 (1.2%) |
| $100,000+ | 9 (6.5%) | 0 (0.0%) |
| Total | 138 (100.0%) | 82 (100.0%) |
Earnings by Sex by Educational Attainment in La Grange
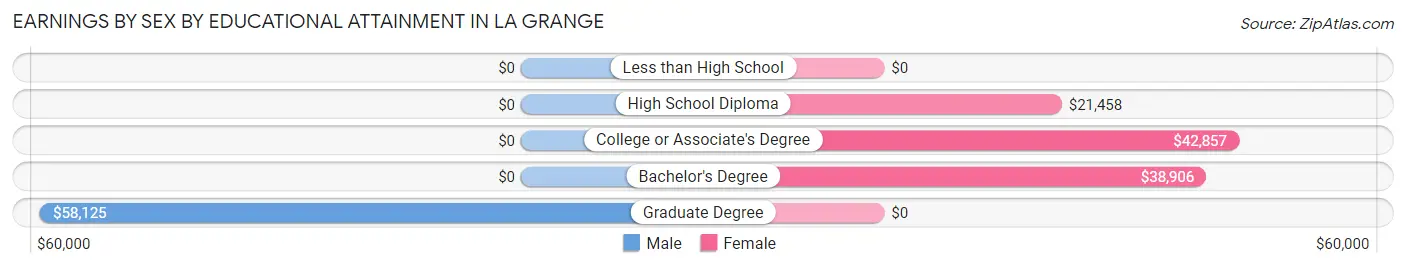
| Educational Attainment | Male Income | Female Income |
| Less than High School | - | - |
| High School Diploma | - | - |
| College or Associate's Degree | - | - |
| Bachelor's Degree | - | - |
| Graduate Degree | $58,125 | $0 |
| Total | - | - |
Family Income in La Grange
Family Income Brackets in La Grange
According to the La Grange family income data, there are 37 families falling into the $35,000 to $49,999 income range, which is the most common income bracket and makes up 45.1% of all families.
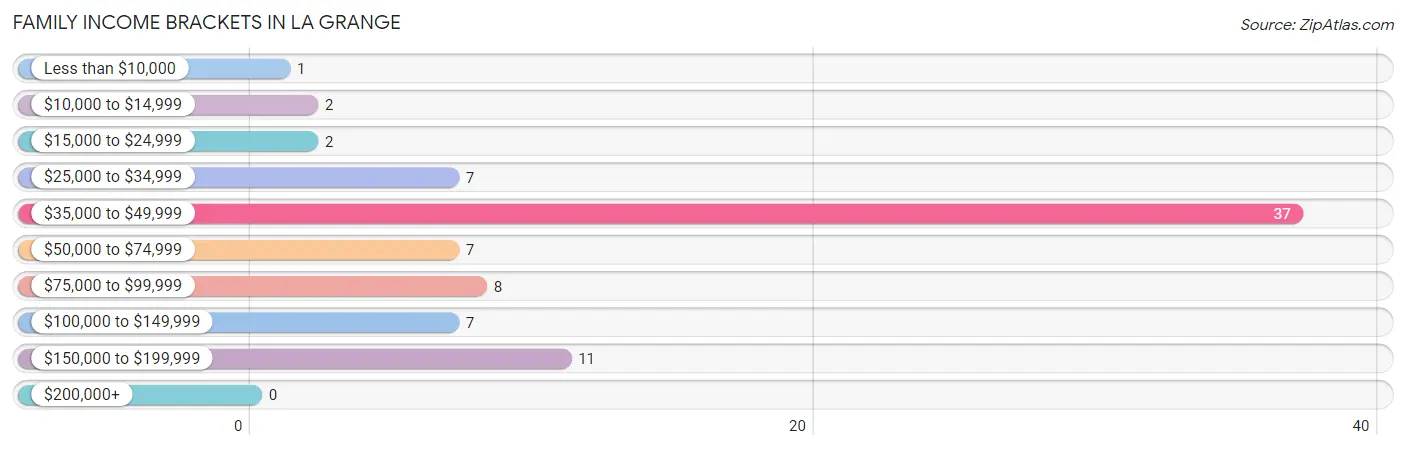
| Income Bracket | # Families | % Families |
| Less than $10,000 | 1 | 1.2% |
| $10,000 to $14,999 | 2 | 2.4% |
| $15,000 to $24,999 | 2 | 2.4% |
| $25,000 to $34,999 | 7 | 8.5% |
| $35,000 to $49,999 | 37 | 45.1% |
| $50,000 to $74,999 | 7 | 8.5% |
| $75,000 to $99,999 | 8 | 9.8% |
| $100,000 to $149,999 | 7 | 8.5% |
| $150,000 to $199,999 | 11 | 13.4% |
| $200,000+ | 0 | 0.0% |
Family Income by Famaliy Size in La Grange
2-person families (24 | 29.3%) account for the highest median family income in La Grange with $90,000 per family, while 2-person families (24 | 29.3%) have the highest median income of $45,000 per family member.
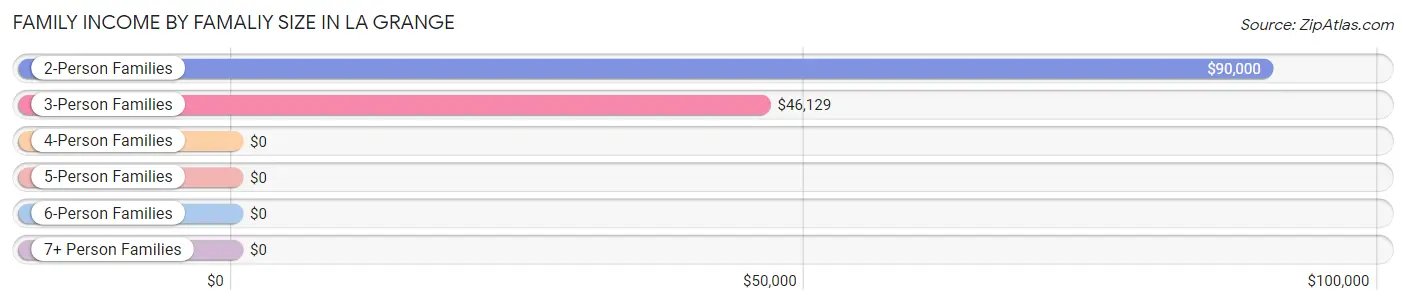
| Income Bracket | # Families | Median Income |
| 2-Person Families | 24 (29.3%) | $90,000 |
| 3-Person Families | 40 (48.8%) | $46,129 |
| 4-Person Families | 15 (18.3%) | $0 |
| 5-Person Families | 0 (0.0%) | $0 |
| 6-Person Families | 2 (2.4%) | $0 |
| 7+ Person Families | 1 (1.2%) | $0 |
| Total | 82 (100.0%) | $46,912 |
Family Income by Number of Earners in La Grange
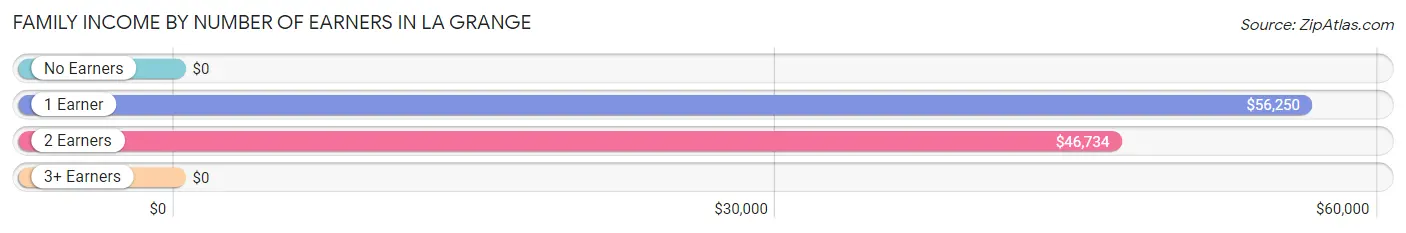
| Number of Earners | # Families | Median Income |
| No Earners | 2 (2.4%) | $0 |
| 1 Earner | 12 (14.6%) | $56,250 |
| 2 Earners | 67 (81.7%) | $46,734 |
| 3+ Earners | 1 (1.2%) | $0 |
| Total | 82 (100.0%) | $46,912 |
Household Income in La Grange
Household Income Brackets in La Grange
With 43 households falling in the category, the $15,000 to $24,999 income range is the most frequent in La Grange, accounting for 31.4% of all households.
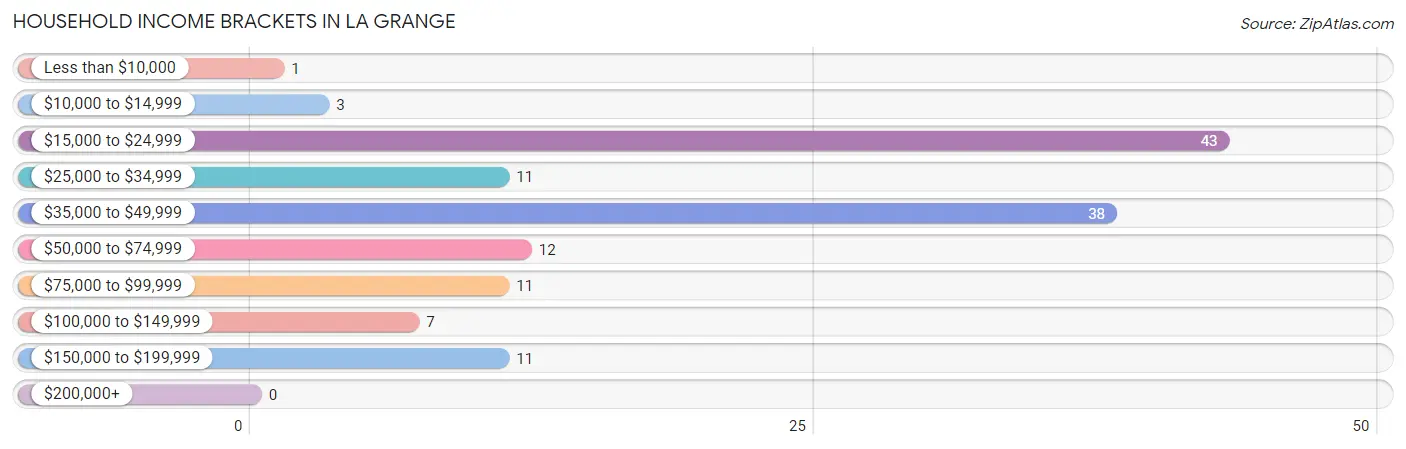
| Income Bracket | # Households | % Households |
| Less than $10,000 | 1 | 0.7% |
| $10,000 to $14,999 | 3 | 2.2% |
| $15,000 to $24,999 | 43 | 31.4% |
| $25,000 to $34,999 | 11 | 8.0% |
| $35,000 to $49,999 | 38 | 27.7% |
| $50,000 to $74,999 | 12 | 8.8% |
| $75,000 to $99,999 | 11 | 8.0% |
| $100,000 to $149,999 | 7 | 5.1% |
| $150,000 to $199,999 | 11 | 8.0% |
| $200,000+ | 0 | 0.0% |
Household Income by Householder Age in La Grange
The median household income in La Grange is $45,478, with the highest median household income of $116,667 found in the 45 to 64 years age bracket for the primary householder. A total of 16 households (11.7%) fall into this category. Meanwhile, the 65+ years age bracket for the primary householder has the lowest median household income of $0, with 59 households (43.1%) in this group.
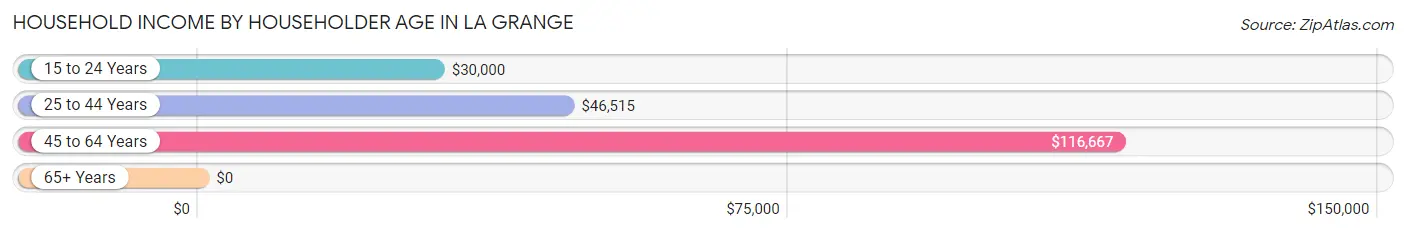
| Income Bracket | # Households | Median Income |
| 15 to 24 Years | 8 (5.8%) | $30,000 |
| 25 to 44 Years | 54 (39.4%) | $46,515 |
| 45 to 64 Years | 16 (11.7%) | $116,667 |
| 65+ Years | 59 (43.1%) | $0 |
| Total | 137 (100.0%) | $45,478 |
Poverty in La Grange
Income Below Poverty by Sex and Age in La Grange
With 2.4% poverty level for males and 9.0% for females among the residents of La Grange, 18 to 24 year old males and 18 to 24 year old females are the most vulnerable to poverty, with 3 males (20.0%) and 5 females (35.7%) in their respective age groups living below the poverty level.
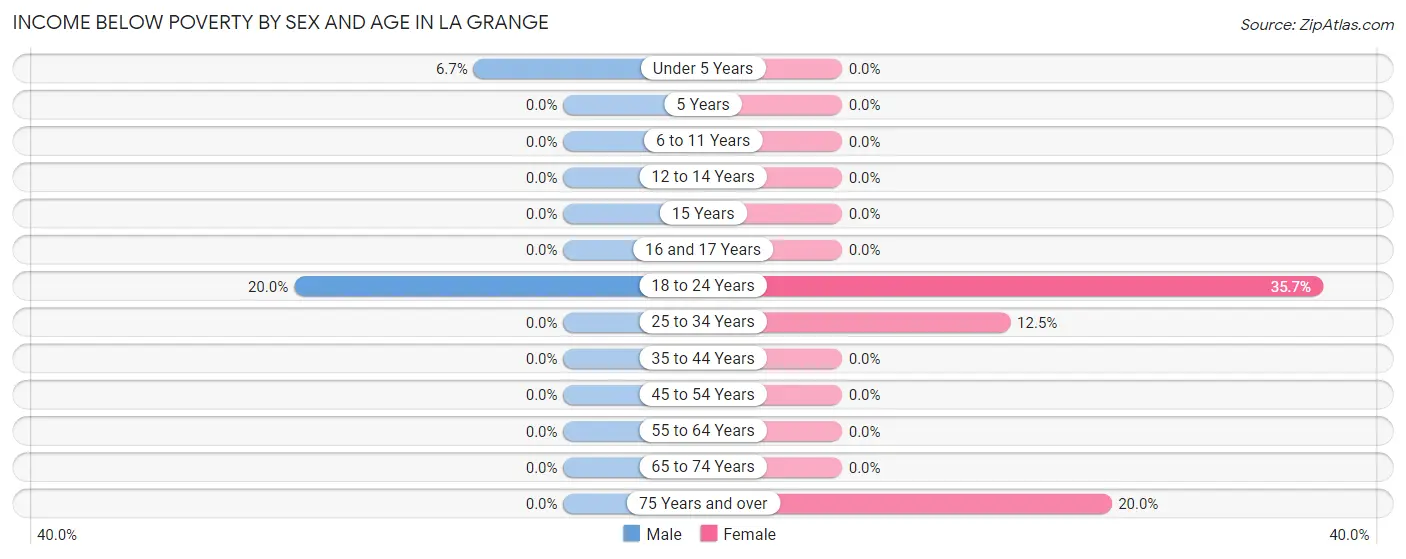
| Age Bracket | Male | Female |
| Under 5 Years | 1 (6.7%) | 0 (0.0%) |
| 5 Years | 0 (0.0%) | 0 (0.0%) |
| 6 to 11 Years | 0 (0.0%) | 0 (0.0%) |
| 12 to 14 Years | 0 (0.0%) | 0 (0.0%) |
| 15 Years | 0 (0.0%) | 0 (0.0%) |
| 16 and 17 Years | 0 (0.0%) | 0 (0.0%) |
| 18 to 24 Years | 3 (20.0%) | 5 (35.7%) |
| 25 to 34 Years | 0 (0.0%) | 2 (12.5%) |
| 35 to 44 Years | 0 (0.0%) | 0 (0.0%) |
| 45 to 54 Years | 0 (0.0%) | 0 (0.0%) |
| 55 to 64 Years | 0 (0.0%) | 0 (0.0%) |
| 65 to 74 Years | 0 (0.0%) | 0 (0.0%) |
| 75 Years and over | 0 (0.0%) | 1 (20.0%) |
| Total | 4 (2.4%) | 8 (9.0%) |
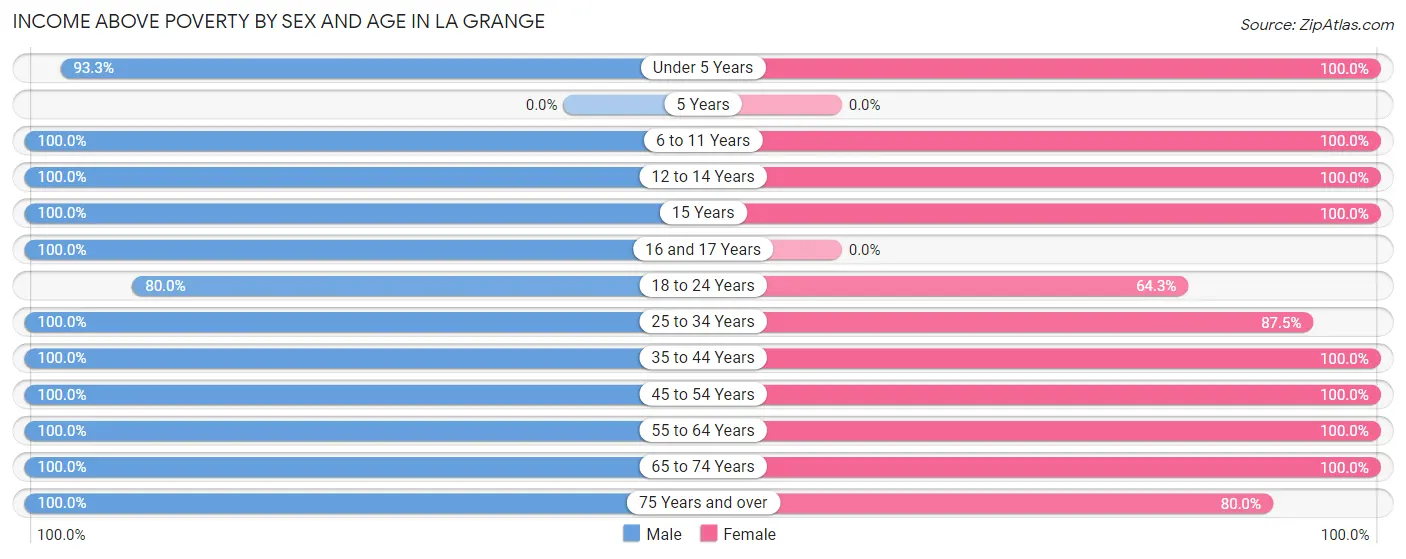
Income Above Poverty by Sex and Age in La Grange
According to the poverty statistics in La Grange, males aged 6 to 11 years and females aged under 5 years are the age groups that are most secure financially, with 100.0% of males and 100.0% of females in these age groups living above the poverty line.
| Age Bracket | Male | Female |
| Under 5 Years | 14 (93.3%) | 4 (100.0%) |
| 5 Years | 0 (0.0%) | 0 (0.0%) |
| 6 to 11 Years | 10 (100.0%) | 6 (100.0%) |
| 12 to 14 Years | 4 (100.0%) | 2 (100.0%) |
| 15 Years | 1 (100.0%) | 1 (100.0%) |
| 16 and 17 Years | 6 (100.0%) | 0 (0.0%) |
| 18 to 24 Years | 12 (80.0%) | 9 (64.3%) |
| 25 to 34 Years | 39 (100.0%) | 14 (87.5%) |
| 35 to 44 Years | 14 (100.0%) | 5 (100.0%) |
| 45 to 54 Years | 8 (100.0%) | 13 (100.0%) |
| 55 to 64 Years | 5 (100.0%) | 6 (100.0%) |
| 65 to 74 Years | 49 (100.0%) | 17 (100.0%) |
| 75 Years and over | 1 (100.0%) | 4 (80.0%) |
| Total | 163 (97.6%) | 81 (91.0%) |
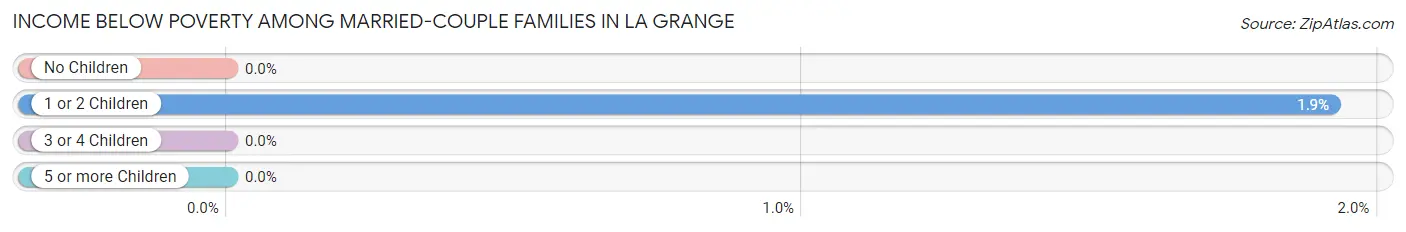
Income Below Poverty Among Married-Couple Families in La Grange
The poverty statistics for married-couple families in La Grange show that 1.3% or 1 of the total 78 families live below the poverty line. Families with 1 or 2 children have the highest poverty rate of 1.9%, comprising of 1 families. On the other hand, families with no children have the lowest poverty rate of 0.0%, which includes 0 families.
| Children | Above Poverty | Below Poverty |
| No Children | 23 (100.0%) | 0 (0.0%) |
| 1 or 2 Children | 51 (98.1%) | 1 (1.9%) |
| 3 or 4 Children | 2 (100.0%) | 0 (0.0%) |
| 5 or more Children | 1 (100.0%) | 0 (0.0%) |
| Total | 77 (98.7%) | 1 (1.3%) |
Income Below Poverty Among Single-Parent Households in La Grange
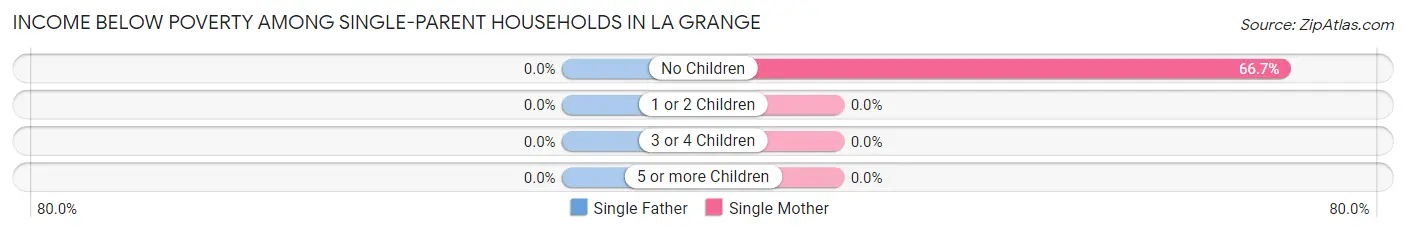
| Children | Single Father | Single Mother |
| No Children | 0 (0.0%) | 2 (66.7%) |
| 1 or 2 Children | 0 (0.0%) | 0 (0.0%) |
| 3 or 4 Children | 0 (0.0%) | 0 (0.0%) |
| 5 or more Children | 0 (0.0%) | 0 (0.0%) |
| Total | 0 (0.0%) | 2 (50.0%) |
Income Below Poverty Among Married-Couple vs Single-Parent Households in La Grange
The poverty data for La Grange shows that 1 of the married-couple family households (1.3%) and 2 of the single-parent households (50.0%) are living below the poverty level. Within the married-couple family households, those with 1 or 2 children have the highest poverty rate, with 1 households (1.9%) falling below the poverty line. Among the single-parent households, those with no children have the highest poverty rate, with 2 household (66.7%) living below poverty.
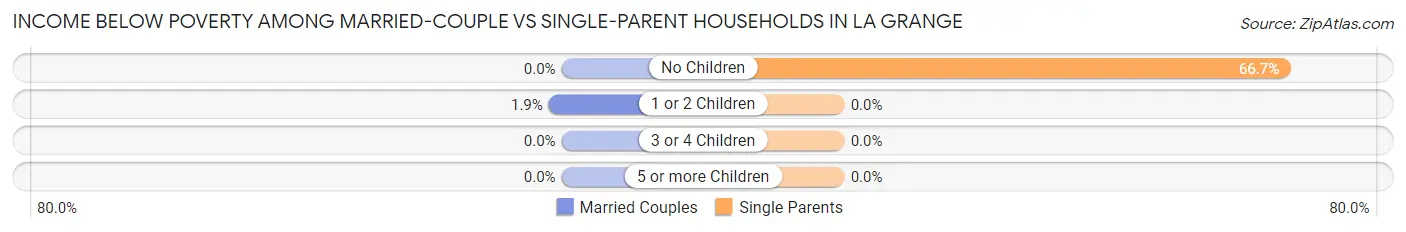
| Children | Married-Couple Families | Single-Parent Households |
| No Children | 0 (0.0%) | 2 (66.7%) |
| 1 or 2 Children | 1 (1.9%) | 0 (0.0%) |
| 3 or 4 Children | 0 (0.0%) | 0 (0.0%) |
| 5 or more Children | 0 (0.0%) | 0 (0.0%) |
| Total | 1 (1.3%) | 2 (50.0%) |
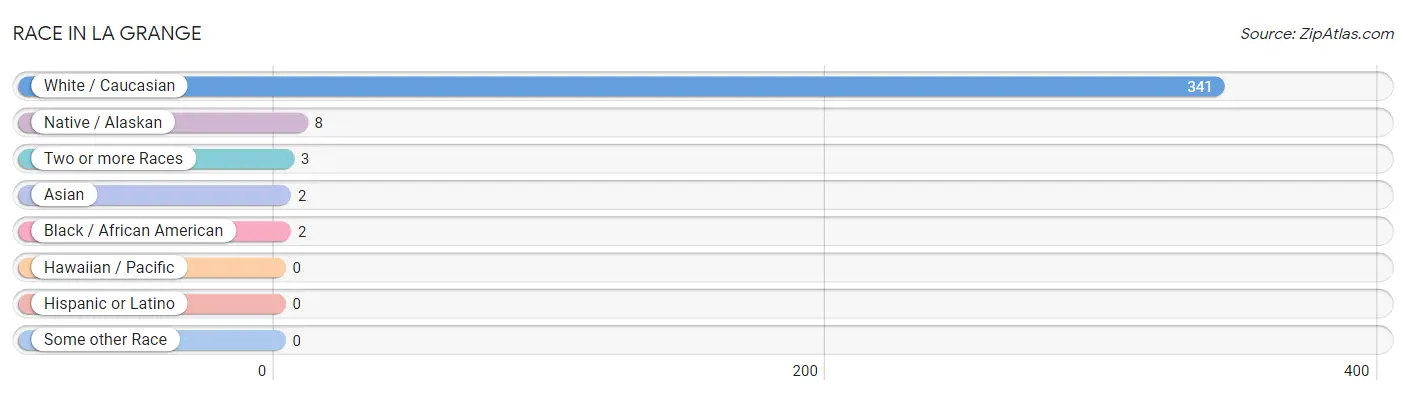
Race in La Grange
The most populous races in La Grange are White / Caucasian (341 | 95.8%), Native / Alaskan (8 | 2.2%), and Two or more Races (3 | 0.8%).
| Race | # Population | % Population |
| Asian | 2 | 0.6% |
| Black / African American | 2 | 0.6% |
| Hawaiian / Pacific | 0 | 0.0% |
| Hispanic or Latino | 0 | 0.0% |
| Native / Alaskan | 8 | 2.2% |
| White / Caucasian | 341 | 95.8% |
| Two or more Races | 3 | 0.8% |
| Some other Race | 0 | 0.0% |
| Total | 356 | 100.0% |
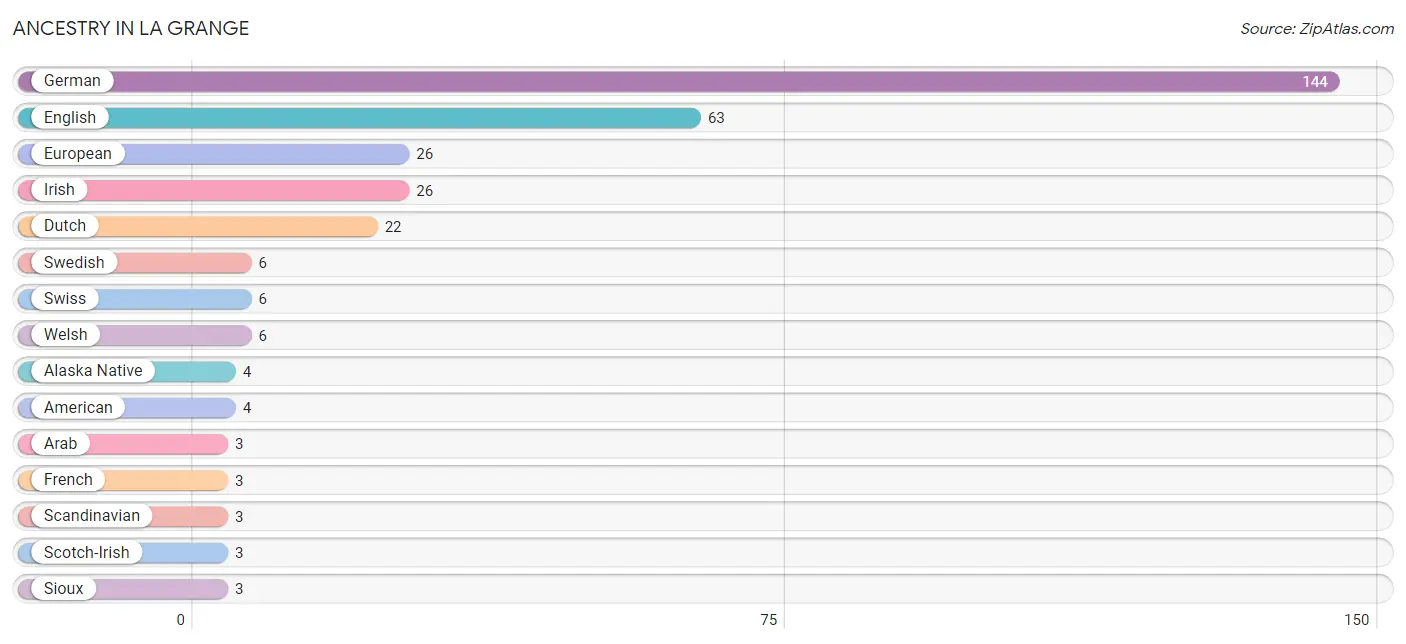
Ancestry in La Grange
The most populous ancestries reported in La Grange are German (144 | 40.5%), English (63 | 17.7%), European (26 | 7.3%), Irish (26 | 7.3%), and Dutch (22 | 6.2%), together accounting for 78.9% of all La Grange residents.
| Ancestry | # Population | % Population |
| Alaska Native | 4 | 1.1% |
| American | 4 | 1.1% |
| Arab | 3 | 0.8% |
| Austrian | 1 | 0.3% |
| British | 1 | 0.3% |
| Cherokee | 1 | 0.3% |
| Czech | 2 | 0.6% |
| Dutch | 22 | 6.2% |
| English | 63 | 17.7% |
| European | 26 | 7.3% |
| Finnish | 1 | 0.3% |
| French | 3 | 0.8% |
| German | 144 | 40.5% |
| Hungarian | 1 | 0.3% |
| Irish | 26 | 7.3% |
| Iroquois | 1 | 0.3% |
| Italian | 2 | 0.6% |
| Korean | 2 | 0.6% |
| Northern European | 1 | 0.3% |
| Norwegian | 1 | 0.3% |
| Polish | 2 | 0.6% |
| Portuguese | 1 | 0.3% |
| Russian | 1 | 0.3% |
| Scandinavian | 3 | 0.8% |
| Scotch-Irish | 3 | 0.8% |
| Scottish | 1 | 0.3% |
| Sioux | 3 | 0.8% |
| Swedish | 6 | 1.7% |
| Swiss | 6 | 1.7% |
| Welsh | 6 | 1.7% | View All 30 Rows |
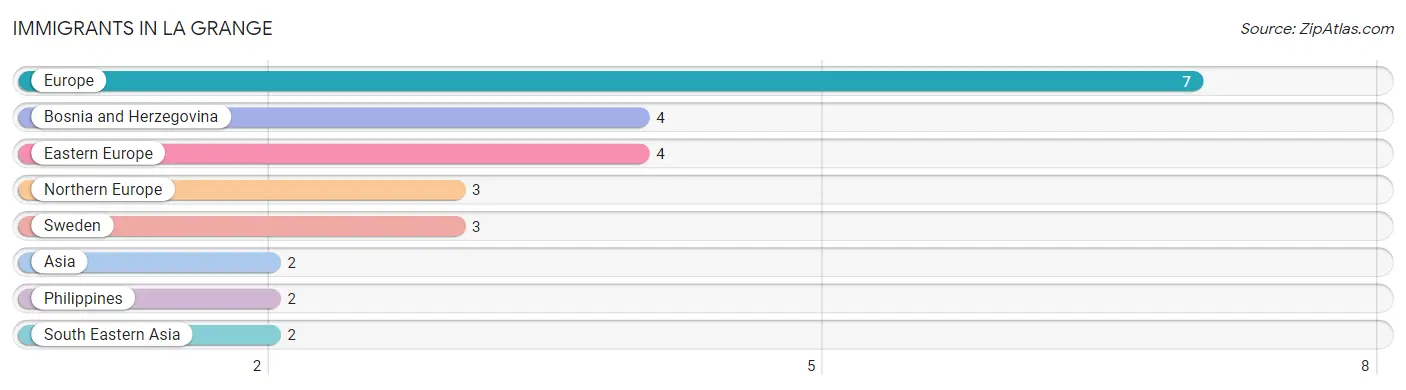
Immigrants in La Grange
The most numerous immigrant groups reported in La Grange came from Europe (7 | 2.0%), Bosnia and Herzegovina (4 | 1.1%), Eastern Europe (4 | 1.1%), Northern Europe (3 | 0.8%), and Sweden (3 | 0.8%), together accounting for 5.9% of all La Grange residents.
| Immigration Origin | # Population | % Population |
| Asia | 2 | 0.6% |
| Bosnia and Herzegovina | 4 | 1.1% |
| Eastern Europe | 4 | 1.1% |
| Europe | 7 | 2.0% |
| Northern Europe | 3 | 0.8% |
| Philippines | 2 | 0.6% |
| South Eastern Asia | 2 | 0.6% |
| Sweden | 3 | 0.8% | View All 8 Rows |
Sex and Age in La Grange
Sex and Age in La Grange
The most populous age groups in La Grange are 70 to 74 Years (43 | 18.9%) for men and 20 to 24 Years (36 | 28.1%) for women.
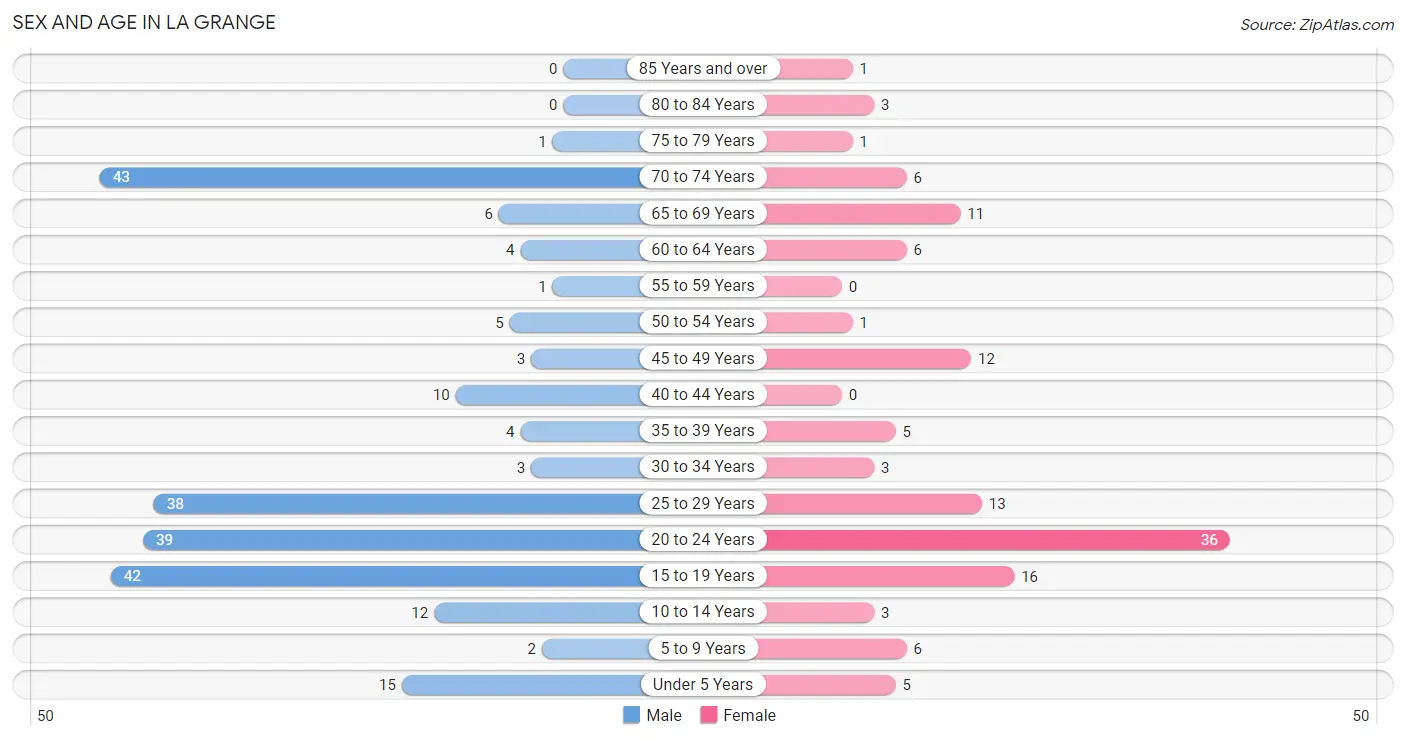
| Age Bracket | Male | Female |
| Under 5 Years | 15 (6.6%) | 5 (3.9%) |
| 5 to 9 Years | 2 (0.9%) | 6 (4.7%) |
| 10 to 14 Years | 12 (5.3%) | 3 (2.3%) |
| 15 to 19 Years | 42 (18.4%) | 16 (12.5%) |
| 20 to 24 Years | 39 (17.1%) | 36 (28.1%) |
| 25 to 29 Years | 38 (16.7%) | 13 (10.2%) |
| 30 to 34 Years | 3 (1.3%) | 3 (2.3%) |
| 35 to 39 Years | 4 (1.8%) | 5 (3.9%) |
| 40 to 44 Years | 10 (4.4%) | 0 (0.0%) |
| 45 to 49 Years | 3 (1.3%) | 12 (9.4%) |
| 50 to 54 Years | 5 (2.2%) | 1 (0.8%) |
| 55 to 59 Years | 1 (0.4%) | 0 (0.0%) |
| 60 to 64 Years | 4 (1.8%) | 6 (4.7%) |
| 65 to 69 Years | 6 (2.6%) | 11 (8.6%) |
| 70 to 74 Years | 43 (18.9%) | 6 (4.7%) |
| 75 to 79 Years | 1 (0.4%) | 1 (0.8%) |
| 80 to 84 Years | 0 (0.0%) | 3 (2.3%) |
| 85 Years and over | 0 (0.0%) | 1 (0.8%) |
| Total | 228 (100.0%) | 128 (100.0%) |
Families and Households in La Grange
Median Family Size in La Grange
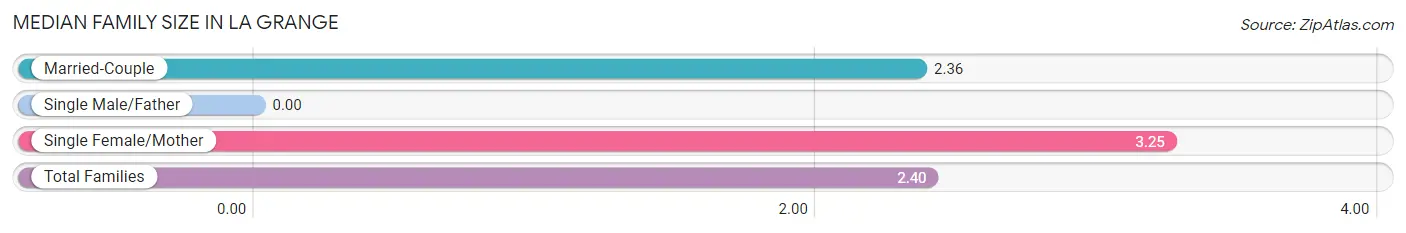
| Family Type | # Families | Family Size |
| Married-Couple | 78 (95.1%) | 2.36 |
| Single Male/Father | 0 (0.0%) | - |
| Single Female/Mother | 4 (4.9%) | 3.25 |
| Total Families | 82 (100.0%) | 2.40 |
Median Household Size in La Grange
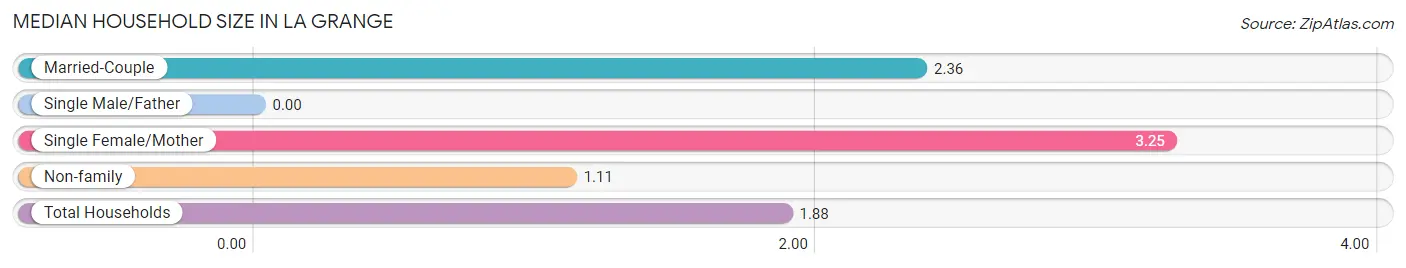
| Household Type | # Households | Household Size |
| Married-Couple | 78 (56.9%) | 2.36 |
| Single Male/Father | 0 (0.0%) | - |
| Single Female/Mother | 4 (2.9%) | 3.25 |
| Non-family | 55 (40.2%) | 1.11 |
| Total Households | 137 (100.0%) | 1.88 |
Household Size by Marriage Status in La Grange
Out of a total of 137 households in La Grange, 82 (59.9%) are family households, while 55 (40.2%) are nonfamily households. The most numerous type of family households are 3-person households, comprising 40, and the most common type of nonfamily households are 1-person households, comprising 52.
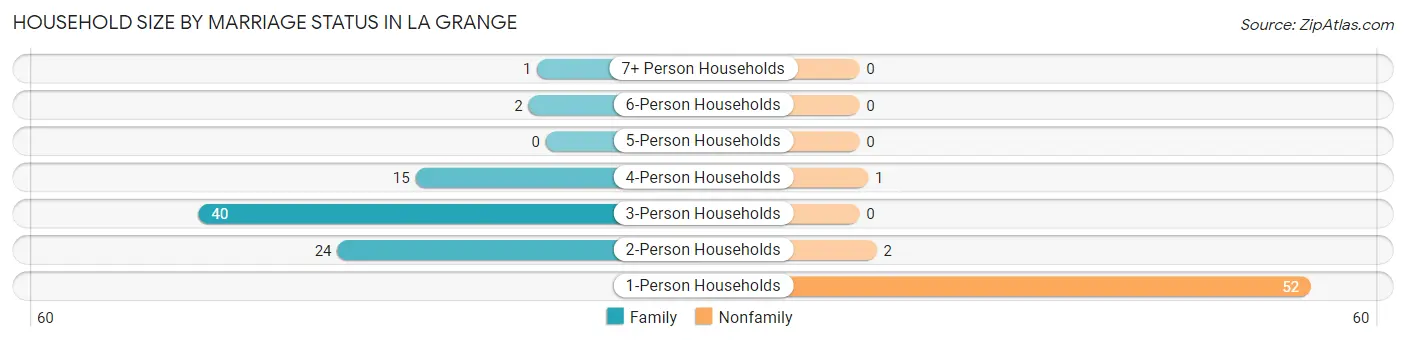
| Household Size | Family Households | Nonfamily Households |
| 1-Person Households | - | 52 (38.0%) |
| 2-Person Households | 24 (17.5%) | 2 (1.5%) |
| 3-Person Households | 40 (29.2%) | 0 (0.0%) |
| 4-Person Households | 15 (11.0%) | 1 (0.7%) |
| 5-Person Households | 0 (0.0%) | 0 (0.0%) |
| 6-Person Households | 2 (1.5%) | 0 (0.0%) |
| 7+ Person Households | 1 (0.7%) | 0 (0.0%) |
| Total | 82 (59.9%) | 55 (40.2%) |
Female Fertility in La Grange
Fertility by Age in La Grange
Average fertility rate in La Grange is 128.0 births per 1,000 women. Women in the age bracket of 35 to 50 years have the highest fertility rate with 278.0 births per 1,000 women. Women in the age bracket of 20 to 34 years acount for 54.5% of all women with births.
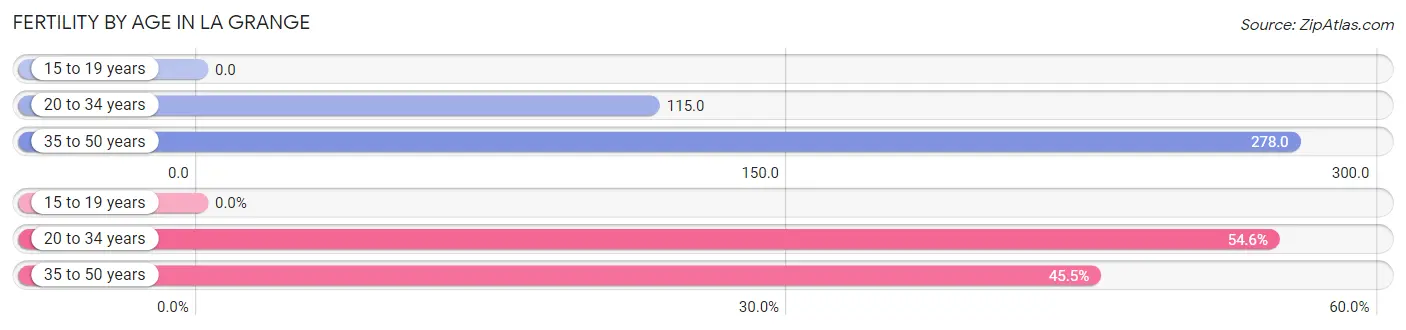
| Age Bracket | Women with Births | Births / 1,000 Women |
| 15 to 19 years | 0 (0.0%) | 0.0 |
| 20 to 34 years | 6 (54.5%) | 115.0 |
| 35 to 50 years | 5 (45.5%) | 278.0 |
| Total | 11 (100.0%) | 128.0 |
Fertility by Age by Marriage Status in La Grange
90.9% of women with births (11) in La Grange are married. The highest percentage of unmarried women with births falls into 35 to 50 years age bracket with 20.0% of them unmarried at the time of birth, while the lowest percentage of unmarried women with births belong to 20 to 34 years age bracket with 0.0% of them unmarried.
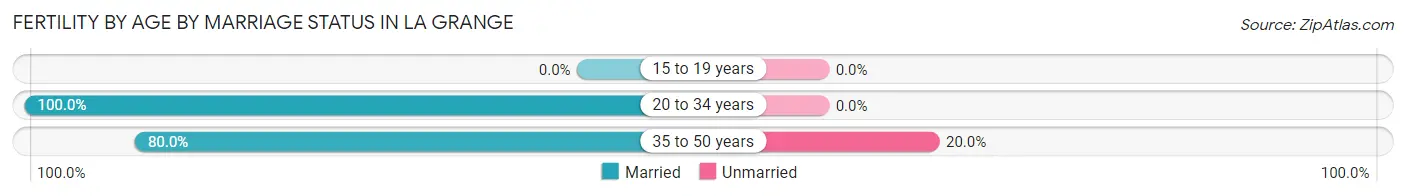
| Age Bracket | Married | Unmarried |
| 15 to 19 years | 0 (0.0%) | 0 (0.0%) |
| 20 to 34 years | 6 (100.0%) | 0 (0.0%) |
| 35 to 50 years | 4 (80.0%) | 1 (20.0%) |
| Total | 10 (90.9%) | 1 (9.1%) |
Fertility by Education in La Grange
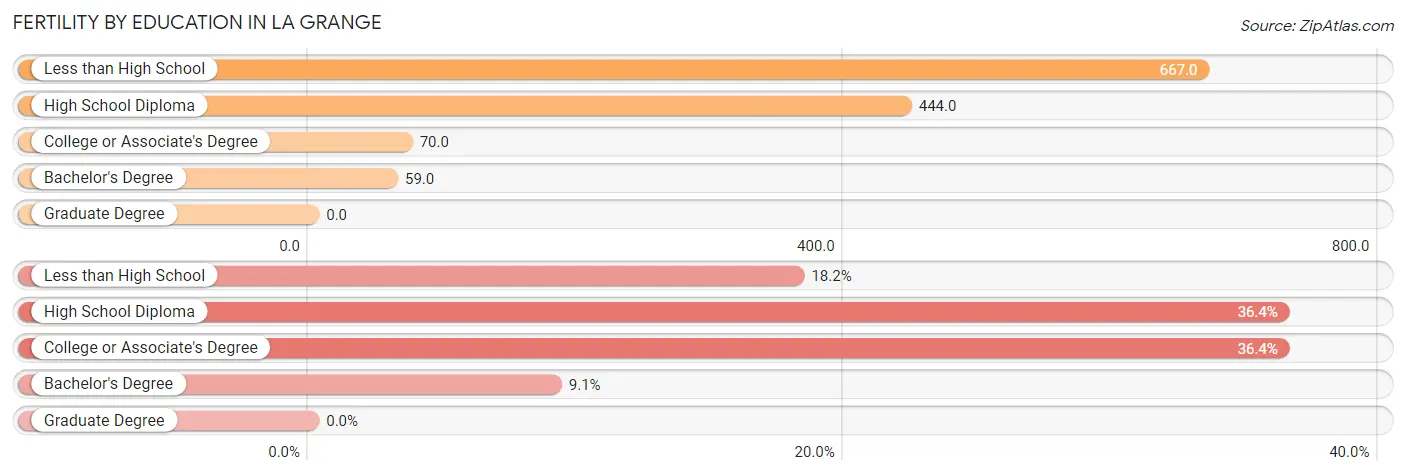
| Educational Attainment | Women with Births | Births / 1,000 Women |
| Less than High School | 2 (18.2%) | 667.0 |
| High School Diploma | 4 (36.4%) | 444.0 |
| College or Associate's Degree | 4 (36.4%) | 70.0 |
| Bachelor's Degree | 1 (9.1%) | 59.0 |
| Graduate Degree | 0 (0.0%) | 0.0 |
| Total | 11 (100.0%) | 128.0 |
Fertility by Education by Marriage Status in La Grange
9.1% of women with births in La Grange are unmarried. Women with the educational attainment of less than high school are most likely to be married with 100.0% of them married at childbirth, while women with the educational attainment of bachelor's degree are least likely to be married with 100.0% of them unmarried at childbirth.
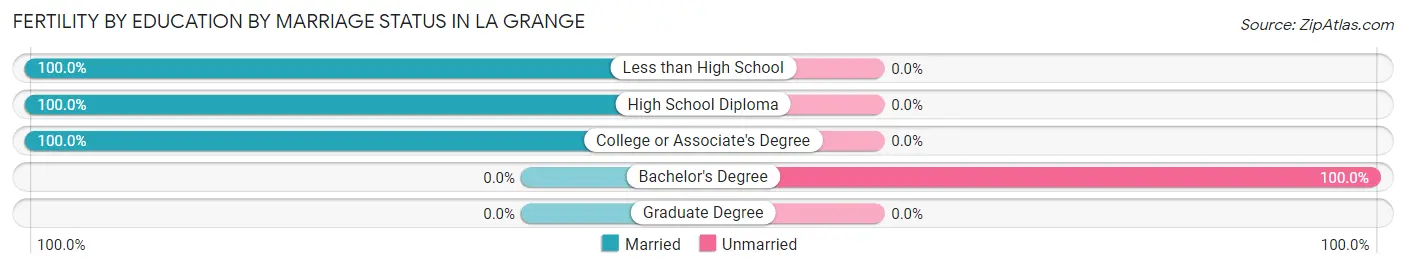
| Educational Attainment | Married | Unmarried |
| Less than High School | 2 (100.0%) | 0 (0.0%) |
| High School Diploma | 4 (100.0%) | 0 (0.0%) |
| College or Associate's Degree | 4 (100.0%) | 0 (0.0%) |
| Bachelor's Degree | 0 (0.0%) | 1 (100.0%) |
| Graduate Degree | 0 (0.0%) | 0 (0.0%) |
| Total | 10 (90.9%) | 1 (9.1%) |
Employment Characteristics in La Grange
Employment by Class of Employer in La Grange
Among the 160 employed individuals in La Grange, private company employees (63 | 39.4%), not-for-profit organizations (39 | 24.4%), and state government employees (38 | 23.7%) make up the most common classes of employment.
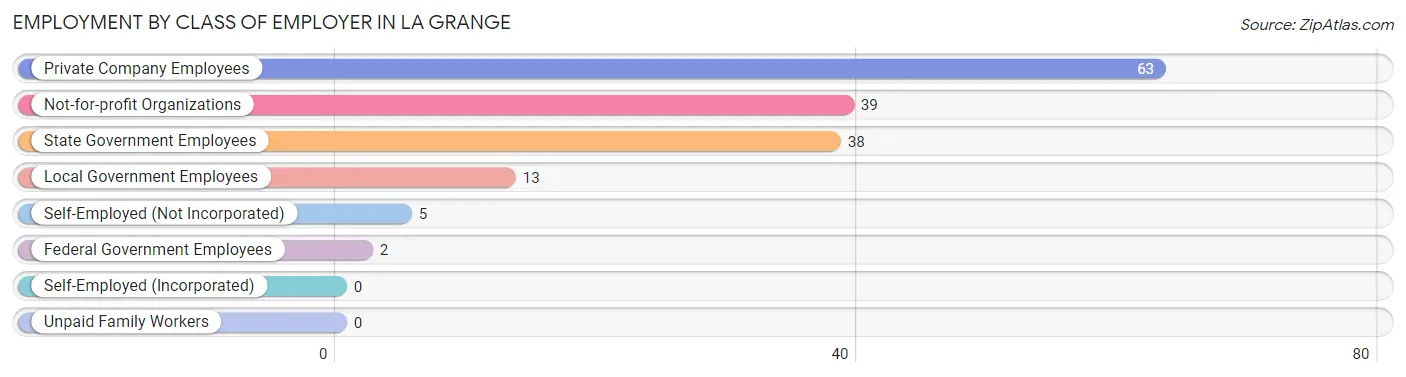
| Employer Class | # Employees | % Employees |
| Private Company Employees | 63 | 39.4% |
| Self-Employed (Incorporated) | 0 | 0.0% |
| Self-Employed (Not Incorporated) | 5 | 3.1% |
| Not-for-profit Organizations | 39 | 24.4% |
| Local Government Employees | 13 | 8.1% |
| State Government Employees | 38 | 23.7% |
| Federal Government Employees | 2 | 1.3% |
| Unpaid Family Workers | 0 | 0.0% |
| Total | 160 | 100.0% |
Employment Status by Age in La Grange
According to the labor force statistics for La Grange, out of the total population over 16 years of age (311), 57.2% or 178 individuals are in the labor force, with 3.4% or 6 of them unemployed. The age group with the highest labor force participation rate is 45 to 54 years, with 100.0% or 21 individuals in the labor force. Within the labor force, the 16 to 19 years age range has the highest percentage of unemployed individuals, with 26.1% or 6 of them being unemployed.
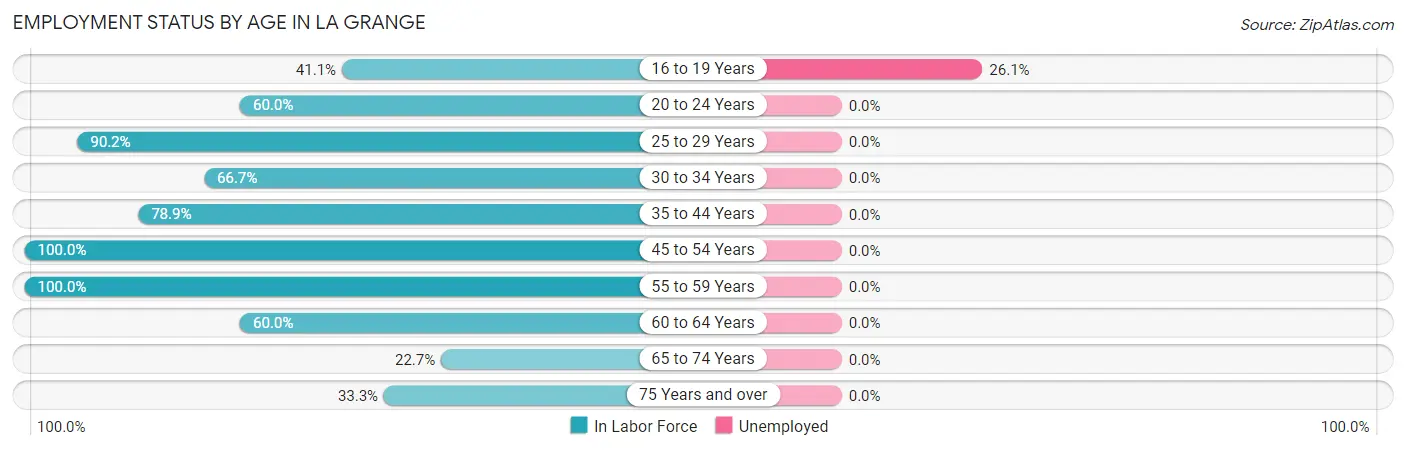
| Age Bracket | In Labor Force | Unemployed |
| 16 to 19 Years | 23 (41.1%) | 6 (26.1%) |
| 20 to 24 Years | 45 (60.0%) | 0 (0.0%) |
| 25 to 29 Years | 46 (90.2%) | 0 (0.0%) |
| 30 to 34 Years | 4 (66.7%) | 0 (0.0%) |
| 35 to 44 Years | 15 (78.9%) | 0 (0.0%) |
| 45 to 54 Years | 21 (100.0%) | 0 (0.0%) |
| 55 to 59 Years | 1 (100.0%) | 0 (0.0%) |
| 60 to 64 Years | 6 (60.0%) | 0 (0.0%) |
| 65 to 74 Years | 15 (22.7%) | 0 (0.0%) |
| 75 Years and over | 2 (33.3%) | 0 (0.0%) |
| Total | 178 (57.2%) | 6 (3.4%) |
Employment Status by Educational Attainment in La Grange
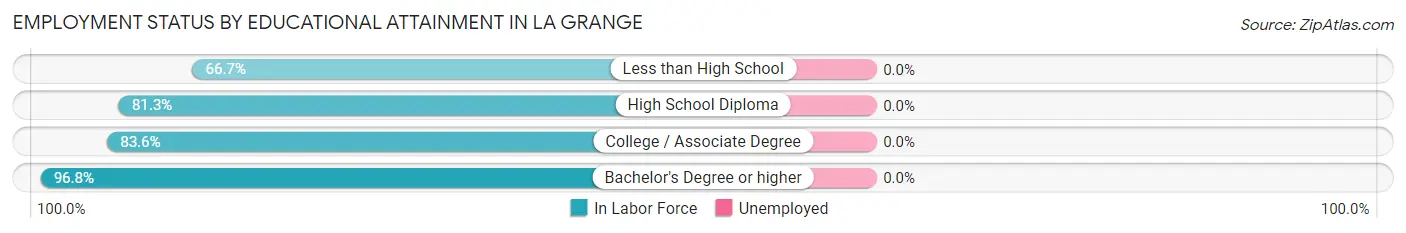
| Educational Attainment | In Labor Force | Unemployed |
| Less than High School | 4 (66.7%) | 0 (0.0%) |
| High School Diploma | 13 (81.3%) | 0 (0.0%) |
| College / Associate Degree | 46 (83.6%) | 0 (0.0%) |
| Bachelor's Degree or higher | 30 (96.8%) | 0 (0.0%) |
| Total | 93 (86.1%) | 0 (0.0%) |
Employment Occupations by Sex in La Grange
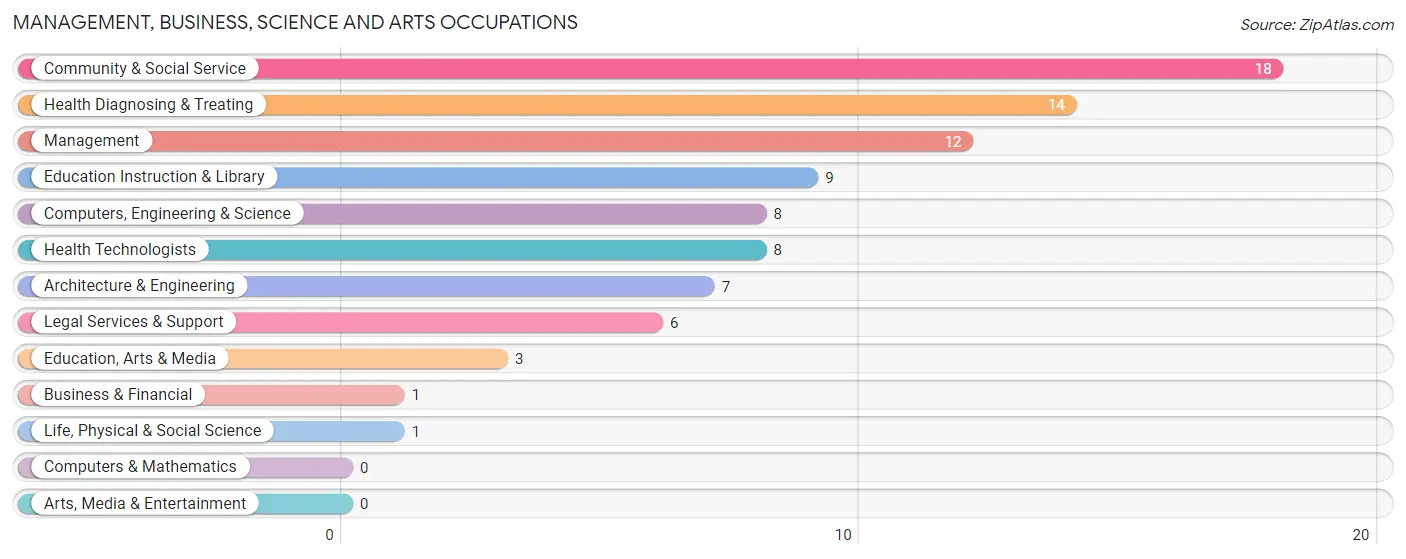
Management, Business, Science and Arts Occupations
The most common Management, Business, Science and Arts occupations in La Grange are Community & Social Service (18 | 10.5%), Health Diagnosing & Treating (14 | 8.1%), Management (12 | 7.0%), Education Instruction & Library (9 | 5.2%), and Computers, Engineering & Science (8 | 4.6%).
Management, Business, Science and Arts Occupations by Sex
Within the Management, Business, Science and Arts occupations in La Grange, the most male-oriented occupations are Education, Arts & Media (100.0%), Legal Services & Support (100.0%), and Community & Social Service (94.4%), while the most female-oriented occupations are Business & Financial (100.0%), Life, Physical & Social Science (100.0%), and Health Technologists (100.0%).
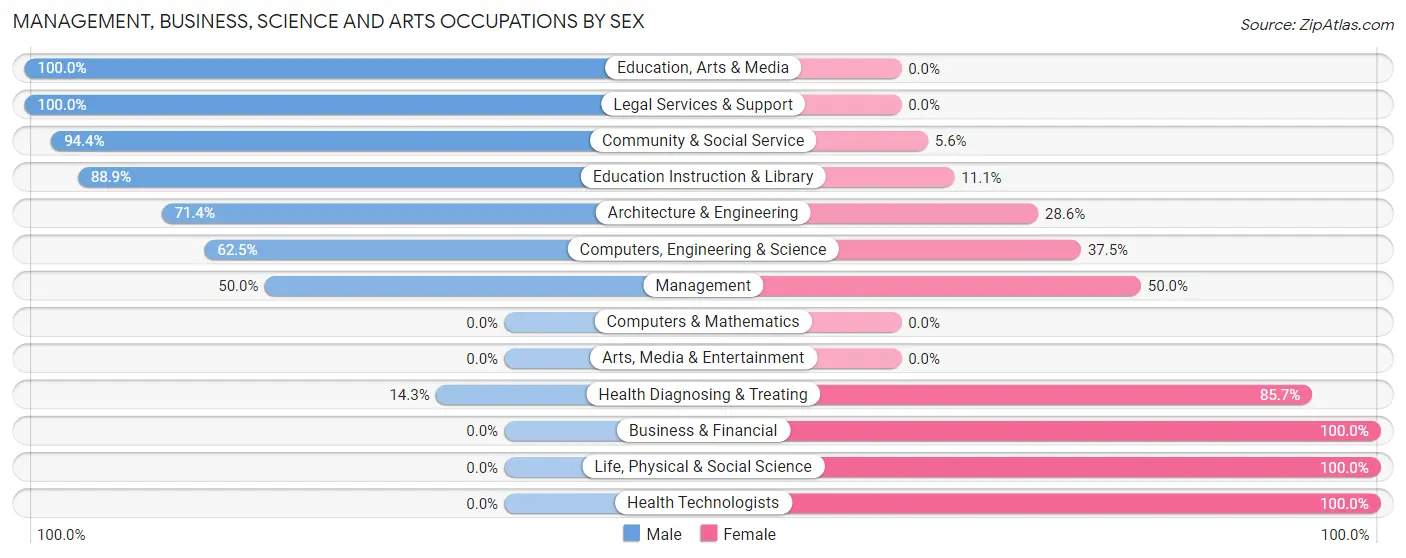
| Occupation | Male | Female |
| Management | 6 (50.0%) | 6 (50.0%) |
| Business & Financial | 0 (0.0%) | 1 (100.0%) |
| Computers, Engineering & Science | 5 (62.5%) | 3 (37.5%) |
| Computers & Mathematics | 0 (0.0%) | 0 (0.0%) |
| Architecture & Engineering | 5 (71.4%) | 2 (28.6%) |
| Life, Physical & Social Science | 0 (0.0%) | 1 (100.0%) |
| Community & Social Service | 17 (94.4%) | 1 (5.6%) |
| Education, Arts & Media | 3 (100.0%) | 0 (0.0%) |
| Legal Services & Support | 6 (100.0%) | 0 (0.0%) |
| Education Instruction & Library | 8 (88.9%) | 1 (11.1%) |
| Arts, Media & Entertainment | 0 (0.0%) | 0 (0.0%) |
| Health Diagnosing & Treating | 2 (14.3%) | 12 (85.7%) |
| Health Technologists | 0 (0.0%) | 8 (100.0%) |
| Total (Category) | 30 (56.6%) | 23 (43.4%) |
| Total (Overall) | 110 (63.9%) | 62 (36.0%) |
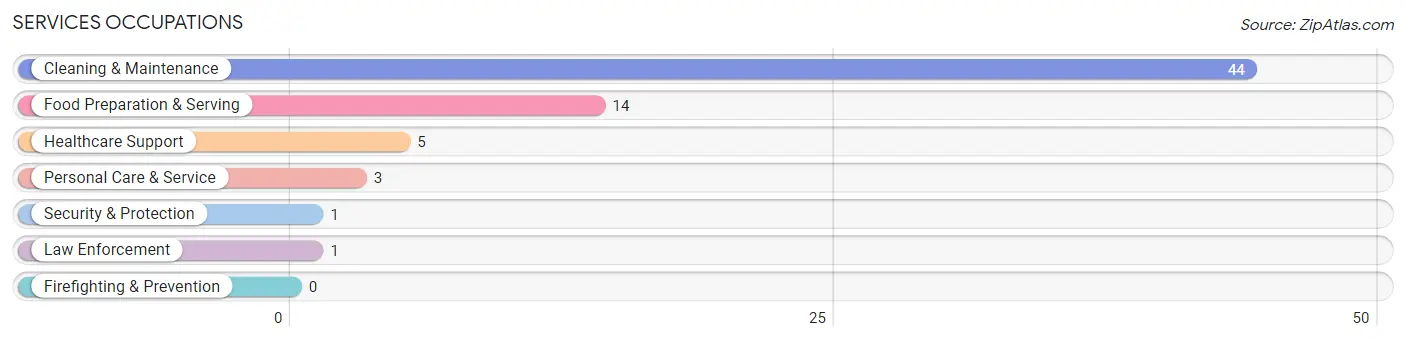
Services Occupations
The most common Services occupations in La Grange are Cleaning & Maintenance (44 | 25.6%), Food Preparation & Serving (14 | 8.1%), Healthcare Support (5 | 2.9%), Personal Care & Service (3 | 1.7%), and Security & Protection (1 | 0.6%).
Services Occupations by Sex
Within the Services occupations in La Grange, the most male-oriented occupations are Security & Protection (100.0%), Law Enforcement (100.0%), and Cleaning & Maintenance (81.8%), while the most female-oriented occupations are Healthcare Support (100.0%), Personal Care & Service (66.7%), and Food Preparation & Serving (57.1%).
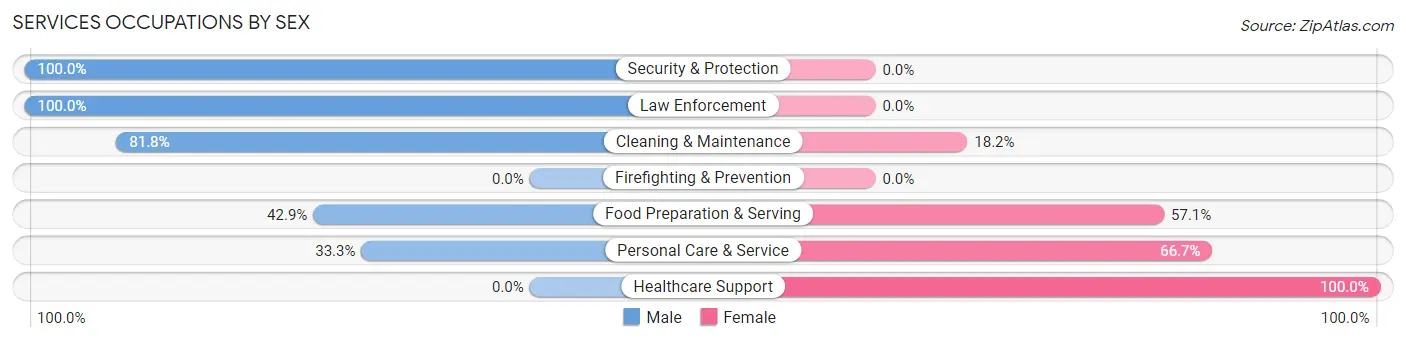
| Occupation | Male | Female |
| Healthcare Support | 0 (0.0%) | 5 (100.0%) |
| Security & Protection | 1 (100.0%) | 0 (0.0%) |
| Firefighting & Prevention | 0 (0.0%) | 0 (0.0%) |
| Law Enforcement | 1 (100.0%) | 0 (0.0%) |
| Food Preparation & Serving | 6 (42.9%) | 8 (57.1%) |
| Cleaning & Maintenance | 36 (81.8%) | 8 (18.2%) |
| Personal Care & Service | 1 (33.3%) | 2 (66.7%) |
| Total (Category) | 44 (65.7%) | 23 (34.3%) |
| Total (Overall) | 110 (63.9%) | 62 (36.0%) |
Sales and Office Occupations
The most common Sales and Office occupations in La Grange are Office & Administration (11 | 6.4%), and Sales & Related (4 | 2.3%).

Sales and Office Occupations by Sex

| Occupation | Male | Female |
| Sales & Related | 2 (50.0%) | 2 (50.0%) |
| Office & Administration | 0 (0.0%) | 11 (100.0%) |
| Total (Category) | 2 (13.3%) | 13 (86.7%) |
| Total (Overall) | 110 (63.9%) | 62 (36.0%) |
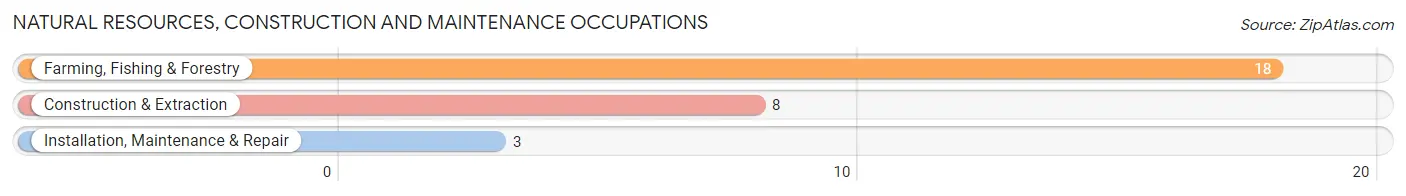
Natural Resources, Construction and Maintenance Occupations
The most common Natural Resources, Construction and Maintenance occupations in La Grange are Farming, Fishing & Forestry (18 | 10.5%), Construction & Extraction (8 | 4.6%), and Installation, Maintenance & Repair (3 | 1.7%).
Natural Resources, Construction and Maintenance Occupations by Sex
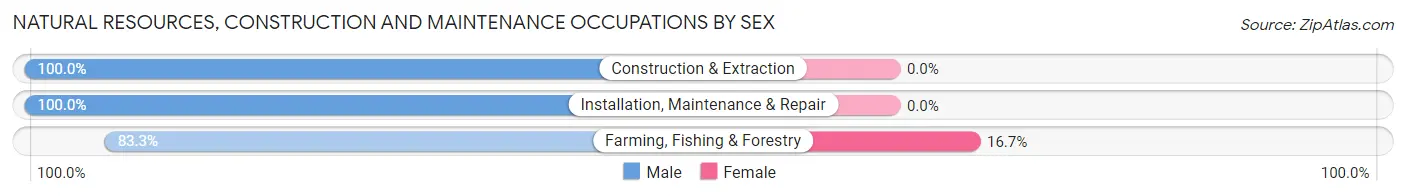
| Occupation | Male | Female |
| Farming, Fishing & Forestry | 15 (83.3%) | 3 (16.7%) |
| Construction & Extraction | 8 (100.0%) | 0 (0.0%) |
| Installation, Maintenance & Repair | 3 (100.0%) | 0 (0.0%) |
| Total (Category) | 26 (89.7%) | 3 (10.3%) |
| Total (Overall) | 110 (63.9%) | 62 (36.0%) |
Production, Transportation and Moving Occupations
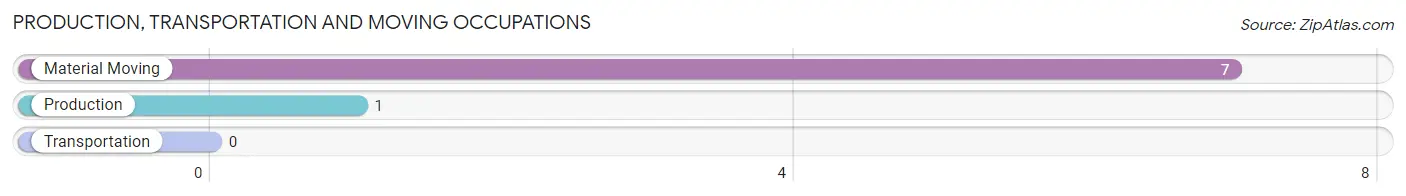
The most common Production, Transportation and Moving occupations in La Grange are Material Moving (7 | 4.1%), and Production (1 | 0.6%).
Production, Transportation and Moving Occupations by Sex
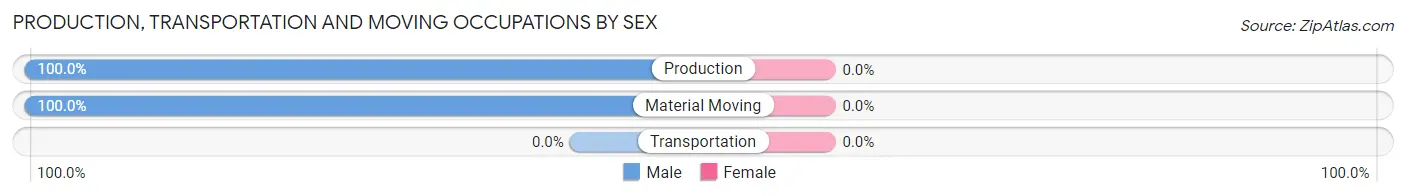
| Occupation | Male | Female |
| Production | 1 (100.0%) | 0 (0.0%) |
| Transportation | 0 (0.0%) | 0 (0.0%) |
| Material Moving | 7 (100.0%) | 0 (0.0%) |
| Total (Category) | 8 (100.0%) | 0 (0.0%) |
| Total (Overall) | 110 (63.9%) | 62 (36.0%) |
Employment Industries by Sex in La Grange
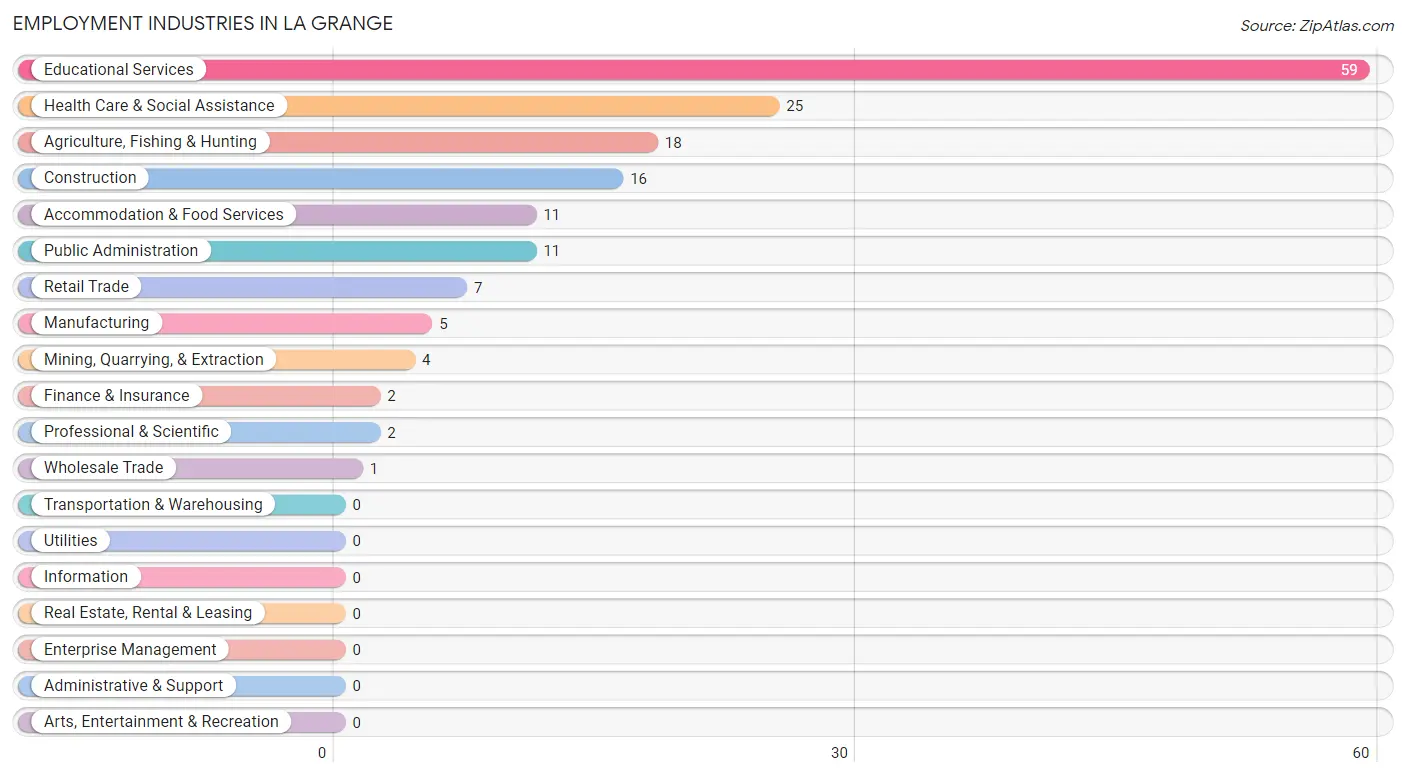
Employment Industries in La Grange
The major employment industries in La Grange include Educational Services (59 | 34.3%), Health Care & Social Assistance (25 | 14.5%), Agriculture, Fishing & Hunting (18 | 10.5%), Construction (16 | 9.3%), and Accommodation & Food Services (11 | 6.4%).
Employment Industries by Sex in La Grange
The La Grange industries that see more men than women are Mining, Quarrying, & Extraction (100.0%), Construction (100.0%), and Manufacturing (100.0%), whereas the industries that tend to have a higher number of women are Wholesale Trade (100.0%), Finance & Insurance (100.0%), and Professional & Scientific (100.0%).
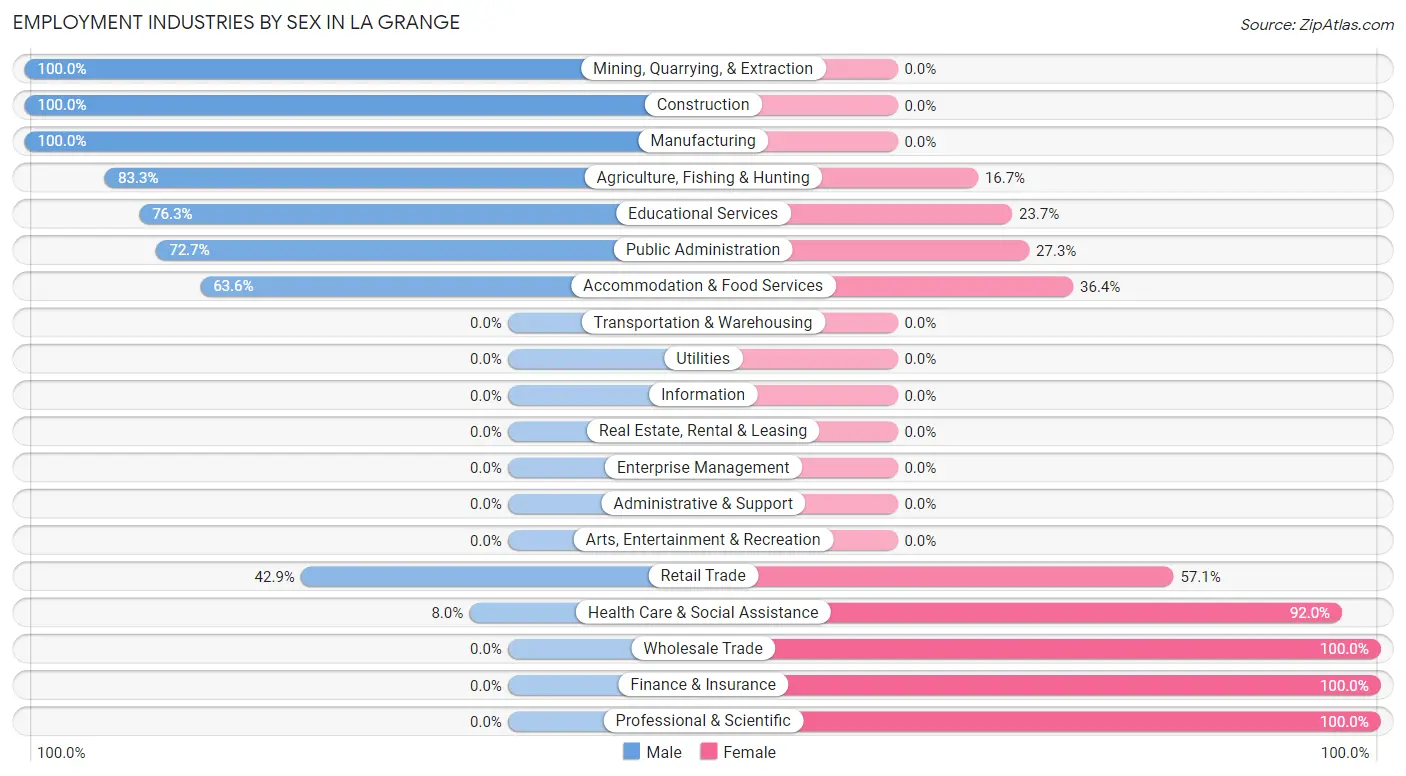
| Industry | Male | Female |
| Agriculture, Fishing & Hunting | 15 (83.3%) | 3 (16.7%) |
| Mining, Quarrying, & Extraction | 4 (100.0%) | 0 (0.0%) |
| Construction | 16 (100.0%) | 0 (0.0%) |
| Manufacturing | 5 (100.0%) | 0 (0.0%) |
| Wholesale Trade | 0 (0.0%) | 1 (100.0%) |
| Retail Trade | 3 (42.9%) | 4 (57.1%) |
| Transportation & Warehousing | 0 (0.0%) | 0 (0.0%) |
| Utilities | 0 (0.0%) | 0 (0.0%) |
| Information | 0 (0.0%) | 0 (0.0%) |
| Finance & Insurance | 0 (0.0%) | 2 (100.0%) |
| Real Estate, Rental & Leasing | 0 (0.0%) | 0 (0.0%) |
| Professional & Scientific | 0 (0.0%) | 2 (100.0%) |
| Enterprise Management | 0 (0.0%) | 0 (0.0%) |
| Administrative & Support | 0 (0.0%) | 0 (0.0%) |
| Educational Services | 45 (76.3%) | 14 (23.7%) |
| Health Care & Social Assistance | 2 (8.0%) | 23 (92.0%) |
| Arts, Entertainment & Recreation | 0 (0.0%) | 0 (0.0%) |
| Accommodation & Food Services | 7 (63.6%) | 4 (36.4%) |
| Public Administration | 8 (72.7%) | 3 (27.3%) |
| Total | 110 (63.9%) | 62 (36.0%) |
Education in La Grange
School Enrollment in La Grange
The most common levels of schooling among the 179 students in La Grange are college / undergraduate (145 | 81.0%), elementary school (13 | 7.3%), and high school (11 | 6.1%).
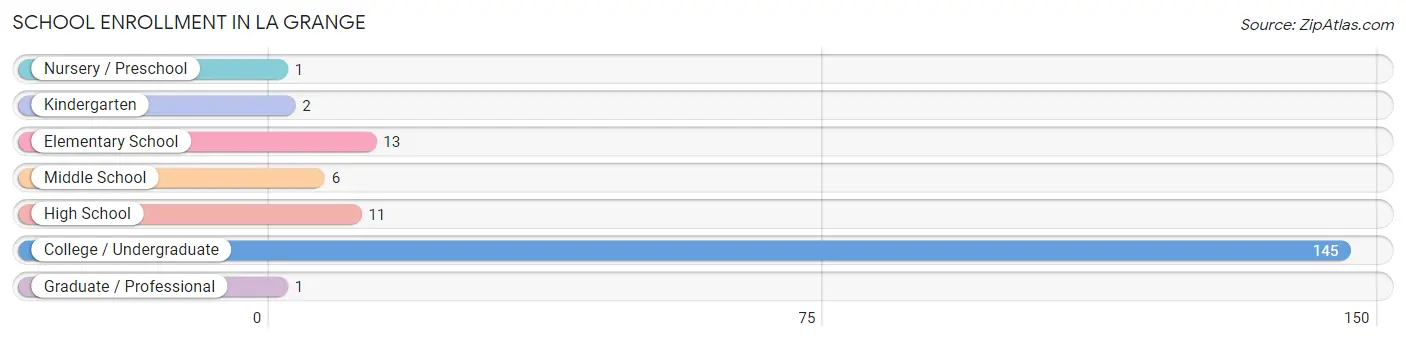
| School Level | # Students | % Students |
| Nursery / Preschool | 1 | 0.6% |
| Kindergarten | 2 | 1.1% |
| Elementary School | 13 | 7.3% |
| Middle School | 6 | 3.4% |
| High School | 11 | 6.1% |
| College / Undergraduate | 145 | 81.0% |
| Graduate / Professional | 1 | 0.6% |
| Total | 179 | 100.0% |
School Enrollment by Age by Funding Source in La Grange
Out of a total of 179 students who are enrolled in schools in La Grange, 109 (60.9%) attend a private institution, while the remaining 70 (39.1%) are enrolled in public schools. The age group of 3 to 4 year olds has the highest likelihood of being enrolled in private schools, with 1 (100.0% in the age bracket) enrolled. Conversely, the age group of 15 to 17 year olds has the lowest likelihood of being enrolled in a private school, with 6 (75.0% in the age bracket) attending a public institution.
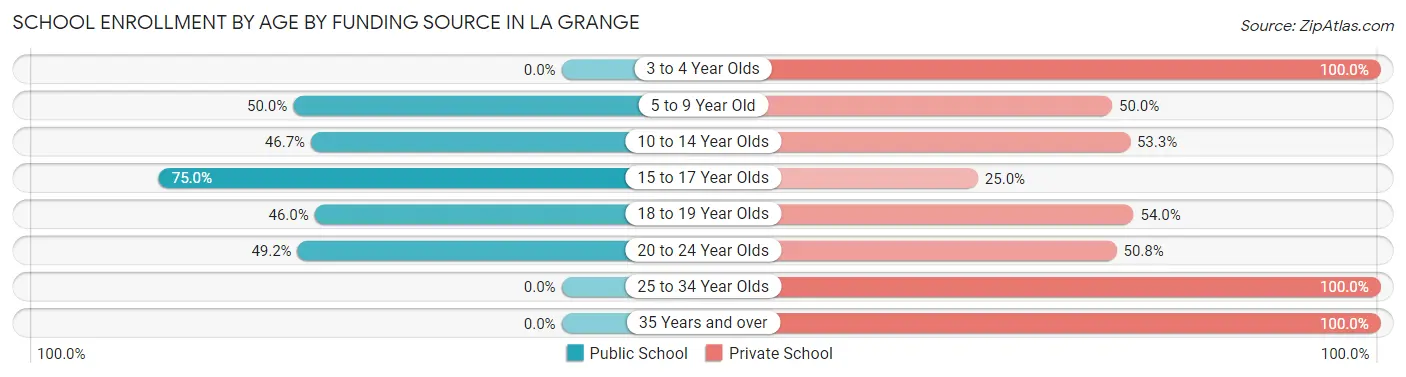
| Age Bracket | Public School | Private School |
| 3 to 4 Year Olds | 0 (0.0%) | 1 (100.0%) |
| 5 to 9 Year Old | 4 (50.0%) | 4 (50.0%) |
| 10 to 14 Year Olds | 7 (46.7%) | 8 (53.3%) |
| 15 to 17 Year Olds | 6 (75.0%) | 2 (25.0%) |
| 18 to 19 Year Olds | 23 (46.0%) | 27 (54.0%) |
| 20 to 24 Year Olds | 30 (49.2%) | 31 (50.8%) |
| 25 to 34 Year Olds | 0 (0.0%) | 35 (100.0%) |
| 35 Years and over | 0 (0.0%) | 1 (100.0%) |
| Total | 70 (39.1%) | 109 (60.9%) |
Educational Attainment by Field of Study in La Grange
Liberal arts & history (11 | 20.4%), physical & health sciences (10 | 18.5%), science & technology (10 | 18.5%), business (8 | 14.8%), and social sciences (4 | 7.4%) are the most common fields of study among 54 individuals in La Grange who have obtained a bachelor's degree or higher.
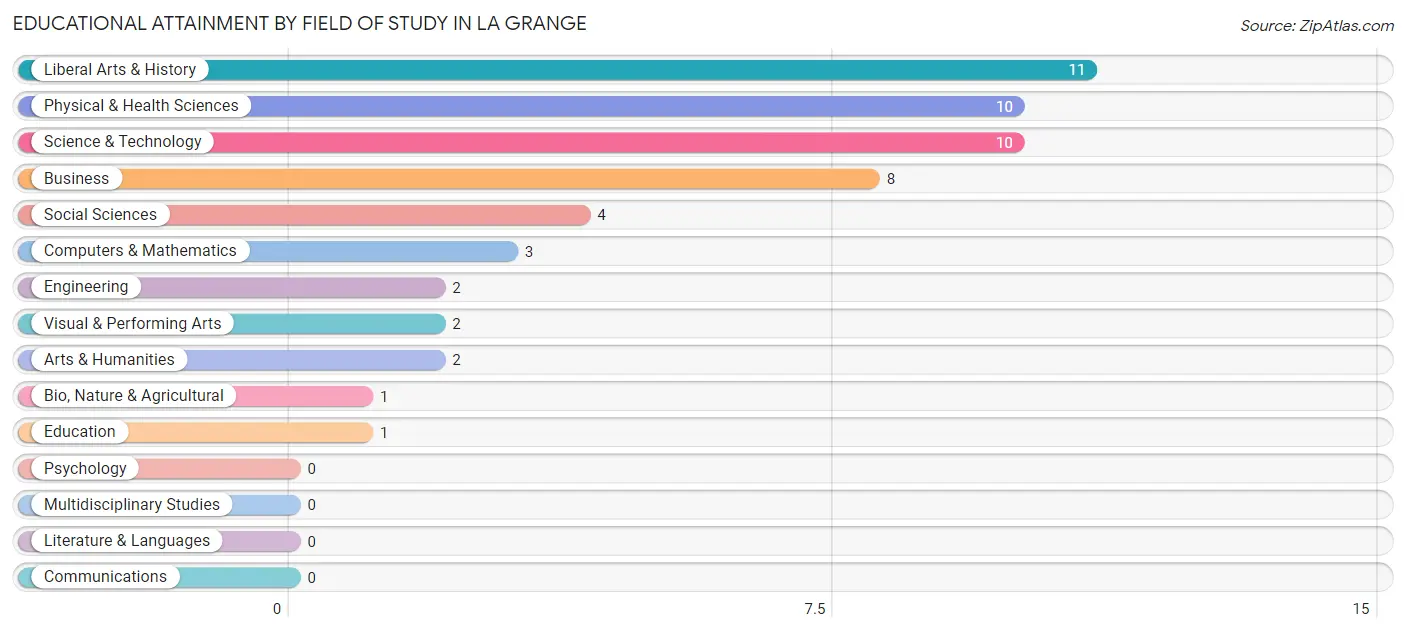
| Field of Study | # Graduates | % Graduates |
| Computers & Mathematics | 3 | 5.6% |
| Bio, Nature & Agricultural | 1 | 1.8% |
| Physical & Health Sciences | 10 | 18.5% |
| Psychology | 0 | 0.0% |
| Social Sciences | 4 | 7.4% |
| Engineering | 2 | 3.7% |
| Multidisciplinary Studies | 0 | 0.0% |
| Science & Technology | 10 | 18.5% |
| Business | 8 | 14.8% |
| Education | 1 | 1.8% |
| Literature & Languages | 0 | 0.0% |
| Liberal Arts & History | 11 | 20.4% |
| Visual & Performing Arts | 2 | 3.7% |
| Communications | 0 | 0.0% |
| Arts & Humanities | 2 | 3.7% |
| Total | 54 | 100.0% |
Transportation & Commute in La Grange
Vehicle Availability by Sex in La Grange
The most prevalent vehicle ownership categories in La Grange are males with 2 vehicles (52, accounting for 61.2%) and females with 2 vehicles (23, making up 118.2%).
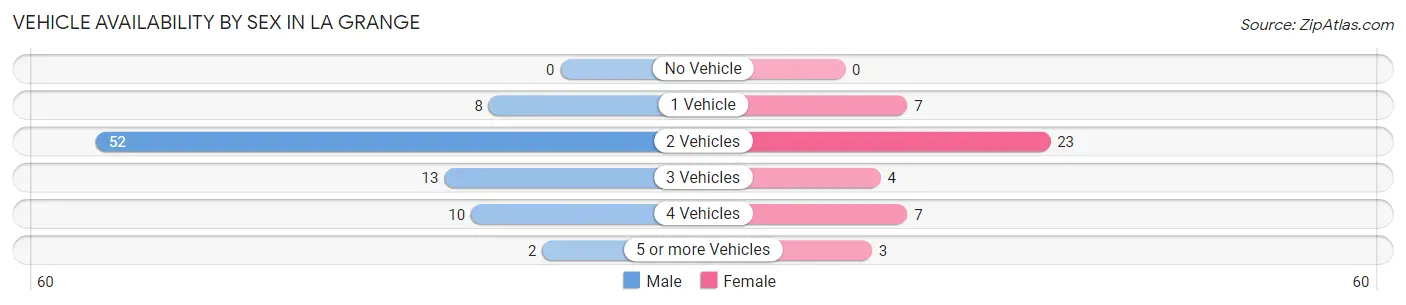
| Vehicles Available | Male | Female |
| No Vehicle | 0 (0.0%) | 0 (0.0%) |
| 1 Vehicle | 8 (9.4%) | 7 (15.9%) |
| 2 Vehicles | 52 (61.2%) | 23 (52.3%) |
| 3 Vehicles | 13 (15.3%) | 4 (9.1%) |
| 4 Vehicles | 10 (11.8%) | 7 (15.9%) |
| 5 or more Vehicles | 2 (2.4%) | 3 (6.8%) |
| Total | 85 (100.0%) | 44 (100.0%) |
Commute Time in La Grange
The most frequently occuring commute durations in La Grange are less than 5 minutes (60 commuters, 39.0%), 5 to 9 minutes (33 commuters, 21.4%), and 30 to 34 minutes (14 commuters, 9.1%).
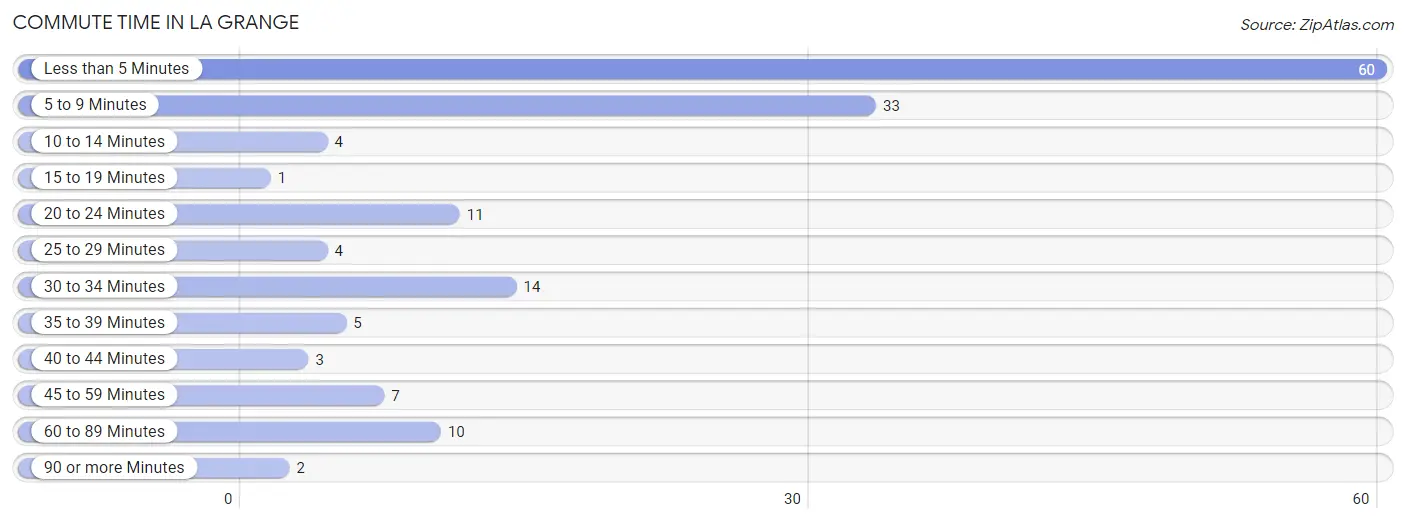
| Commute Time | # Commuters | % Commuters |
| Less than 5 Minutes | 60 | 39.0% |
| 5 to 9 Minutes | 33 | 21.4% |
| 10 to 14 Minutes | 4 | 2.6% |
| 15 to 19 Minutes | 1 | 0.6% |
| 20 to 24 Minutes | 11 | 7.1% |
| 25 to 29 Minutes | 4 | 2.6% |
| 30 to 34 Minutes | 14 | 9.1% |
| 35 to 39 Minutes | 5 | 3.3% |
| 40 to 44 Minutes | 3 | 1.9% |
| 45 to 59 Minutes | 7 | 4.5% |
| 60 to 89 Minutes | 10 | 6.5% |
| 90 or more Minutes | 2 | 1.3% |
Commute Time by Sex in La Grange
The most common commute times in La Grange are less than 5 minutes (48 commuters, 47.5%) for males and 5 to 9 minutes (16 commuters, 30.2%) for females.
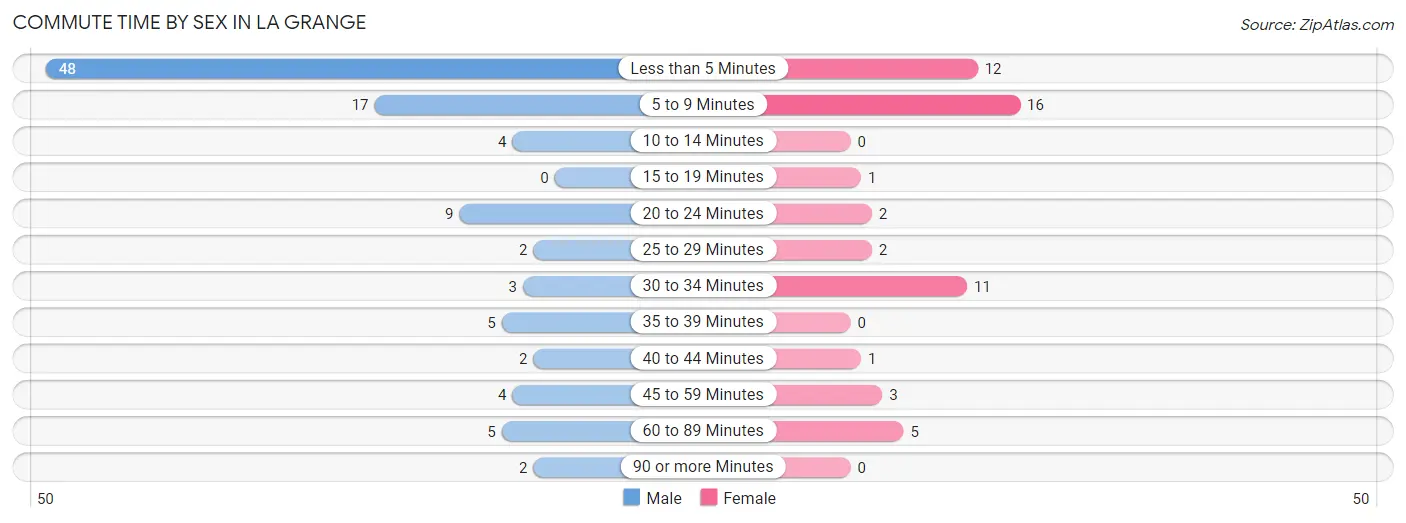
| Commute Time | Male | Female |
| Less than 5 Minutes | 48 (47.5%) | 12 (22.6%) |
| 5 to 9 Minutes | 17 (16.8%) | 16 (30.2%) |
| 10 to 14 Minutes | 4 (4.0%) | 0 (0.0%) |
| 15 to 19 Minutes | 0 (0.0%) | 1 (1.9%) |
| 20 to 24 Minutes | 9 (8.9%) | 2 (3.8%) |
| 25 to 29 Minutes | 2 (2.0%) | 2 (3.8%) |
| 30 to 34 Minutes | 3 (3.0%) | 11 (20.7%) |
| 35 to 39 Minutes | 5 (5.0%) | 0 (0.0%) |
| 40 to 44 Minutes | 2 (2.0%) | 1 (1.9%) |
| 45 to 59 Minutes | 4 (4.0%) | 3 (5.7%) |
| 60 to 89 Minutes | 5 (5.0%) | 5 (9.4%) |
| 90 or more Minutes | 2 (2.0%) | 0 (0.0%) |
Time of Departure to Work by Sex in La Grange
The most frequent times of departure to work in La Grange are 7:00 AM to 7:29 AM (41, 40.6%) for males and 6:00 AM to 6:29 AM (8, 15.1%) for females.
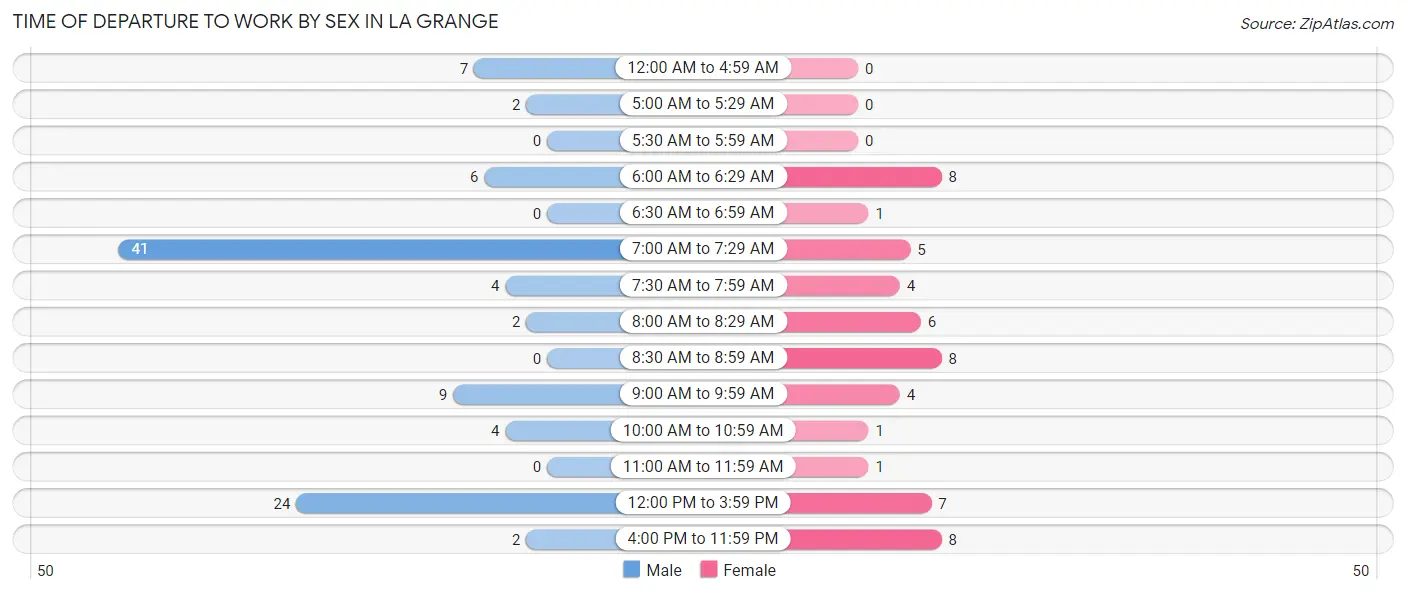
| Time of Departure | Male | Female |
| 12:00 AM to 4:59 AM | 7 (6.9%) | 0 (0.0%) |
| 5:00 AM to 5:29 AM | 2 (2.0%) | 0 (0.0%) |
| 5:30 AM to 5:59 AM | 0 (0.0%) | 0 (0.0%) |
| 6:00 AM to 6:29 AM | 6 (5.9%) | 8 (15.1%) |
| 6:30 AM to 6:59 AM | 0 (0.0%) | 1 (1.9%) |
| 7:00 AM to 7:29 AM | 41 (40.6%) | 5 (9.4%) |
| 7:30 AM to 7:59 AM | 4 (4.0%) | 4 (7.5%) |
| 8:00 AM to 8:29 AM | 2 (2.0%) | 6 (11.3%) |
| 8:30 AM to 8:59 AM | 0 (0.0%) | 8 (15.1%) |
| 9:00 AM to 9:59 AM | 9 (8.9%) | 4 (7.5%) |
| 10:00 AM to 10:59 AM | 4 (4.0%) | 1 (1.9%) |
| 11:00 AM to 11:59 AM | 0 (0.0%) | 1 (1.9%) |
| 12:00 PM to 3:59 PM | 24 (23.8%) | 7 (13.2%) |
| 4:00 PM to 11:59 PM | 2 (2.0%) | 8 (15.1%) |
| Total | 101 (100.0%) | 53 (100.0%) |
Housing Occupancy in La Grange
Occupancy by Ownership in La Grange
Of the total 137 dwellings in La Grange, owner-occupied units account for 87 (63.5%), while renter-occupied units make up 50 (36.5%).
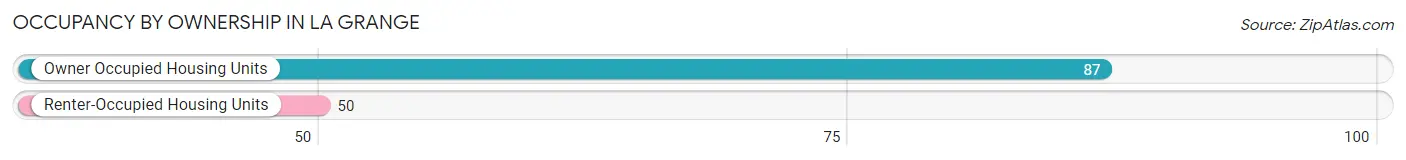
| Occupancy | # Housing Units | % Housing Units |
| Owner Occupied Housing Units | 87 | 63.5% |
| Renter-Occupied Housing Units | 50 | 36.5% |
| Total Occupied Housing Units | 137 | 100.0% |
Occupancy by Household Size in La Grange
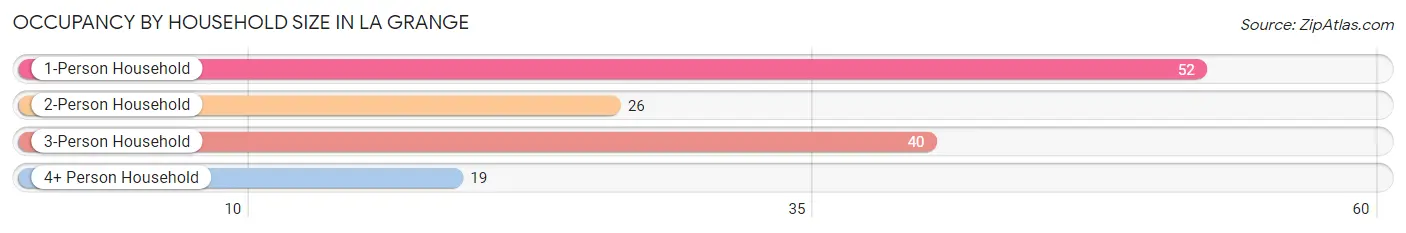
| Household Size | # Housing Units | % Housing Units |
| 1-Person Household | 52 | 38.0% |
| 2-Person Household | 26 | 19.0% |
| 3-Person Household | 40 | 29.2% |
| 4+ Person Household | 19 | 13.9% |
| Total Housing Units | 137 | 100.0% |
Occupancy by Ownership by Household Size in La Grange
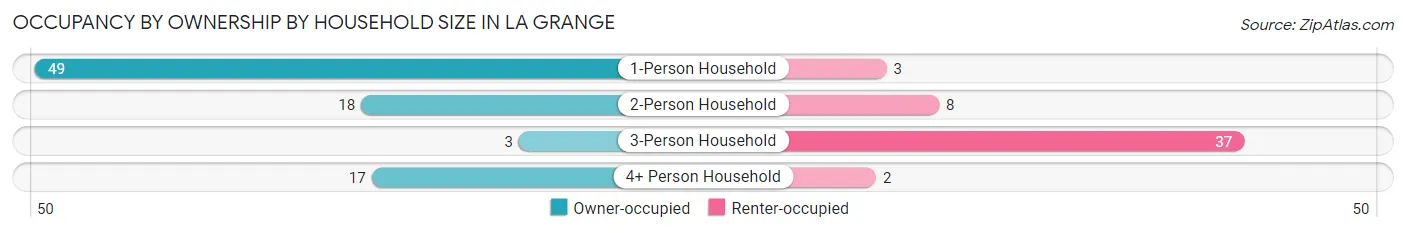
| Household Size | Owner-occupied | Renter-occupied |
| 1-Person Household | 49 (94.2%) | 3 (5.8%) |
| 2-Person Household | 18 (69.2%) | 8 (30.8%) |
| 3-Person Household | 3 (7.5%) | 37 (92.5%) |
| 4+ Person Household | 17 (89.5%) | 2 (10.5%) |
| Total Housing Units | 87 (63.5%) | 50 (36.5%) |
Occupancy by Educational Attainment in La Grange
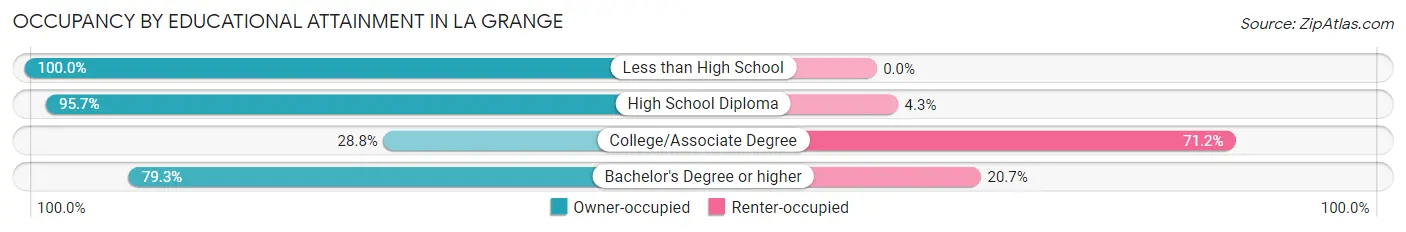
| Household Size | Owner-occupied | Renter-occupied |
| Less than High School | 2 (100.0%) | 0 (0.0%) |
| High School Diploma | 45 (95.7%) | 2 (4.3%) |
| College/Associate Degree | 17 (28.8%) | 42 (71.2%) |
| Bachelor's Degree or higher | 23 (79.3%) | 6 (20.7%) |
Occupancy by Age of Householder in La Grange
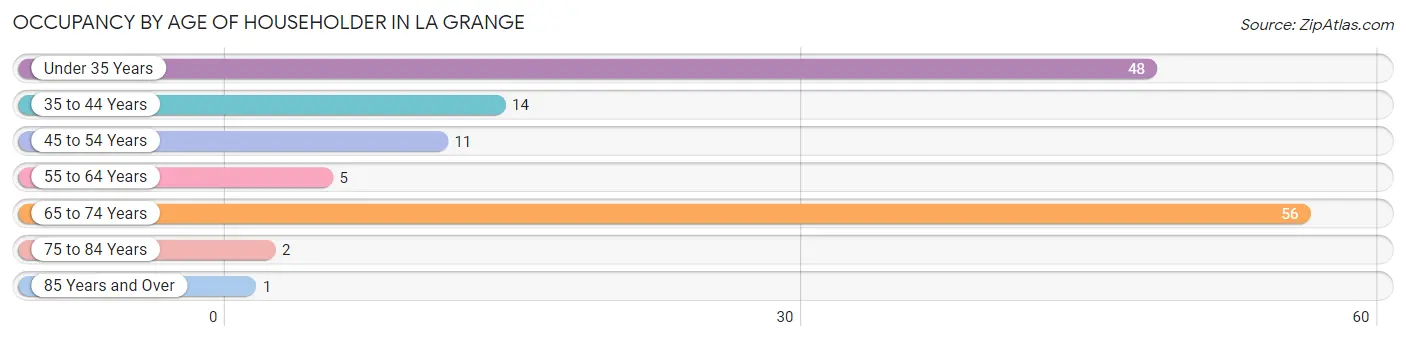
| Age Bracket | # Households | % Households |
| Under 35 Years | 48 | 35.0% |
| 35 to 44 Years | 14 | 10.2% |
| 45 to 54 Years | 11 | 8.0% |
| 55 to 64 Years | 5 | 3.6% |
| 65 to 74 Years | 56 | 40.9% |
| 75 to 84 Years | 2 | 1.5% |
| 85 Years and Over | 1 | 0.7% |
| Total | 137 | 100.0% |
Housing Finances in La Grange
Median Income by Occupancy in La Grange
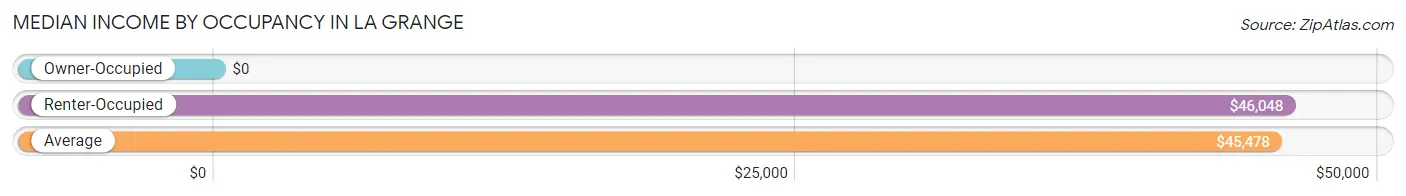
| Occupancy Type | # Households | Median Income |
| Owner-Occupied | 87 (63.5%) | $0 |
| Renter-Occupied | 50 (36.5%) | $46,048 |
| Average | 137 (100.0%) | $45,478 |
Occupancy by Householder Income Bracket in La Grange
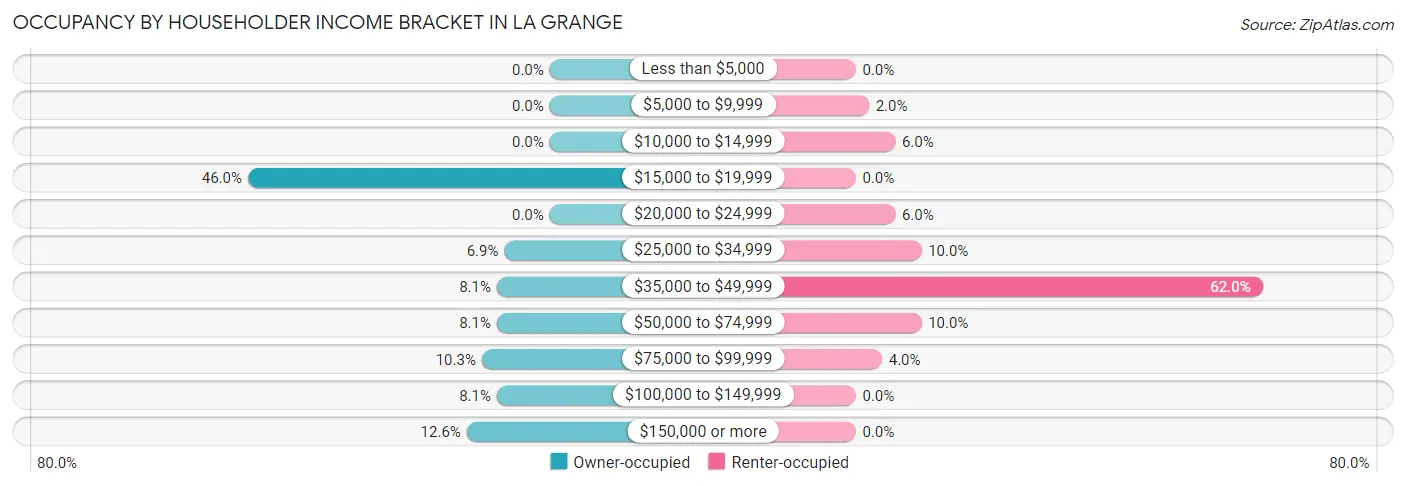
| Income Bracket | Owner-occupied | Renter-occupied |
| Less than $5,000 | 0 (0.0%) | 0 (0.0%) |
| $5,000 to $9,999 | 0 (0.0%) | 1 (2.0%) |
| $10,000 to $14,999 | 0 (0.0%) | 3 (6.0%) |
| $15,000 to $19,999 | 40 (46.0%) | 0 (0.0%) |
| $20,000 to $24,999 | 0 (0.0%) | 3 (6.0%) |
| $25,000 to $34,999 | 6 (6.9%) | 5 (10.0%) |
| $35,000 to $49,999 | 7 (8.1%) | 31 (62.0%) |
| $50,000 to $74,999 | 7 (8.1%) | 5 (10.0%) |
| $75,000 to $99,999 | 9 (10.3%) | 2 (4.0%) |
| $100,000 to $149,999 | 7 (8.1%) | 0 (0.0%) |
| $150,000 or more | 11 (12.6%) | 0 (0.0%) |
| Total | 87 (100.0%) | 50 (100.0%) |
Monthly Housing Cost Tiers in La Grange
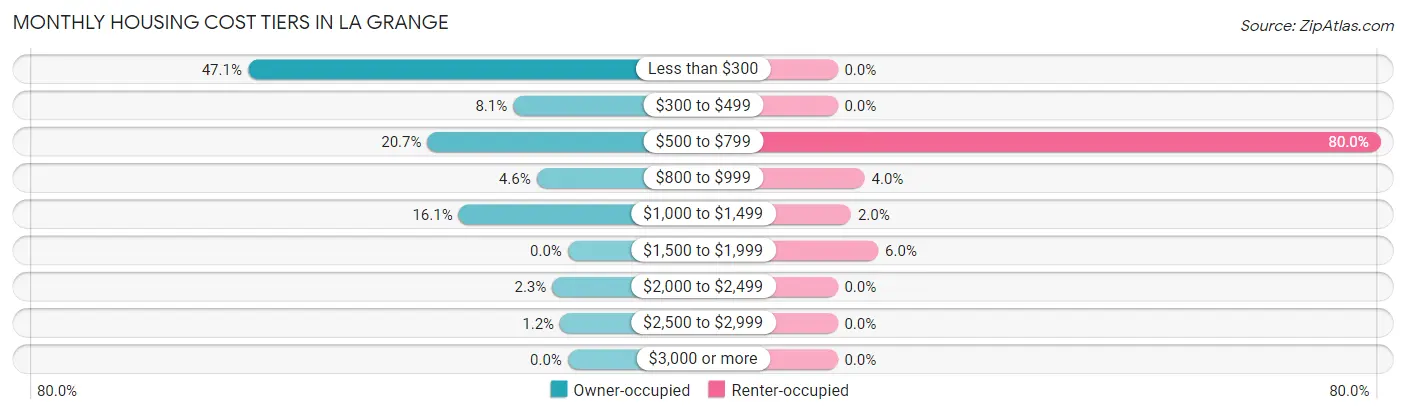
| Monthly Cost | Owner-occupied | Renter-occupied |
| Less than $300 | 41 (47.1%) | 0 (0.0%) |
| $300 to $499 | 7 (8.1%) | 0 (0.0%) |
| $500 to $799 | 18 (20.7%) | 40 (80.0%) |
| $800 to $999 | 4 (4.6%) | 2 (4.0%) |
| $1,000 to $1,499 | 14 (16.1%) | 1 (2.0%) |
| $1,500 to $1,999 | 0 (0.0%) | 3 (6.0%) |
| $2,000 to $2,499 | 2 (2.3%) | 0 (0.0%) |
| $2,500 to $2,999 | 1 (1.1%) | 0 (0.0%) |
| $3,000 or more | 0 (0.0%) | 0 (0.0%) |
| Total | 87 (100.0%) | 50 (100.0%) |
Physical Housing Characteristics in La Grange
Housing Structures in La Grange
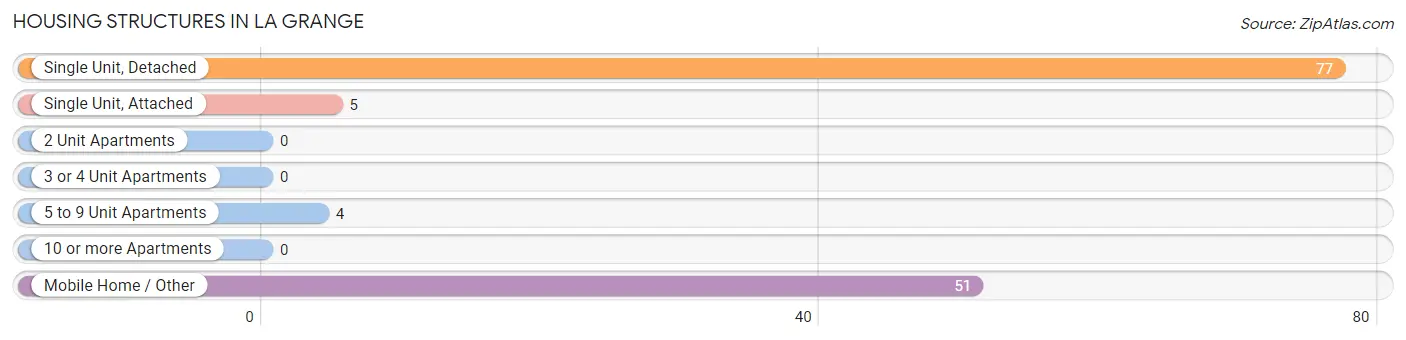
| Structure Type | # Housing Units | % Housing Units |
| Single Unit, Detached | 77 | 56.2% |
| Single Unit, Attached | 5 | 3.6% |
| 2 Unit Apartments | 0 | 0.0% |
| 3 or 4 Unit Apartments | 0 | 0.0% |
| 5 to 9 Unit Apartments | 4 | 2.9% |
| 10 or more Apartments | 0 | 0.0% |
| Mobile Home / Other | 51 | 37.2% |
| Total | 137 | 100.0% |
Housing Structures by Occupancy in La Grange
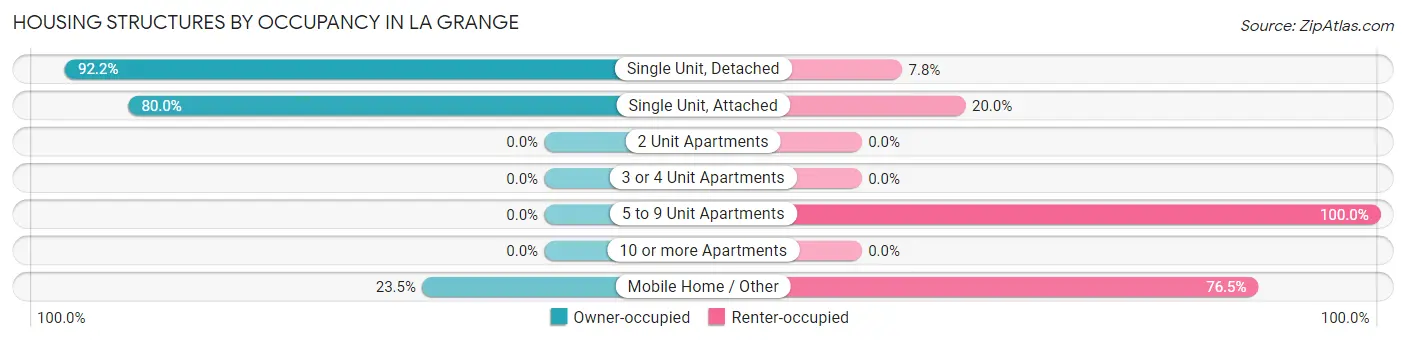
| Structure Type | Owner-occupied | Renter-occupied |
| Single Unit, Detached | 71 (92.2%) | 6 (7.8%) |
| Single Unit, Attached | 4 (80.0%) | 1 (20.0%) |
| 2 Unit Apartments | 0 (0.0%) | 0 (0.0%) |
| 3 or 4 Unit Apartments | 0 (0.0%) | 0 (0.0%) |
| 5 to 9 Unit Apartments | 0 (0.0%) | 4 (100.0%) |
| 10 or more Apartments | 0 (0.0%) | 0 (0.0%) |
| Mobile Home / Other | 12 (23.5%) | 39 (76.5%) |
| Total | 87 (63.5%) | 50 (36.5%) |
Housing Structures by Number of Rooms in La Grange
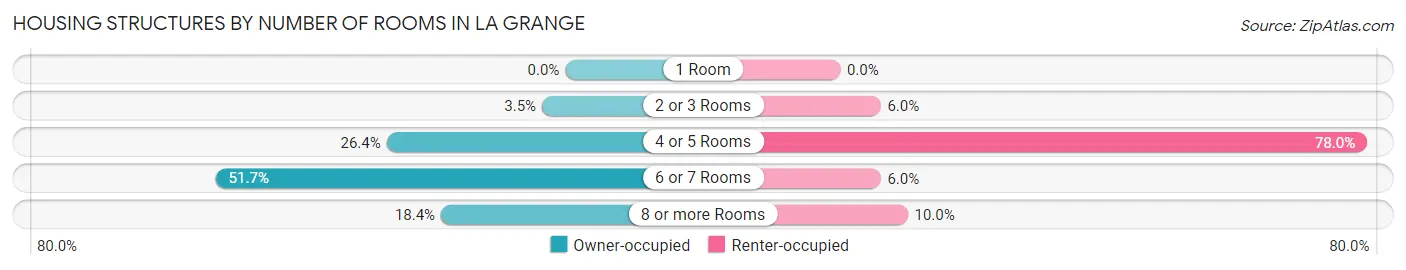
| Number of Rooms | Owner-occupied | Renter-occupied |
| 1 Room | 0 (0.0%) | 0 (0.0%) |
| 2 or 3 Rooms | 3 (3.5%) | 3 (6.0%) |
| 4 or 5 Rooms | 23 (26.4%) | 39 (78.0%) |
| 6 or 7 Rooms | 45 (51.7%) | 3 (6.0%) |
| 8 or more Rooms | 16 (18.4%) | 5 (10.0%) |
| Total | 87 (100.0%) | 50 (100.0%) |
Housing Structure by Heating Type in La Grange
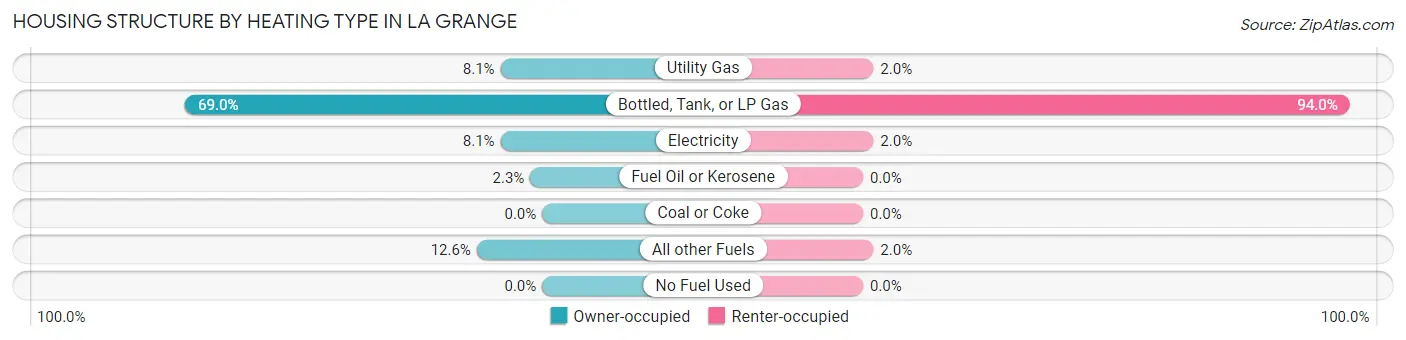
| Heating Type | Owner-occupied | Renter-occupied |
| Utility Gas | 7 (8.1%) | 1 (2.0%) |
| Bottled, Tank, or LP Gas | 60 (69.0%) | 47 (94.0%) |
| Electricity | 7 (8.1%) | 1 (2.0%) |
| Fuel Oil or Kerosene | 2 (2.3%) | 0 (0.0%) |
| Coal or Coke | 0 (0.0%) | 0 (0.0%) |
| All other Fuels | 11 (12.6%) | 1 (2.0%) |
| No Fuel Used | 0 (0.0%) | 0 (0.0%) |
| Total | 87 (100.0%) | 50 (100.0%) |
Household Vehicle Usage in La Grange
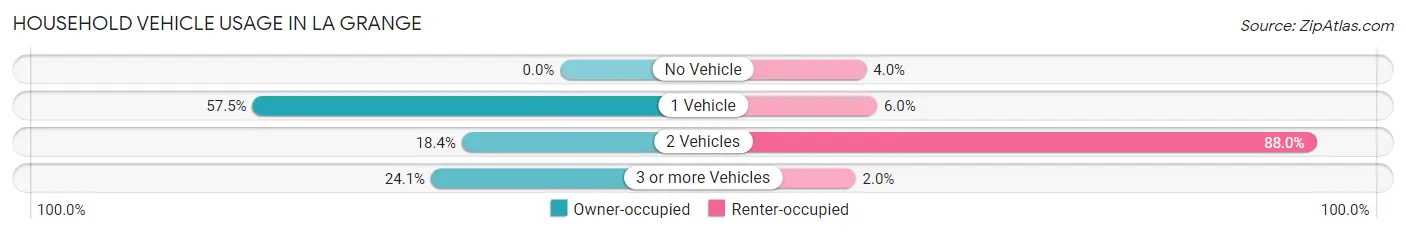
| Vehicles per Household | Owner-occupied | Renter-occupied |
| No Vehicle | 0 (0.0%) | 2 (4.0%) |
| 1 Vehicle | 50 (57.5%) | 3 (6.0%) |
| 2 Vehicles | 16 (18.4%) | 44 (88.0%) |
| 3 or more Vehicles | 21 (24.1%) | 1 (2.0%) |
| Total | 87 (100.0%) | 50 (100.0%) |
Real Estate & Mortgages in La Grange
Real Estate and Mortgage Overview in La Grange
| Characteristic | Without Mortgage | With Mortgage |
| Housing Units | 70 | 17 |
| Median Property Value | $56,600 | $162,500 |
| Median Household Income | - | - |
| Monthly Housing Costs | - | - |
| Real Estate Taxes | $264 | $0 |
Property Value by Mortgage Status in La Grange
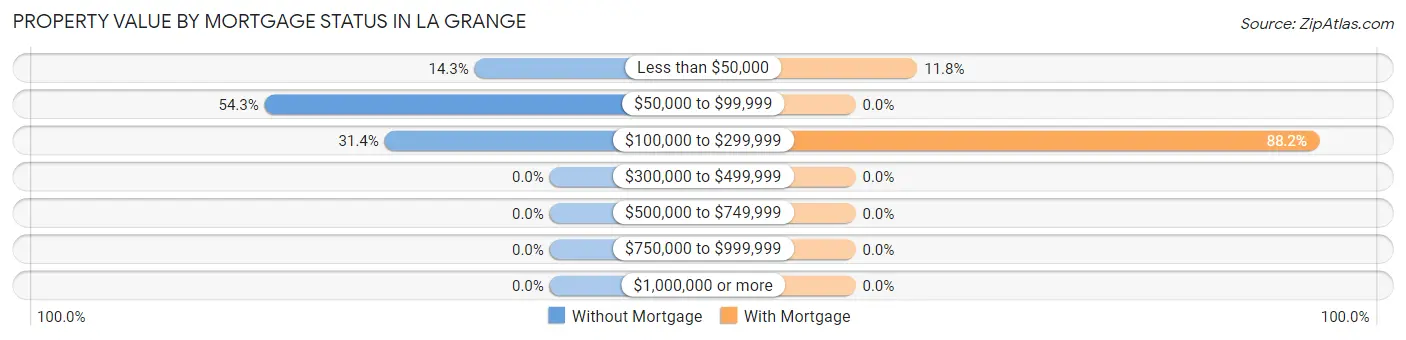
| Property Value | Without Mortgage | With Mortgage |
| Less than $50,000 | 10 (14.3%) | 2 (11.8%) |
| $50,000 to $99,999 | 38 (54.3%) | 0 (0.0%) |
| $100,000 to $299,999 | 22 (31.4%) | 15 (88.2%) |
| $300,000 to $499,999 | 0 (0.0%) | 0 (0.0%) |
| $500,000 to $749,999 | 0 (0.0%) | 0 (0.0%) |
| $750,000 to $999,999 | 0 (0.0%) | 0 (0.0%) |
| $1,000,000 or more | 0 (0.0%) | 0 (0.0%) |
| Total | 70 (100.0%) | 17 (100.0%) |
Household Income by Mortgage Status in La Grange
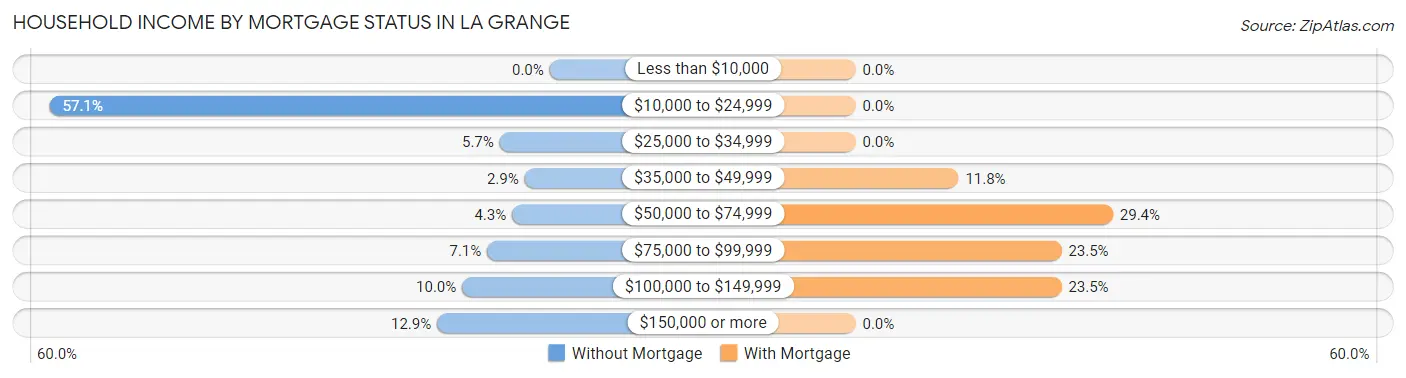
| Household Income | Without Mortgage | With Mortgage |
| Less than $10,000 | 0 (0.0%) | 0 (0.0%) |
| $10,000 to $24,999 | 40 (57.1%) | 0 (0.0%) |
| $25,000 to $34,999 | 4 (5.7%) | 0 (0.0%) |
| $35,000 to $49,999 | 2 (2.9%) | 2 (11.8%) |
| $50,000 to $74,999 | 3 (4.3%) | 5 (29.4%) |
| $75,000 to $99,999 | 5 (7.1%) | 4 (23.5%) |
| $100,000 to $149,999 | 7 (10.0%) | 4 (23.5%) |
| $150,000 or more | 9 (12.9%) | 0 (0.0%) |
| Total | 70 (100.0%) | 17 (100.0%) |
Property Value to Household Income Ratio in La Grange
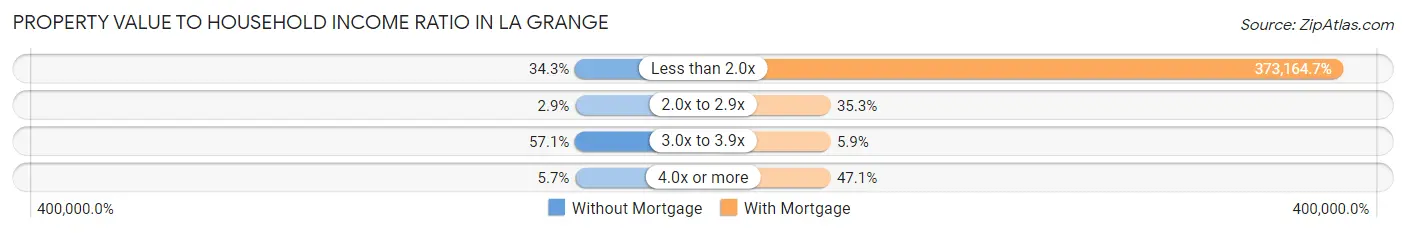
| Value-to-Income Ratio | Without Mortgage | With Mortgage |
| Less than 2.0x | 24 (34.3%) | 63,438 (373,164.7%) |
| 2.0x to 2.9x | 2 (2.9%) | 6 (35.3%) |
| 3.0x to 3.9x | 40 (57.1%) | 1 (5.9%) |
| 4.0x or more | 4 (5.7%) | 8 (47.1%) |
| Total | 70 (100.0%) | 17 (100.0%) |
Real Estate Taxes by Mortgage Status in La Grange

| Property Taxes | Without Mortgage | With Mortgage |
| Less than $800 | 58 (82.9%) | 0 (0.0%) |
| $800 to $1,499 | 8 (11.4%) | 7 (41.2%) |
| $800 to $1,499 | 4 (5.7%) | 8 (47.1%) |
| Total | 70 (100.0%) | 17 (100.0%) |
Health & Disability in La Grange
Health Insurance Coverage by Age in La Grange
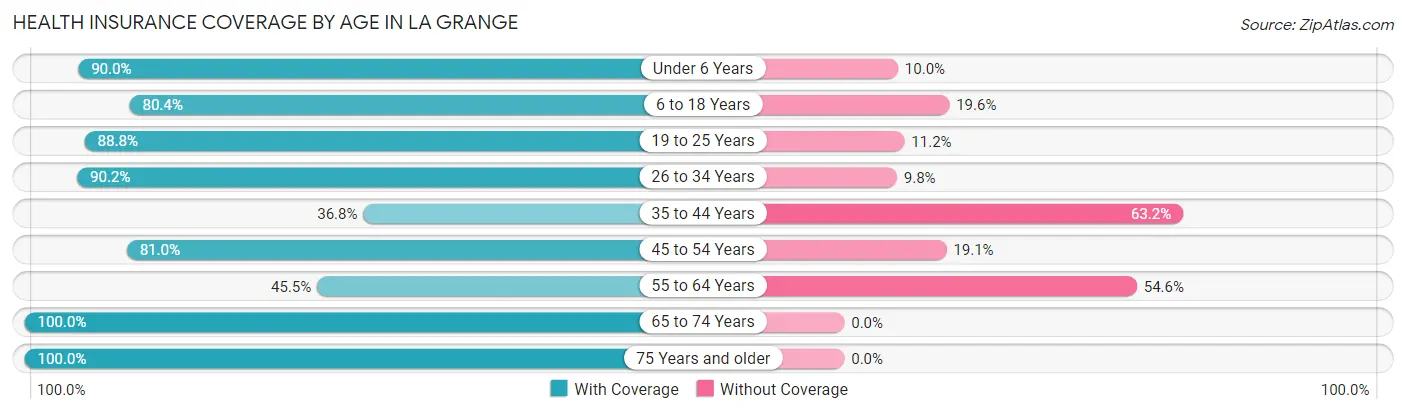
| Age Bracket | With Coverage | Without Coverage |
| Under 6 Years | 18 (90.0%) | 2 (10.0%) |
| 6 to 18 Years | 37 (80.4%) | 9 (19.6%) |
| 19 to 25 Years | 103 (88.8%) | 13 (11.2%) |
| 26 to 34 Years | 46 (90.2%) | 5 (9.8%) |
| 35 to 44 Years | 7 (36.8%) | 12 (63.2%) |
| 45 to 54 Years | 17 (80.9%) | 4 (19.1%) |
| 55 to 64 Years | 5 (45.5%) | 6 (54.5%) |
| 65 to 74 Years | 66 (100.0%) | 0 (0.0%) |
| 75 Years and older | 6 (100.0%) | 0 (0.0%) |
| Total | 305 (85.7%) | 51 (14.3%) |
Health Insurance Coverage by Citizenship Status in La Grange
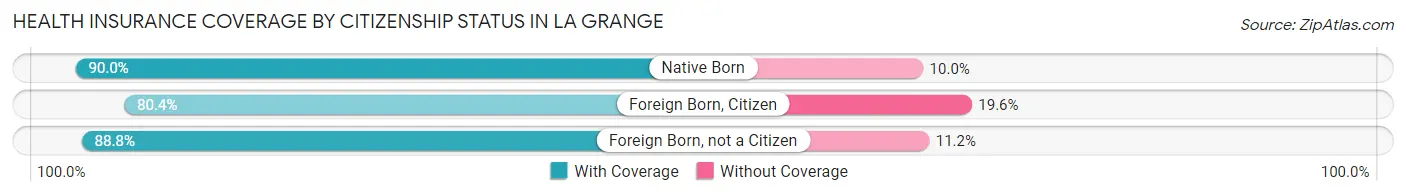
| Citizenship Status | With Coverage | Without Coverage |
| Native Born | 18 (90.0%) | 2 (10.0%) |
| Foreign Born, Citizen | 37 (80.4%) | 9 (19.6%) |
| Foreign Born, not a Citizen | 103 (88.8%) | 13 (11.2%) |
Health Insurance Coverage by Household Income in La Grange
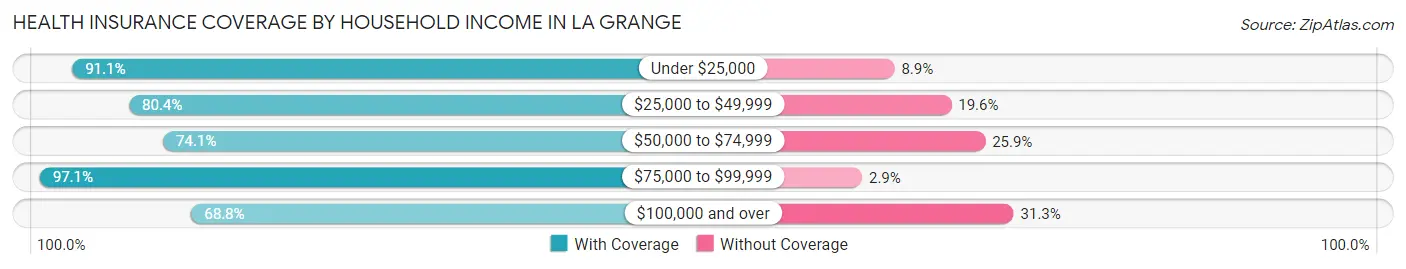
| Household Income | With Coverage | Without Coverage |
| Under $25,000 | 51 (91.1%) | 5 (8.9%) |
| $25,000 to $49,999 | 74 (80.4%) | 18 (19.6%) |
| $50,000 to $74,999 | 20 (74.1%) | 7 (25.9%) |
| $75,000 to $99,999 | 34 (97.1%) | 1 (2.9%) |
| $100,000 and over | 33 (68.8%) | 15 (31.2%) |
Public vs Private Health Insurance Coverage by Age in La Grange
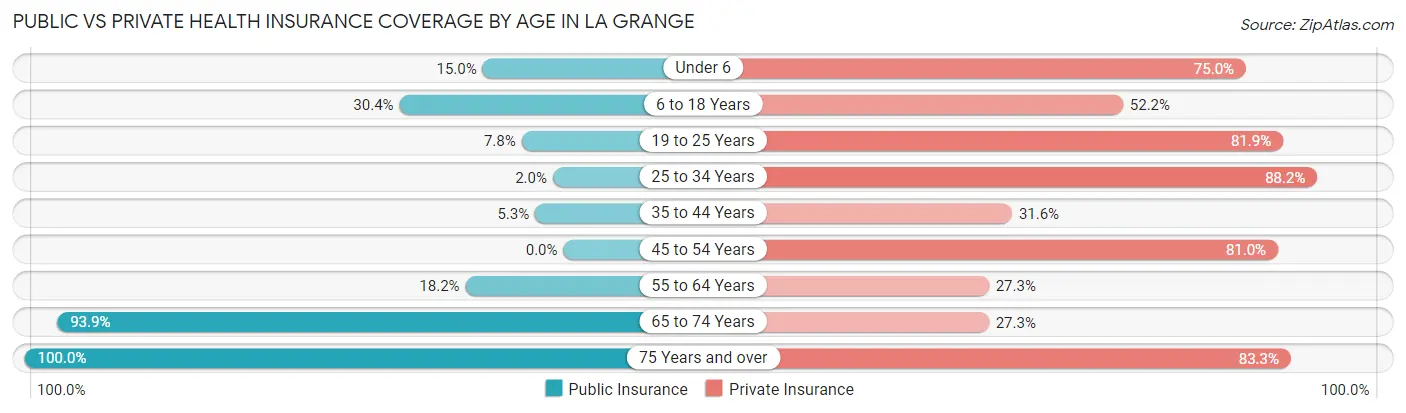
| Age Bracket | Public Insurance | Private Insurance |
| Under 6 | 3 (15.0%) | 15 (75.0%) |
| 6 to 18 Years | 14 (30.4%) | 24 (52.2%) |
| 19 to 25 Years | 9 (7.8%) | 95 (81.9%) |
| 25 to 34 Years | 1 (2.0%) | 45 (88.2%) |
| 35 to 44 Years | 1 (5.3%) | 6 (31.6%) |
| 45 to 54 Years | 0 (0.0%) | 17 (80.9%) |
| 55 to 64 Years | 2 (18.2%) | 3 (27.3%) |
| 65 to 74 Years | 62 (93.9%) | 18 (27.3%) |
| 75 Years and over | 6 (100.0%) | 5 (83.3%) |
| Total | 98 (27.5%) | 228 (64.0%) |
Disability Status by Sex by Age in La Grange
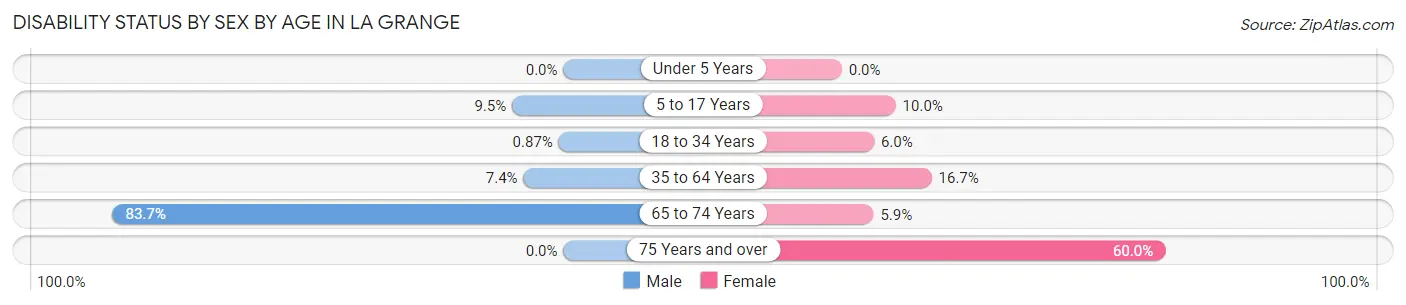
| Age Bracket | Male | Female |
| Under 5 Years | 0 (0.0%) | 0 (0.0%) |
| 5 to 17 Years | 2 (9.5%) | 1 (10.0%) |
| 18 to 34 Years | 1 (0.9%) | 4 (6.0%) |
| 35 to 64 Years | 2 (7.4%) | 4 (16.7%) |
| 65 to 74 Years | 41 (83.7%) | 1 (5.9%) |
| 75 Years and over | 0 (0.0%) | 3 (60.0%) |
Disability Class by Sex by Age in La Grange
Disability Class: Hearing Difficulty
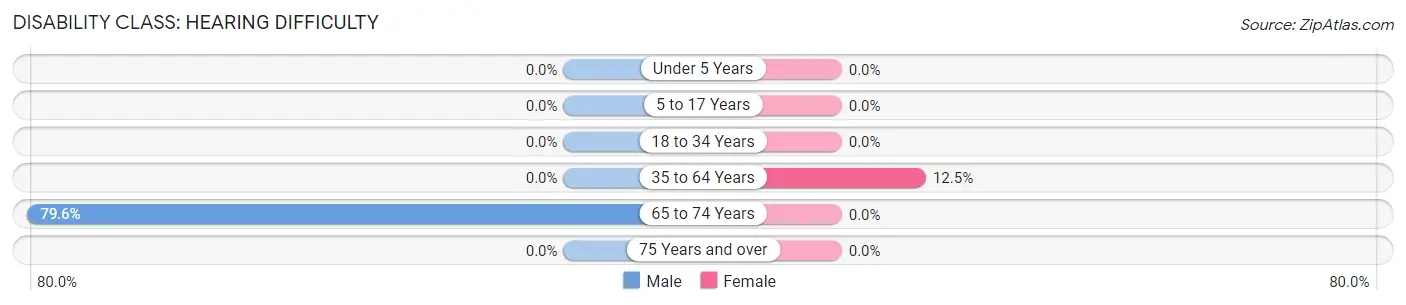
| Age Bracket | Male | Female |
| Under 5 Years | 0 (0.0%) | 0 (0.0%) |
| 5 to 17 Years | 0 (0.0%) | 0 (0.0%) |
| 18 to 34 Years | 0 (0.0%) | 0 (0.0%) |
| 35 to 64 Years | 0 (0.0%) | 3 (12.5%) |
| 65 to 74 Years | 39 (79.6%) | 0 (0.0%) |
| 75 Years and over | 0 (0.0%) | 0 (0.0%) |
Disability Class: Vision Difficulty
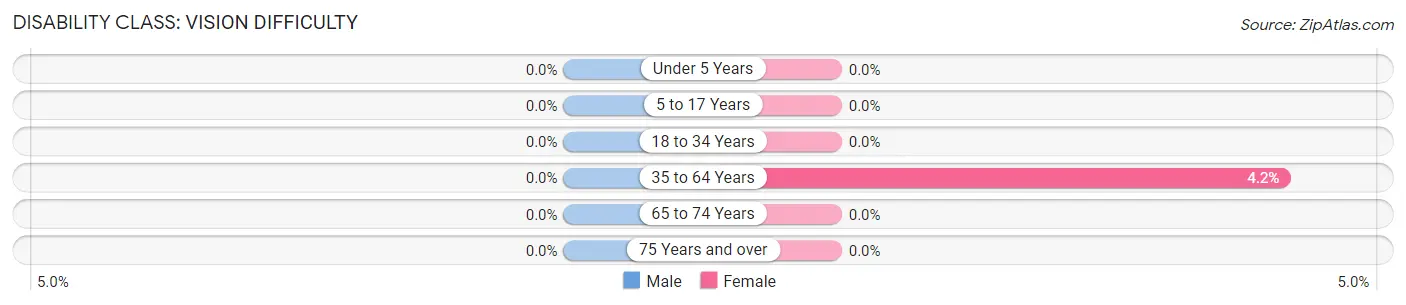
| Age Bracket | Male | Female |
| Under 5 Years | 0 (0.0%) | 0 (0.0%) |
| 5 to 17 Years | 0 (0.0%) | 0 (0.0%) |
| 18 to 34 Years | 0 (0.0%) | 0 (0.0%) |
| 35 to 64 Years | 0 (0.0%) | 1 (4.2%) |
| 65 to 74 Years | 0 (0.0%) | 0 (0.0%) |
| 75 Years and over | 0 (0.0%) | 0 (0.0%) |
Disability Class: Cognitive Difficulty
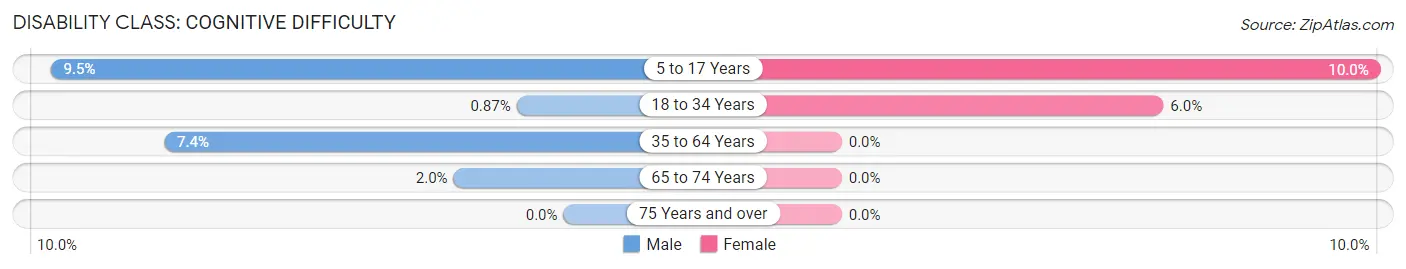
| Age Bracket | Male | Female |
| 5 to 17 Years | 2 (9.5%) | 1 (10.0%) |
| 18 to 34 Years | 1 (0.9%) | 4 (6.0%) |
| 35 to 64 Years | 2 (7.4%) | 0 (0.0%) |
| 65 to 74 Years | 1 (2.0%) | 0 (0.0%) |
| 75 Years and over | 0 (0.0%) | 0 (0.0%) |
Disability Class: Ambulatory Difficulty
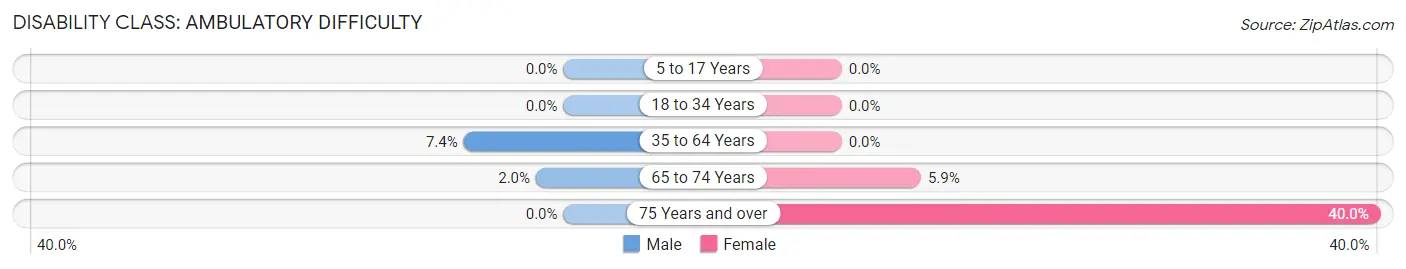
| Age Bracket | Male | Female |
| 5 to 17 Years | 0 (0.0%) | 0 (0.0%) |
| 18 to 34 Years | 0 (0.0%) | 0 (0.0%) |
| 35 to 64 Years | 2 (7.4%) | 0 (0.0%) |
| 65 to 74 Years | 1 (2.0%) | 1 (5.9%) |
| 75 Years and over | 0 (0.0%) | 2 (40.0%) |
Disability Class: Self-Care Difficulty
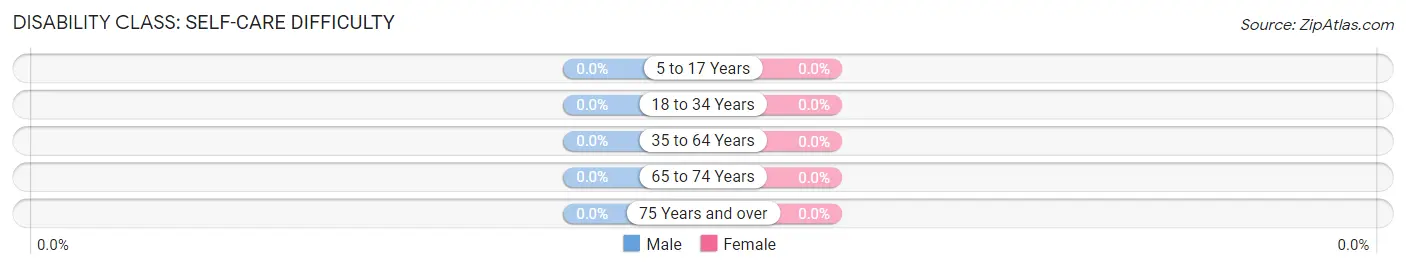
| Age Bracket | Male | Female |
| 5 to 17 Years | 0 (0.0%) | 0 (0.0%) |
| 18 to 34 Years | 0 (0.0%) | 0 (0.0%) |
| 35 to 64 Years | 0 (0.0%) | 0 (0.0%) |
| 65 to 74 Years | 0 (0.0%) | 0 (0.0%) |
| 75 Years and over | 0 (0.0%) | 0 (0.0%) |
Technology Access in La Grange
Computing Device Access in La Grange
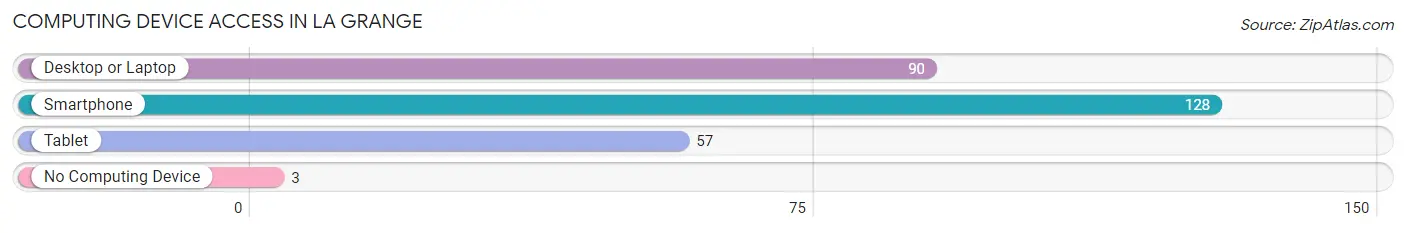
| Device Type | # Households | % Households |
| Desktop or Laptop | 90 | 65.7% |
| Smartphone | 128 | 93.4% |
| Tablet | 57 | 41.6% |
| No Computing Device | 3 | 2.2% |
| Total | 137 | 100.0% |
Internet Access in La Grange
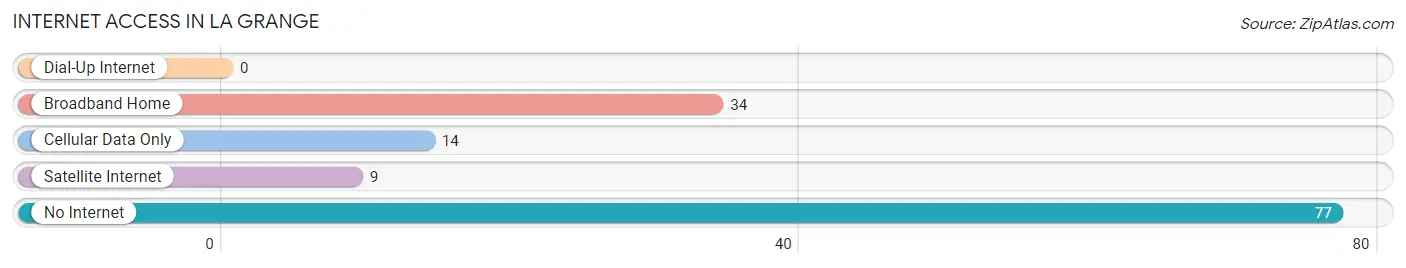
| Internet Type | # Households | % Households |
| Dial-Up Internet | 0 | 0.0% |
| Broadband Home | 34 | 24.8% |
| Cellular Data Only | 14 | 10.2% |
| Satellite Internet | 9 | 6.6% |
| No Internet | 77 | 56.2% |
| Total | 137 | 100.0% |
La Grange Summary
La Grange, Wyoming is a small town located in the southeastern corner of the state, near the border with Colorado. It is situated in the Laramie River Valley, at an elevation of 6,845 feet. The town was founded in 1882 and is the county seat of Laramie County.
History
La Grange was founded in 1882 by a group of settlers from the nearby town of Laramie. The town was named after the nearby La Grange Creek, which was named by French fur trappers who had traveled through the area in the early 1800s. The town was originally a farming and ranching community, and the first post office was established in 1883.
In the late 1800s, the town began to grow as a result of the construction of the Union Pacific Railroad. The railroad brought new settlers to the area, and the town soon became a hub for the surrounding ranches and farms.
In the early 1900s, the town began to experience a period of growth and prosperity. The population increased from just over 200 in 1900 to over 1,000 by 1910. The town was incorporated in 1910, and the first mayor was elected in 1911.
In the 1920s, the town experienced a period of decline as the railroad began to move away from the area. The population decreased to just over 500 by 1930.
In the 1940s, the town began to experience a period of growth again as the railroad returned to the area. The population increased to over 1,000 by 1950.
In the 1950s, the town experienced a period of decline again as the railroad moved away from the area. The population decreased to just over 500 by 1960.
In the 1970s, the town began to experience a period of growth again as the railroad returned to the area. The population increased to over 1,000 by 1980.
In the 1990s, the town experienced a period of decline again as the railroad moved away from the area. The population decreased to just over 500 by 2000.
Geography
La Grange is located in the southeastern corner of Wyoming, near the border with Colorado. It is situated in the Laramie River Valley, at an elevation of 6,845 feet. The town is located on the banks of the Laramie River, and is surrounded by rolling hills and grasslands.
The climate in La Grange is semi-arid, with hot summers and cold winters. The average annual temperature is 45°F, and the average annual precipitation is 16 inches.
Economy
The economy of La Grange is largely based on agriculture and ranching. The town is home to several large ranches, and the surrounding area is used for cattle and sheep grazing.
The town is also home to several small businesses, including a grocery store, a hardware store, and a few restaurants.
Demographics
As of the 2010 census, the population of La Grange was 545. The racial makeup of the town was 95.2% White, 0.2% African American, 0.4% Native American, 0.2% Asian, 0.2% Pacific Islander, 0.4% from other races, and 3.4% from two or more races. Hispanic or Latino of any race were 2.2% of the population.
The median household income in La Grange was $41,250, and the median family income was $45,833. The per capita income was $19,945. About 11.2% of families and 14.2% of the population were below the poverty line, including 18.2% of those under age 18 and 8.3% of those age 65 or over.
Common Questions
What is Per Capita Income in La Grange?
Per Capita income in La Grange is $19,748.
What is the Median Family Income in La Grange?
Median Family Income in La Grange is $46,912.
What is the Median Household income in La Grange?
Median Household Income in La Grange is $45,478.
What is Inequality or Gini Index in La Grange?
Inequality or Gini Index in La Grange is 0.41.
What is the Total Population of La Grange?
Total Population of La Grange is 356.
What is the Total Male Population of La Grange?
Total Male Population of La Grange is 228.
What is the Total Female Population of La Grange?
Total Female Population of La Grange is 128.
What is the Ratio of Males per 100 Females in La Grange?
There are 178.12 Males per 100 Females in La Grange.
What is the Ratio of Females per 100 Males in La Grange?
There are 56.14 Females per 100 Males in La Grange.
What is the Median Population Age in La Grange?
Median Population Age in La Grange is 25.3 Years.
What is the Average Family Size in La Grange
Average Family Size in La Grange is 2.4 People.
What is the Average Household Size in La Grange
Average Household Size in La Grange is 1.9 People.
How Large is the Labor Force in La Grange?
There are 178 People in the Labor Forcein in La Grange.
What is the Percentage of People in the Labor Force in La Grange?
57.2% of People are in the Labor Force in La Grange.
What is the Unemployment Rate in La Grange?
Unemployment Rate in La Grange is 3.4%.