Cheyenne, WY Map & Demographics
Cheyenne Map
Cheyenne Overview
$41,908
PER CAPITA INCOME
$95,637
AVG FAMILY INCOME
$74,989
AVG HOUSEHOLD INCOME
36.8%
WAGE / INCOME GAP [ % ]
63.2¢/ $1
WAGE / INCOME GAP [ $ ]
$12,026
FAMILY INCOME DEFICIT
0.44
INEQUALITY / GINI INDEX
64,795
TOTAL POPULATION
32,393
MALE POPULATION
32,402
FEMALE POPULATION
99.97
MALES / 100 FEMALES
100.03
FEMALES / 100 MALES
38.3
MEDIAN AGE
3.0
AVG FAMILY SIZE
2.3
AVG HOUSEHOLD SIZE
35,407
LABOR FORCE [ PEOPLE ]
67.3%
PERCENT IN LABOR FORCE
3.4%
UNEMPLOYMENT RATE
Cheyenne Area Codes
Income in Cheyenne
Income Overview in Cheyenne
Per Capita Income in Cheyenne is $41,908, while median incomes of families and households are $95,637 and $74,989 respectively.
| Characteristic | Number | Measure |
| Per Capita Income | 64,795 | $41,908 |
| Median Family Income | 16,457 | $95,637 |
| Mean Family Income | 16,457 | $118,580 |
| Median Household Income | 28,306 | $74,989 |
| Mean Household Income | 28,306 | $94,396 |
| Income Deficit | 16,457 | $12,026 |
| Wage / Income Gap (%) | 64,795 | 36.80% |
| Wage / Income Gap ($) | 64,795 | 63.20¢ per $1 |
| Gini / Inequality Index | 64,795 | 0.44 |
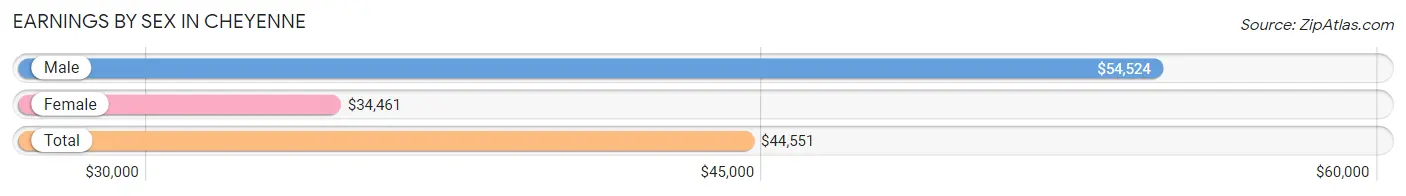
Earnings by Sex in Cheyenne
Average Earnings in Cheyenne are $44,551, $54,524 for men and $34,461 for women, a difference of 36.8%.
| Sex | Number | Average Earnings |
| Male | 19,803 (54.0%) | $54,524 |
| Female | 16,872 (46.0%) | $34,461 |
| Total | 36,675 (100.0%) | $44,551 |
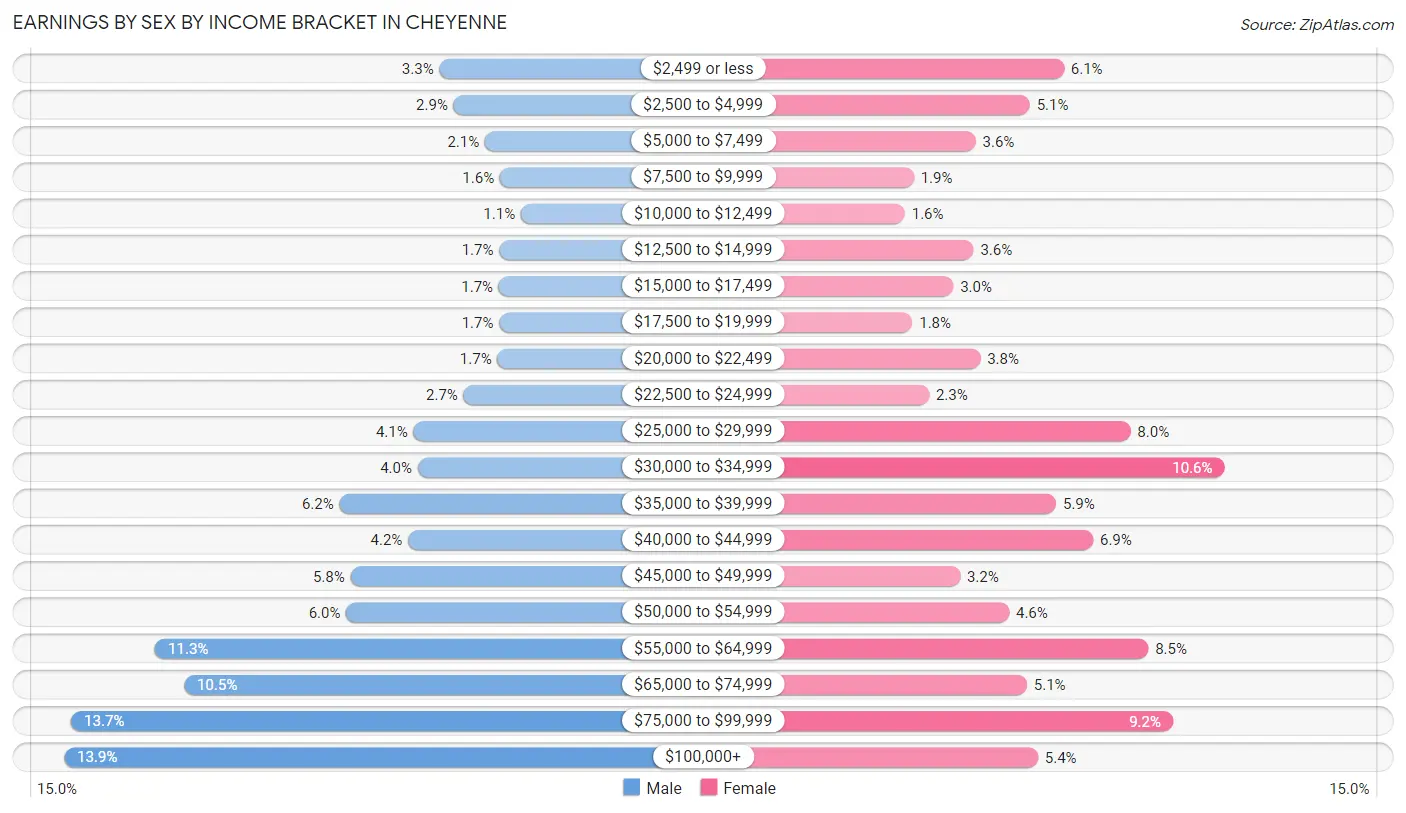
Earnings by Sex by Income Bracket in Cheyenne
The most common earnings brackets in Cheyenne are $100,000+ for men (2,751 | 13.9%) and $30,000 to $34,999 for women (1,790 | 10.6%).
| Income | Male | Female |
| $2,499 or less | 661 (3.3%) | 1,030 (6.1%) |
| $2,500 to $4,999 | 583 (2.9%) | 868 (5.1%) |
| $5,000 to $7,499 | 407 (2.1%) | 611 (3.6%) |
| $7,500 to $9,999 | 324 (1.6%) | 318 (1.9%) |
| $10,000 to $12,499 | 208 (1.1%) | 275 (1.6%) |
| $12,500 to $14,999 | 328 (1.7%) | 600 (3.6%) |
| $15,000 to $17,499 | 331 (1.7%) | 504 (3.0%) |
| $17,500 to $19,999 | 329 (1.7%) | 310 (1.8%) |
| $20,000 to $22,499 | 338 (1.7%) | 633 (3.7%) |
| $22,500 to $24,999 | 527 (2.7%) | 389 (2.3%) |
| $25,000 to $29,999 | 805 (4.1%) | 1,344 (8.0%) |
| $30,000 to $34,999 | 783 (4.0%) | 1,790 (10.6%) |
| $35,000 to $39,999 | 1,217 (6.1%) | 992 (5.9%) |
| $40,000 to $44,999 | 835 (4.2%) | 1,168 (6.9%) |
| $45,000 to $49,999 | 1,156 (5.8%) | 536 (3.2%) |
| $50,000 to $54,999 | 1,181 (6.0%) | 769 (4.6%) |
| $55,000 to $64,999 | 2,244 (11.3%) | 1,429 (8.5%) |
| $65,000 to $74,999 | 2,083 (10.5%) | 854 (5.1%) |
| $75,000 to $99,999 | 2,712 (13.7%) | 1,546 (9.2%) |
| $100,000+ | 2,751 (13.9%) | 906 (5.4%) |
| Total | 19,803 (100.0%) | 16,872 (100.0%) |
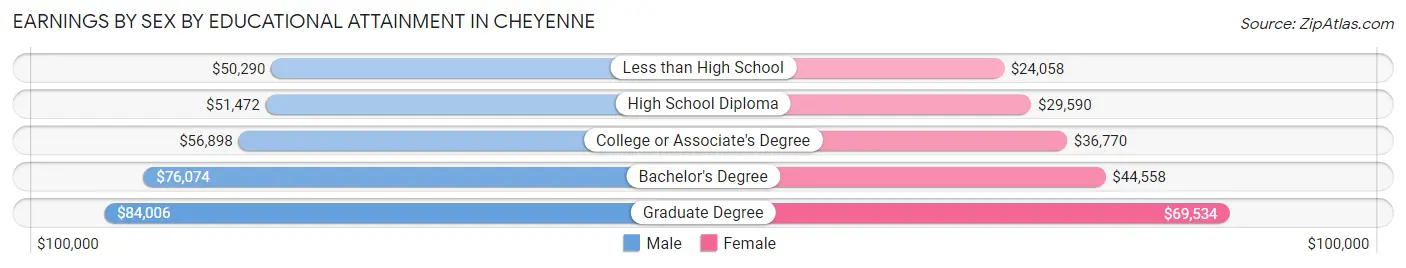
Earnings by Sex by Educational Attainment in Cheyenne
Average earnings in Cheyenne are $59,993 for men and $38,692 for women, a difference of 35.5%. Men with an educational attainment of graduate degree enjoy the highest average annual earnings of $84,006, while those with less than high school education earn the least with $50,290. Women with an educational attainment of graduate degree earn the most with the average annual earnings of $69,534, while those with less than high school education have the smallest earnings of $24,058.
| Educational Attainment | Male Income | Female Income |
| Less than High School | $50,290 | $24,058 |
| High School Diploma | $51,472 | $29,590 |
| College or Associate's Degree | $56,898 | $36,770 |
| Bachelor's Degree | $76,074 | $44,558 |
| Graduate Degree | $84,006 | $69,534 |
| Total | $59,993 | $38,692 |
Family Income in Cheyenne
Family Income Brackets in Cheyenne
According to the Cheyenne family income data, there are 4,197 families falling into the $100,000 to $149,999 income range, which is the most common income bracket and makes up 25.5% of all families. Conversely, the $10,000 to $14,999 income bracket is the least frequent group with only 132 families (0.8%) belonging to this category.
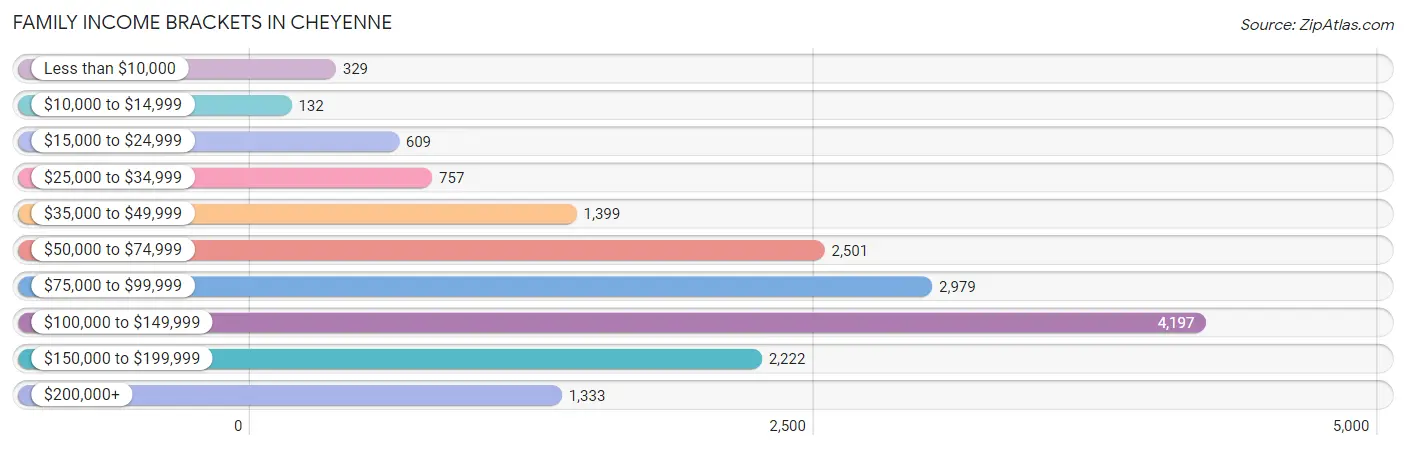
| Income Bracket | # Families | % Families |
| Less than $10,000 | 329 | 2.0% |
| $10,000 to $14,999 | 132 | 0.8% |
| $15,000 to $24,999 | 609 | 3.7% |
| $25,000 to $34,999 | 757 | 4.6% |
| $35,000 to $49,999 | 1,399 | 8.5% |
| $50,000 to $74,999 | 2,501 | 15.2% |
| $75,000 to $99,999 | 2,979 | 18.1% |
| $100,000 to $149,999 | 4,197 | 25.5% |
| $150,000 to $199,999 | 2,222 | 13.5% |
| $200,000+ | 1,333 | 8.1% |
Family Income by Famaliy Size in Cheyenne
4-person families (2,738 | 16.6%) account for the highest median family income in Cheyenne with $141,250 per family, while 2-person families (8,326 | 50.6%) have the highest median income of $43,292 per family member.
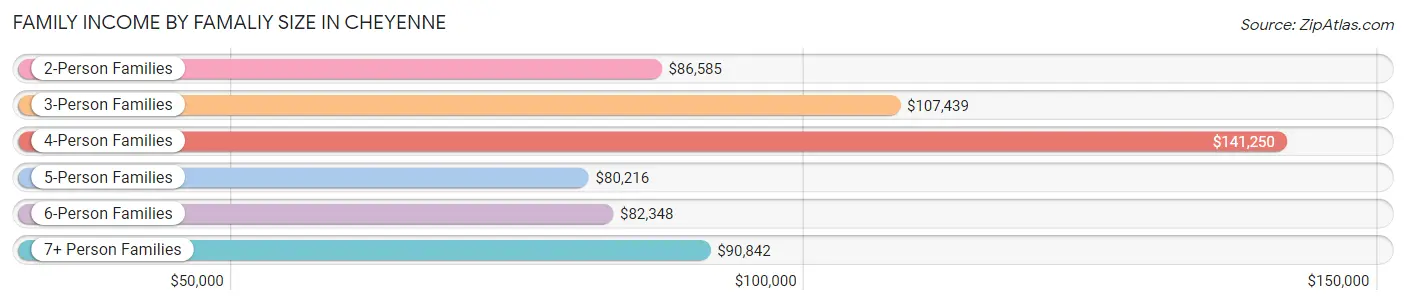
| Income Bracket | # Families | Median Income |
| 2-Person Families | 8,326 (50.6%) | $86,585 |
| 3-Person Families | 3,740 (22.7%) | $107,439 |
| 4-Person Families | 2,738 (16.6%) | $141,250 |
| 5-Person Families | 1,006 (6.1%) | $80,216 |
| 6-Person Families | 348 (2.1%) | $82,348 |
| 7+ Person Families | 299 (1.8%) | $90,842 |
| Total | 16,457 (100.0%) | $95,637 |
Family Income by Number of Earners in Cheyenne
The median family income in Cheyenne is $95,637, with families comprising 3+ earners (2,006) having the highest median family income of $151,667, while families with no earners (2,512) have the lowest median family income of $63,512, accounting for 12.2% and 15.3% of families, respectively.
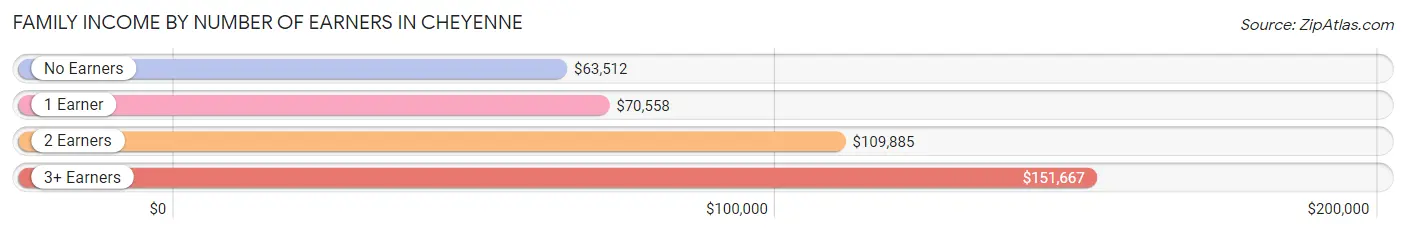
| Number of Earners | # Families | Median Income |
| No Earners | 2,512 (15.3%) | $63,512 |
| 1 Earner | 4,469 (27.2%) | $70,558 |
| 2 Earners | 7,470 (45.4%) | $109,885 |
| 3+ Earners | 2,006 (12.2%) | $151,667 |
| Total | 16,457 (100.0%) | $95,637 |
Household Income in Cheyenne
Household Income Brackets in Cheyenne
With 5,605 households falling in the category, the $100,000 to $149,999 income range is the most frequent in Cheyenne, accounting for 19.8% of all households. In contrast, only 849 households (3.0%) fall into the $10,000 to $14,999 income bracket, making it the least populous group.
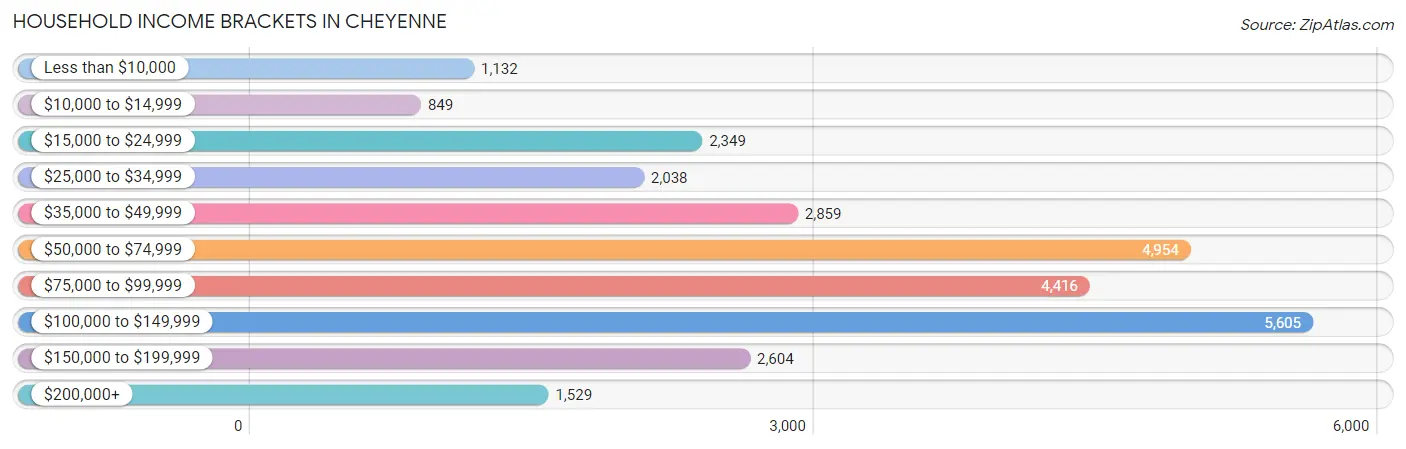
| Income Bracket | # Households | % Households |
| Less than $10,000 | 1,132 | 4.0% |
| $10,000 to $14,999 | 849 | 3.0% |
| $15,000 to $24,999 | 2,349 | 8.3% |
| $25,000 to $34,999 | 2,038 | 7.2% |
| $35,000 to $49,999 | 2,859 | 10.1% |
| $50,000 to $74,999 | 4,954 | 17.5% |
| $75,000 to $99,999 | 4,416 | 15.6% |
| $100,000 to $149,999 | 5,605 | 19.8% |
| $150,000 to $199,999 | 2,604 | 9.2% |
| $200,000+ | 1,529 | 5.4% |
Household Income by Householder Age in Cheyenne
The median household income in Cheyenne is $74,989, with the highest median household income of $84,211 found in the 45 to 64 years age bracket for the primary householder. A total of 9,450 households (33.4%) fall into this category. Meanwhile, the 15 to 24 years age bracket for the primary householder has the lowest median household income of $51,545, with 1,424 households (5.0%) in this group.
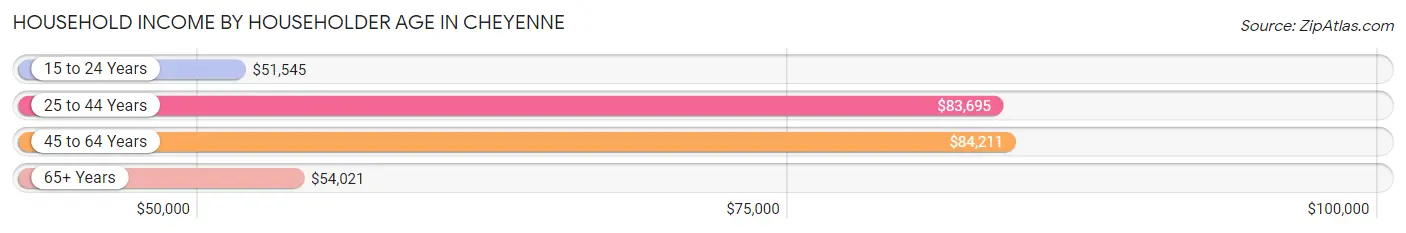
| Income Bracket | # Households | Median Income |
| 15 to 24 Years | 1,424 (5.0%) | $51,545 |
| 25 to 44 Years | 9,908 (35.0%) | $83,695 |
| 45 to 64 Years | 9,450 (33.4%) | $84,211 |
| 65+ Years | 7,524 (26.6%) | $54,021 |
| Total | 28,306 (100.0%) | $74,989 |
Poverty in Cheyenne
Income Below Poverty by Sex and Age in Cheyenne
With 7.3% poverty level for males and 9.7% for females among the residents of Cheyenne, 15 year old males and 15 year old females are the most vulnerable to poverty, with 123 males (34.4%) and 156 females (25.4%) in their respective age groups living below the poverty level.
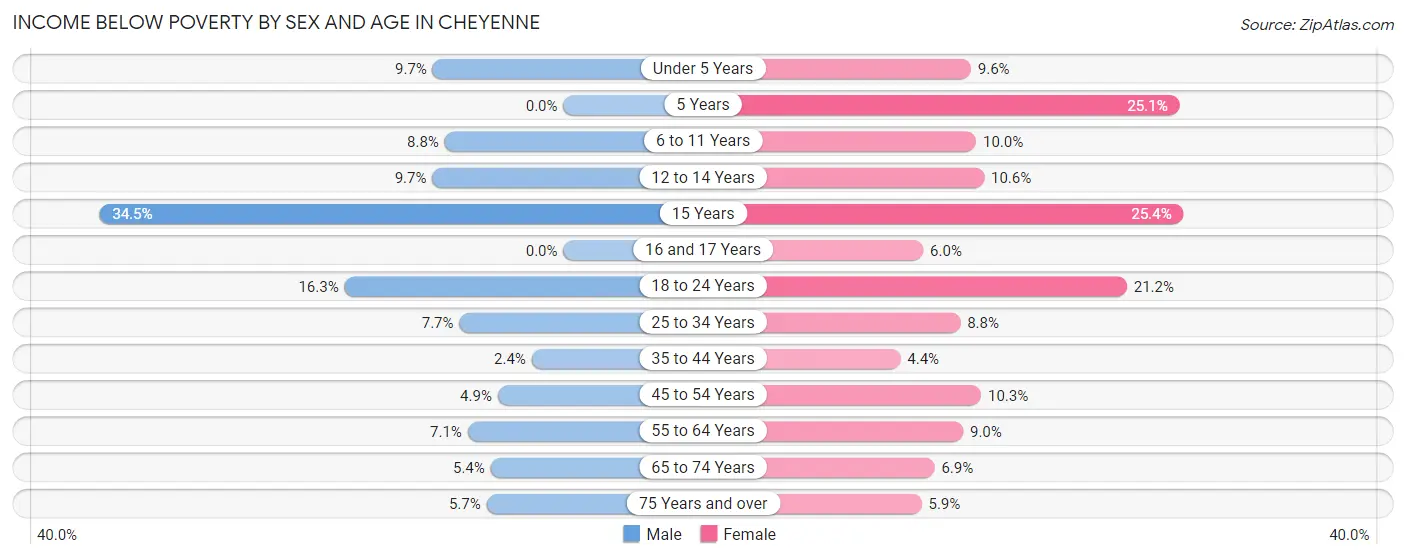
| Age Bracket | Male | Female |
| Under 5 Years | 174 (9.7%) | 187 (9.6%) |
| 5 Years | 0 (0.0%) | 87 (25.1%) |
| 6 to 11 Years | 177 (8.8%) | 221 (10.0%) |
| 12 to 14 Years | 101 (9.7%) | 127 (10.6%) |
| 15 Years | 123 (34.4%) | 156 (25.4%) |
| 16 and 17 Years | 0 (0.0%) | 42 (6.0%) |
| 18 to 24 Years | 490 (16.3%) | 560 (21.2%) |
| 25 to 34 Years | 422 (7.7%) | 429 (8.8%) |
| 35 to 44 Years | 101 (2.4%) | 170 (4.3%) |
| 45 to 54 Years | 182 (4.9%) | 361 (10.3%) |
| 55 to 64 Years | 283 (7.1%) | 364 (9.0%) |
| 65 to 74 Years | 170 (5.4%) | 237 (6.9%) |
| 75 Years and over | 106 (5.7%) | 148 (5.9%) |
| Total | 2,329 (7.3%) | 3,089 (9.7%) |
Income Above Poverty by Sex and Age in Cheyenne
According to the poverty statistics in Cheyenne, males aged 5 years and females aged 35 to 44 years are the age groups that are most secure financially, with 100.0% of males and 95.7% of females in these age groups living above the poverty line.
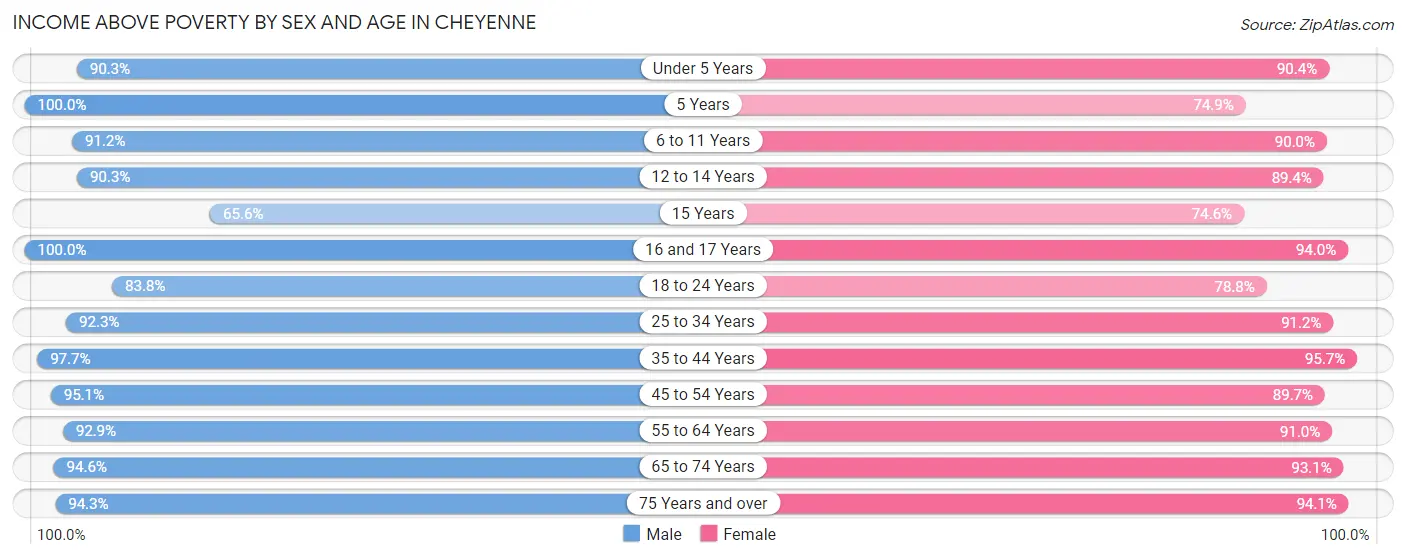
| Age Bracket | Male | Female |
| Under 5 Years | 1,620 (90.3%) | 1,766 (90.4%) |
| 5 Years | 359 (100.0%) | 260 (74.9%) |
| 6 to 11 Years | 1,832 (91.2%) | 1,995 (90.0%) |
| 12 to 14 Years | 937 (90.3%) | 1,076 (89.4%) |
| 15 Years | 234 (65.5%) | 459 (74.6%) |
| 16 and 17 Years | 799 (100.0%) | 653 (94.0%) |
| 18 to 24 Years | 2,525 (83.8%) | 2,086 (78.8%) |
| 25 to 34 Years | 5,041 (92.3%) | 4,450 (91.2%) |
| 35 to 44 Years | 4,191 (97.7%) | 3,737 (95.7%) |
| 45 to 54 Years | 3,556 (95.1%) | 3,131 (89.7%) |
| 55 to 64 Years | 3,704 (92.9%) | 3,680 (91.0%) |
| 65 to 74 Years | 2,979 (94.6%) | 3,208 (93.1%) |
| 75 Years and over | 1,754 (94.3%) | 2,350 (94.1%) |
| Total | 29,531 (92.7%) | 28,851 (90.3%) |
Income Below Poverty Among Married-Couple Families in Cheyenne
The poverty statistics for married-couple families in Cheyenne show that 2.3% or 293 of the total 12,949 families live below the poverty line. Families with 3 or 4 children have the highest poverty rate of 4.7%, comprising of 46 families. On the other hand, families with no children have the lowest poverty rate of 1.6%, which includes 121 families.
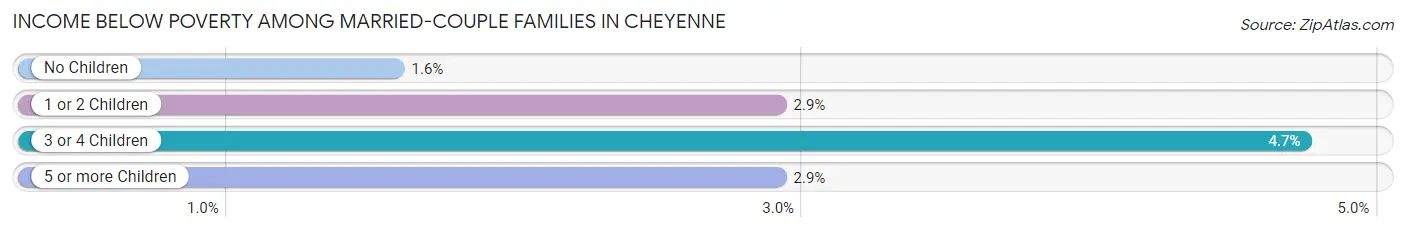
| Children | Above Poverty | Below Poverty |
| No Children | 7,524 (98.4%) | 121 (1.6%) |
| 1 or 2 Children | 4,007 (97.1%) | 120 (2.9%) |
| 3 or 4 Children | 925 (95.3%) | 46 (4.7%) |
| 5 or more Children | 200 (97.1%) | 6 (2.9%) |
| Total | 12,656 (97.7%) | 293 (2.3%) |
Income Below Poverty Among Single-Parent Households in Cheyenne
According to the poverty data in Cheyenne, 8.0% or 94 single-father households and 18.3% or 427 single-mother households are living below the poverty line. Among single-father households, those with 3 or 4 children have the highest poverty rate, with 37 households (50.7%) experiencing poverty. Likewise, among single-mother households, those with 3 or 4 children have the highest poverty rate, with 85 households (57.8%) falling below the poverty line.
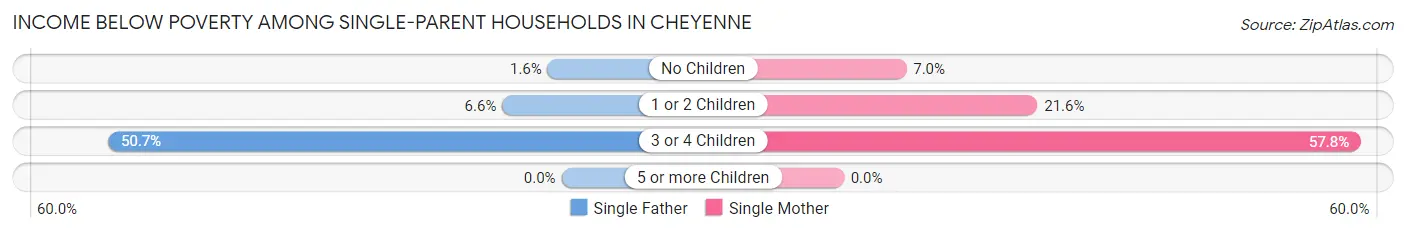
| Children | Single Father | Single Mother |
| No Children | 5 (1.5%) | 62 (7.0%) |
| 1 or 2 Children | 52 (6.6%) | 280 (21.6%) |
| 3 or 4 Children | 37 (50.7%) | 85 (57.8%) |
| 5 or more Children | 0 (0.0%) | 0 (0.0%) |
| Total | 94 (8.0%) | 427 (18.3%) |
Income Below Poverty Among Married-Couple vs Single-Parent Households in Cheyenne
The poverty data for Cheyenne shows that 293 of the married-couple family households (2.3%) and 521 of the single-parent households (14.8%) are living below the poverty level. Within the married-couple family households, those with 3 or 4 children have the highest poverty rate, with 46 households (4.7%) falling below the poverty line. Among the single-parent households, those with 3 or 4 children have the highest poverty rate, with 122 household (55.4%) living below poverty.
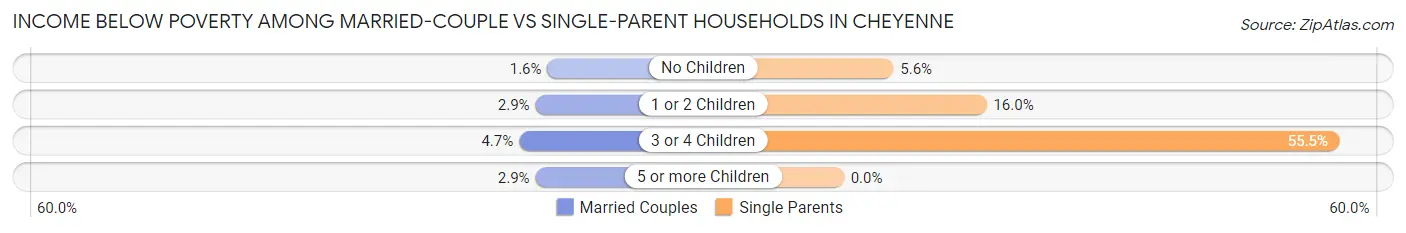
| Children | Married-Couple Families | Single-Parent Households |
| No Children | 121 (1.6%) | 67 (5.6%) |
| 1 or 2 Children | 120 (2.9%) | 332 (16.0%) |
| 3 or 4 Children | 46 (4.7%) | 122 (55.4%) |
| 5 or more Children | 6 (2.9%) | 0 (0.0%) |
| Total | 293 (2.3%) | 521 (14.8%) |
Race in Cheyenne
The most populous races in Cheyenne are White / Caucasian (54,365 | 83.9%), Hispanic or Latino (10,663 | 16.5%), and Two or more Races (4,871 | 7.5%).
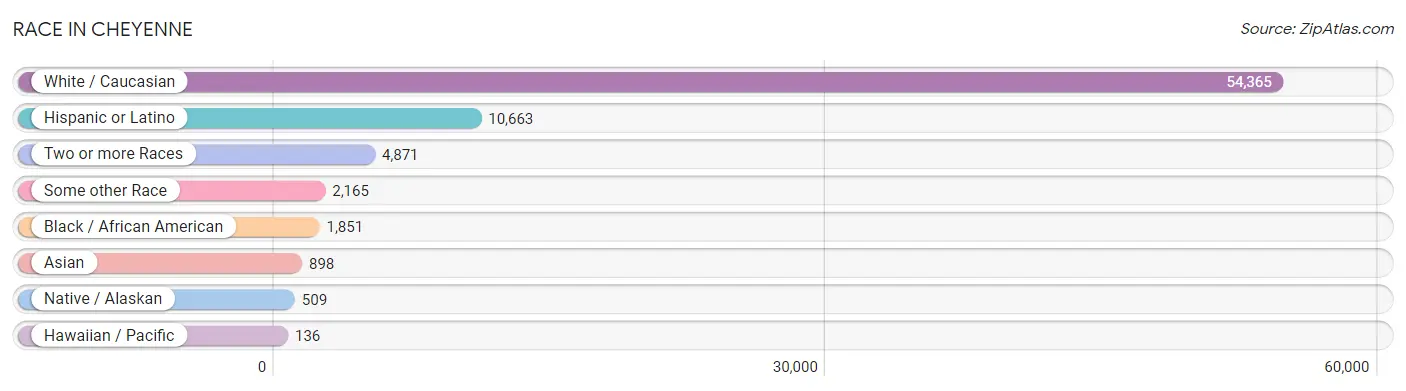
| Race | # Population | % Population |
| Asian | 898 | 1.4% |
| Black / African American | 1,851 | 2.9% |
| Hawaiian / Pacific | 136 | 0.2% |
| Hispanic or Latino | 10,663 | 16.5% |
| Native / Alaskan | 509 | 0.8% |
| White / Caucasian | 54,365 | 83.9% |
| Two or more Races | 4,871 | 7.5% |
| Some other Race | 2,165 | 3.3% |
| Total | 64,795 | 100.0% |
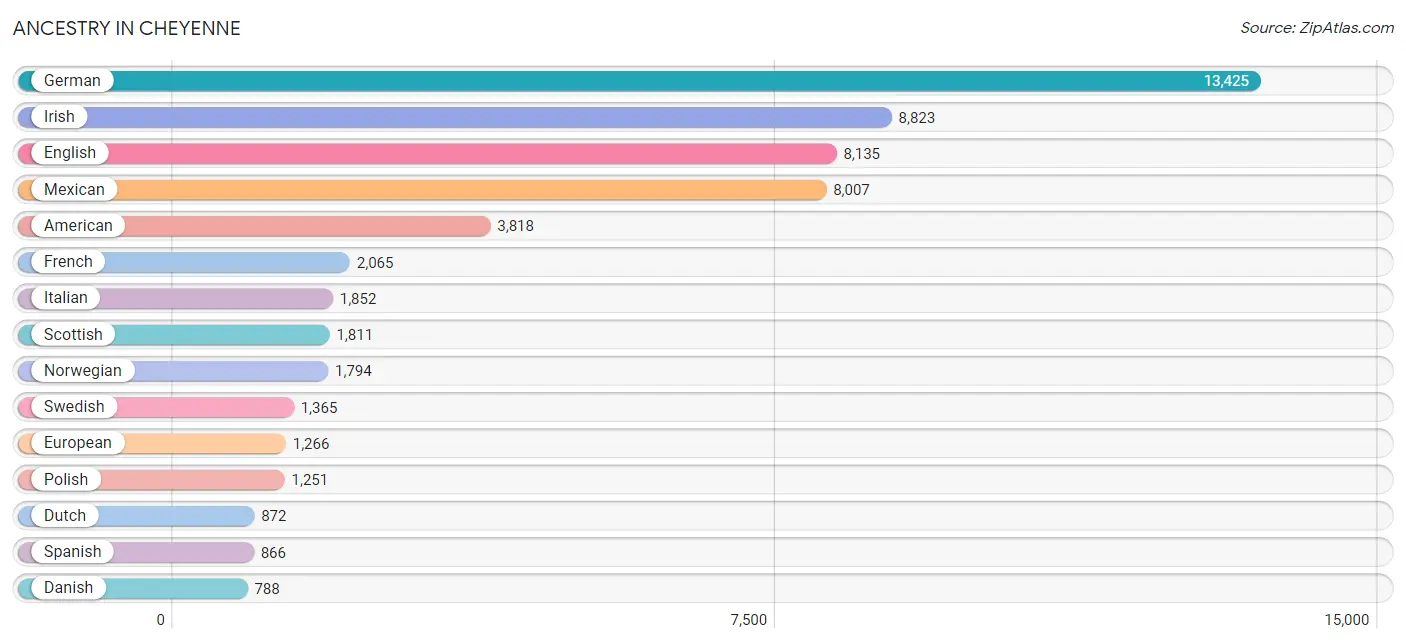
Ancestry in Cheyenne
The most populous ancestries reported in Cheyenne are German (13,425 | 20.7%), Irish (8,823 | 13.6%), English (8,135 | 12.6%), Mexican (8,007 | 12.4%), and American (3,818 | 5.9%), together accounting for 65.1% of all Cheyenne residents.
| Ancestry | # Population | % Population |
| African | 185 | 0.3% |
| American | 3,818 | 5.9% |
| Apache | 48 | 0.1% |
| Arab | 69 | 0.1% |
| Arapaho | 31 | 0.1% |
| Austrian | 193 | 0.3% |
| Bahamian | 21 | 0.0% |
| Bangladeshi | 7 | 0.0% |
| Barbadian | 42 | 0.1% |
| Belgian | 160 | 0.3% |
| Bhutanese | 190 | 0.3% |
| British | 544 | 0.8% |
| Burmese | 368 | 0.6% |
| Cajun | 17 | 0.0% |
| Canadian | 181 | 0.3% |
| Central American | 96 | 0.2% |
| Central American Indian | 59 | 0.1% |
| Cherokee | 133 | 0.2% |
| Cheyenne | 22 | 0.0% |
| Chickasaw | 11 | 0.0% |
| Chilean | 138 | 0.2% |
| Chinese | 11 | 0.0% |
| Chippewa | 29 | 0.0% |
| Choctaw | 48 | 0.1% |
| Croatian | 61 | 0.1% |
| Crow | 20 | 0.0% |
| Cuban | 42 | 0.1% |
| Czech | 356 | 0.5% |
| Czechoslovakian | 129 | 0.2% |
| Danish | 788 | 1.2% |
| Dominican | 1 | 0.0% |
| Dutch | 872 | 1.3% |
| Eastern European | 73 | 0.1% |
| Egyptian | 10 | 0.0% |
| English | 8,135 | 12.6% |
| Estonian | 5 | 0.0% |
| European | 1,266 | 1.9% |
| Filipino | 52 | 0.1% |
| Finnish | 356 | 0.5% |
| French | 2,065 | 3.2% |
| French American Indian | 3 | 0.0% |
| French Canadian | 540 | 0.8% |
| German | 13,425 | 20.7% |
| German Russian | 9 | 0.0% |
| Ghanaian | 32 | 0.1% |
| Greek | 341 | 0.5% |
| Guamanian / Chamorro | 86 | 0.1% |
| Guatemalan | 6 | 0.0% |
| Haitian | 10 | 0.0% |
| Hopi | 52 | 0.1% |
| Hungarian | 11 | 0.0% |
| Icelander | 9 | 0.0% |
| Indian (Asian) | 320 | 0.5% |
| Indonesian | 10 | 0.0% |
| Iranian | 14 | 0.0% |
| Irish | 8,823 | 13.6% |
| Italian | 1,852 | 2.9% |
| Jamaican | 11 | 0.0% |
| Korean | 596 | 0.9% |
| Laotian | 20 | 0.0% |
| Latvian | 17 | 0.0% |
| Lebanese | 59 | 0.1% |
| Lithuanian | 71 | 0.1% |
| Mexican | 8,007 | 12.4% |
| Mexican American Indian | 180 | 0.3% |
| Native Hawaiian | 80 | 0.1% |
| Navajo | 22 | 0.0% |
| New Zealander | 15 | 0.0% |
| Nicaraguan | 59 | 0.1% |
| Nigerian | 45 | 0.1% |
| Northern European | 139 | 0.2% |
| Norwegian | 1,794 | 2.8% |
| Pakistani | 58 | 0.1% |
| Panamanian | 31 | 0.1% |
| Pennsylvania German | 27 | 0.0% |
| Peruvian | 69 | 0.1% |
| Polish | 1,251 | 1.9% |
| Portuguese | 403 | 0.6% |
| Puerto Rican | 185 | 0.3% |
| Romanian | 16 | 0.0% |
| Russian | 486 | 0.7% |
| Samoan | 72 | 0.1% |
| Scandinavian | 636 | 1.0% |
| Scotch-Irish | 666 | 1.0% |
| Scottish | 1,811 | 2.8% |
| Shoshone | 72 | 0.1% |
| Sioux | 374 | 0.6% |
| Slavic | 25 | 0.0% |
| Slovak | 36 | 0.1% |
| Slovene | 15 | 0.0% |
| Somali | 26 | 0.0% |
| South American | 351 | 0.5% |
| Spaniard | 440 | 0.7% |
| Spanish | 866 | 1.3% |
| Spanish American | 17 | 0.0% |
| Sri Lankan | 45 | 0.1% |
| Subsaharan African | 288 | 0.4% |
| Swedish | 1,365 | 2.1% |
| Swiss | 64 | 0.1% |
| Thai | 158 | 0.2% |
| Trinidadian and Tobagonian | 9 | 0.0% |
| Turkish | 46 | 0.1% |
| Ukrainian | 197 | 0.3% |
| Venezuelan | 144 | 0.2% |
| Welsh | 610 | 0.9% |
| Yakama | 4 | 0.0% |
| Yugoslavian | 28 | 0.0% | View All 107 Rows |
Immigrants in Cheyenne
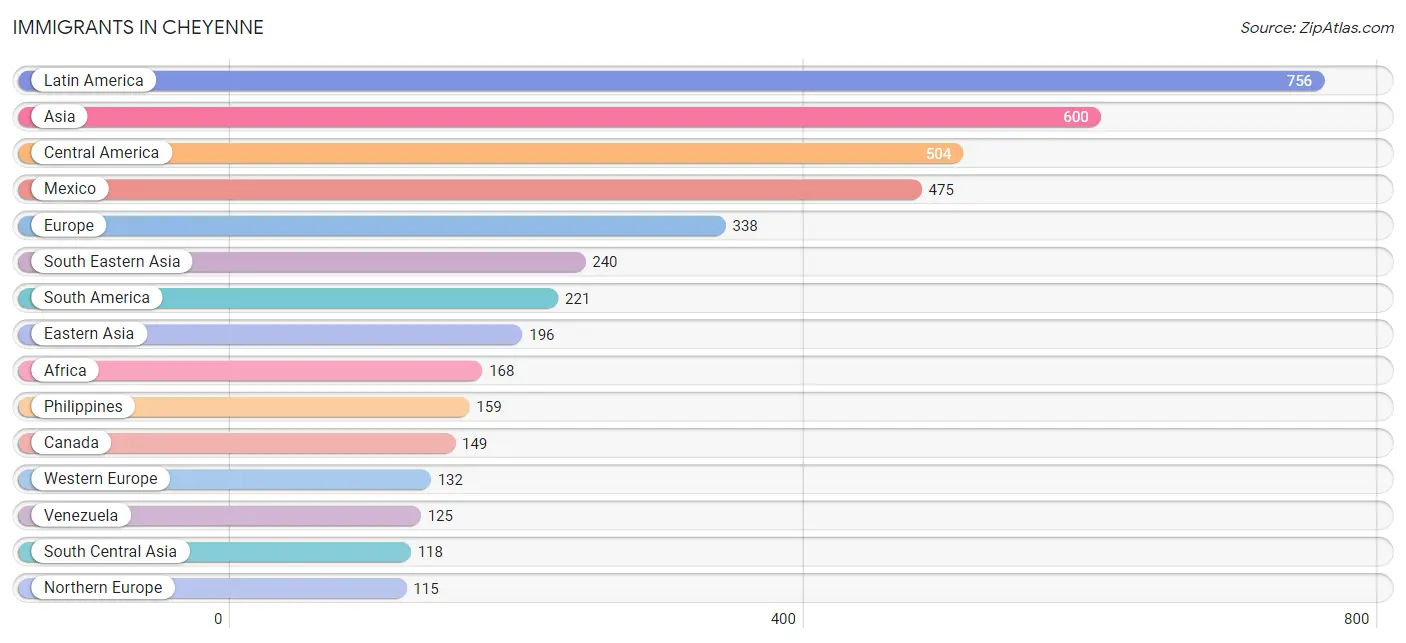
The most numerous immigrant groups reported in Cheyenne came from Latin America (756 | 1.2%), Asia (600 | 0.9%), Central America (504 | 0.8%), Mexico (475 | 0.7%), and Europe (338 | 0.5%), together accounting for 4.1% of all Cheyenne residents.
| Immigration Origin | # Population | % Population |
| Africa | 168 | 0.3% |
| Asia | 600 | 0.9% |
| Australia | 12 | 0.0% |
| Azores | 7 | 0.0% |
| Bahamas | 21 | 0.0% |
| Bangladesh | 21 | 0.0% |
| Bulgaria | 13 | 0.0% |
| Canada | 149 | 0.2% |
| Caribbean | 31 | 0.1% |
| Central America | 504 | 0.8% |
| Chile | 64 | 0.1% |
| China | 97 | 0.2% |
| Denmark | 12 | 0.0% |
| Eastern Africa | 73 | 0.1% |
| Eastern Asia | 196 | 0.3% |
| Eastern Europe | 83 | 0.1% |
| England | 64 | 0.1% |
| Europe | 338 | 0.5% |
| France | 20 | 0.0% |
| Germany | 112 | 0.2% |
| Haiti | 10 | 0.0% |
| India | 46 | 0.1% |
| Indonesia | 20 | 0.0% |
| Italy | 1 | 0.0% |
| Japan | 11 | 0.0% |
| Korea | 88 | 0.1% |
| Latin America | 756 | 1.2% |
| Mexico | 475 | 0.7% |
| Nepal | 31 | 0.1% |
| Nigeria | 45 | 0.1% |
| Northern Europe | 115 | 0.2% |
| Oceania | 20 | 0.0% |
| Pakistan | 20 | 0.0% |
| Panama | 29 | 0.0% |
| Peru | 32 | 0.1% |
| Philippines | 159 | 0.3% |
| Poland | 35 | 0.1% |
| Portugal | 7 | 0.0% |
| Russia | 10 | 0.0% |
| Scotland | 19 | 0.0% |
| Somalia | 26 | 0.0% |
| South Africa | 18 | 0.0% |
| South America | 221 | 0.3% |
| South Central Asia | 118 | 0.2% |
| South Eastern Asia | 240 | 0.4% |
| Southern Europe | 8 | 0.0% |
| Taiwan | 33 | 0.1% |
| Turkey | 46 | 0.1% |
| Uganda | 47 | 0.1% |
| Ukraine | 23 | 0.0% |
| Venezuela | 125 | 0.2% |
| Vietnam | 14 | 0.0% |
| Western Africa | 45 | 0.1% |
| Western Asia | 46 | 0.1% |
| Western Europe | 132 | 0.2% | View All 55 Rows |
Sex and Age in Cheyenne
Sex and Age in Cheyenne
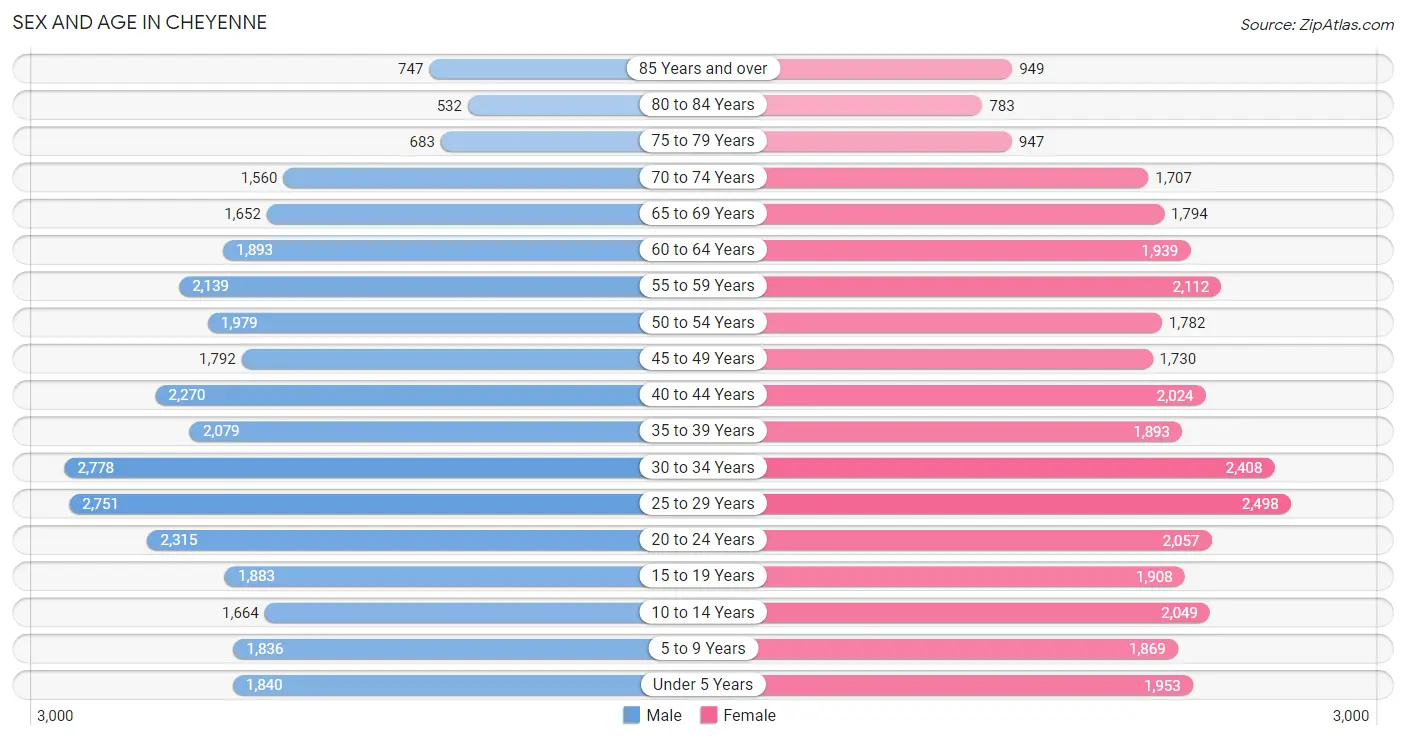
The most populous age groups in Cheyenne are 30 to 34 Years (2,778 | 8.6%) for men and 25 to 29 Years (2,498 | 7.7%) for women.
| Age Bracket | Male | Female |
| Under 5 Years | 1,840 (5.7%) | 1,953 (6.0%) |
| 5 to 9 Years | 1,836 (5.7%) | 1,869 (5.8%) |
| 10 to 14 Years | 1,664 (5.1%) | 2,049 (6.3%) |
| 15 to 19 Years | 1,883 (5.8%) | 1,908 (5.9%) |
| 20 to 24 Years | 2,315 (7.1%) | 2,057 (6.4%) |
| 25 to 29 Years | 2,751 (8.5%) | 2,498 (7.7%) |
| 30 to 34 Years | 2,778 (8.6%) | 2,408 (7.4%) |
| 35 to 39 Years | 2,079 (6.4%) | 1,893 (5.8%) |
| 40 to 44 Years | 2,270 (7.0%) | 2,024 (6.2%) |
| 45 to 49 Years | 1,792 (5.5%) | 1,730 (5.3%) |
| 50 to 54 Years | 1,979 (6.1%) | 1,782 (5.5%) |
| 55 to 59 Years | 2,139 (6.6%) | 2,112 (6.5%) |
| 60 to 64 Years | 1,893 (5.8%) | 1,939 (6.0%) |
| 65 to 69 Years | 1,652 (5.1%) | 1,794 (5.5%) |
| 70 to 74 Years | 1,560 (4.8%) | 1,707 (5.3%) |
| 75 to 79 Years | 683 (2.1%) | 947 (2.9%) |
| 80 to 84 Years | 532 (1.6%) | 783 (2.4%) |
| 85 Years and over | 747 (2.3%) | 949 (2.9%) |
| Total | 32,393 (100.0%) | 32,402 (100.0%) |
Families and Households in Cheyenne
Median Family Size in Cheyenne
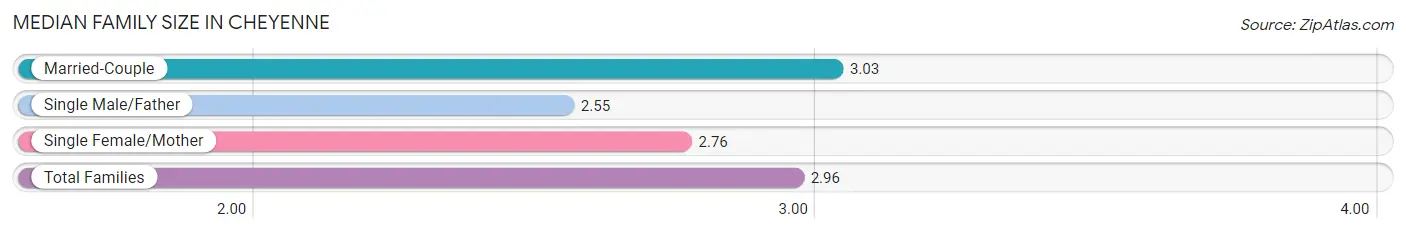
The median family size in Cheyenne is 2.96 persons per family, with married-couple families (12,949 | 78.7%) accounting for the largest median family size of 3.03 persons per family. On the other hand, single male/father families (1,181 | 7.2%) represent the smallest median family size with 2.55 persons per family.
| Family Type | # Families | Family Size |
| Married-Couple | 12,949 (78.7%) | 3.03 |
| Single Male/Father | 1,181 (7.2%) | 2.55 |
| Single Female/Mother | 2,327 (14.1%) | 2.76 |
| Total Families | 16,457 (100.0%) | 2.96 |
Median Household Size in Cheyenne
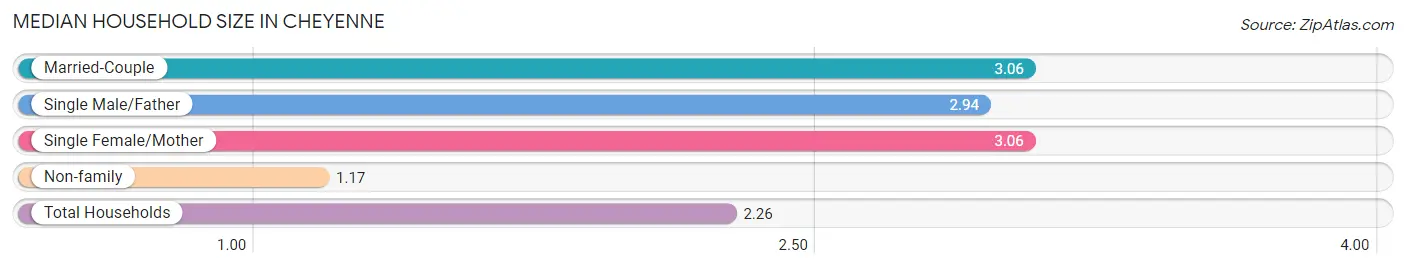
The median household size in Cheyenne is 2.26 persons per household, with married-couple households (12,949 | 45.8%) accounting for the largest median household size of 3.06 persons per household. non-family households (11,849 | 41.9%) represent the smallest median household size with 1.17 persons per household.
| Household Type | # Households | Household Size |
| Married-Couple | 12,949 (45.8%) | 3.06 |
| Single Male/Father | 1,181 (4.2%) | 2.94 |
| Single Female/Mother | 2,327 (8.2%) | 3.06 |
| Non-family | 11,849 (41.9%) | 1.17 |
| Total Households | 28,306 (100.0%) | 2.26 |
Household Size by Marriage Status in Cheyenne
Out of a total of 28,306 households in Cheyenne, 16,457 (58.1%) are family households, while 11,849 (41.9%) are nonfamily households. The most numerous type of family households are 2-person households, comprising 7,806, and the most common type of nonfamily households are 1-person households, comprising 10,150.
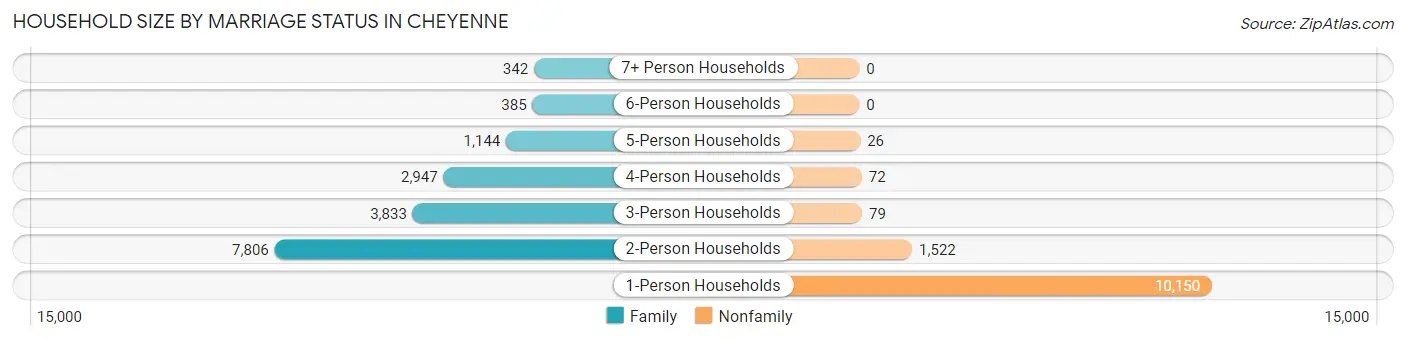
| Household Size | Family Households | Nonfamily Households |
| 1-Person Households | - | 10,150 (35.9%) |
| 2-Person Households | 7,806 (27.6%) | 1,522 (5.4%) |
| 3-Person Households | 3,833 (13.5%) | 79 (0.3%) |
| 4-Person Households | 2,947 (10.4%) | 72 (0.3%) |
| 5-Person Households | 1,144 (4.0%) | 26 (0.1%) |
| 6-Person Households | 385 (1.4%) | 0 (0.0%) |
| 7+ Person Households | 342 (1.2%) | 0 (0.0%) |
| Total | 16,457 (58.1%) | 11,849 (41.9%) |
Female Fertility in Cheyenne
Fertility by Age in Cheyenne
Average fertility rate in Cheyenne is 59.0 births per 1,000 women. Women in the age bracket of 20 to 34 years have the highest fertility rate with 110.0 births per 1,000 women. Women in the age bracket of 20 to 34 years acount for 88.1% of all women with births.
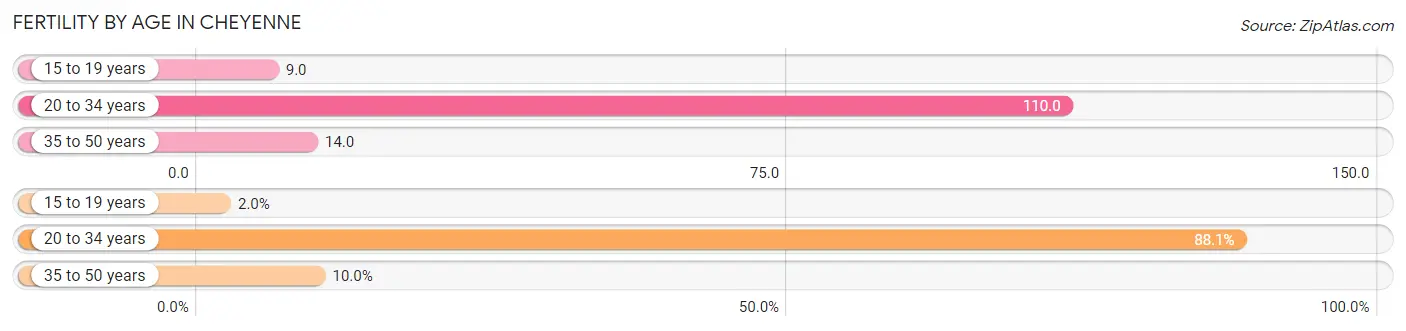
| Age Bracket | Women with Births | Births / 1,000 Women |
| 15 to 19 years | 17 (1.9%) | 9.0 |
| 20 to 34 years | 769 (88.1%) | 110.0 |
| 35 to 50 years | 87 (10.0%) | 14.0 |
| Total | 873 (100.0%) | 59.0 |
Fertility by Age by Marriage Status in Cheyenne
83.2% of women with births (873) in Cheyenne are married. The highest percentage of unmarried women with births falls into 15 to 19 years age bracket with 100.0% of them unmarried at the time of birth, while the lowest percentage of unmarried women with births belong to 35 to 50 years age bracket with 0.0% of them unmarried.
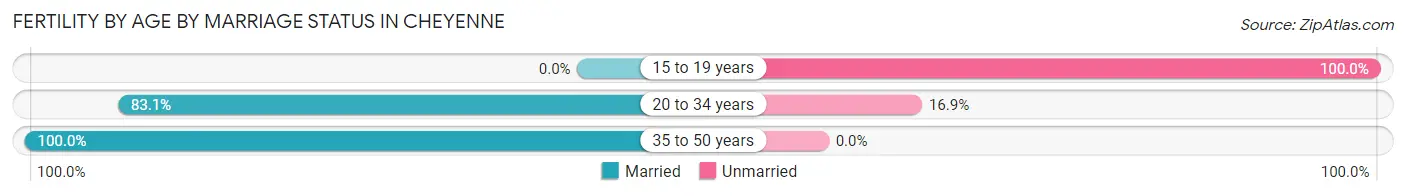
| Age Bracket | Married | Unmarried |
| 15 to 19 years | 0 (0.0%) | 17 (100.0%) |
| 20 to 34 years | 639 (83.1%) | 130 (16.9%) |
| 35 to 50 years | 87 (100.0%) | 0 (0.0%) |
| Total | 726 (83.2%) | 147 (16.8%) |
Fertility by Education in Cheyenne
Average fertility rate in Cheyenne is 59.0 births per 1,000 women. Women with the education attainment of bachelor's degree have the highest fertility rate of 74.0 births per 1,000 women, while women with the education attainment of college or associate's degree have the lowest fertility at 43.0 births per 1,000 women. Women with the education attainment of college or associate's degree represent 27.8% of all women with births.

| Educational Attainment | Women with Births | Births / 1,000 Women |
| Less than High School | 120 (13.8%) | 63.0 |
| High School Diploma | 205 (23.5%) | 67.0 |
| College or Associate's Degree | 243 (27.8%) | 43.0 |
| Bachelor's Degree | 196 (22.5%) | 74.0 |
| Graduate Degree | 109 (12.5%) | 70.0 |
| Total | 873 (100.0%) | 59.0 |
Fertility by Education by Marriage Status in Cheyenne
16.8% of women with births in Cheyenne are unmarried. Women with the educational attainment of graduate degree are most likely to be married with 100.0% of them married at childbirth, while women with the educational attainment of less than high school are least likely to be married with 35.0% of them unmarried at childbirth.
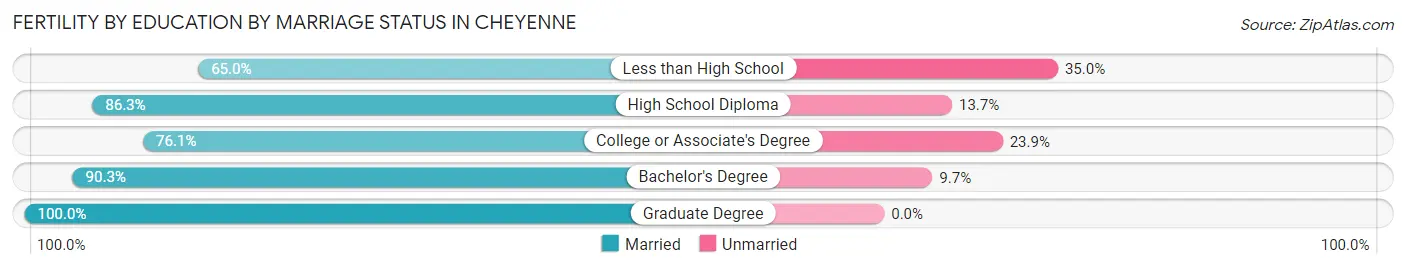
| Educational Attainment | Married | Unmarried |
| Less than High School | 78 (65.0%) | 42 (35.0%) |
| High School Diploma | 177 (86.3%) | 28 (13.7%) |
| College or Associate's Degree | 185 (76.1%) | 58 (23.9%) |
| Bachelor's Degree | 177 (90.3%) | 19 (9.7%) |
| Graduate Degree | 109 (100.0%) | 0 (0.0%) |
| Total | 726 (83.2%) | 147 (16.8%) |
Employment Characteristics in Cheyenne
Employment by Class of Employer in Cheyenne
Among the 33,631 employed individuals in Cheyenne, private company employees (18,545 | 55.1%), federal government employees (3,710 | 11.0%), and local government employees (3,489 | 10.4%) make up the most common classes of employment.
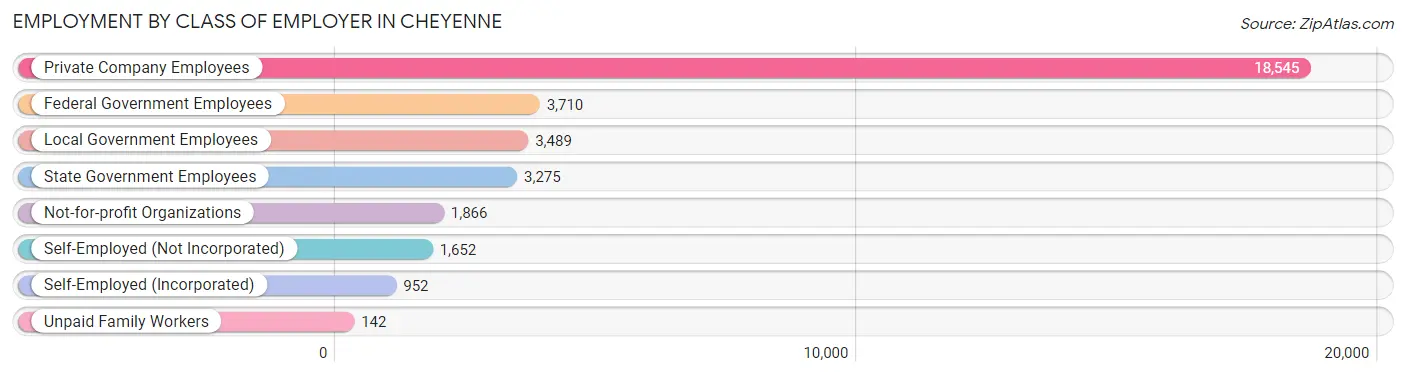
| Employer Class | # Employees | % Employees |
| Private Company Employees | 18,545 | 55.1% |
| Self-Employed (Incorporated) | 952 | 2.8% |
| Self-Employed (Not Incorporated) | 1,652 | 4.9% |
| Not-for-profit Organizations | 1,866 | 5.6% |
| Local Government Employees | 3,489 | 10.4% |
| State Government Employees | 3,275 | 9.7% |
| Federal Government Employees | 3,710 | 11.0% |
| Unpaid Family Workers | 142 | 0.4% |
| Total | 33,631 | 100.0% |
Employment Status by Age in Cheyenne
According to the labor force statistics for Cheyenne, out of the total population over 16 years of age (52,611), 67.3% or 35,407 individuals are in the labor force, with 3.4% or 1,204 of them unemployed. The age group with the highest labor force participation rate is 30 to 34 years, with 88.3% or 4,579 individuals in the labor force. Within the labor force, the 16 to 19 years age range has the highest percentage of unemployed individuals, with 8.3% or 116 of them being unemployed.
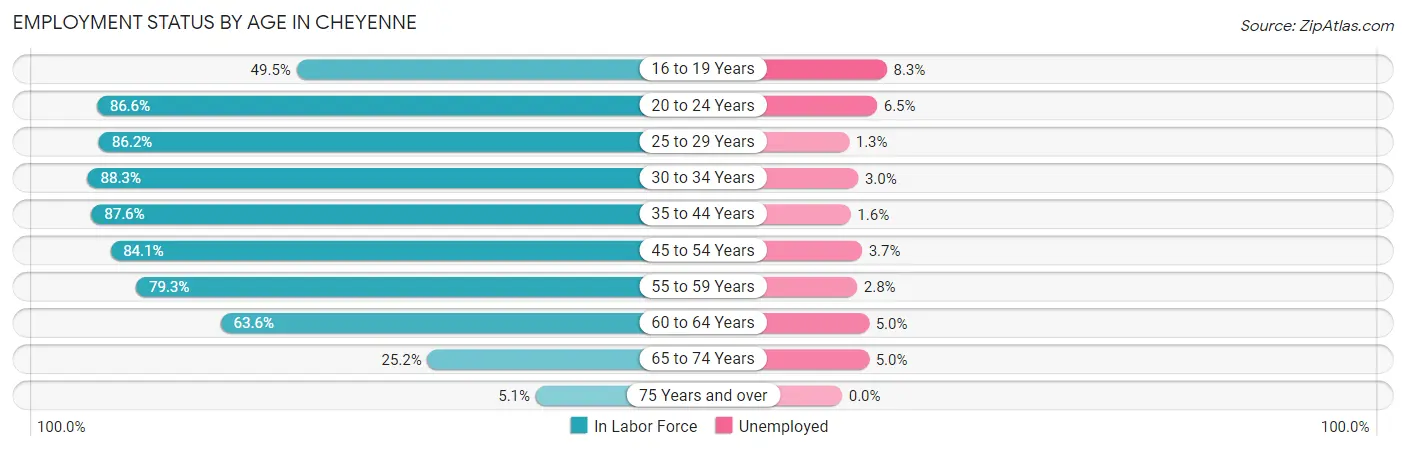
| Age Bracket | In Labor Force | Unemployed |
| 16 to 19 Years | 1,395 (49.5%) | 116 (8.3%) |
| 20 to 24 Years | 3,786 (86.6%) | 246 (6.5%) |
| 25 to 29 Years | 4,525 (86.2%) | 59 (1.3%) |
| 30 to 34 Years | 4,579 (88.3%) | 137 (3.0%) |
| 35 to 44 Years | 7,241 (87.6%) | 116 (1.6%) |
| 45 to 54 Years | 6,125 (84.1%) | 227 (3.7%) |
| 55 to 59 Years | 3,371 (79.3%) | 94 (2.8%) |
| 60 to 64 Years | 2,437 (63.6%) | 122 (5.0%) |
| 65 to 74 Years | 1,692 (25.2%) | 85 (5.0%) |
| 75 Years and over | 237 (5.1%) | 0 (0.0%) |
| Total | 35,407 (67.3%) | 1,204 (3.4%) |
Employment Status by Educational Attainment in Cheyenne
According to labor force statistics for Cheyenne, 83.0% of individuals (28,276) out of the total population between 25 and 64 years of age (34,067) are in the labor force, with 2.7% or 763 of them being unemployed. The group with the highest labor force participation rate are those with the educational attainment of bachelor's degree or higher, with 87.3% or 9,473 individuals in the labor force. Within the labor force, individuals with less than high school education have the highest percentage of unemployment, with 4.8% or 45 of them being unemployed.
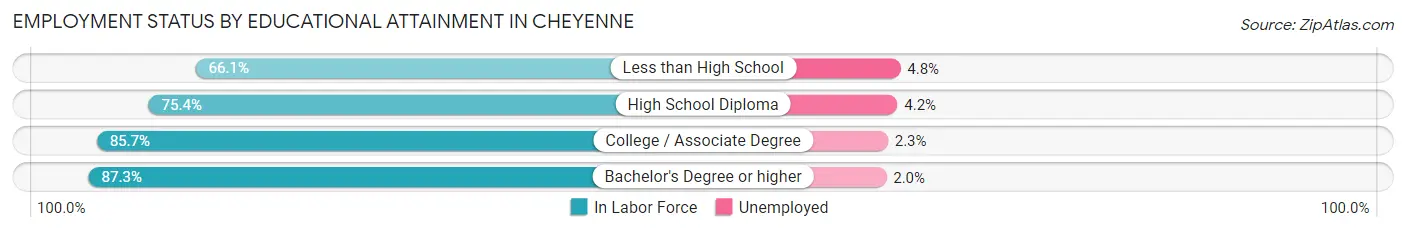
| Educational Attainment | In Labor Force | Unemployed |
| Less than High School | 942 (66.1%) | 68 (4.8%) |
| High School Diploma | 5,960 (75.4%) | 332 (4.2%) |
| College / Associate Degree | 11,901 (85.7%) | 319 (2.3%) |
| Bachelor's Degree or higher | 9,473 (87.3%) | 217 (2.0%) |
| Total | 28,276 (83.0%) | 920 (2.7%) |
Employment Occupations by Sex in Cheyenne
Management, Business, Science and Arts Occupations
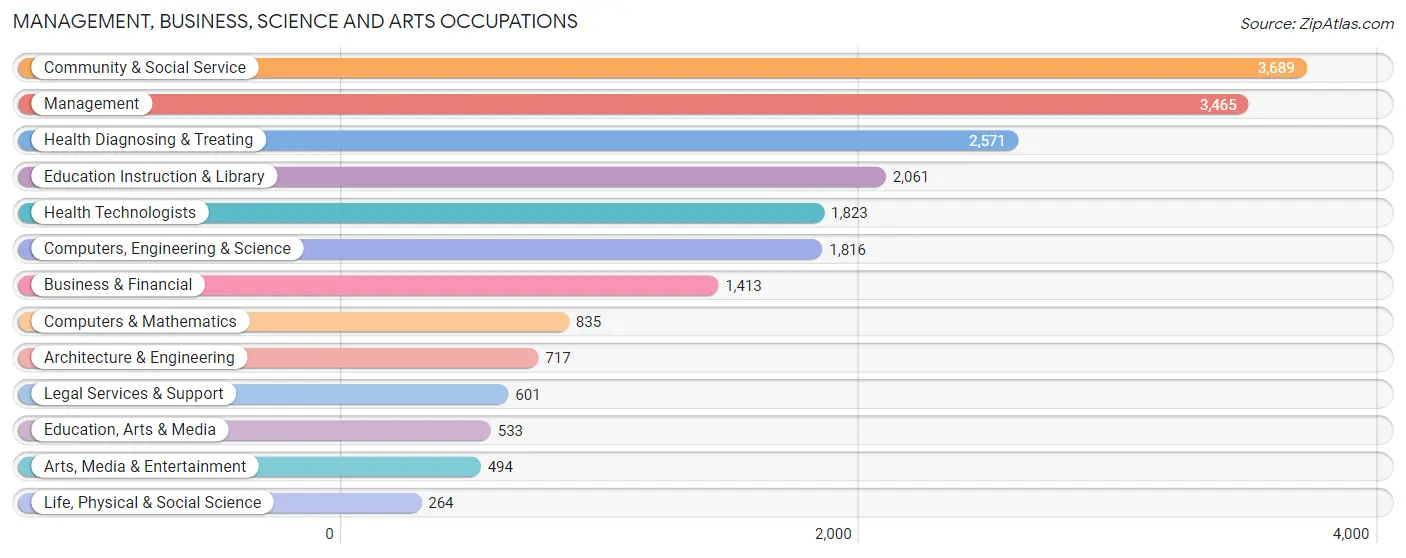
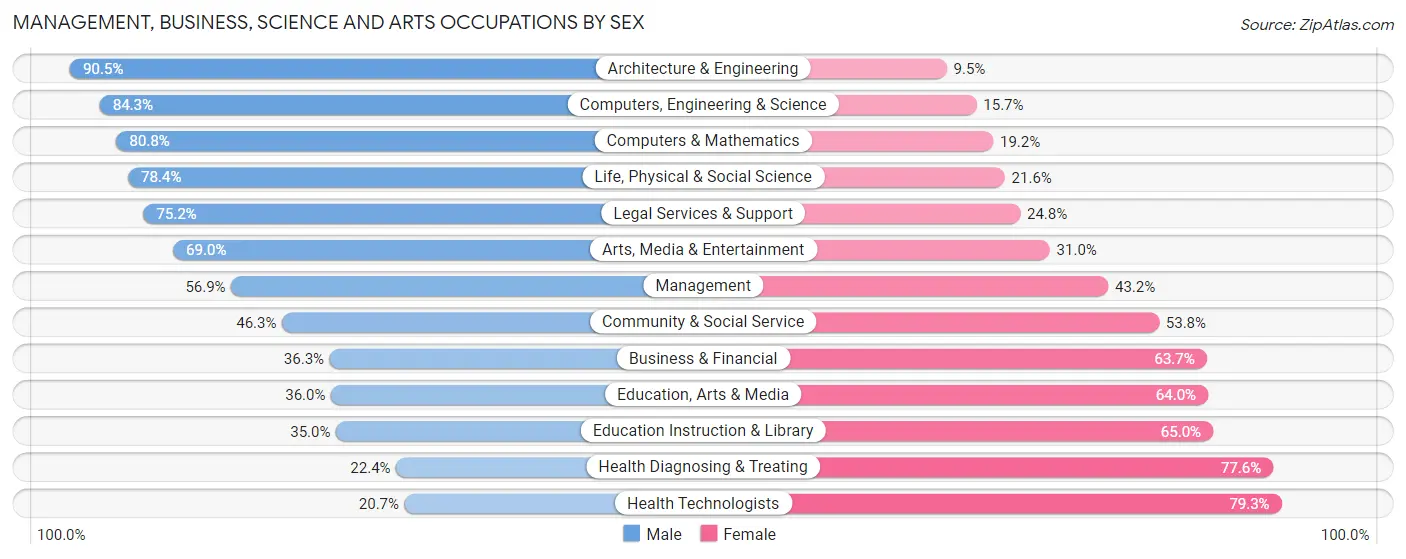
The most common Management, Business, Science and Arts occupations in Cheyenne are Community & Social Service (3,689 | 11.3%), Management (3,465 | 10.6%), Health Diagnosing & Treating (2,571 | 7.9%), Education Instruction & Library (2,061 | 6.3%), and Health Technologists (1,823 | 5.6%).
Management, Business, Science and Arts Occupations by Sex
Within the Management, Business, Science and Arts occupations in Cheyenne, the most male-oriented occupations are Architecture & Engineering (90.5%), Computers, Engineering & Science (84.3%), and Computers & Mathematics (80.8%), while the most female-oriented occupations are Health Technologists (79.3%), Health Diagnosing & Treating (77.6%), and Education Instruction & Library (65.0%).
| Occupation | Male | Female |
| Management | 1,970 (56.9%) | 1,495 (43.1%) |
| Business & Financial | 513 (36.3%) | 900 (63.7%) |
| Computers, Engineering & Science | 1,531 (84.3%) | 285 (15.7%) |
| Computers & Mathematics | 675 (80.8%) | 160 (19.2%) |
| Architecture & Engineering | 649 (90.5%) | 68 (9.5%) |
| Life, Physical & Social Science | 207 (78.4%) | 57 (21.6%) |
| Community & Social Service | 1,706 (46.3%) | 1,983 (53.7%) |
| Education, Arts & Media | 192 (36.0%) | 341 (64.0%) |
| Legal Services & Support | 452 (75.2%) | 149 (24.8%) |
| Education Instruction & Library | 721 (35.0%) | 1,340 (65.0%) |
| Arts, Media & Entertainment | 341 (69.0%) | 153 (31.0%) |
| Health Diagnosing & Treating | 577 (22.4%) | 1,994 (77.6%) |
| Health Technologists | 377 (20.7%) | 1,446 (79.3%) |
| Total (Category) | 6,297 (48.6%) | 6,657 (51.4%) |
| Total (Overall) | 17,531 (53.5%) | 15,234 (46.5%) |
Services Occupations
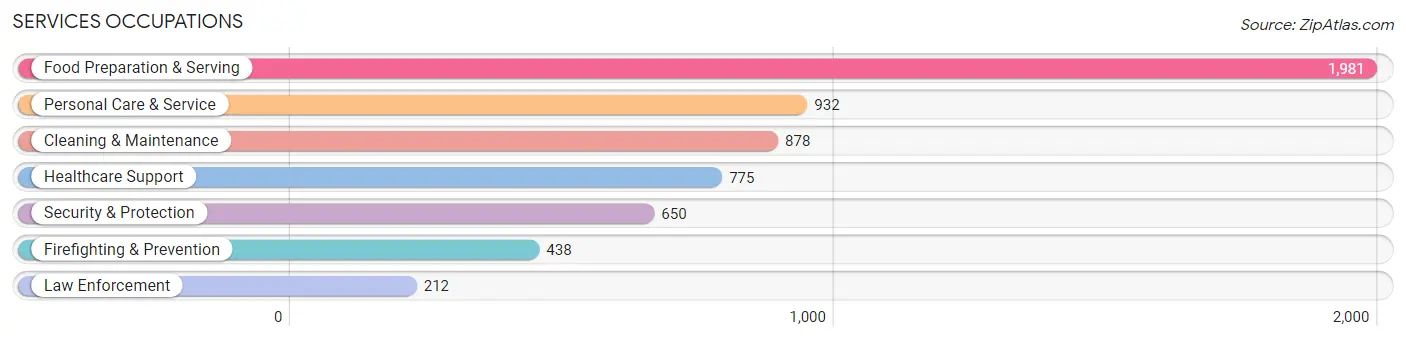
The most common Services occupations in Cheyenne are Food Preparation & Serving (1,981 | 6.0%), Personal Care & Service (932 | 2.8%), Cleaning & Maintenance (878 | 2.7%), Healthcare Support (775 | 2.4%), and Security & Protection (650 | 2.0%).
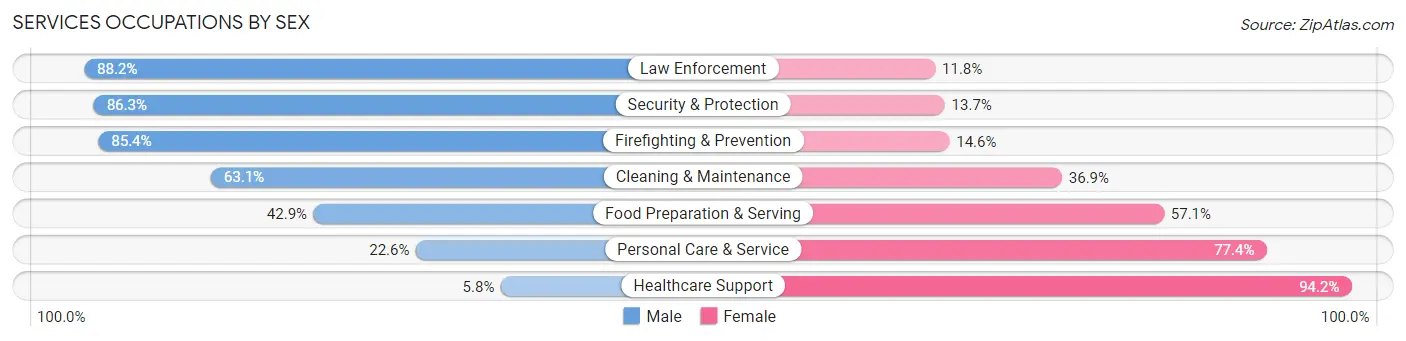
Services Occupations by Sex
Within the Services occupations in Cheyenne, the most male-oriented occupations are Law Enforcement (88.2%), Security & Protection (86.3%), and Firefighting & Prevention (85.4%), while the most female-oriented occupations are Healthcare Support (94.2%), Personal Care & Service (77.4%), and Food Preparation & Serving (57.1%).
| Occupation | Male | Female |
| Healthcare Support | 45 (5.8%) | 730 (94.2%) |
| Security & Protection | 561 (86.3%) | 89 (13.7%) |
| Firefighting & Prevention | 374 (85.4%) | 64 (14.6%) |
| Law Enforcement | 187 (88.2%) | 25 (11.8%) |
| Food Preparation & Serving | 850 (42.9%) | 1,131 (57.1%) |
| Cleaning & Maintenance | 554 (63.1%) | 324 (36.9%) |
| Personal Care & Service | 211 (22.6%) | 721 (77.4%) |
| Total (Category) | 2,221 (42.6%) | 2,995 (57.4%) |
| Total (Overall) | 17,531 (53.5%) | 15,234 (46.5%) |
Sales and Office Occupations
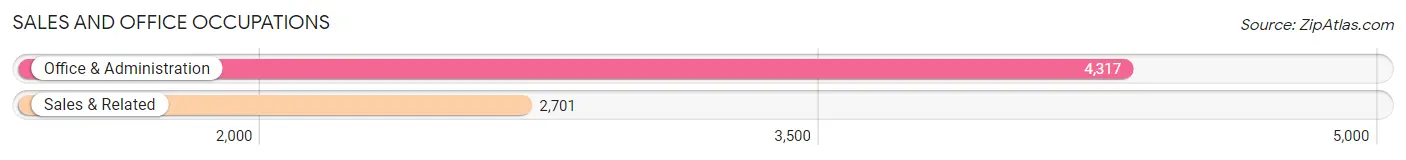
The most common Sales and Office occupations in Cheyenne are Office & Administration (4,317 | 13.2%), and Sales & Related (2,701 | 8.2%).
Sales and Office Occupations by Sex
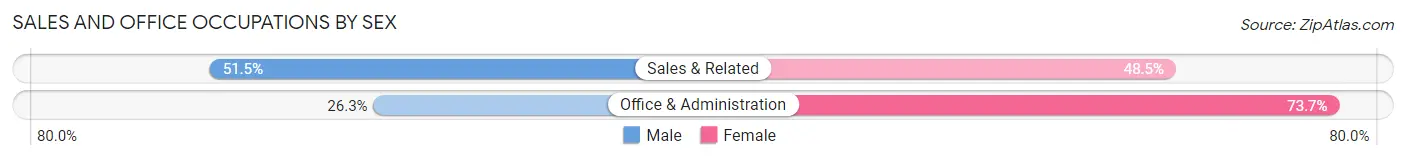
| Occupation | Male | Female |
| Sales & Related | 1,391 (51.5%) | 1,310 (48.5%) |
| Office & Administration | 1,137 (26.3%) | 3,180 (73.7%) |
| Total (Category) | 2,528 (36.0%) | 4,490 (64.0%) |
| Total (Overall) | 17,531 (53.5%) | 15,234 (46.5%) |
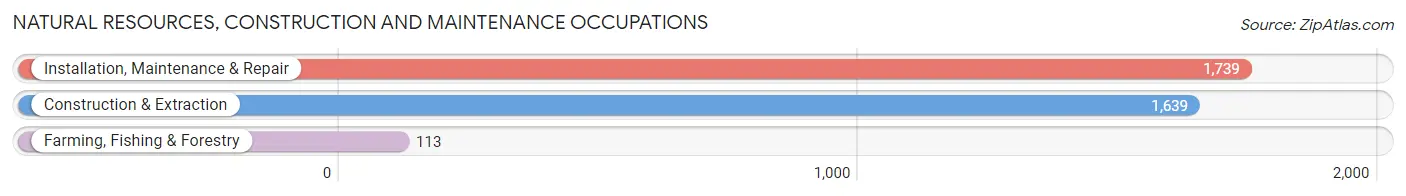
Natural Resources, Construction and Maintenance Occupations
The most common Natural Resources, Construction and Maintenance occupations in Cheyenne are Installation, Maintenance & Repair (1,739 | 5.3%), Construction & Extraction (1,639 | 5.0%), and Farming, Fishing & Forestry (113 | 0.3%).
Natural Resources, Construction and Maintenance Occupations by Sex
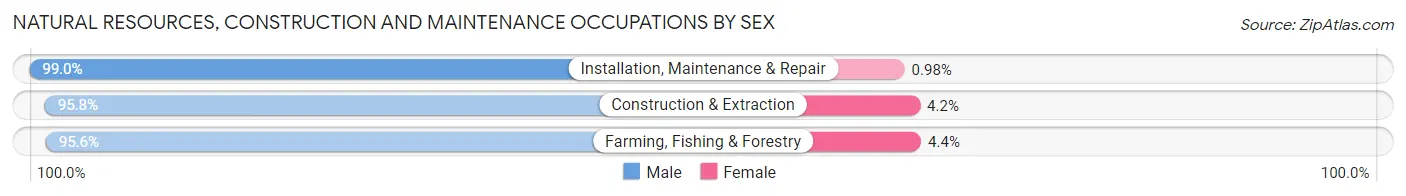
| Occupation | Male | Female |
| Farming, Fishing & Forestry | 108 (95.6%) | 5 (4.4%) |
| Construction & Extraction | 1,570 (95.8%) | 69 (4.2%) |
| Installation, Maintenance & Repair | 1,722 (99.0%) | 17 (1.0%) |
| Total (Category) | 3,400 (97.4%) | 91 (2.6%) |
| Total (Overall) | 17,531 (53.5%) | 15,234 (46.5%) |
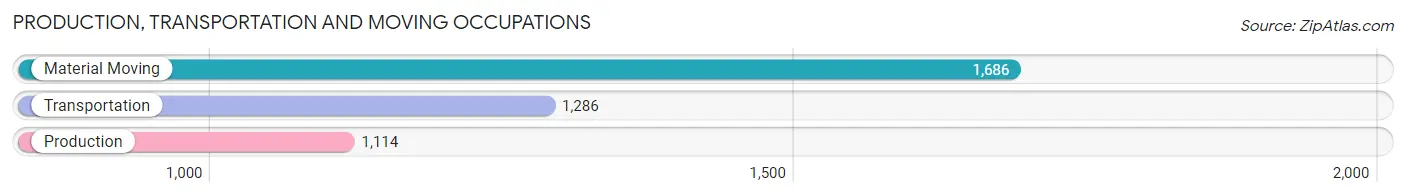
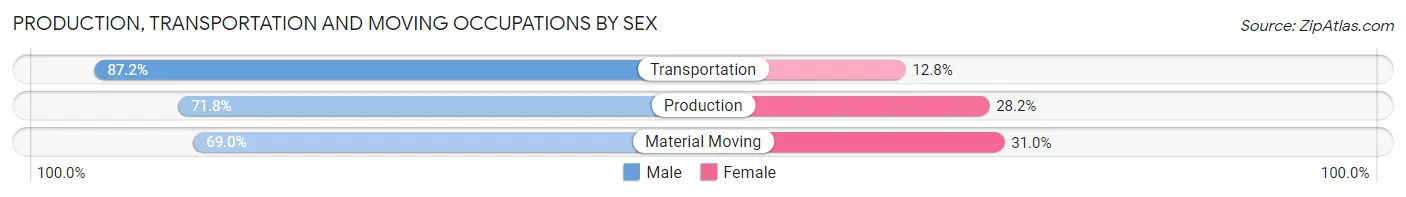
Production, Transportation and Moving Occupations
The most common Production, Transportation and Moving occupations in Cheyenne are Material Moving (1,686 | 5.1%), Transportation (1,286 | 3.9%), and Production (1,114 | 3.4%).
Production, Transportation and Moving Occupations by Sex
| Occupation | Male | Female |
| Production | 800 (71.8%) | 314 (28.2%) |
| Transportation | 1,121 (87.2%) | 165 (12.8%) |
| Material Moving | 1,164 (69.0%) | 522 (31.0%) |
| Total (Category) | 3,085 (75.5%) | 1,001 (24.5%) |
| Total (Overall) | 17,531 (53.5%) | 15,234 (46.5%) |
Employment Industries by Sex in Cheyenne
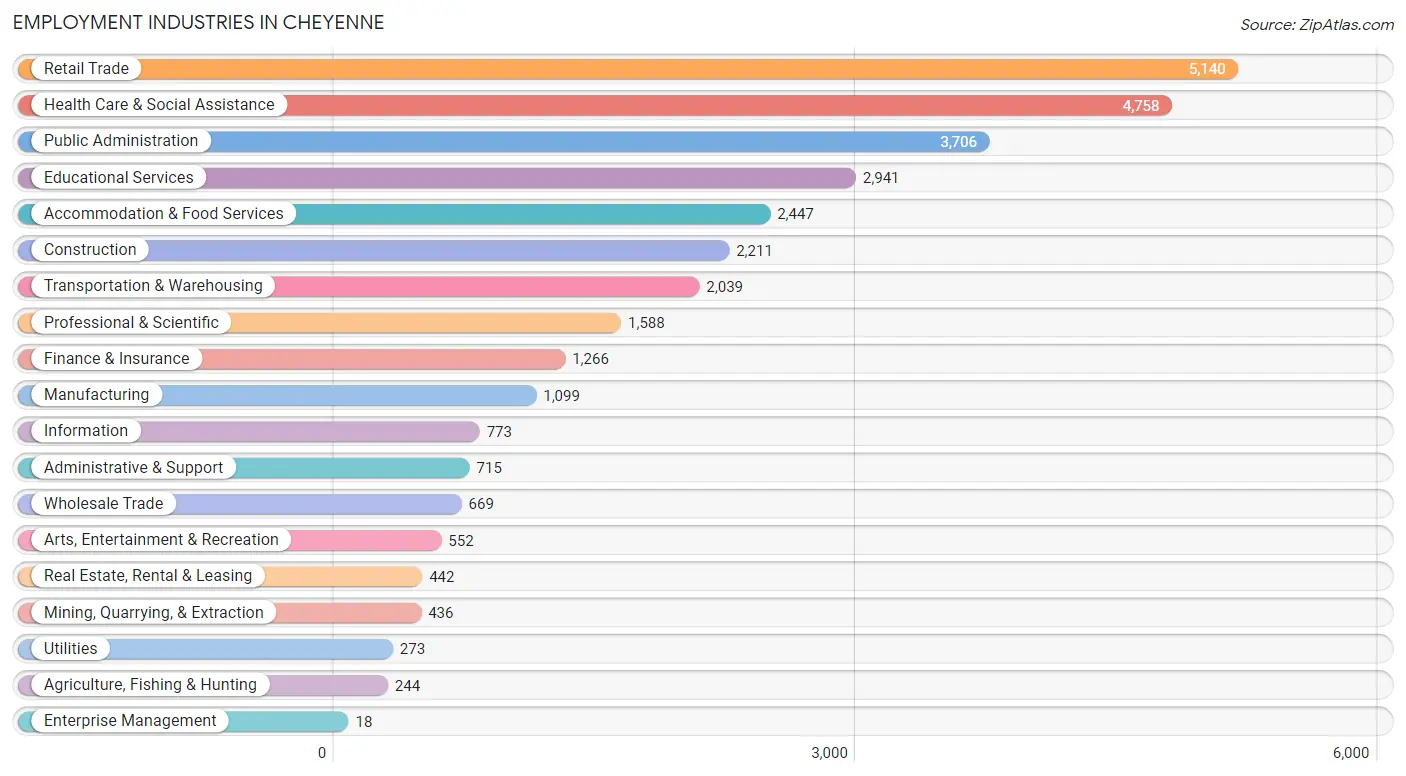
Employment Industries in Cheyenne
The major employment industries in Cheyenne include Retail Trade (5,140 | 15.7%), Health Care & Social Assistance (4,758 | 14.5%), Public Administration (3,706 | 11.3%), Educational Services (2,941 | 9.0%), and Accommodation & Food Services (2,447 | 7.5%).
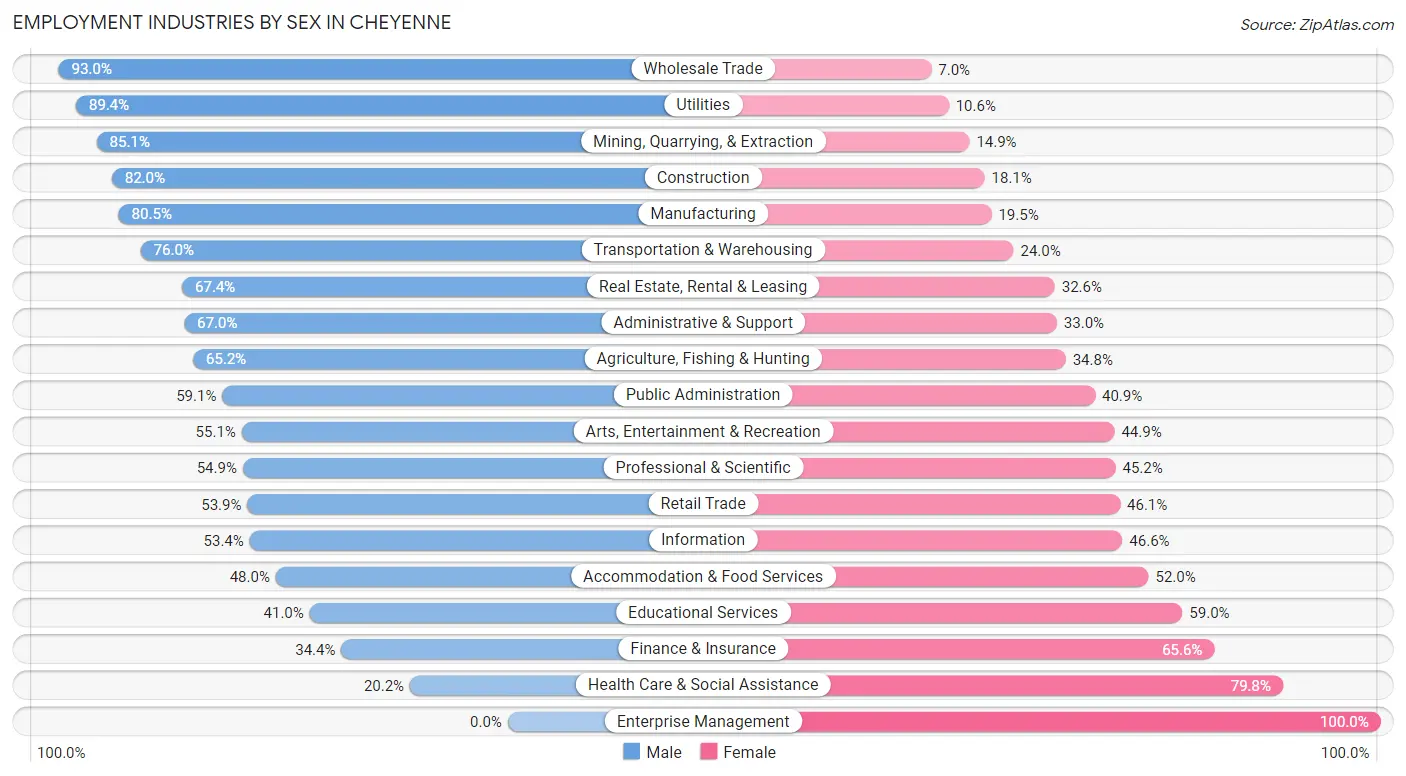
Employment Industries by Sex in Cheyenne
The Cheyenne industries that see more men than women are Wholesale Trade (93.0%), Utilities (89.4%), and Mining, Quarrying, & Extraction (85.1%), whereas the industries that tend to have a higher number of women are Enterprise Management (100.0%), Health Care & Social Assistance (79.8%), and Finance & Insurance (65.6%).
| Industry | Male | Female |
| Agriculture, Fishing & Hunting | 159 (65.2%) | 85 (34.8%) |
| Mining, Quarrying, & Extraction | 371 (85.1%) | 65 (14.9%) |
| Construction | 1,812 (82.0%) | 399 (18.0%) |
| Manufacturing | 885 (80.5%) | 214 (19.5%) |
| Wholesale Trade | 622 (93.0%) | 47 (7.0%) |
| Retail Trade | 2,771 (53.9%) | 2,369 (46.1%) |
| Transportation & Warehousing | 1,549 (76.0%) | 490 (24.0%) |
| Utilities | 244 (89.4%) | 29 (10.6%) |
| Information | 413 (53.4%) | 360 (46.6%) |
| Finance & Insurance | 436 (34.4%) | 830 (65.6%) |
| Real Estate, Rental & Leasing | 298 (67.4%) | 144 (32.6%) |
| Professional & Scientific | 871 (54.8%) | 717 (45.2%) |
| Enterprise Management | 0 (0.0%) | 18 (100.0%) |
| Administrative & Support | 479 (67.0%) | 236 (33.0%) |
| Educational Services | 1,206 (41.0%) | 1,735 (59.0%) |
| Health Care & Social Assistance | 963 (20.2%) | 3,795 (79.8%) |
| Arts, Entertainment & Recreation | 304 (55.1%) | 248 (44.9%) |
| Accommodation & Food Services | 1,175 (48.0%) | 1,272 (52.0%) |
| Public Administration | 2,190 (59.1%) | 1,516 (40.9%) |
| Total | 17,531 (53.5%) | 15,234 (46.5%) |
Education in Cheyenne
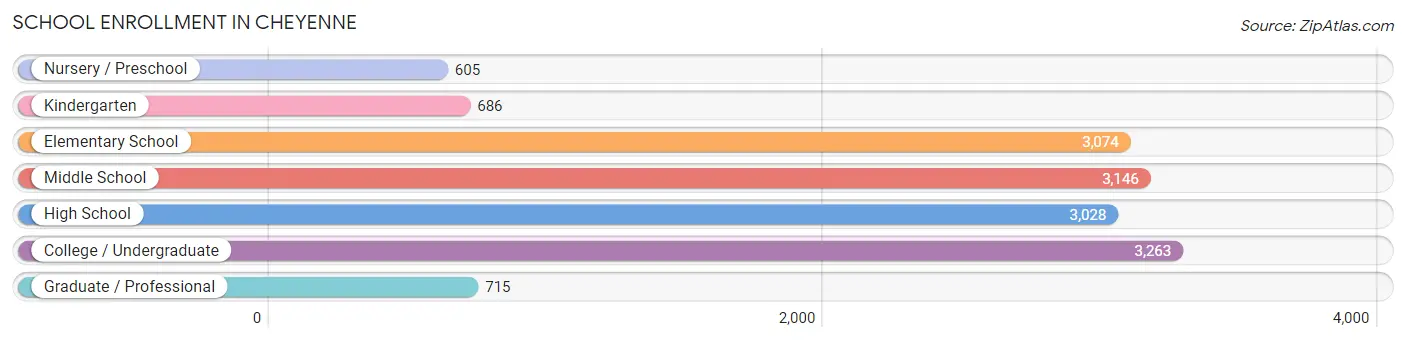
School Enrollment in Cheyenne
The most common levels of schooling among the 14,517 students in Cheyenne are college / undergraduate (3,263 | 22.5%), middle school (3,146 | 21.7%), and elementary school (3,074 | 21.2%).
| School Level | # Students | % Students |
| Nursery / Preschool | 605 | 4.2% |
| Kindergarten | 686 | 4.7% |
| Elementary School | 3,074 | 21.2% |
| Middle School | 3,146 | 21.7% |
| High School | 3,028 | 20.9% |
| College / Undergraduate | 3,263 | 22.5% |
| Graduate / Professional | 715 | 4.9% |
| Total | 14,517 | 100.0% |
School Enrollment by Age by Funding Source in Cheyenne
Out of a total of 14,517 students who are enrolled in schools in Cheyenne, 1,989 (13.7%) attend a private institution, while the remaining 12,528 (86.3%) are enrolled in public schools. The age group of 3 to 4 year olds has the highest likelihood of being enrolled in private schools, with 230 (54.9% in the age bracket) enrolled. Conversely, the age group of 18 to 19 year olds has the lowest likelihood of being enrolled in a private school, with 762 (91.5% in the age bracket) attending a public institution.
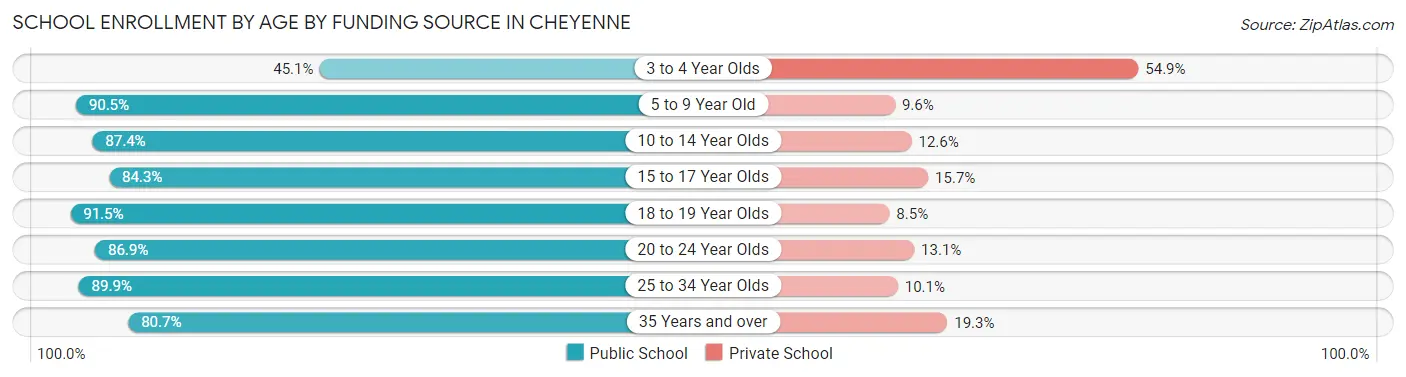
| Age Bracket | Public School | Private School |
| 3 to 4 Year Olds | 189 (45.1%) | 230 (54.9%) |
| 5 to 9 Year Old | 3,241 (90.4%) | 342 (9.6%) |
| 10 to 14 Year Olds | 3,242 (87.4%) | 469 (12.6%) |
| 15 to 17 Year Olds | 2,029 (84.3%) | 379 (15.7%) |
| 18 to 19 Year Olds | 762 (91.5%) | 71 (8.5%) |
| 20 to 24 Year Olds | 979 (86.9%) | 148 (13.1%) |
| 25 to 34 Year Olds | 1,115 (89.9%) | 125 (10.1%) |
| 35 Years and over | 965 (80.7%) | 231 (19.3%) |
| Total | 12,528 (86.3%) | 1,989 (13.7%) |
Educational Attainment by Field of Study in Cheyenne
Education (2,643 | 17.3%), business (2,251 | 14.7%), science & technology (1,766 | 11.6%), bio, nature & agricultural (1,481 | 9.7%), and social sciences (1,204 | 7.9%) are the most common fields of study among 15,294 individuals in Cheyenne who have obtained a bachelor's degree or higher.
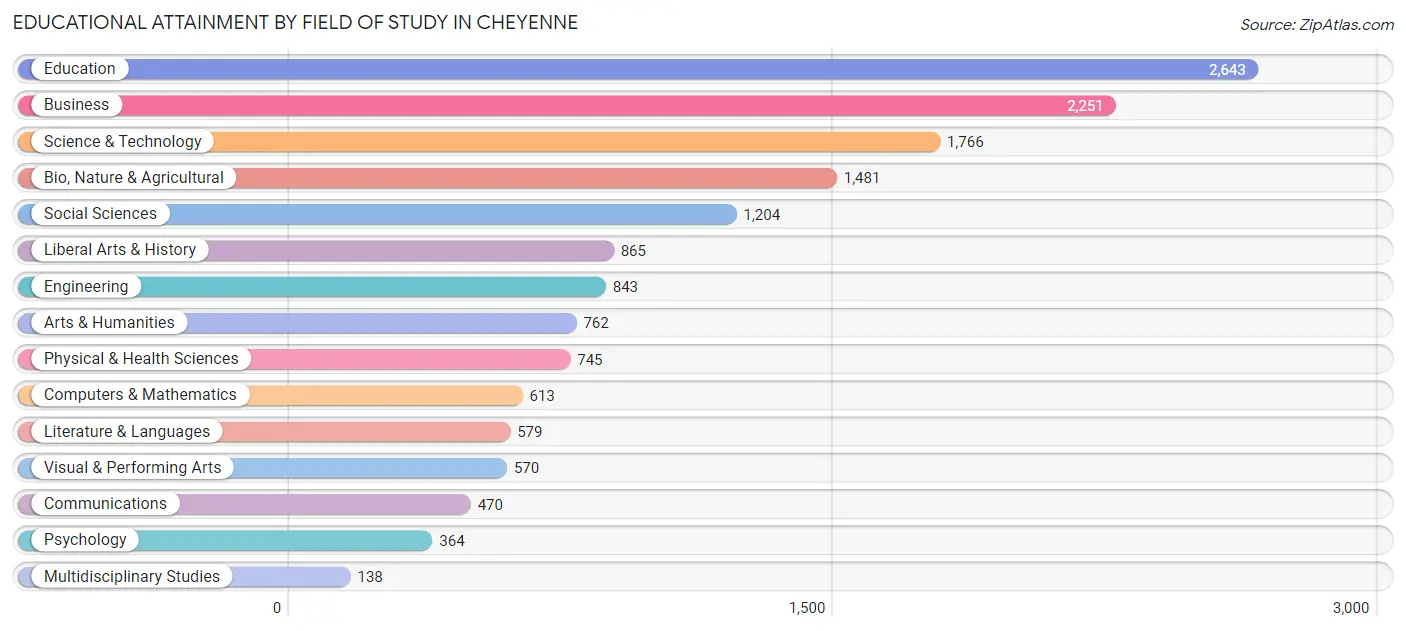
| Field of Study | # Graduates | % Graduates |
| Computers & Mathematics | 613 | 4.0% |
| Bio, Nature & Agricultural | 1,481 | 9.7% |
| Physical & Health Sciences | 745 | 4.9% |
| Psychology | 364 | 2.4% |
| Social Sciences | 1,204 | 7.9% |
| Engineering | 843 | 5.5% |
| Multidisciplinary Studies | 138 | 0.9% |
| Science & Technology | 1,766 | 11.6% |
| Business | 2,251 | 14.7% |
| Education | 2,643 | 17.3% |
| Literature & Languages | 579 | 3.8% |
| Liberal Arts & History | 865 | 5.7% |
| Visual & Performing Arts | 570 | 3.7% |
| Communications | 470 | 3.1% |
| Arts & Humanities | 762 | 5.0% |
| Total | 15,294 | 100.0% |
Transportation & Commute in Cheyenne
Vehicle Availability by Sex in Cheyenne
The most prevalent vehicle ownership categories in Cheyenne are males with 2 vehicles (7,191, accounting for 39.2%) and females with 2 vehicles (6,133, making up 47.1%).
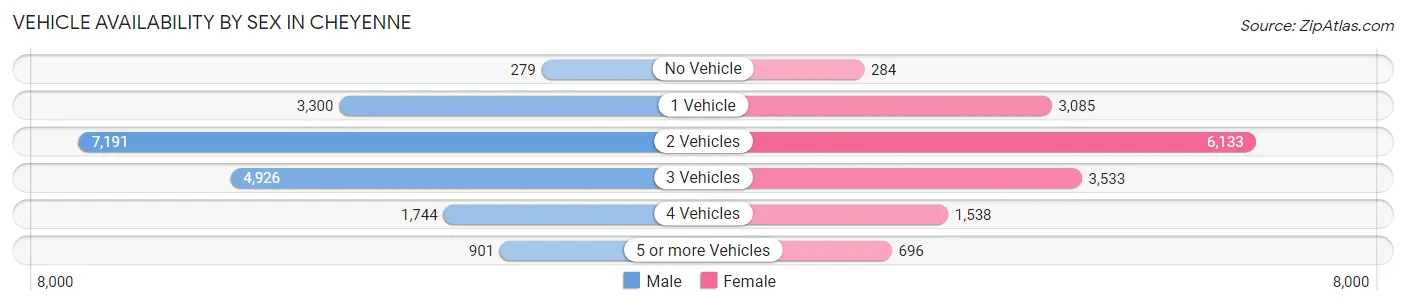
| Vehicles Available | Male | Female |
| No Vehicle | 279 (1.5%) | 284 (1.9%) |
| 1 Vehicle | 3,300 (18.0%) | 3,085 (20.2%) |
| 2 Vehicles | 7,191 (39.2%) | 6,133 (40.2%) |
| 3 Vehicles | 4,926 (26.9%) | 3,533 (23.1%) |
| 4 Vehicles | 1,744 (9.5%) | 1,538 (10.1%) |
| 5 or more Vehicles | 901 (4.9%) | 696 (4.6%) |
| Total | 18,341 (100.0%) | 15,269 (100.0%) |
Commute Time in Cheyenne
The most frequently occuring commute durations in Cheyenne are 10 to 14 minutes (10,339 commuters, 33.0%), 15 to 19 minutes (8,648 commuters, 27.6%), and 5 to 9 minutes (6,477 commuters, 20.7%).
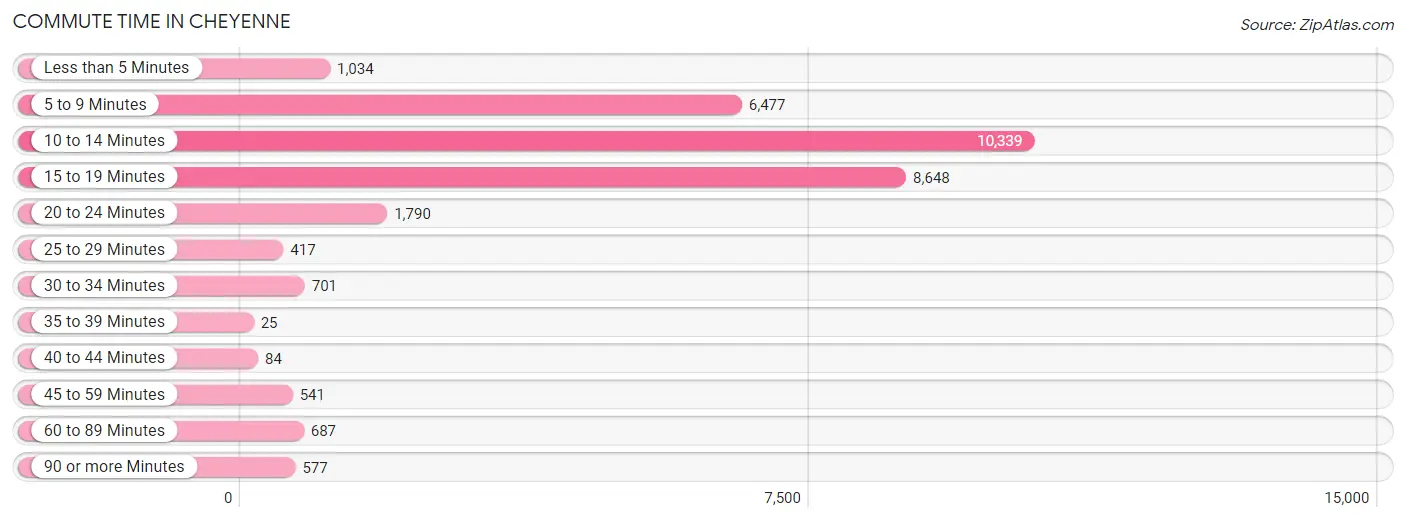
| Commute Time | # Commuters | % Commuters |
| Less than 5 Minutes | 1,034 | 3.3% |
| 5 to 9 Minutes | 6,477 | 20.7% |
| 10 to 14 Minutes | 10,339 | 33.0% |
| 15 to 19 Minutes | 8,648 | 27.6% |
| 20 to 24 Minutes | 1,790 | 5.7% |
| 25 to 29 Minutes | 417 | 1.3% |
| 30 to 34 Minutes | 701 | 2.2% |
| 35 to 39 Minutes | 25 | 0.1% |
| 40 to 44 Minutes | 84 | 0.3% |
| 45 to 59 Minutes | 541 | 1.7% |
| 60 to 89 Minutes | 687 | 2.2% |
| 90 or more Minutes | 577 | 1.8% |
Commute Time by Sex in Cheyenne
The most common commute times in Cheyenne are 10 to 14 minutes (5,700 commuters, 32.5%) for males and 10 to 14 minutes (4,639 commuters, 33.6%) for females.
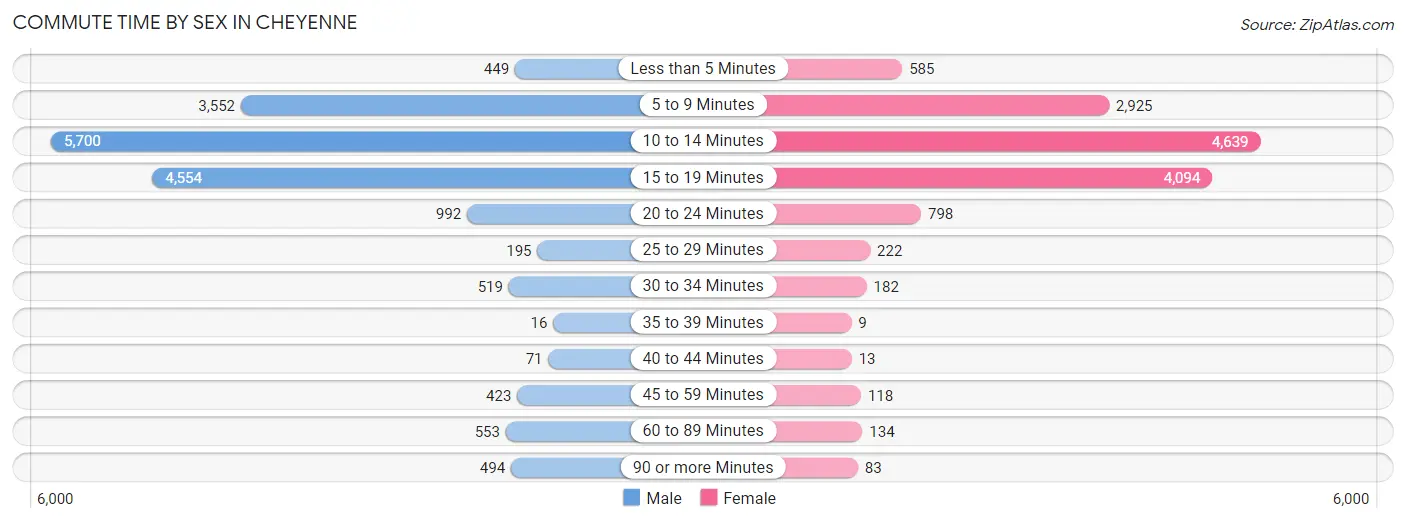
| Commute Time | Male | Female |
| Less than 5 Minutes | 449 (2.6%) | 585 (4.2%) |
| 5 to 9 Minutes | 3,552 (20.3%) | 2,925 (21.2%) |
| 10 to 14 Minutes | 5,700 (32.5%) | 4,639 (33.6%) |
| 15 to 19 Minutes | 4,554 (26.0%) | 4,094 (29.7%) |
| 20 to 24 Minutes | 992 (5.7%) | 798 (5.8%) |
| 25 to 29 Minutes | 195 (1.1%) | 222 (1.6%) |
| 30 to 34 Minutes | 519 (3.0%) | 182 (1.3%) |
| 35 to 39 Minutes | 16 (0.1%) | 9 (0.1%) |
| 40 to 44 Minutes | 71 (0.4%) | 13 (0.1%) |
| 45 to 59 Minutes | 423 (2.4%) | 118 (0.9%) |
| 60 to 89 Minutes | 553 (3.2%) | 134 (1.0%) |
| 90 or more Minutes | 494 (2.8%) | 83 (0.6%) |
Time of Departure to Work by Sex in Cheyenne
The most frequent times of departure to work in Cheyenne are 6:30 AM to 6:59 AM (2,623, 15.0%) for males and 7:30 AM to 7:59 AM (3,592, 26.0%) for females.
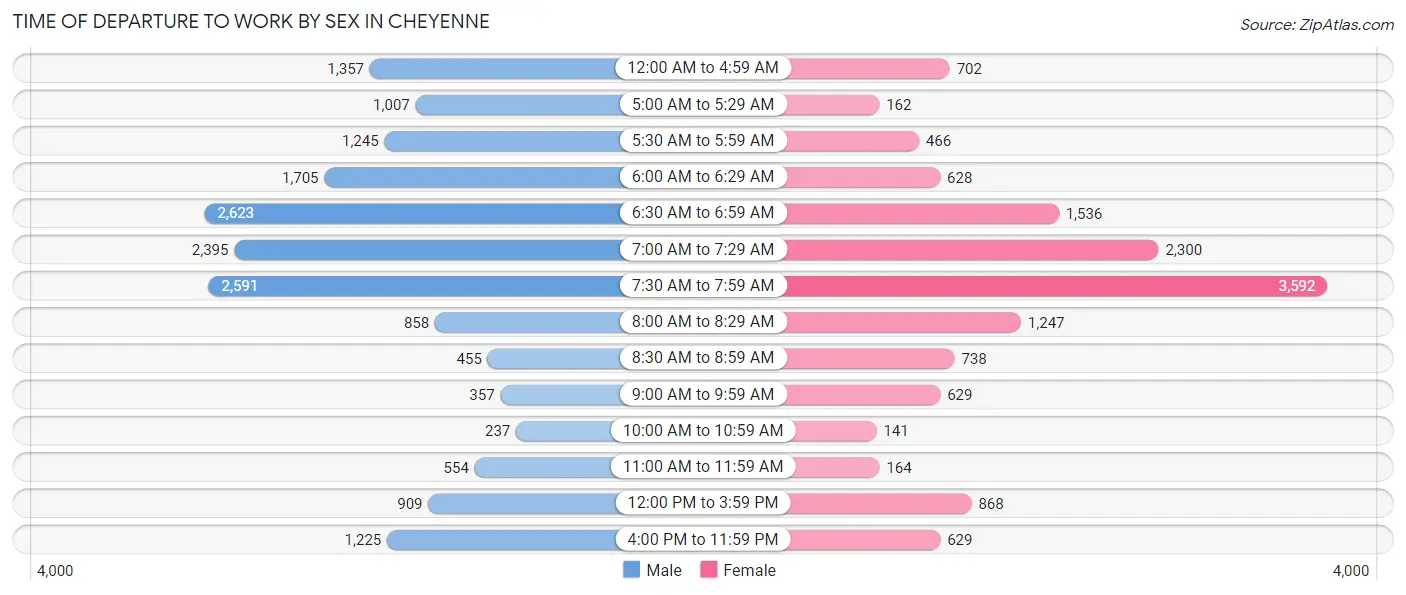
| Time of Departure | Male | Female |
| 12:00 AM to 4:59 AM | 1,357 (7.7%) | 702 (5.1%) |
| 5:00 AM to 5:29 AM | 1,007 (5.8%) | 162 (1.2%) |
| 5:30 AM to 5:59 AM | 1,245 (7.1%) | 466 (3.4%) |
| 6:00 AM to 6:29 AM | 1,705 (9.7%) | 628 (4.5%) |
| 6:30 AM to 6:59 AM | 2,623 (15.0%) | 1,536 (11.1%) |
| 7:00 AM to 7:29 AM | 2,395 (13.7%) | 2,300 (16.7%) |
| 7:30 AM to 7:59 AM | 2,591 (14.8%) | 3,592 (26.0%) |
| 8:00 AM to 8:29 AM | 858 (4.9%) | 1,247 (9.0%) |
| 8:30 AM to 8:59 AM | 455 (2.6%) | 738 (5.3%) |
| 9:00 AM to 9:59 AM | 357 (2.0%) | 629 (4.6%) |
| 10:00 AM to 10:59 AM | 237 (1.3%) | 141 (1.0%) |
| 11:00 AM to 11:59 AM | 554 (3.2%) | 164 (1.2%) |
| 12:00 PM to 3:59 PM | 909 (5.2%) | 868 (6.3%) |
| 4:00 PM to 11:59 PM | 1,225 (7.0%) | 629 (4.6%) |
| Total | 17,518 (100.0%) | 13,802 (100.0%) |
Housing Occupancy in Cheyenne
Occupancy by Ownership in Cheyenne
Of the total 28,306 dwellings in Cheyenne, owner-occupied units account for 19,575 (69.2%), while renter-occupied units make up 8,731 (30.8%).
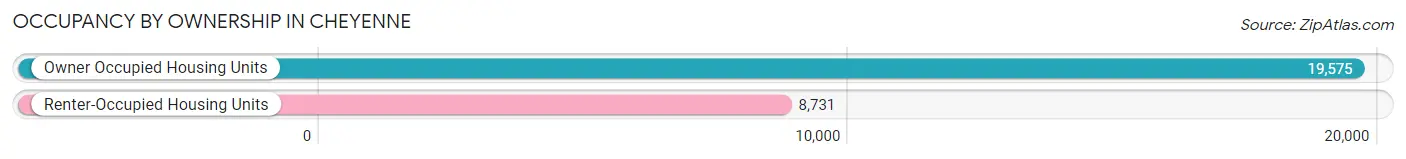
| Occupancy | # Housing Units | % Housing Units |
| Owner Occupied Housing Units | 19,575 | 69.2% |
| Renter-Occupied Housing Units | 8,731 | 30.8% |
| Total Occupied Housing Units | 28,306 | 100.0% |
Occupancy by Household Size in Cheyenne
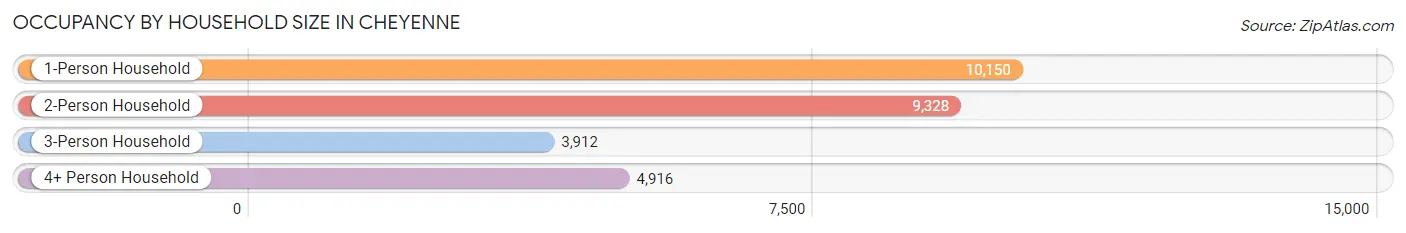
| Household Size | # Housing Units | % Housing Units |
| 1-Person Household | 10,150 | 35.9% |
| 2-Person Household | 9,328 | 33.0% |
| 3-Person Household | 3,912 | 13.8% |
| 4+ Person Household | 4,916 | 17.4% |
| Total Housing Units | 28,306 | 100.0% |
Occupancy by Ownership by Household Size in Cheyenne
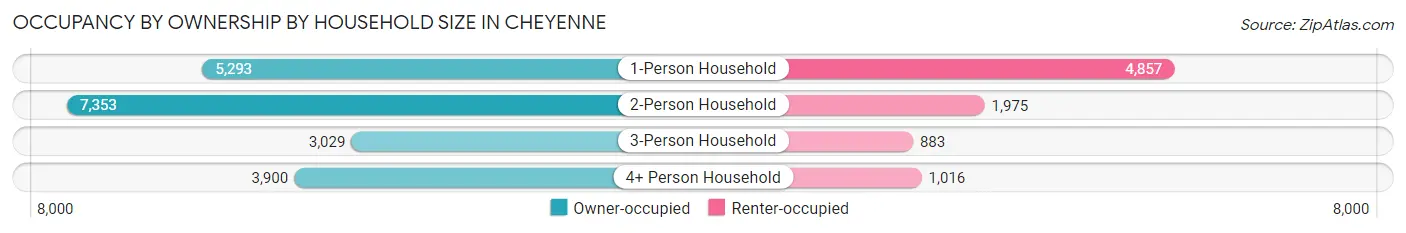
| Household Size | Owner-occupied | Renter-occupied |
| 1-Person Household | 5,293 (52.1%) | 4,857 (47.8%) |
| 2-Person Household | 7,353 (78.8%) | 1,975 (21.2%) |
| 3-Person Household | 3,029 (77.4%) | 883 (22.6%) |
| 4+ Person Household | 3,900 (79.3%) | 1,016 (20.7%) |
| Total Housing Units | 19,575 (69.2%) | 8,731 (30.8%) |
Occupancy by Educational Attainment in Cheyenne
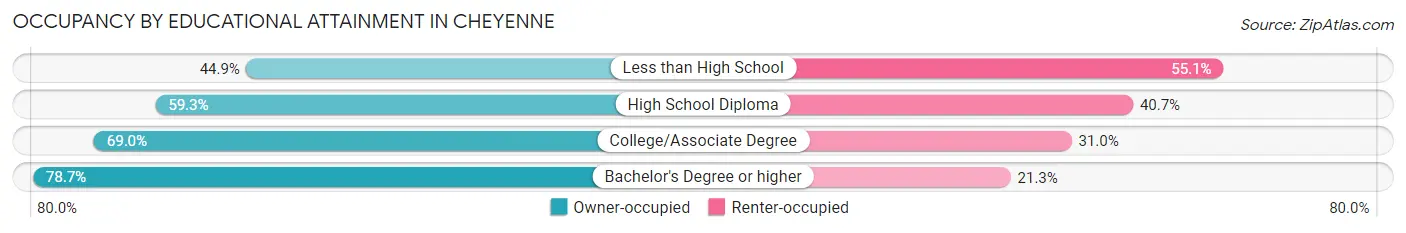
| Household Size | Owner-occupied | Renter-occupied |
| Less than High School | 474 (44.9%) | 581 (55.1%) |
| High School Diploma | 3,625 (59.3%) | 2,491 (40.7%) |
| College/Associate Degree | 8,225 (69.0%) | 3,694 (31.0%) |
| Bachelor's Degree or higher | 7,251 (78.7%) | 1,965 (21.3%) |
Occupancy by Age of Householder in Cheyenne
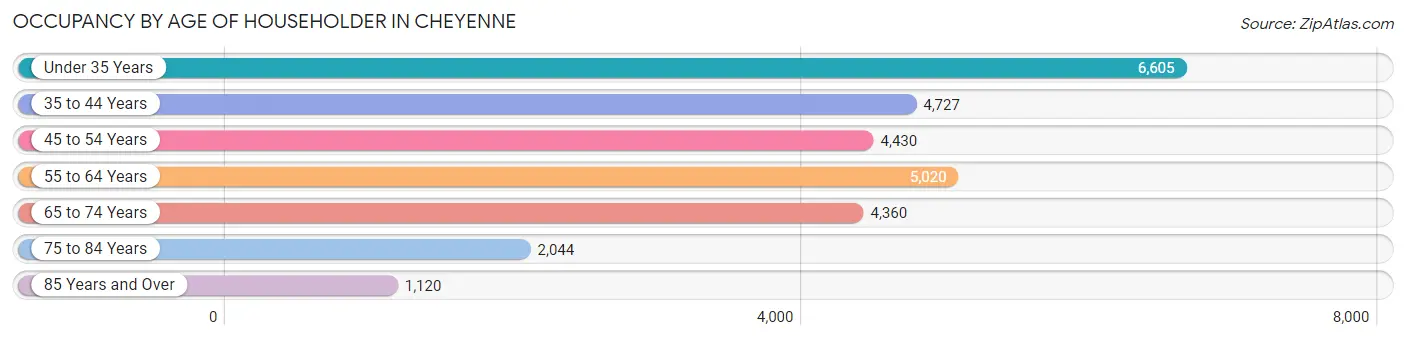
| Age Bracket | # Households | % Households |
| Under 35 Years | 6,605 | 23.3% |
| 35 to 44 Years | 4,727 | 16.7% |
| 45 to 54 Years | 4,430 | 15.7% |
| 55 to 64 Years | 5,020 | 17.7% |
| 65 to 74 Years | 4,360 | 15.4% |
| 75 to 84 Years | 2,044 | 7.2% |
| 85 Years and Over | 1,120 | 4.0% |
| Total | 28,306 | 100.0% |
Housing Finances in Cheyenne
Median Income by Occupancy in Cheyenne
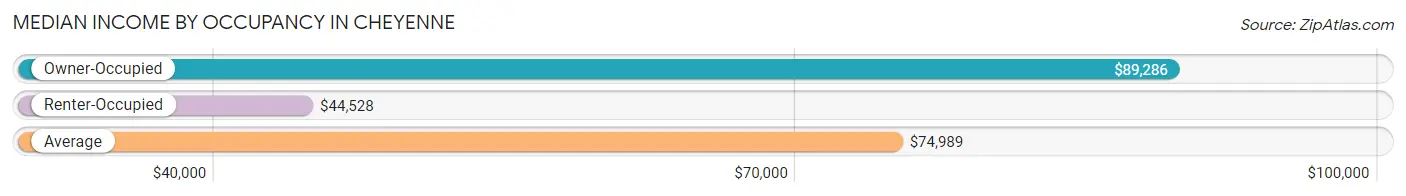
| Occupancy Type | # Households | Median Income |
| Owner-Occupied | 19,575 (69.2%) | $89,286 |
| Renter-Occupied | 8,731 (30.8%) | $44,528 |
| Average | 28,306 (100.0%) | $74,989 |
Occupancy by Householder Income Bracket in Cheyenne
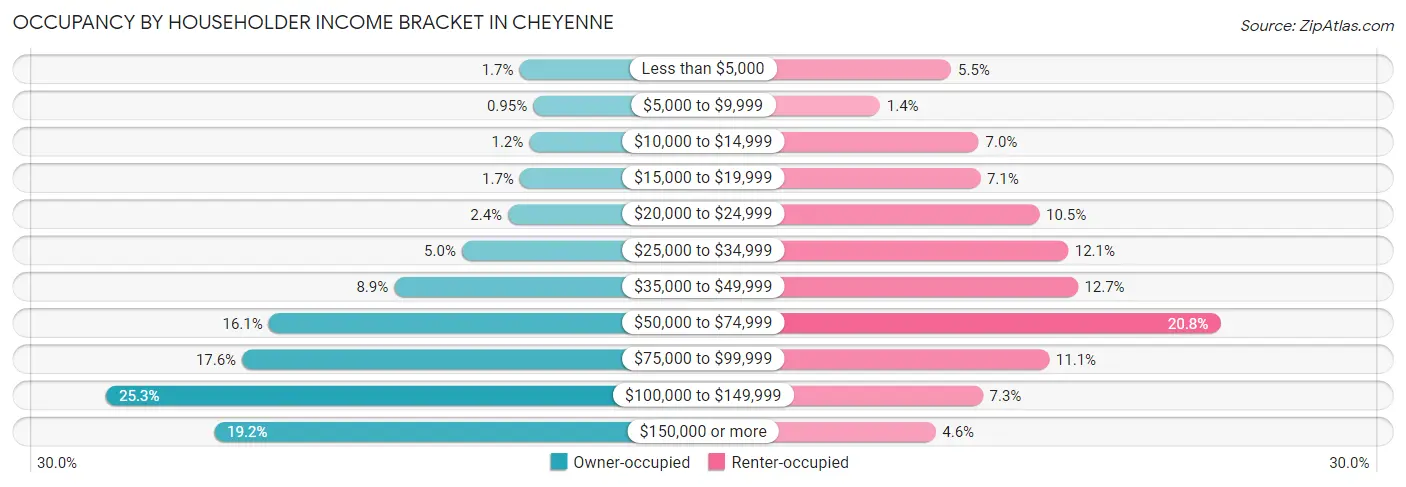
| Income Bracket | Owner-occupied | Renter-occupied |
| Less than $5,000 | 339 (1.7%) | 477 (5.5%) |
| $5,000 to $9,999 | 185 (0.9%) | 121 (1.4%) |
| $10,000 to $14,999 | 230 (1.2%) | 614 (7.0%) |
| $15,000 to $19,999 | 335 (1.7%) | 621 (7.1%) |
| $20,000 to $24,999 | 466 (2.4%) | 916 (10.5%) |
| $25,000 to $34,999 | 982 (5.0%) | 1,059 (12.1%) |
| $35,000 to $49,999 | 1,740 (8.9%) | 1,107 (12.7%) |
| $50,000 to $74,999 | 3,144 (16.1%) | 1,819 (20.8%) |
| $75,000 to $99,999 | 3,441 (17.6%) | 965 (11.1%) |
| $100,000 to $149,999 | 4,961 (25.3%) | 634 (7.3%) |
| $150,000 or more | 3,752 (19.2%) | 398 (4.6%) |
| Total | 19,575 (100.0%) | 8,731 (100.0%) |
Monthly Housing Cost Tiers in Cheyenne
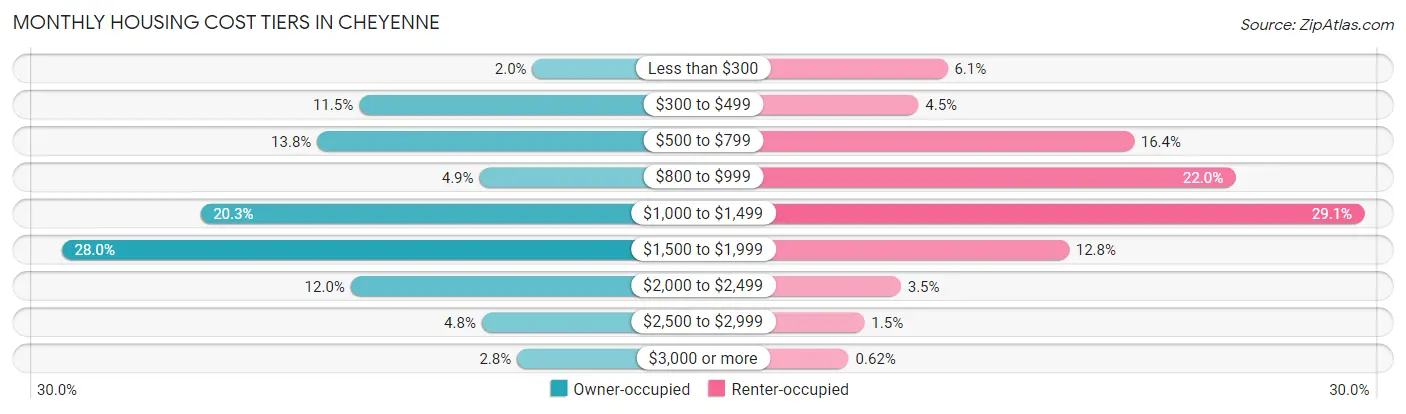
| Monthly Cost | Owner-occupied | Renter-occupied |
| Less than $300 | 381 (1.9%) | 531 (6.1%) |
| $300 to $499 | 2,257 (11.5%) | 390 (4.5%) |
| $500 to $799 | 2,710 (13.8%) | 1,429 (16.4%) |
| $800 to $999 | 955 (4.9%) | 1,917 (22.0%) |
| $1,000 to $1,499 | 3,974 (20.3%) | 2,539 (29.1%) |
| $1,500 to $1,999 | 5,473 (28.0%) | 1,116 (12.8%) |
| $2,000 to $2,499 | 2,348 (12.0%) | 306 (3.5%) |
| $2,500 to $2,999 | 929 (4.8%) | 130 (1.5%) |
| $3,000 or more | 548 (2.8%) | 54 (0.6%) |
| Total | 19,575 (100.0%) | 8,731 (100.0%) |
Physical Housing Characteristics in Cheyenne
Housing Structures in Cheyenne
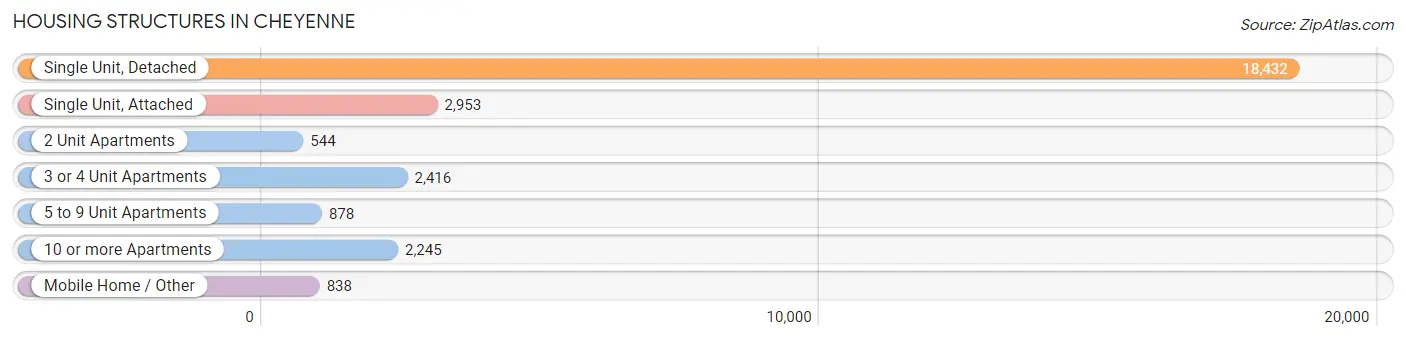
| Structure Type | # Housing Units | % Housing Units |
| Single Unit, Detached | 18,432 | 65.1% |
| Single Unit, Attached | 2,953 | 10.4% |
| 2 Unit Apartments | 544 | 1.9% |
| 3 or 4 Unit Apartments | 2,416 | 8.5% |
| 5 to 9 Unit Apartments | 878 | 3.1% |
| 10 or more Apartments | 2,245 | 7.9% |
| Mobile Home / Other | 838 | 3.0% |
| Total | 28,306 | 100.0% |
Housing Structures by Occupancy in Cheyenne
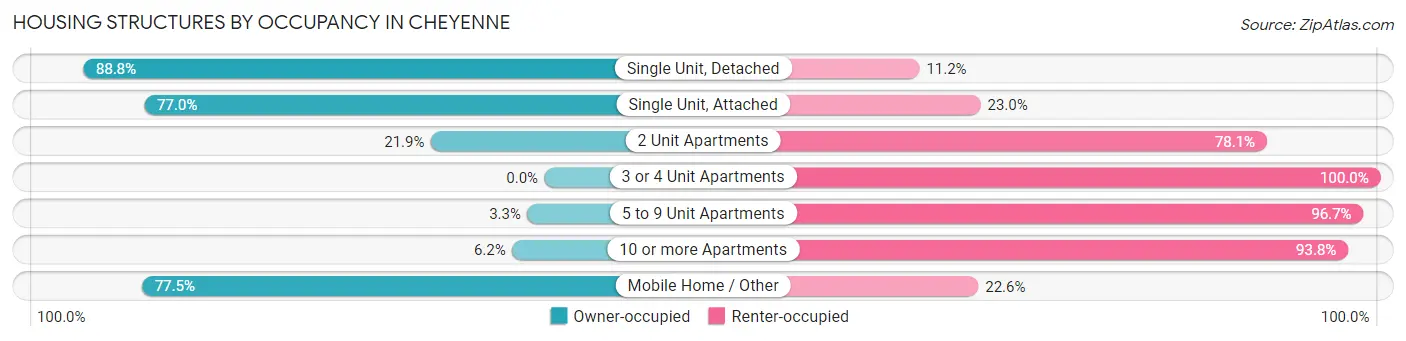
| Structure Type | Owner-occupied | Renter-occupied |
| Single Unit, Detached | 16,364 (88.8%) | 2,068 (11.2%) |
| Single Unit, Attached | 2,274 (77.0%) | 679 (23.0%) |
| 2 Unit Apartments | 119 (21.9%) | 425 (78.1%) |
| 3 or 4 Unit Apartments | 0 (0.0%) | 2,416 (100.0%) |
| 5 to 9 Unit Apartments | 29 (3.3%) | 849 (96.7%) |
| 10 or more Apartments | 140 (6.2%) | 2,105 (93.8%) |
| Mobile Home / Other | 649 (77.4%) | 189 (22.6%) |
| Total | 19,575 (69.2%) | 8,731 (30.8%) |
Housing Structures by Number of Rooms in Cheyenne
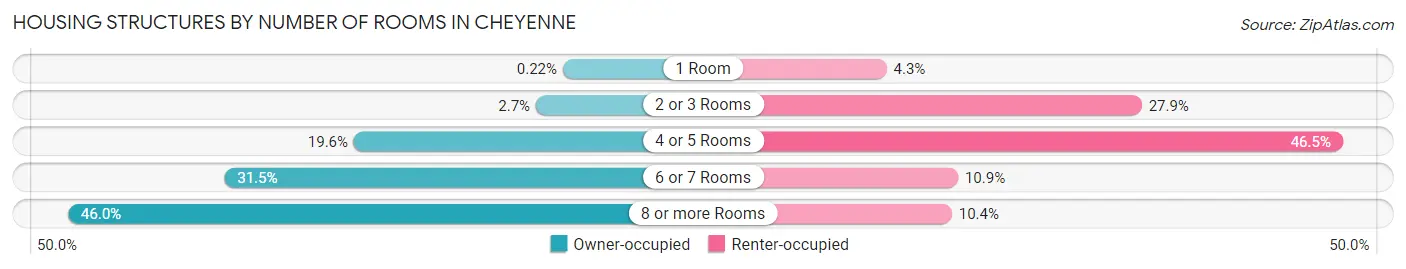
| Number of Rooms | Owner-occupied | Renter-occupied |
| 1 Room | 44 (0.2%) | 377 (4.3%) |
| 2 or 3 Rooms | 531 (2.7%) | 2,437 (27.9%) |
| 4 or 5 Rooms | 3,826 (19.6%) | 4,060 (46.5%) |
| 6 or 7 Rooms | 6,172 (31.5%) | 953 (10.9%) |
| 8 or more Rooms | 9,002 (46.0%) | 904 (10.3%) |
| Total | 19,575 (100.0%) | 8,731 (100.0%) |
Housing Structure by Heating Type in Cheyenne
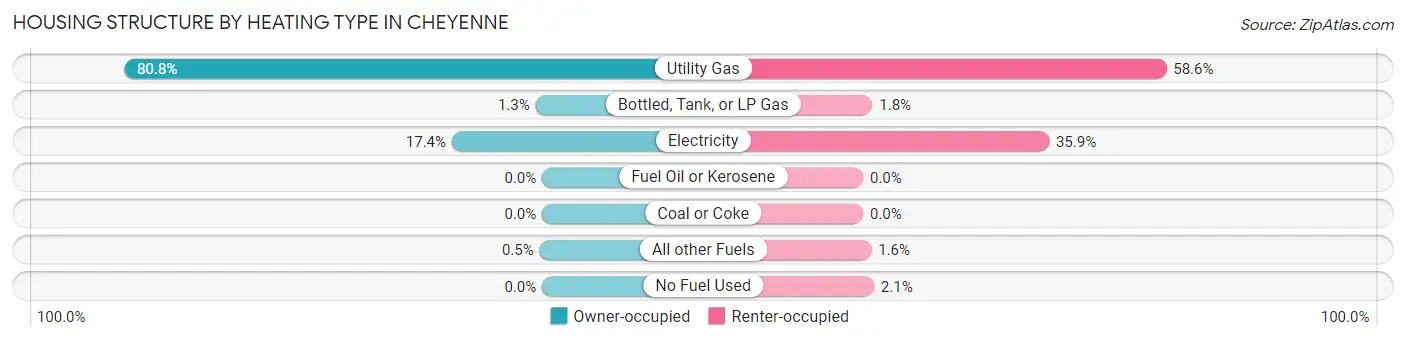
| Heating Type | Owner-occupied | Renter-occupied |
| Utility Gas | 15,815 (80.8%) | 5,116 (58.6%) |
| Bottled, Tank, or LP Gas | 249 (1.3%) | 156 (1.8%) |
| Electricity | 3,413 (17.4%) | 3,137 (35.9%) |
| Fuel Oil or Kerosene | 0 (0.0%) | 0 (0.0%) |
| Coal or Coke | 0 (0.0%) | 0 (0.0%) |
| All other Fuels | 98 (0.5%) | 139 (1.6%) |
| No Fuel Used | 0 (0.0%) | 183 (2.1%) |
| Total | 19,575 (100.0%) | 8,731 (100.0%) |
Household Vehicle Usage in Cheyenne
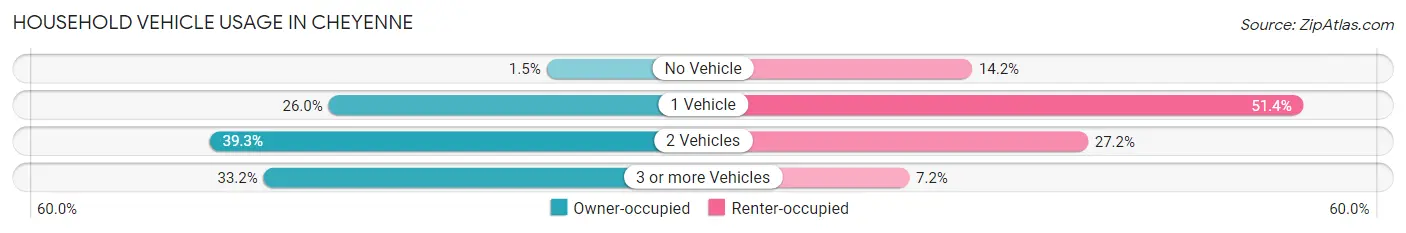
| Vehicles per Household | Owner-occupied | Renter-occupied |
| No Vehicle | 302 (1.5%) | 1,242 (14.2%) |
| 1 Vehicle | 5,079 (26.0%) | 4,485 (51.4%) |
| 2 Vehicles | 7,689 (39.3%) | 2,376 (27.2%) |
| 3 or more Vehicles | 6,505 (33.2%) | 628 (7.2%) |
| Total | 19,575 (100.0%) | 8,731 (100.0%) |
Real Estate & Mortgages in Cheyenne
Real Estate and Mortgage Overview in Cheyenne
| Characteristic | Without Mortgage | With Mortgage |
| Housing Units | 5,606 | 13,969 |
| Median Property Value | $272,200 | $286,400 |
| Median Household Income | $68,056 | $2,915 |
| Monthly Housing Costs | $520 | $533 |
| Real Estate Taxes | $1,648 | $411 |
Property Value by Mortgage Status in Cheyenne
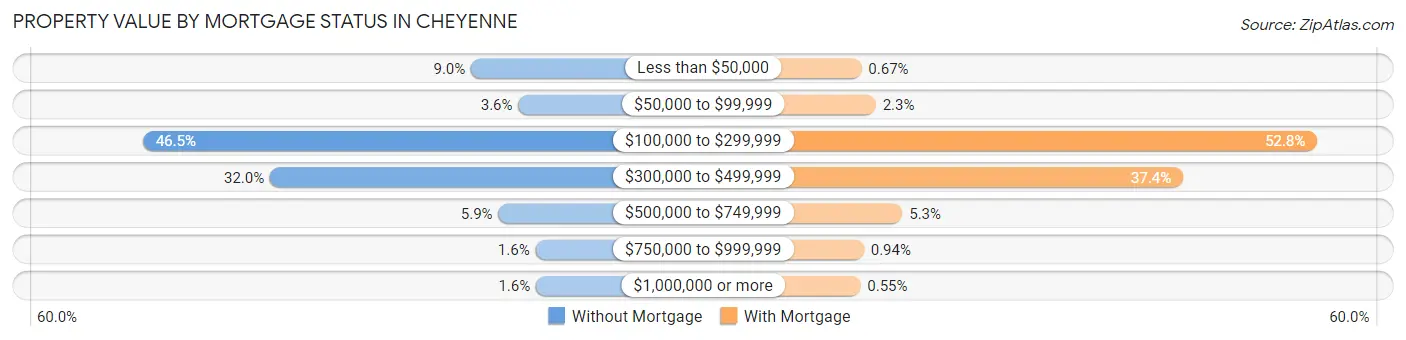
| Property Value | Without Mortgage | With Mortgage |
| Less than $50,000 | 503 (9.0%) | 94 (0.7%) |
| $50,000 to $99,999 | 200 (3.6%) | 322 (2.3%) |
| $100,000 to $299,999 | 2,607 (46.5%) | 7,370 (52.8%) |
| $300,000 to $499,999 | 1,791 (32.0%) | 5,229 (37.4%) |
| $500,000 to $749,999 | 328 (5.9%) | 746 (5.3%) |
| $750,000 to $999,999 | 90 (1.6%) | 131 (0.9%) |
| $1,000,000 or more | 87 (1.5%) | 77 (0.5%) |
| Total | 5,606 (100.0%) | 13,969 (100.0%) |
Household Income by Mortgage Status in Cheyenne
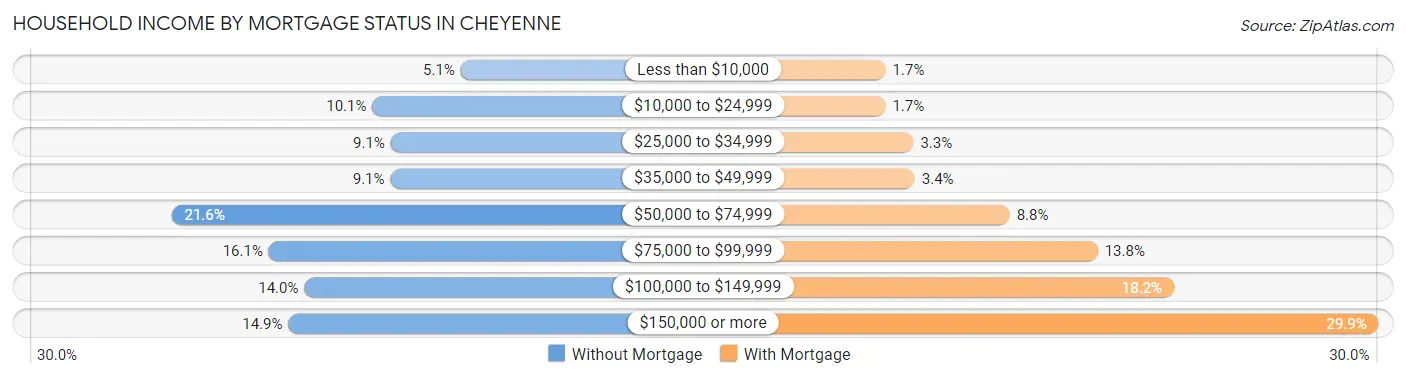
| Household Income | Without Mortgage | With Mortgage |
| Less than $10,000 | 285 (5.1%) | 240 (1.7%) |
| $10,000 to $24,999 | 568 (10.1%) | 239 (1.7%) |
| $25,000 to $34,999 | 509 (9.1%) | 463 (3.3%) |
| $35,000 to $49,999 | 510 (9.1%) | 473 (3.4%) |
| $50,000 to $74,999 | 1,211 (21.6%) | 1,230 (8.8%) |
| $75,000 to $99,999 | 900 (16.1%) | 1,933 (13.8%) |
| $100,000 to $149,999 | 786 (14.0%) | 2,541 (18.2%) |
| $150,000 or more | 837 (14.9%) | 4,175 (29.9%) |
| Total | 5,606 (100.0%) | 13,969 (100.0%) |
Property Value to Household Income Ratio in Cheyenne
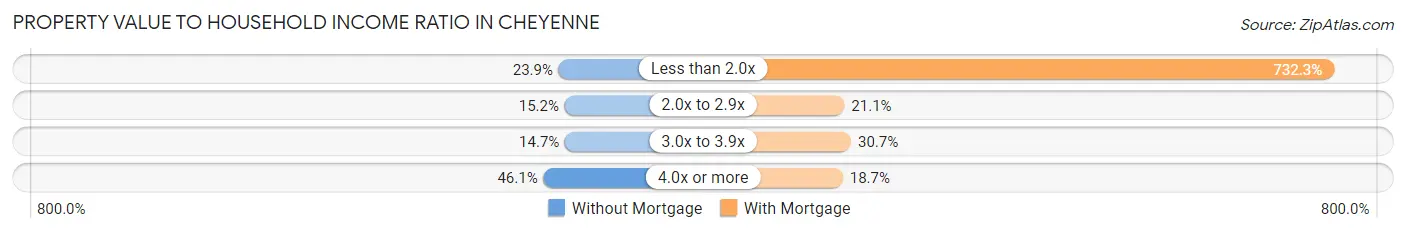
| Value-to-Income Ratio | Without Mortgage | With Mortgage |
| Less than 2.0x | 1,339 (23.9%) | 102,293 (732.3%) |
| 2.0x to 2.9x | 851 (15.2%) | 2,941 (21.0%) |
| 3.0x to 3.9x | 821 (14.6%) | 4,293 (30.7%) |
| 4.0x or more | 2,584 (46.1%) | 2,616 (18.7%) |
| Total | 5,606 (100.0%) | 13,969 (100.0%) |
Real Estate Taxes by Mortgage Status in Cheyenne
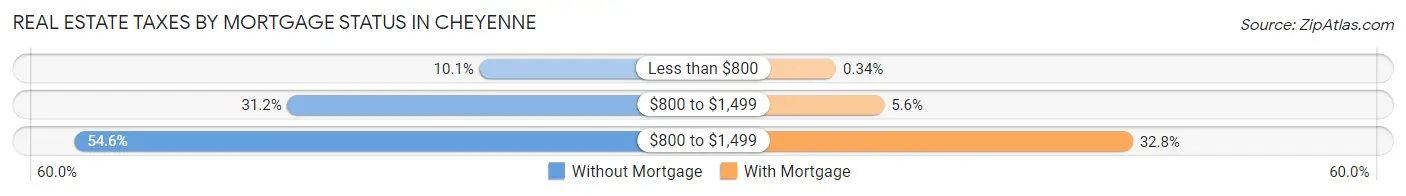
| Property Taxes | Without Mortgage | With Mortgage |
| Less than $800 | 568 (10.1%) | 47 (0.3%) |
| $800 to $1,499 | 1,748 (31.2%) | 784 (5.6%) |
| $800 to $1,499 | 3,058 (54.5%) | 4,588 (32.8%) |
| Total | 5,606 (100.0%) | 13,969 (100.0%) |
Health & Disability in Cheyenne
Health Insurance Coverage by Age in Cheyenne
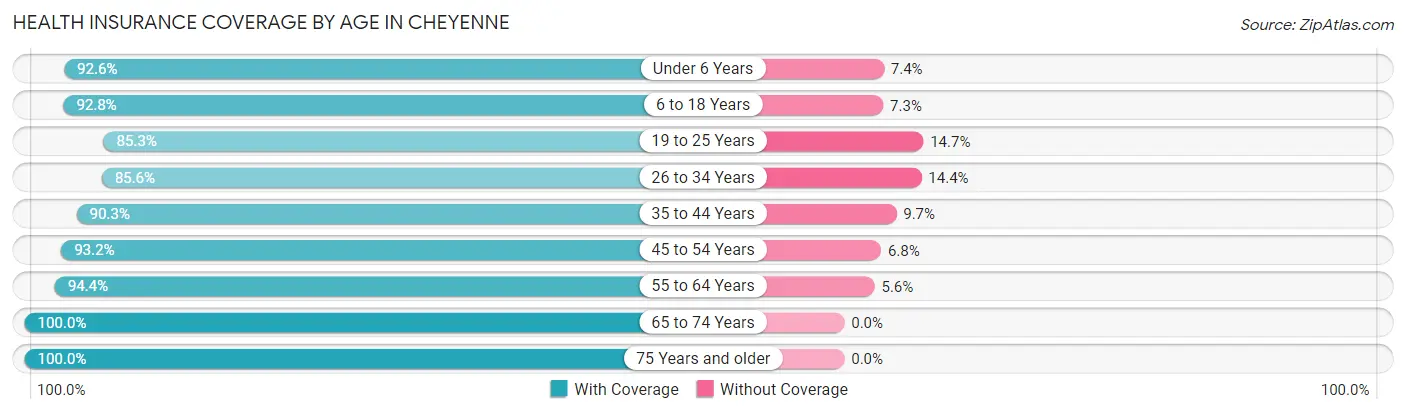
| Age Bracket | With Coverage | Without Coverage |
| Under 6 Years | 4,167 (92.6%) | 332 (7.4%) |
| 6 to 18 Years | 9,088 (92.7%) | 710 (7.2%) |
| 19 to 25 Years | 4,784 (85.3%) | 826 (14.7%) |
| 26 to 34 Years | 7,322 (85.6%) | 1,230 (14.4%) |
| 35 to 44 Years | 7,184 (90.3%) | 771 (9.7%) |
| 45 to 54 Years | 6,717 (93.2%) | 493 (6.8%) |
| 55 to 64 Years | 7,578 (94.4%) | 453 (5.6%) |
| 65 to 74 Years | 6,594 (100.0%) | 0 (0.0%) |
| 75 Years and older | 4,358 (100.0%) | 0 (0.0%) |
| Total | 57,792 (92.3%) | 4,815 (7.7%) |
Health Insurance Coverage by Citizenship Status in Cheyenne
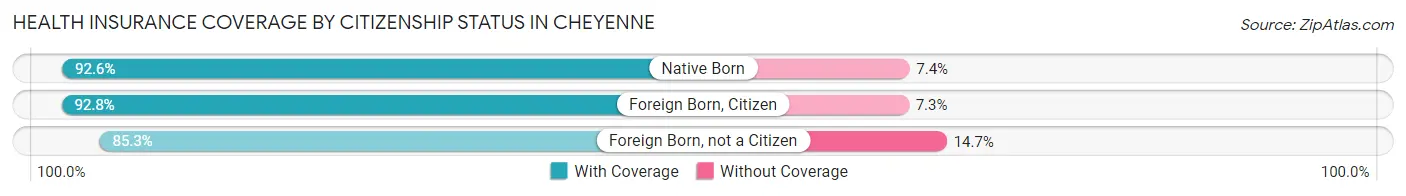
| Citizenship Status | With Coverage | Without Coverage |
| Native Born | 4,167 (92.6%) | 332 (7.4%) |
| Foreign Born, Citizen | 9,088 (92.7%) | 710 (7.2%) |
| Foreign Born, not a Citizen | 4,784 (85.3%) | 826 (14.7%) |
Health Insurance Coverage by Household Income in Cheyenne
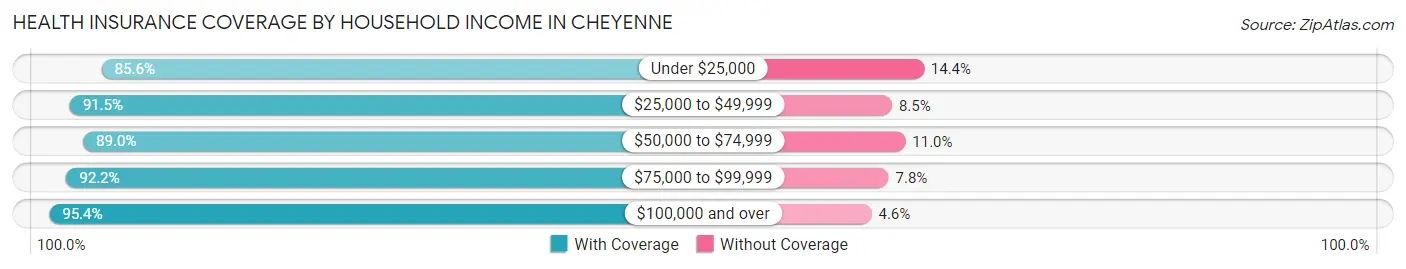
| Household Income | With Coverage | Without Coverage |
| Under $25,000 | 5,220 (85.6%) | 881 (14.4%) |
| $25,000 to $49,999 | 7,433 (91.5%) | 687 (8.5%) |
| $50,000 to $74,999 | 8,726 (89.0%) | 1,075 (11.0%) |
| $75,000 to $99,999 | 10,596 (92.2%) | 900 (7.8%) |
| $100,000 and over | 25,751 (95.4%) | 1,249 (4.6%) |
Public vs Private Health Insurance Coverage by Age in Cheyenne
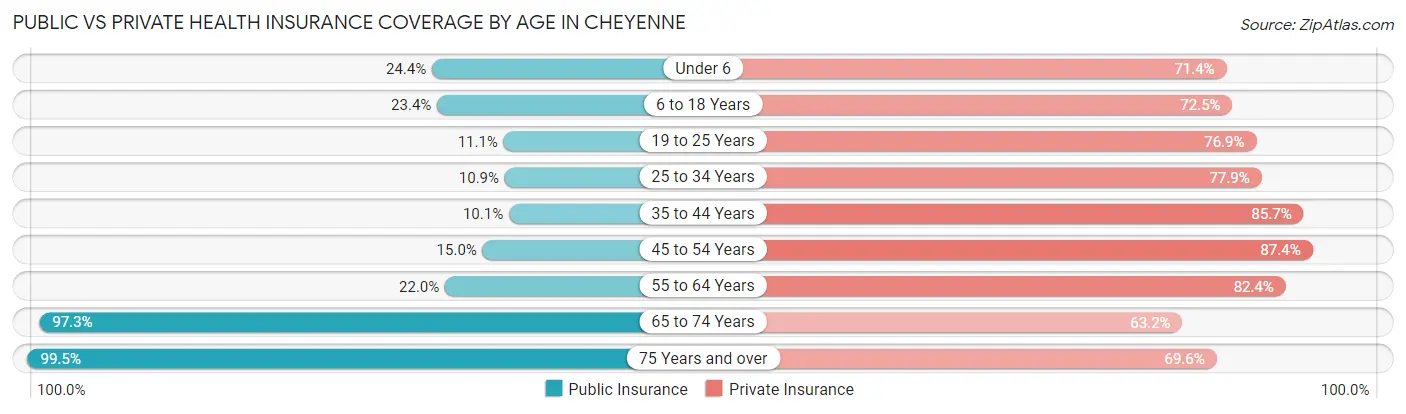
| Age Bracket | Public Insurance | Private Insurance |
| Under 6 | 1,097 (24.4%) | 3,212 (71.4%) |
| 6 to 18 Years | 2,295 (23.4%) | 7,104 (72.5%) |
| 19 to 25 Years | 621 (11.1%) | 4,316 (76.9%) |
| 25 to 34 Years | 929 (10.9%) | 6,664 (77.9%) |
| 35 to 44 Years | 803 (10.1%) | 6,818 (85.7%) |
| 45 to 54 Years | 1,080 (15.0%) | 6,299 (87.4%) |
| 55 to 64 Years | 1,763 (22.0%) | 6,617 (82.4%) |
| 65 to 74 Years | 6,413 (97.3%) | 4,169 (63.2%) |
| 75 Years and over | 4,334 (99.5%) | 3,031 (69.6%) |
| Total | 19,335 (30.9%) | 48,230 (77.0%) |
Disability Status by Sex by Age in Cheyenne
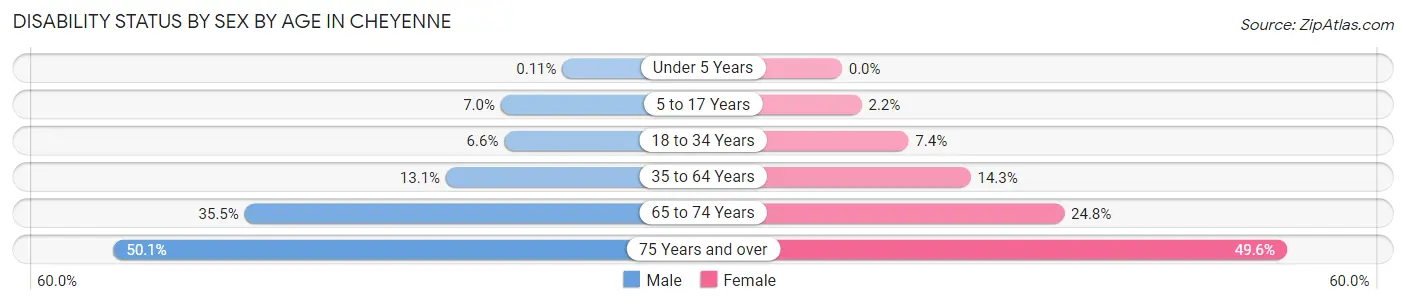
| Age Bracket | Male | Female |
| Under 5 Years | 2 (0.1%) | 0 (0.0%) |
| 5 to 17 Years | 324 (7.0%) | 115 (2.2%) |
| 18 to 34 Years | 502 (6.6%) | 531 (7.4%) |
| 35 to 64 Years | 1,541 (13.1%) | 1,637 (14.3%) |
| 65 to 74 Years | 1,118 (35.5%) | 853 (24.8%) |
| 75 Years and over | 932 (50.1%) | 1,238 (49.6%) |
Disability Class by Sex by Age in Cheyenne
Disability Class: Hearing Difficulty
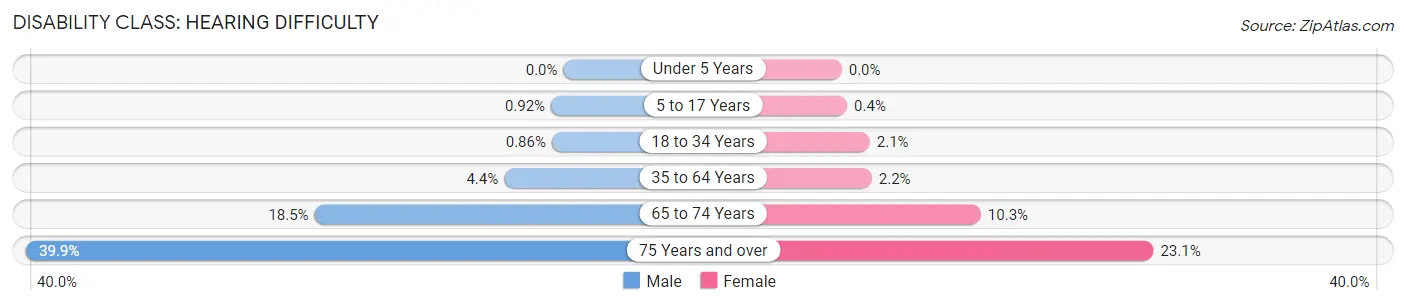
| Age Bracket | Male | Female |
| Under 5 Years | 0 (0.0%) | 0 (0.0%) |
| 5 to 17 Years | 43 (0.9%) | 21 (0.4%) |
| 18 to 34 Years | 66 (0.9%) | 149 (2.1%) |
| 35 to 64 Years | 518 (4.4%) | 255 (2.2%) |
| 65 to 74 Years | 582 (18.5%) | 356 (10.3%) |
| 75 Years and over | 742 (39.9%) | 578 (23.1%) |
Disability Class: Vision Difficulty
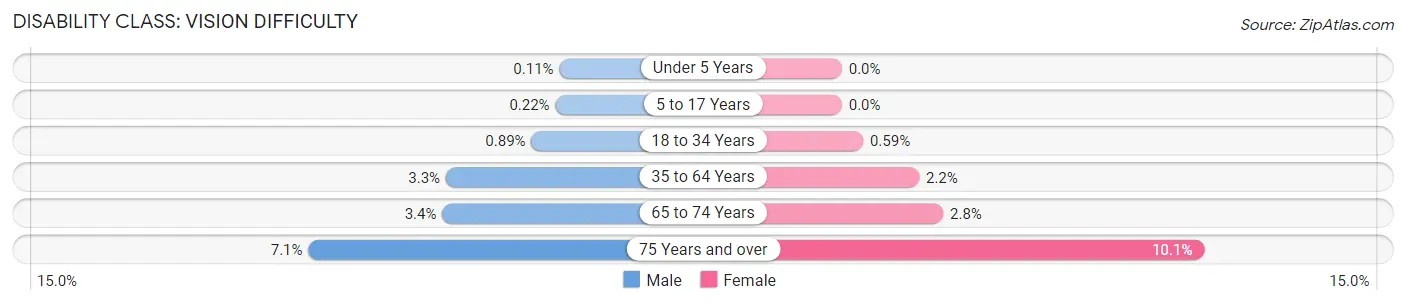
| Age Bracket | Male | Female |
| Under 5 Years | 2 (0.1%) | 0 (0.0%) |
| 5 to 17 Years | 10 (0.2%) | 0 (0.0%) |
| 18 to 34 Years | 68 (0.9%) | 42 (0.6%) |
| 35 to 64 Years | 385 (3.3%) | 245 (2.1%) |
| 65 to 74 Years | 106 (3.4%) | 97 (2.8%) |
| 75 Years and over | 132 (7.1%) | 252 (10.1%) |
Disability Class: Cognitive Difficulty
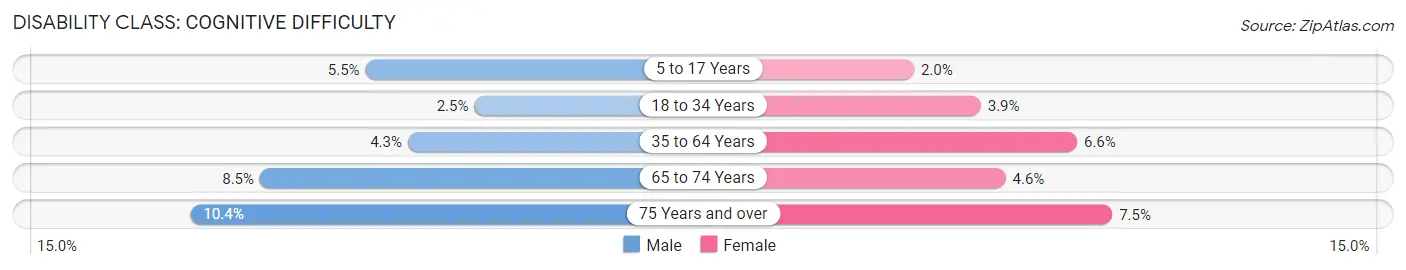
| Age Bracket | Male | Female |
| 5 to 17 Years | 256 (5.5%) | 105 (2.0%) |
| 18 to 34 Years | 189 (2.5%) | 277 (3.9%) |
| 35 to 64 Years | 510 (4.3%) | 748 (6.6%) |
| 65 to 74 Years | 266 (8.5%) | 157 (4.6%) |
| 75 Years and over | 193 (10.4%) | 188 (7.5%) |
Disability Class: Ambulatory Difficulty
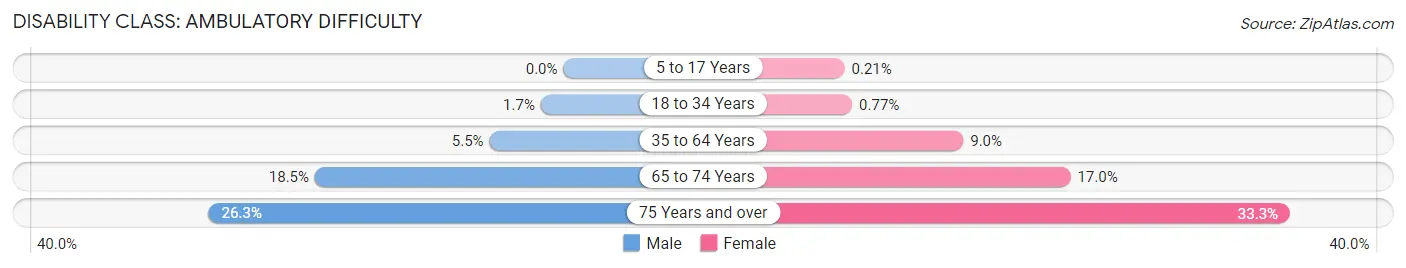
| Age Bracket | Male | Female |
| 5 to 17 Years | 0 (0.0%) | 11 (0.2%) |
| 18 to 34 Years | 128 (1.7%) | 55 (0.8%) |
| 35 to 64 Years | 646 (5.5%) | 1,030 (9.0%) |
| 65 to 74 Years | 581 (18.4%) | 585 (17.0%) |
| 75 Years and over | 490 (26.3%) | 831 (33.3%) |
Disability Class: Self-Care Difficulty
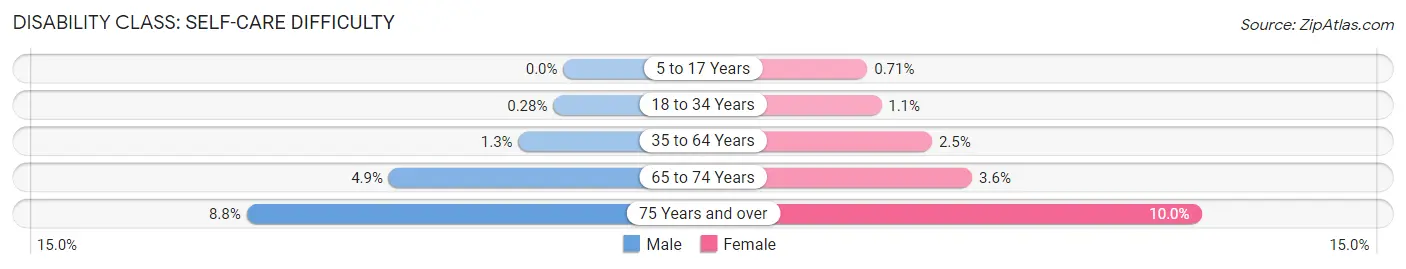
| Age Bracket | Male | Female |
| 5 to 17 Years | 0 (0.0%) | 37 (0.7%) |
| 18 to 34 Years | 21 (0.3%) | 79 (1.1%) |
| 35 to 64 Years | 147 (1.3%) | 287 (2.5%) |
| 65 to 74 Years | 153 (4.9%) | 125 (3.6%) |
| 75 Years and over | 164 (8.8%) | 250 (10.0%) |
Technology Access in Cheyenne
Computing Device Access in Cheyenne
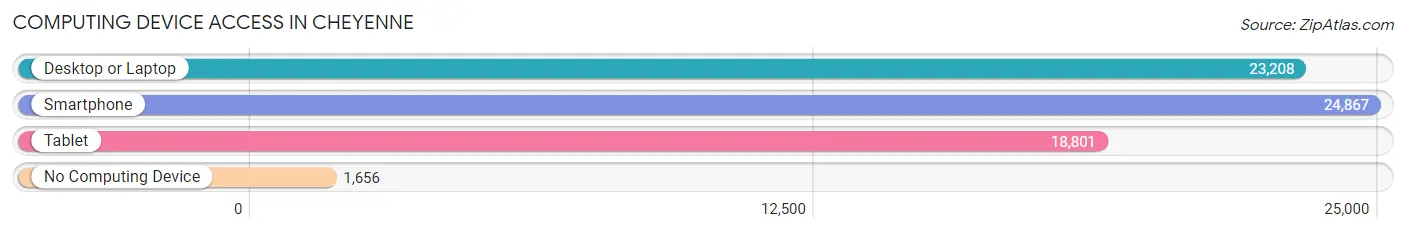
| Device Type | # Households | % Households |
| Desktop or Laptop | 23,208 | 82.0% |
| Smartphone | 24,867 | 87.8% |
| Tablet | 18,801 | 66.4% |
| No Computing Device | 1,656 | 5.9% |
| Total | 28,306 | 100.0% |
Internet Access in Cheyenne
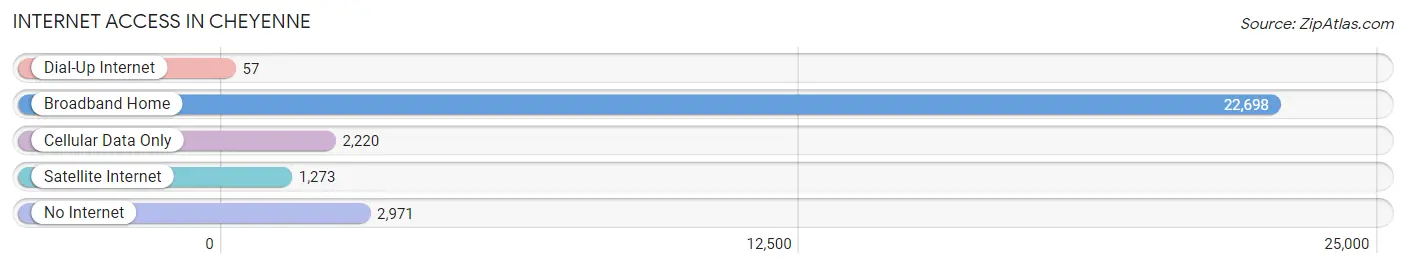
| Internet Type | # Households | % Households |
| Dial-Up Internet | 57 | 0.2% |
| Broadband Home | 22,698 | 80.2% |
| Cellular Data Only | 2,220 | 7.8% |
| Satellite Internet | 1,273 | 4.5% |
| No Internet | 2,971 | 10.5% |
| Total | 28,306 | 100.0% |
Cheyenne Summary
Cheyenne, Wyoming is the capital of the state and the most populous city in the state. It is located in the southeastern corner of the state, near the border with Nebraska and Colorado. The city is situated at the base of the Laramie Mountains and is the largest city in the state.
History
Cheyenne was founded in 1867 as a railroad town, and was named after the Cheyenne Indians who lived in the area. The city was originally a stop on the Union Pacific Railroad, and was the first city in Wyoming to be incorporated. The city quickly grew in population and importance, and by the late 19th century, it was the largest city in the state.
The city was a major hub for the cattle industry, and was the site of the famous Cheyenne Frontier Days, an annual rodeo and festival that is still held today. The city was also the site of the first state capitol building in Wyoming, and the first state university.
Geography
Cheyenne is located in the southeastern corner of Wyoming, near the border with Nebraska and Colorado. The city is situated at the base of the Laramie Mountains, and is the largest city in the state. The city is located at an elevation of 6,062 feet, and has a total area of 24.3 square miles.
The city is located in a semi-arid climate, with hot summers and cold winters. The average annual temperature is 48.3 degrees Fahrenheit, and the average annual precipitation is 16.3 inches.
Economy
Cheyenne is the economic hub of Wyoming, and is home to a variety of industries. The city is home to a large number of government offices, including the state capitol building, the state university, and the state prison. The city is also home to a number of corporate headquarters, including the Union Pacific Railroad, the Wyoming National Bank, and the Wyoming Stock Exchange.
The city is also home to a number of manufacturing companies, including the Cheyenne Brewing Company, the Cheyenne Cigar Company, and the Cheyenne Leather Company. The city is also home to a number of retail stores, restaurants, and hotels.
Demographics
As of the 2010 census, the population of Cheyenne was 59,466. The city has a population density of 2,446 people per square mile. The median age of the population is 35.7 years, and the median household income is $50,936.
The racial makeup of the city is 87.3% White, 4.2% African American, 1.2% Native American, 2.2% Asian, 0.2% Pacific Islander, 2.7% from other races, and 2.4% from two or more races. The city is also home to a large Hispanic population, with 24.3% of the population identifying as Hispanic or Latino.
Cheyenne is a diverse city, with a variety of cultures and backgrounds. The city is home to a number of religious institutions, including the Cheyenne Catholic Diocese, the Cheyenne Islamic Center, and the Cheyenne Jewish Community Center. The city is also home to a number of cultural institutions, including the Cheyenne Symphony Orchestra, the Cheyenne Little Theatre, and the Cheyenne Museum of Art.
Common Questions
What is Per Capita Income in Cheyenne?
Per Capita income in Cheyenne is $41,908.
What is the Median Family Income in Cheyenne?
Median Family Income in Cheyenne is $95,637.
What is the Median Household income in Cheyenne?
Median Household Income in Cheyenne is $74,989.
What is Income or Wage Gap in Cheyenne?
Income or Wage Gap in Cheyenne is 36.8%.
Women in Cheyenne earn 63.2 cents for every dollar earned by a man.
What is Family Income Deficit in Cheyenne?
Family Income Deficit in Cheyenne is $12,026.
Families that are below poverty line in Cheyenne earn $12,026 less on average than the poverty threshold level.
What is Inequality or Gini Index in Cheyenne?
Inequality or Gini Index in Cheyenne is 0.44.
What is the Total Population of Cheyenne?
Total Population of Cheyenne is 64,795.
What is the Total Male Population of Cheyenne?
Total Male Population of Cheyenne is 32,393.
What is the Total Female Population of Cheyenne?
Total Female Population of Cheyenne is 32,402.
What is the Ratio of Males per 100 Females in Cheyenne?
There are 99.97 Males per 100 Females in Cheyenne.
What is the Ratio of Females per 100 Males in Cheyenne?
There are 100.03 Females per 100 Males in Cheyenne.
What is the Median Population Age in Cheyenne?
Median Population Age in Cheyenne is 38.3 Years.
What is the Average Family Size in Cheyenne
Average Family Size in Cheyenne is 3.0 People.
What is the Average Household Size in Cheyenne
Average Household Size in Cheyenne is 2.3 People.
How Large is the Labor Force in Cheyenne?
There are 35,407 People in the Labor Forcein in Cheyenne.
What is the Percentage of People in the Labor Force in Cheyenne?
67.3% of People are in the Labor Force in Cheyenne.
What is the Unemployment Rate in Cheyenne?
Unemployment Rate in Cheyenne is 3.4%.