Glenrock, WY Map & Demographics
Glenrock Map
Glenrock Overview
$28,514
PER CAPITA INCOME
$68,409
AVG FAMILY INCOME
$64,797
AVG HOUSEHOLD INCOME
58.8%
WAGE / INCOME GAP [ % ]
41.2¢/ $1
WAGE / INCOME GAP [ $ ]
0.35
INEQUALITY / GINI INDEX
2,863
TOTAL POPULATION
1,505
MALE POPULATION
1,358
FEMALE POPULATION
110.82
MALES / 100 FEMALES
90.23
FEMALES / 100 MALES
41.8
MEDIAN AGE
3.1
AVG FAMILY SIZE
2.6
AVG HOUSEHOLD SIZE
1,482
LABOR FORCE [ PEOPLE ]
66.3%
PERCENT IN LABOR FORCE
9.3%
UNEMPLOYMENT RATE
Glenrock Zip Codes
Glenrock Area Codes
Income in Glenrock
Income Overview in Glenrock
Per Capita Income in Glenrock is $28,514, while median incomes of families and households are $68,409 and $64,797 respectively.
| Characteristic | Number | Measure |
| Per Capita Income | 2,863 | $28,514 |
| Median Family Income | 740 | $68,409 |
| Mean Family Income | 740 | $79,405 |
| Median Household Income | 1,079 | $64,797 |
| Mean Household Income | 1,079 | $73,512 |
| Income Deficit | 740 | $0 |
| Wage / Income Gap (%) | 2,863 | 58.84% |
| Wage / Income Gap ($) | 2,863 | 41.16¢ per $1 |
| Gini / Inequality Index | 2,863 | 0.35 |
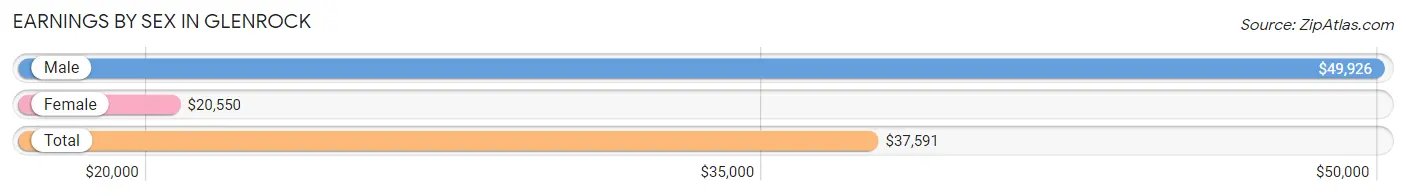
Earnings by Sex in Glenrock
Average Earnings in Glenrock are $37,591, $49,926 for men and $20,550 for women, a difference of 58.8%.
| Sex | Number | Average Earnings |
| Male | 900 (61.1%) | $49,926 |
| Female | 574 (38.9%) | $20,550 |
| Total | 1,474 (100.0%) | $37,591 |
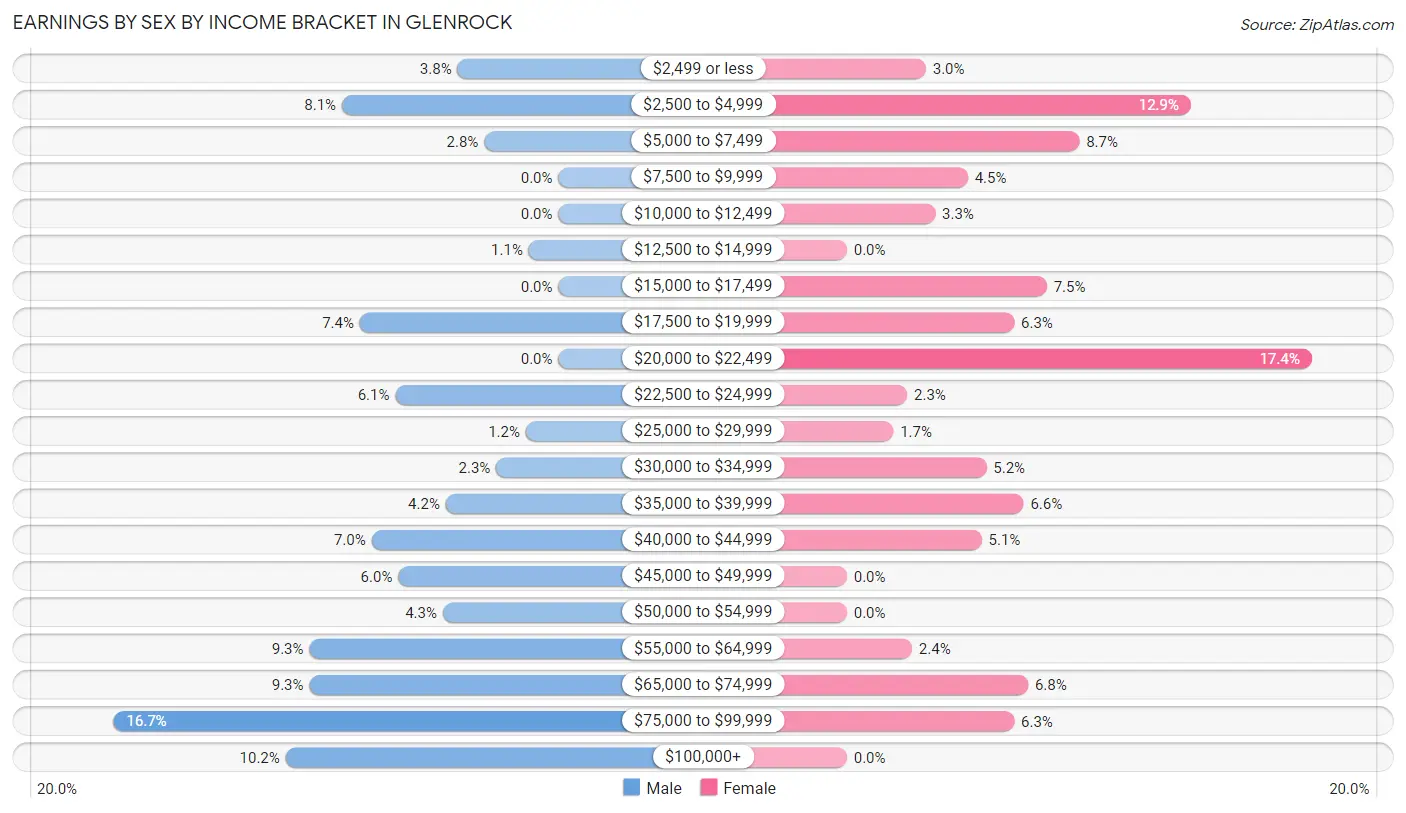
Earnings by Sex by Income Bracket in Glenrock
The most common earnings brackets in Glenrock are $75,000 to $99,999 for men (150 | 16.7%) and $20,000 to $22,499 for women (100 | 17.4%).
| Income | Male | Female |
| $2,499 or less | 34 (3.8%) | 17 (3.0%) |
| $2,500 to $4,999 | 73 (8.1%) | 74 (12.9%) |
| $5,000 to $7,499 | 25 (2.8%) | 50 (8.7%) |
| $7,500 to $9,999 | 0 (0.0%) | 26 (4.5%) |
| $10,000 to $12,499 | 0 (0.0%) | 19 (3.3%) |
| $12,500 to $14,999 | 10 (1.1%) | 0 (0.0%) |
| $15,000 to $17,499 | 0 (0.0%) | 43 (7.5%) |
| $17,500 to $19,999 | 67 (7.4%) | 36 (6.3%) |
| $20,000 to $22,499 | 0 (0.0%) | 100 (17.4%) |
| $22,500 to $24,999 | 55 (6.1%) | 13 (2.3%) |
| $25,000 to $29,999 | 11 (1.2%) | 10 (1.7%) |
| $30,000 to $34,999 | 21 (2.3%) | 30 (5.2%) |
| $35,000 to $39,999 | 38 (4.2%) | 38 (6.6%) |
| $40,000 to $44,999 | 63 (7.0%) | 29 (5.1%) |
| $45,000 to $49,999 | 54 (6.0%) | 0 (0.0%) |
| $50,000 to $54,999 | 39 (4.3%) | 0 (0.0%) |
| $55,000 to $64,999 | 84 (9.3%) | 14 (2.4%) |
| $65,000 to $74,999 | 84 (9.3%) | 39 (6.8%) |
| $75,000 to $99,999 | 150 (16.7%) | 36 (6.3%) |
| $100,000+ | 92 (10.2%) | 0 (0.0%) |
| Total | 900 (100.0%) | 574 (100.0%) |
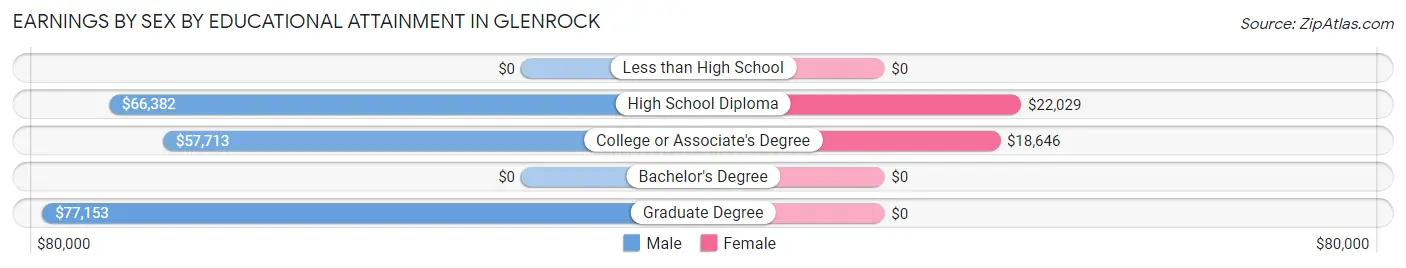
Earnings by Sex by Educational Attainment in Glenrock
Average earnings in Glenrock are $64,564 for men and $21,400 for women, a difference of 66.8%. Men with an educational attainment of graduate degree enjoy the highest average annual earnings of $77,153, while those with college or associate's degree education earn the least with $57,713. Women with an educational attainment of high school diploma earn the most with the average annual earnings of $22,029, while those with college or associate's degree education have the smallest earnings of $18,646.
| Educational Attainment | Male Income | Female Income |
| Less than High School | - | - |
| High School Diploma | $66,382 | $22,029 |
| College or Associate's Degree | $57,713 | $18,646 |
| Bachelor's Degree | - | - |
| Graduate Degree | $77,153 | $0 |
| Total | $64,564 | $21,400 |
Family Income in Glenrock
Family Income Brackets in Glenrock
According to the Glenrock family income data, there are 174 families falling into the $50,000 to $74,999 income range, which is the most common income bracket and makes up 23.5% of all families.
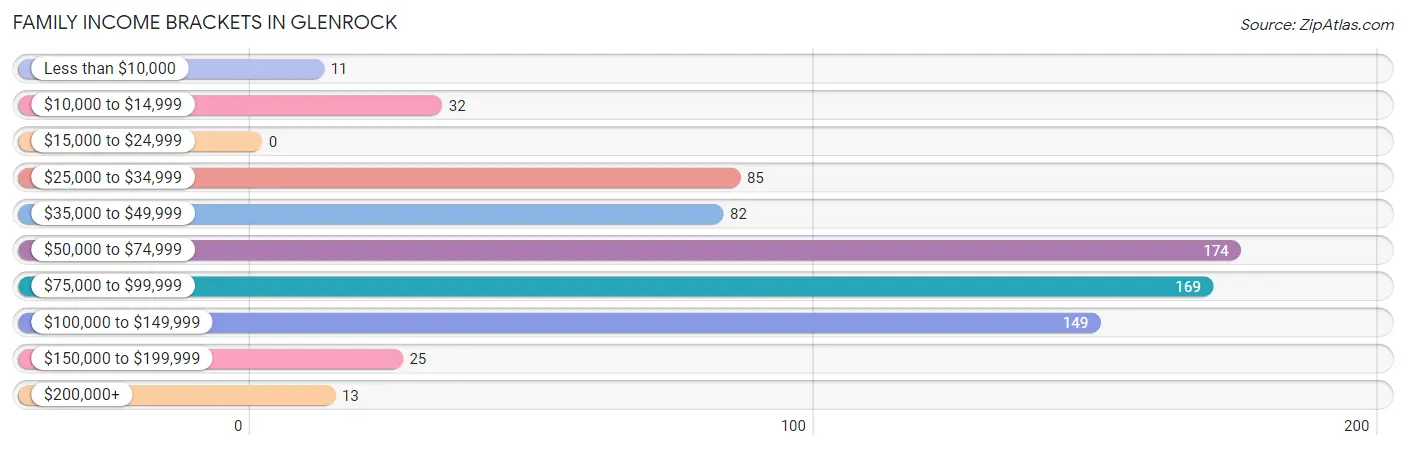
| Income Bracket | # Families | % Families |
| Less than $10,000 | 11 | 1.5% |
| $10,000 to $14,999 | 32 | 4.3% |
| $15,000 to $24,999 | 0 | 0.0% |
| $25,000 to $34,999 | 85 | 11.5% |
| $35,000 to $49,999 | 82 | 11.1% |
| $50,000 to $74,999 | 174 | 23.5% |
| $75,000 to $99,999 | 169 | 22.8% |
| $100,000 to $149,999 | 149 | 20.1% |
| $150,000 to $199,999 | 25 | 3.4% |
| $200,000+ | 13 | 1.8% |
Family Income by Famaliy Size in Glenrock
7+ person families (30 | 4.1%) account for the highest median family income in Glenrock with $184,063 per family, while 2-person families (345 | 46.6%) have the highest median income of $33,835 per family member.
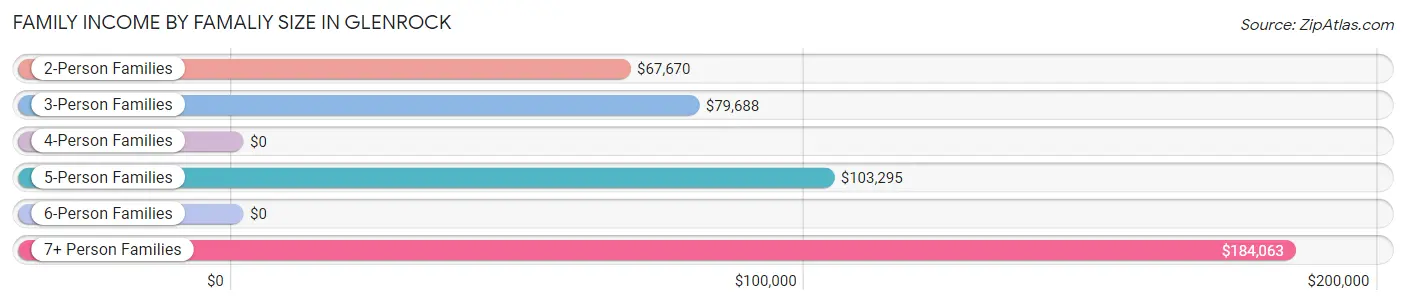
| Income Bracket | # Families | Median Income |
| 2-Person Families | 345 (46.6%) | $67,670 |
| 3-Person Families | 213 (28.8%) | $79,688 |
| 4-Person Families | 73 (9.9%) | $0 |
| 5-Person Families | 64 (8.6%) | $103,295 |
| 6-Person Families | 15 (2.0%) | $0 |
| 7+ Person Families | 30 (4.1%) | $184,063 |
| Total | 740 (100.0%) | $68,409 |
Family Income by Number of Earners in Glenrock
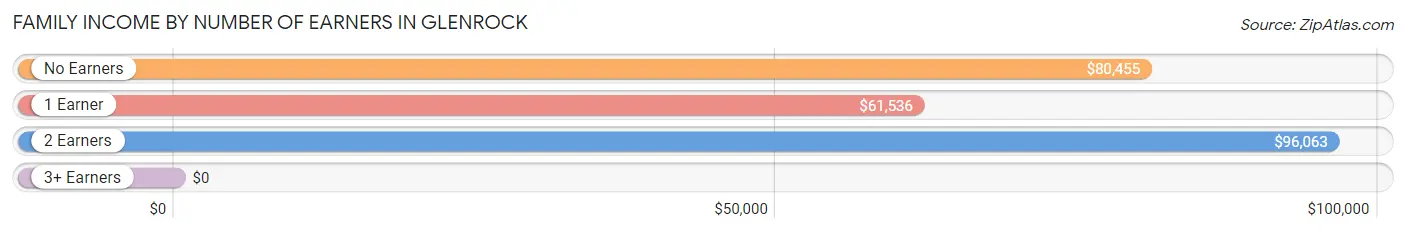
| Number of Earners | # Families | Median Income |
| No Earners | 78 (10.5%) | $80,455 |
| 1 Earner | 333 (45.0%) | $61,536 |
| 2 Earners | 263 (35.5%) | $96,063 |
| 3+ Earners | 66 (8.9%) | $0 |
| Total | 740 (100.0%) | $68,409 |
Household Income in Glenrock
Household Income Brackets in Glenrock
With 234 households falling in the category, the $75,000 to $99,999 income range is the most frequent in Glenrock, accounting for 21.7% of all households. In contrast, only 16 households (1.5%) fall into the $150,000 to $199,999 income bracket, making it the least populous group.
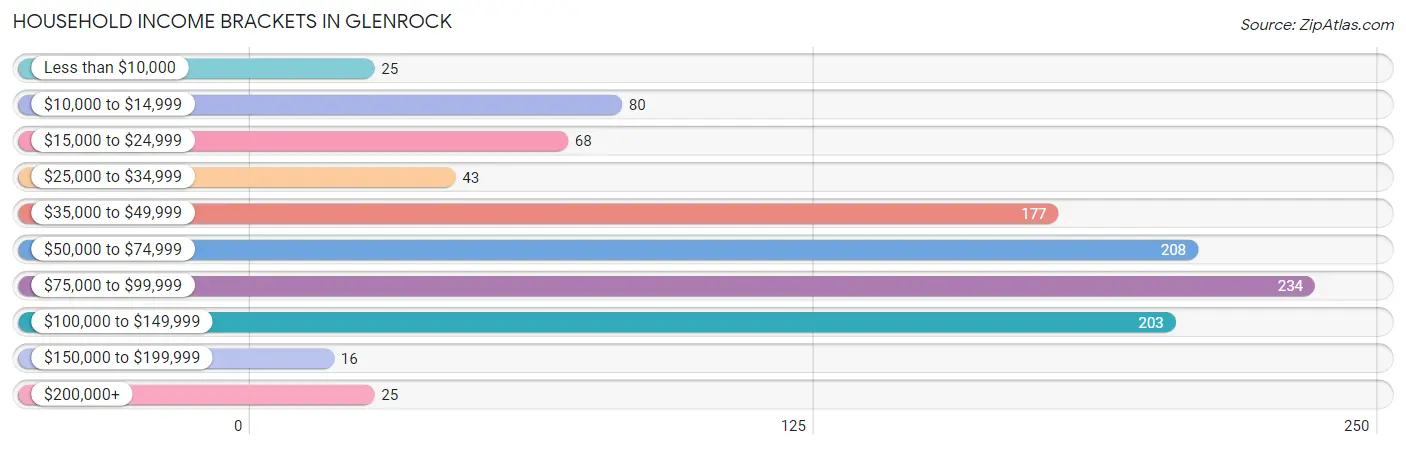
| Income Bracket | # Households | % Households |
| Less than $10,000 | 25 | 2.3% |
| $10,000 to $14,999 | 80 | 7.4% |
| $15,000 to $24,999 | 68 | 6.3% |
| $25,000 to $34,999 | 43 | 4.0% |
| $35,000 to $49,999 | 177 | 16.4% |
| $50,000 to $74,999 | 208 | 19.3% |
| $75,000 to $99,999 | 234 | 21.7% |
| $100,000 to $149,999 | 203 | 18.8% |
| $150,000 to $199,999 | 16 | 1.5% |
| $200,000+ | 25 | 2.3% |
Household Income by Householder Age in Glenrock
The median household income in Glenrock is $64,797, with the highest median household income of $95,313 found in the 25 to 44 years age bracket for the primary householder. A total of 240 households (22.2%) fall into this category. Meanwhile, the 15 to 24 years age bracket for the primary householder has the lowest median household income of $0, with 39 households (3.6%) in this group.
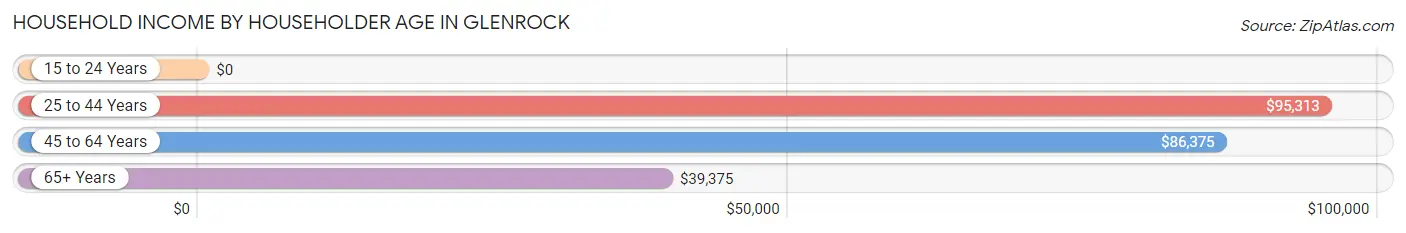
| Income Bracket | # Households | Median Income |
| 15 to 24 Years | 39 (3.6%) | $0 |
| 25 to 44 Years | 240 (22.2%) | $95,313 |
| 45 to 64 Years | 506 (46.9%) | $86,375 |
| 65+ Years | 294 (27.3%) | $39,375 |
| Total | 1,079 (100.0%) | $64,797 |
Poverty in Glenrock
Income Below Poverty by Sex and Age in Glenrock
With 9.7% poverty level for males and 10.6% for females among the residents of Glenrock, 15 year old males and 35 to 44 year old females are the most vulnerable to poverty, with 25 males (49.0%) and 41 females (26.8%) in their respective age groups living below the poverty level.
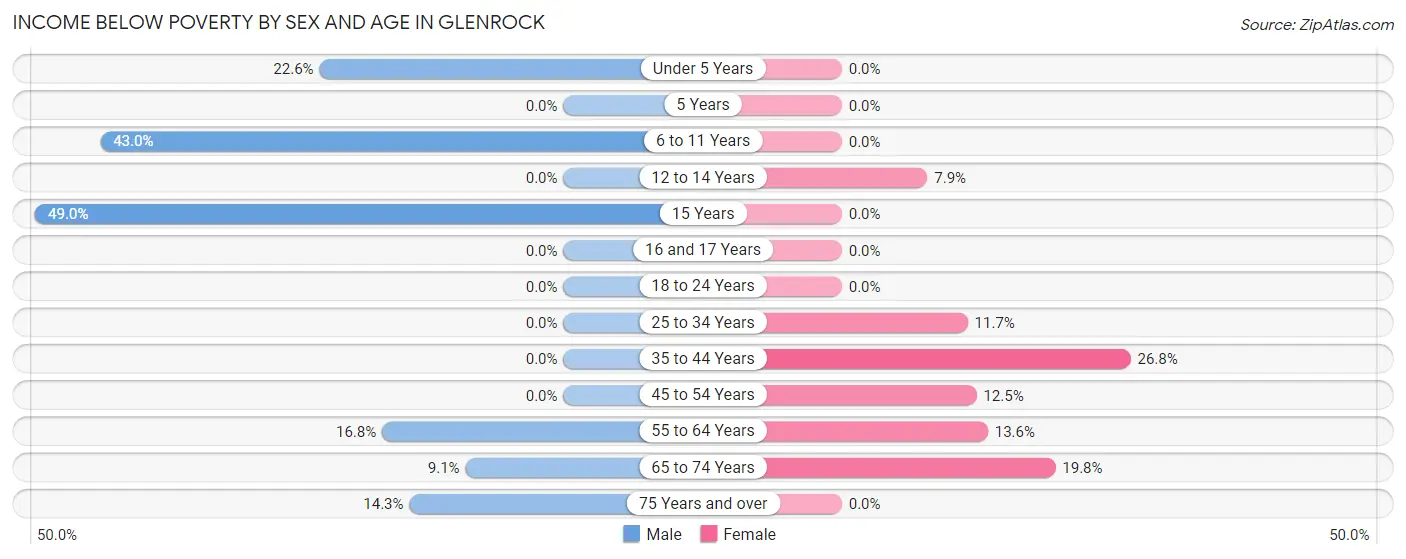
| Age Bracket | Male | Female |
| Under 5 Years | 12 (22.6%) | 0 (0.0%) |
| 5 Years | 0 (0.0%) | 0 (0.0%) |
| 6 to 11 Years | 49 (43.0%) | 0 (0.0%) |
| 12 to 14 Years | 0 (0.0%) | 10 (7.9%) |
| 15 Years | 25 (49.0%) | 0 (0.0%) |
| 16 and 17 Years | 0 (0.0%) | 0 (0.0%) |
| 18 to 24 Years | 0 (0.0%) | 0 (0.0%) |
| 25 to 34 Years | 0 (0.0%) | 16 (11.7%) |
| 35 to 44 Years | 0 (0.0%) | 41 (26.8%) |
| 45 to 54 Years | 0 (0.0%) | 26 (12.5%) |
| 55 to 64 Years | 35 (16.8%) | 29 (13.6%) |
| 65 to 74 Years | 11 (9.1%) | 22 (19.8%) |
| 75 Years and over | 14 (14.3%) | 0 (0.0%) |
| Total | 146 (9.7%) | 144 (10.6%) |
Income Above Poverty by Sex and Age in Glenrock
According to the poverty statistics in Glenrock, males aged 5 years and females aged under 5 years are the age groups that are most secure financially, with 100.0% of males and 100.0% of females in these age groups living above the poverty line.
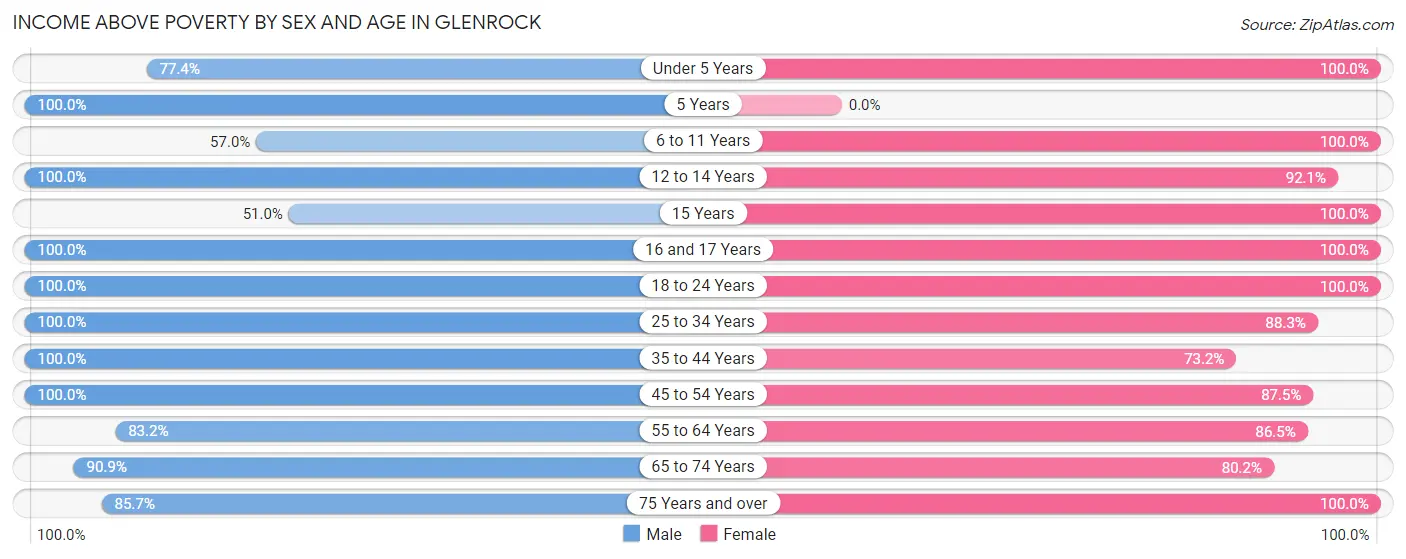
| Age Bracket | Male | Female |
| Under 5 Years | 41 (77.4%) | 87 (100.0%) |
| 5 Years | 17 (100.0%) | 0 (0.0%) |
| 6 to 11 Years | 65 (57.0%) | 102 (100.0%) |
| 12 to 14 Years | 63 (100.0%) | 116 (92.1%) |
| 15 Years | 26 (51.0%) | 14 (100.0%) |
| 16 and 17 Years | 96 (100.0%) | 11 (100.0%) |
| 18 to 24 Years | 246 (100.0%) | 102 (100.0%) |
| 25 to 34 Years | 111 (100.0%) | 121 (88.3%) |
| 35 to 44 Years | 100 (100.0%) | 112 (73.2%) |
| 45 to 54 Years | 227 (100.0%) | 182 (87.5%) |
| 55 to 64 Years | 173 (83.2%) | 185 (86.5%) |
| 65 to 74 Years | 110 (90.9%) | 89 (80.2%) |
| 75 Years and over | 84 (85.7%) | 93 (100.0%) |
| Total | 1,359 (90.3%) | 1,214 (89.4%) |
Income Below Poverty Among Married-Couple Families in Glenrock
The poverty statistics for married-couple families in Glenrock show that 4.9% or 26 of the total 535 families live below the poverty line. Families with no children have the highest poverty rate of 8.0%, comprising of 26 families. On the other hand, families with 1 or 2 children have the lowest poverty rate of 0.0%, which includes 0 families.
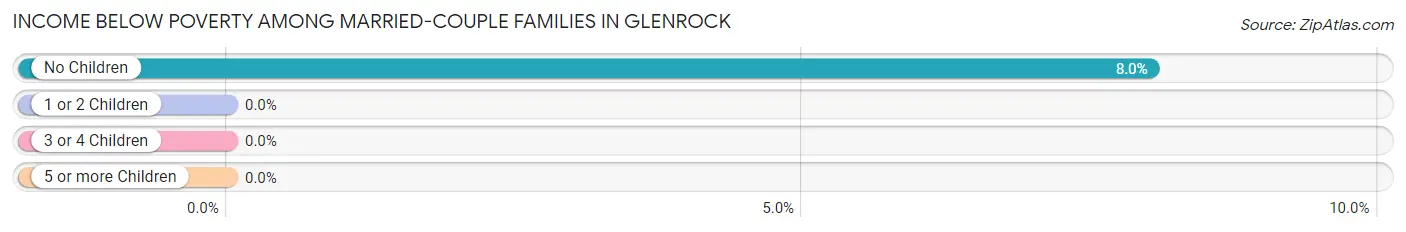
| Children | Above Poverty | Below Poverty |
| No Children | 298 (92.0%) | 26 (8.0%) |
| 1 or 2 Children | 159 (100.0%) | 0 (0.0%) |
| 3 or 4 Children | 47 (100.0%) | 0 (0.0%) |
| 5 or more Children | 5 (100.0%) | 0 (0.0%) |
| Total | 509 (95.1%) | 26 (4.9%) |
Income Below Poverty Among Single-Parent Households in Glenrock
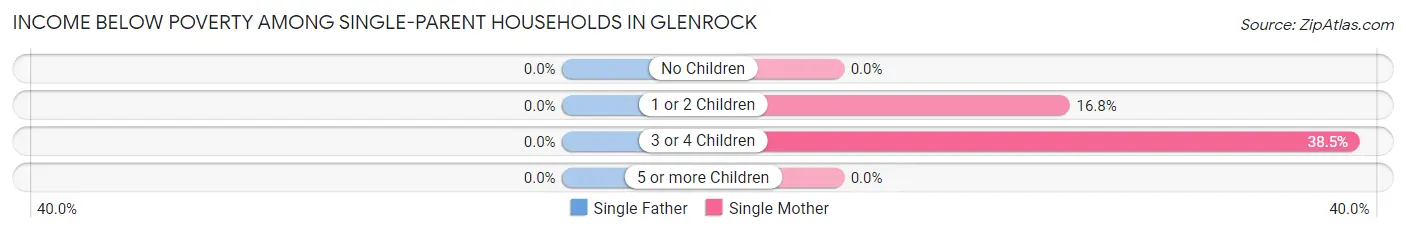
| Children | Single Father | Single Mother |
| No Children | 0 (0.0%) | 0 (0.0%) |
| 1 or 2 Children | 0 (0.0%) | 17 (16.8%) |
| 3 or 4 Children | 0 (0.0%) | 10 (38.5%) |
| 5 or more Children | 0 (0.0%) | 0 (0.0%) |
| Total | 0 (0.0%) | 27 (21.3%) |
Income Below Poverty Among Married-Couple vs Single-Parent Households in Glenrock
The poverty data for Glenrock shows that 26 of the married-couple family households (4.9%) and 27 of the single-parent households (13.2%) are living below the poverty level. Within the married-couple family households, those with no children have the highest poverty rate, with 26 households (8.0%) falling below the poverty line. Among the single-parent households, those with 3 or 4 children have the highest poverty rate, with 10 household (38.5%) living below poverty.
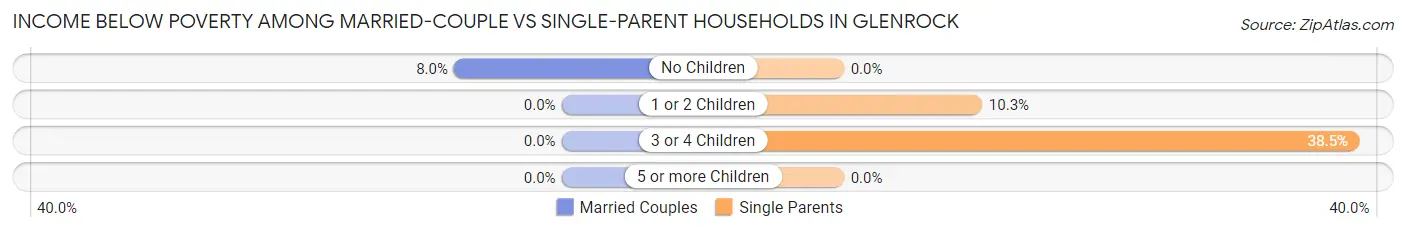
| Children | Married-Couple Families | Single-Parent Households |
| No Children | 26 (8.0%) | 0 (0.0%) |
| 1 or 2 Children | 0 (0.0%) | 17 (10.3%) |
| 3 or 4 Children | 0 (0.0%) | 10 (38.5%) |
| 5 or more Children | 0 (0.0%) | 0 (0.0%) |
| Total | 26 (4.9%) | 27 (13.2%) |
Race in Glenrock
The most populous races in Glenrock are White / Caucasian (2,688 | 93.9%), Two or more Races (175 | 6.1%), and Hispanic or Latino (108 | 3.8%).
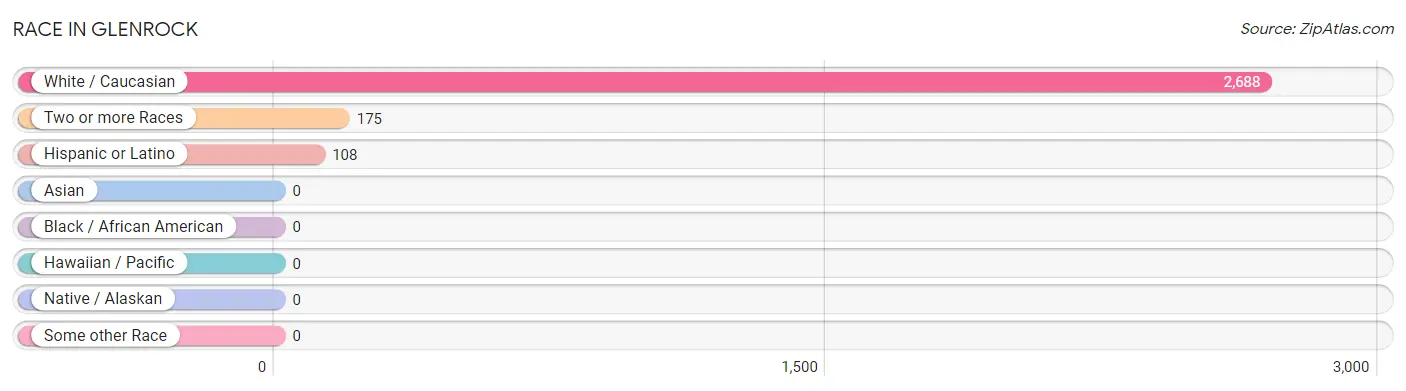
| Race | # Population | % Population |
| Asian | 0 | 0.0% |
| Black / African American | 0 | 0.0% |
| Hawaiian / Pacific | 0 | 0.0% |
| Hispanic or Latino | 108 | 3.8% |
| Native / Alaskan | 0 | 0.0% |
| White / Caucasian | 2,688 | 93.9% |
| Two or more Races | 175 | 6.1% |
| Some other Race | 0 | 0.0% |
| Total | 2,863 | 100.0% |
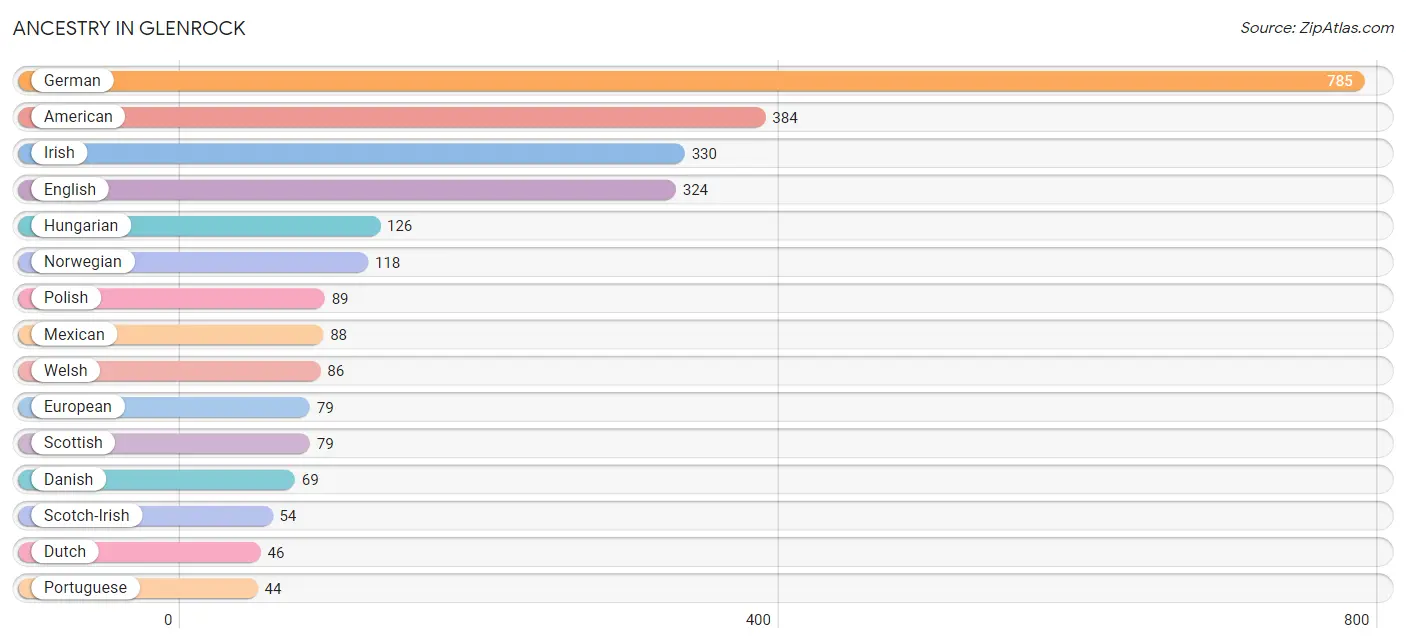
Ancestry in Glenrock
The most populous ancestries reported in Glenrock are German (785 | 27.4%), American (384 | 13.4%), Irish (330 | 11.5%), English (324 | 11.3%), and Hungarian (126 | 4.4%), together accounting for 68.1% of all Glenrock residents.
| Ancestry | # Population | % Population |
| African | 24 | 0.8% |
| American | 384 | 13.4% |
| Celtic | 5 | 0.2% |
| Central American | 20 | 0.7% |
| Czech | 32 | 1.1% |
| Danish | 69 | 2.4% |
| Dutch | 46 | 1.6% |
| English | 324 | 11.3% |
| European | 79 | 2.8% |
| French | 28 | 1.0% |
| French Canadian | 36 | 1.3% |
| German | 785 | 27.4% |
| Hungarian | 126 | 4.4% |
| Irish | 330 | 11.5% |
| Italian | 36 | 1.3% |
| Lithuanian | 9 | 0.3% |
| Mexican | 88 | 3.1% |
| Norwegian | 118 | 4.1% |
| Polish | 89 | 3.1% |
| Portuguese | 44 | 1.5% |
| Salvadoran | 20 | 0.7% |
| Scotch-Irish | 54 | 1.9% |
| Scottish | 79 | 2.8% |
| Slovene | 5 | 0.2% |
| Subsaharan African | 24 | 0.8% |
| Swedish | 38 | 1.3% |
| Welsh | 86 | 3.0% | View All 27 Rows |
Immigrants in Glenrock
The most numerous immigrant groups reported in Glenrock came from Central America (44 | 1.5%), Latin America (44 | 1.5%), Mexico (44 | 1.5%), Europe (23 | 0.8%), and Italy (23 | 0.8%), together accounting for 6.2% of all Glenrock residents.
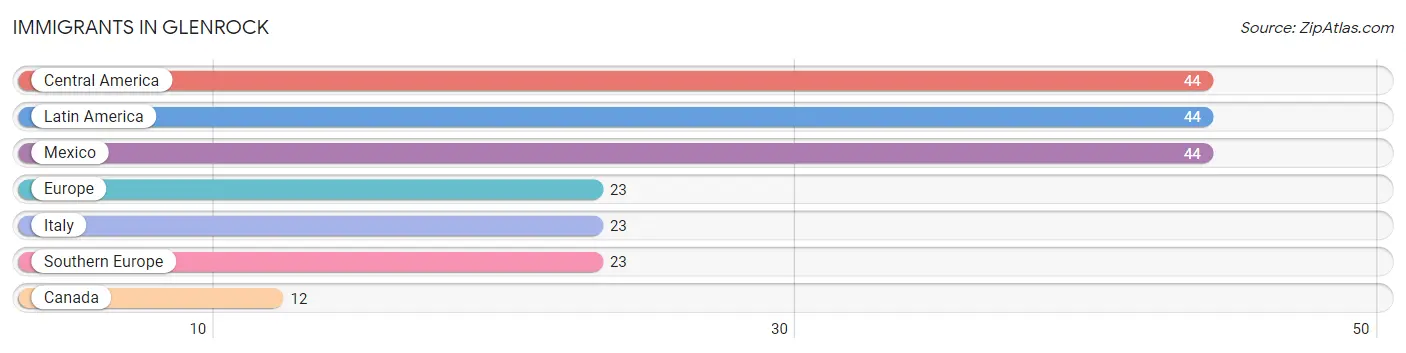
| Immigration Origin | # Population | % Population |
| Canada | 12 | 0.4% |
| Central America | 44 | 1.5% |
| Europe | 23 | 0.8% |
| Italy | 23 | 0.8% |
| Latin America | 44 | 1.5% |
| Mexico | 44 | 1.5% |
| Southern Europe | 23 | 0.8% | View All 7 Rows |
Sex and Age in Glenrock
Sex and Age in Glenrock
The most populous age groups in Glenrock are 15 to 19 Years (244 | 16.2%) for men and 10 to 14 Years (203 | 14.9%) for women.
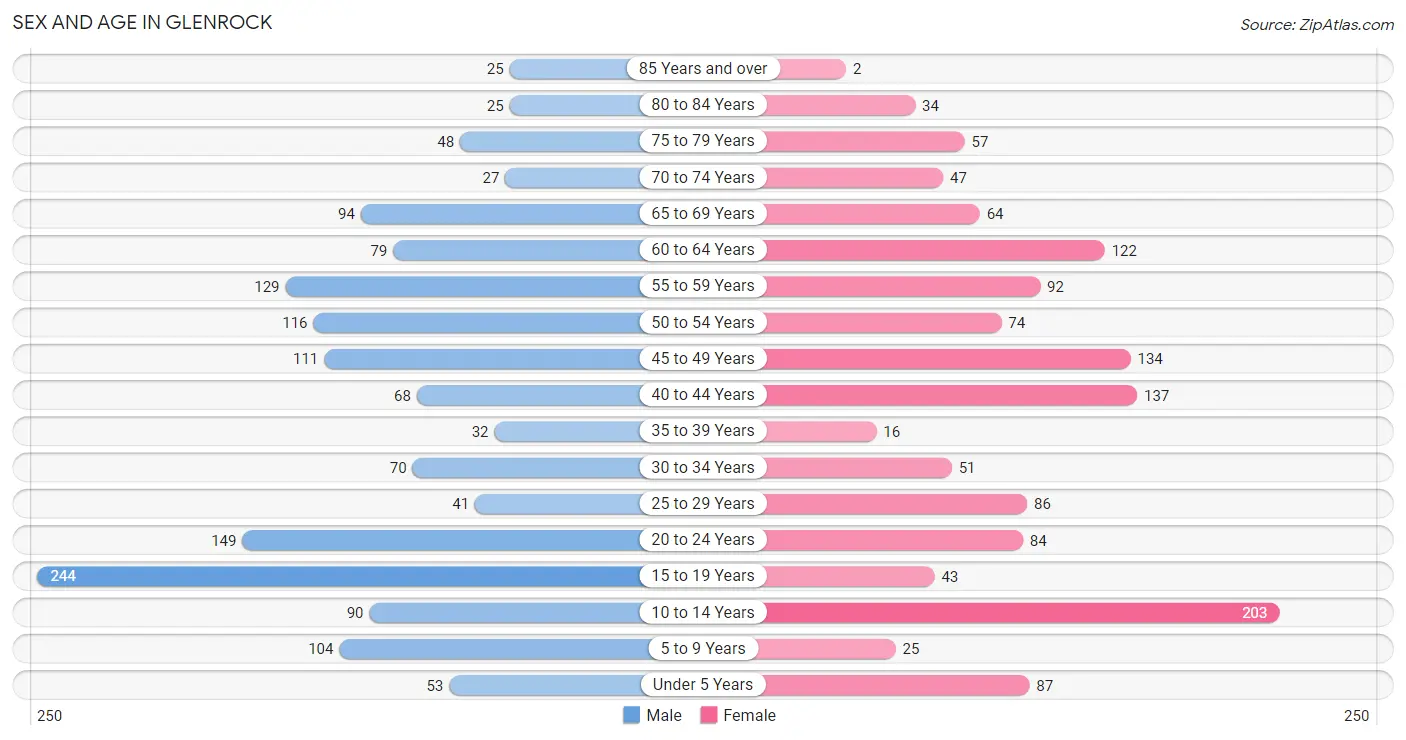
| Age Bracket | Male | Female |
| Under 5 Years | 53 (3.5%) | 87 (6.4%) |
| 5 to 9 Years | 104 (6.9%) | 25 (1.8%) |
| 10 to 14 Years | 90 (6.0%) | 203 (14.9%) |
| 15 to 19 Years | 244 (16.2%) | 43 (3.2%) |
| 20 to 24 Years | 149 (9.9%) | 84 (6.2%) |
| 25 to 29 Years | 41 (2.7%) | 86 (6.3%) |
| 30 to 34 Years | 70 (4.6%) | 51 (3.8%) |
| 35 to 39 Years | 32 (2.1%) | 16 (1.2%) |
| 40 to 44 Years | 68 (4.5%) | 137 (10.1%) |
| 45 to 49 Years | 111 (7.4%) | 134 (9.9%) |
| 50 to 54 Years | 116 (7.7%) | 74 (5.4%) |
| 55 to 59 Years | 129 (8.6%) | 92 (6.8%) |
| 60 to 64 Years | 79 (5.2%) | 122 (9.0%) |
| 65 to 69 Years | 94 (6.2%) | 64 (4.7%) |
| 70 to 74 Years | 27 (1.8%) | 47 (3.5%) |
| 75 to 79 Years | 48 (3.2%) | 57 (4.2%) |
| 80 to 84 Years | 25 (1.7%) | 34 (2.5%) |
| 85 Years and over | 25 (1.7%) | 2 (0.2%) |
| Total | 1,505 (100.0%) | 1,358 (100.0%) |
Families and Households in Glenrock
Median Family Size in Glenrock
The median family size in Glenrock is 3.08 persons per family, with single female/mother families (127 | 17.2%) accounting for the largest median family size of 3.55 persons per family. On the other hand, single male/father families (78 | 10.5%) represent the smallest median family size with 2.15 persons per family.
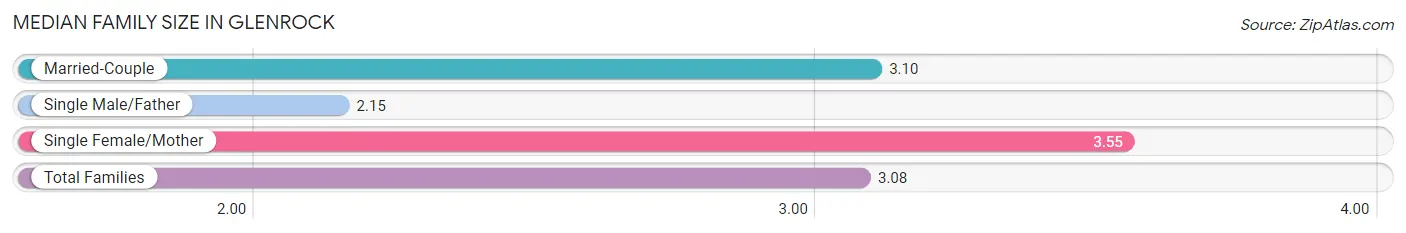
| Family Type | # Families | Family Size |
| Married-Couple | 535 (72.3%) | 3.10 |
| Single Male/Father | 78 (10.5%) | 2.15 |
| Single Female/Mother | 127 (17.2%) | 3.55 |
| Total Families | 740 (100.0%) | 3.08 |
Median Household Size in Glenrock
The median household size in Glenrock is 2.65 persons per household, with single female/mother households (127 | 11.8%) accounting for the largest median household size of 4.15 persons per household. non-family households (339 | 31.4%) represent the smallest median household size with 1.34 persons per household.
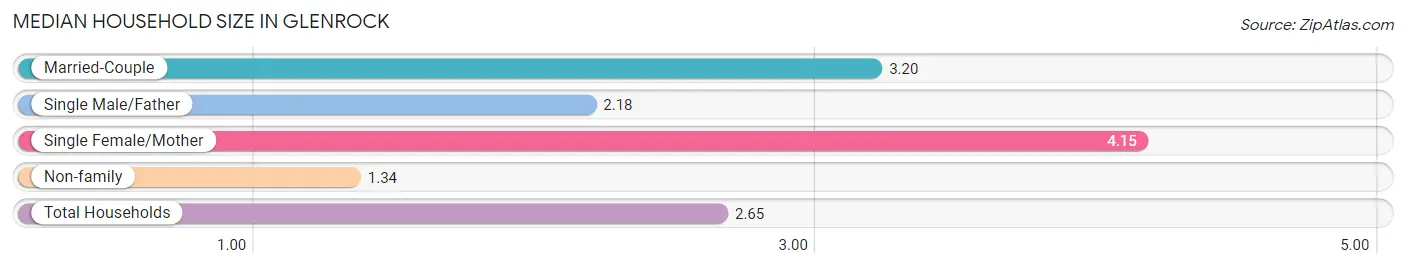
| Household Type | # Households | Household Size |
| Married-Couple | 535 (49.6%) | 3.20 |
| Single Male/Father | 78 (7.2%) | 2.18 |
| Single Female/Mother | 127 (11.8%) | 4.15 |
| Non-family | 339 (31.4%) | 1.34 |
| Total Households | 1,079 (100.0%) | 2.65 |
Household Size by Marriage Status in Glenrock
Out of a total of 1,079 households in Glenrock, 740 (68.6%) are family households, while 339 (31.4%) are nonfamily households. The most numerous type of family households are 2-person households, comprising 342, and the most common type of nonfamily households are 1-person households, comprising 246.
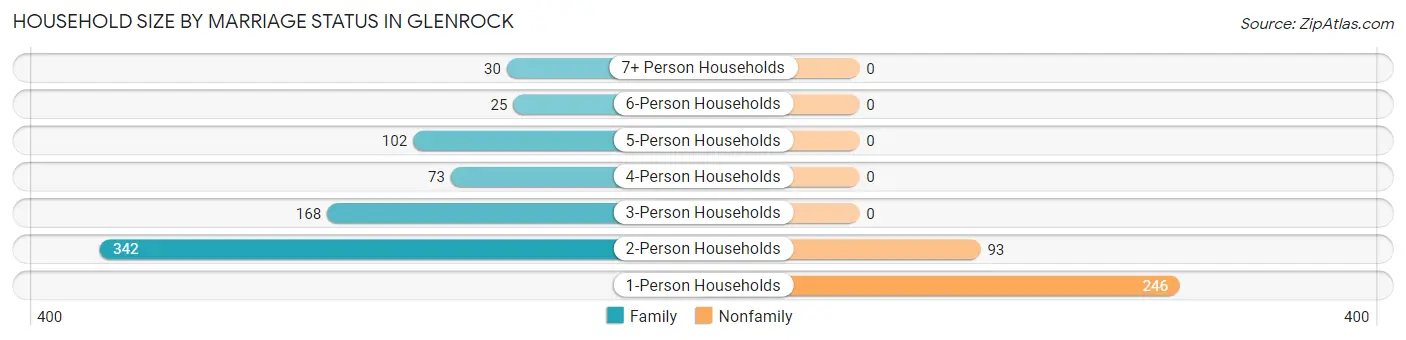
| Household Size | Family Households | Nonfamily Households |
| 1-Person Households | - | 246 (22.8%) |
| 2-Person Households | 342 (31.7%) | 93 (8.6%) |
| 3-Person Households | 168 (15.6%) | 0 (0.0%) |
| 4-Person Households | 73 (6.8%) | 0 (0.0%) |
| 5-Person Households | 102 (9.5%) | 0 (0.0%) |
| 6-Person Households | 25 (2.3%) | 0 (0.0%) |
| 7+ Person Households | 30 (2.8%) | 0 (0.0%) |
| Total | 740 (68.6%) | 339 (31.4%) |
Female Fertility in Glenrock
Fertility by Age in Glenrock
Average fertility rate in Glenrock is 147.0 births per 1,000 women. Women in the age bracket of 15 to 19 years have the highest fertility rate with 419.0 births per 1,000 women. Women in the age bracket of 20 to 34 years acount for 77.8% of all women with births.
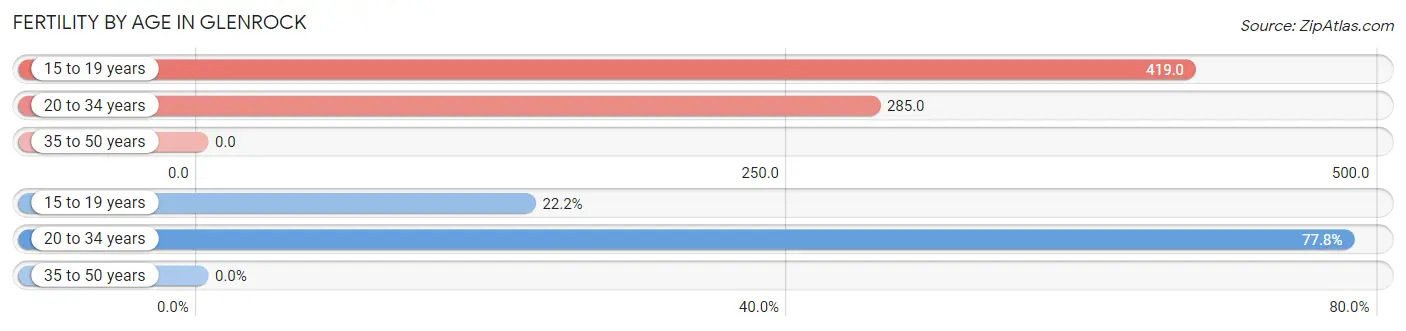
| Age Bracket | Women with Births | Births / 1,000 Women |
| 15 to 19 years | 18 (22.2%) | 419.0 |
| 20 to 34 years | 63 (77.8%) | 285.0 |
| 35 to 50 years | 0 (0.0%) | 0.0 |
| Total | 81 (100.0%) | 147.0 |
Fertility by Age by Marriage Status in Glenrock
70.4% of women with births (81) in Glenrock are married. The highest percentage of unmarried women with births falls into 15 to 19 years age bracket with 100.0% of them unmarried at the time of birth, while the lowest percentage of unmarried women with births belong to 20 to 34 years age bracket with 9.5% of them unmarried.
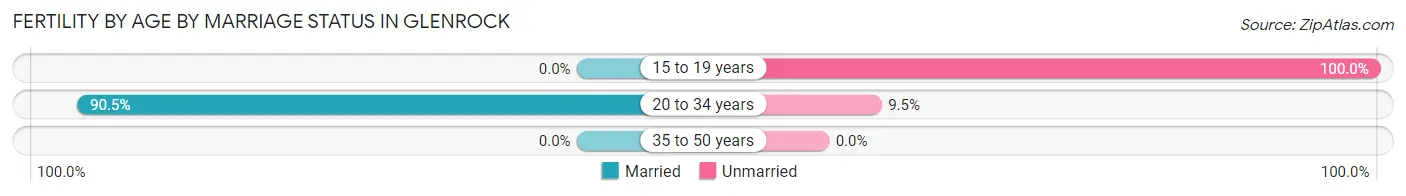
| Age Bracket | Married | Unmarried |
| 15 to 19 years | 0 (0.0%) | 18 (100.0%) |
| 20 to 34 years | 57 (90.5%) | 6 (9.5%) |
| 35 to 50 years | 0 (0.0%) | 0 (0.0%) |
| Total | 57 (70.4%) | 24 (29.6%) |
Fertility by Education in Glenrock
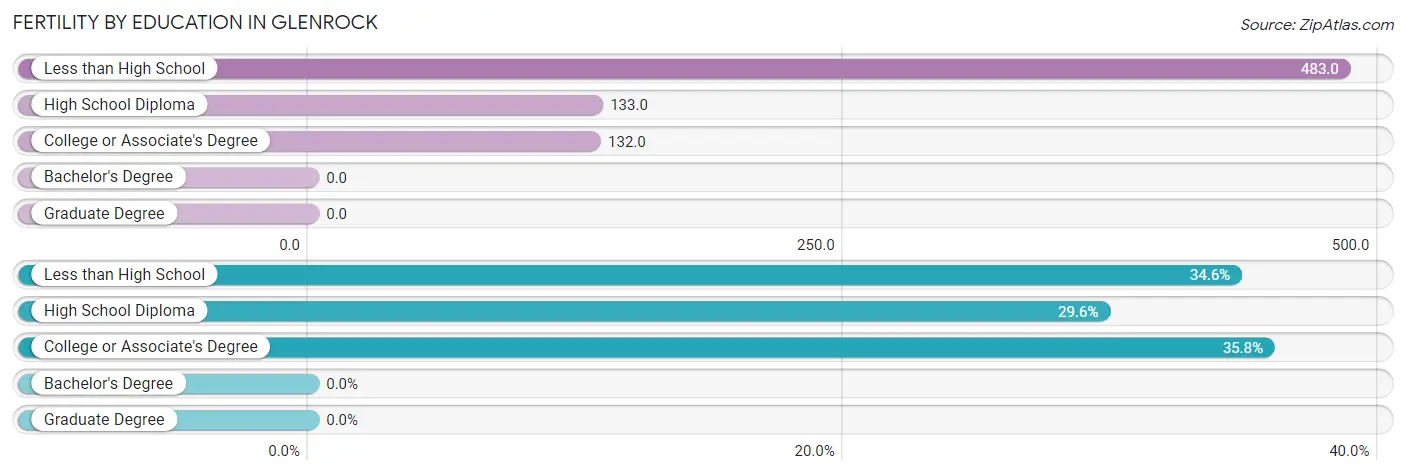
| Educational Attainment | Women with Births | Births / 1,000 Women |
| Less than High School | 28 (34.6%) | 483.0 |
| High School Diploma | 24 (29.6%) | 133.0 |
| College or Associate's Degree | 29 (35.8%) | 132.0 |
| Bachelor's Degree | 0 (0.0%) | 0.0 |
| Graduate Degree | 0 (0.0%) | 0.0 |
| Total | 81 (100.0%) | 147.0 |
Fertility by Education by Marriage Status in Glenrock
29.6% of women with births in Glenrock are unmarried. Women with the educational attainment of less than high school are most likely to be married with 100.0% of them married at childbirth, while women with the educational attainment of high school diploma are least likely to be married with 100.0% of them unmarried at childbirth.
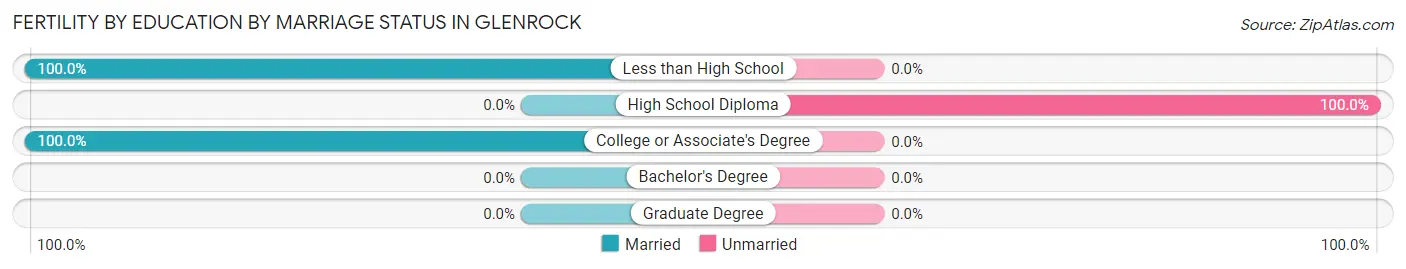
| Educational Attainment | Married | Unmarried |
| Less than High School | 28 (100.0%) | 0 (0.0%) |
| High School Diploma | 0 (0.0%) | 24 (100.0%) |
| College or Associate's Degree | 29 (100.0%) | 0 (0.0%) |
| Bachelor's Degree | 0 (0.0%) | 0 (0.0%) |
| Graduate Degree | 0 (0.0%) | 0 (0.0%) |
| Total | 57 (70.4%) | 24 (29.6%) |
Employment Characteristics in Glenrock
Employment by Class of Employer in Glenrock
Among the 1,347 employed individuals in Glenrock, private company employees (851 | 63.2%), local government employees (188 | 14.0%), and self-employed (not incorporated) (103 | 7.6%) make up the most common classes of employment.
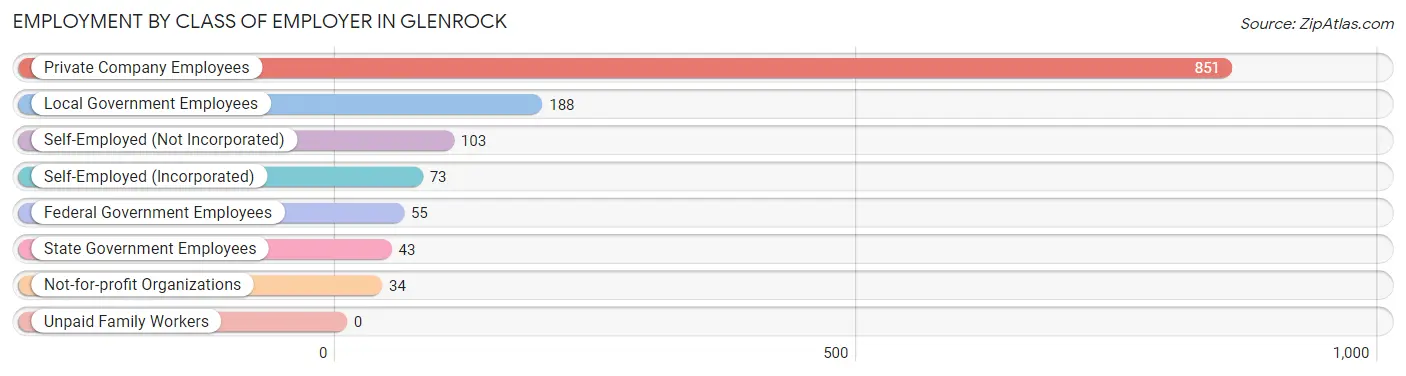
| Employer Class | # Employees | % Employees |
| Private Company Employees | 851 | 63.2% |
| Self-Employed (Incorporated) | 73 | 5.4% |
| Self-Employed (Not Incorporated) | 103 | 7.6% |
| Not-for-profit Organizations | 34 | 2.5% |
| Local Government Employees | 188 | 14.0% |
| State Government Employees | 43 | 3.2% |
| Federal Government Employees | 55 | 4.1% |
| Unpaid Family Workers | 0 | 0.0% |
| Total | 1,347 | 100.0% |
Employment Status by Age in Glenrock
According to the labor force statistics for Glenrock, out of the total population over 16 years of age (2,236), 66.3% or 1,482 individuals are in the labor force, with 9.3% or 138 of them unemployed. The age group with the highest labor force participation rate is 30 to 34 years, with 100.0% or 121 individuals in the labor force. Within the labor force, the 16 to 19 years age range has the highest percentage of unemployed individuals, with 60.3% or 90 of them being unemployed.
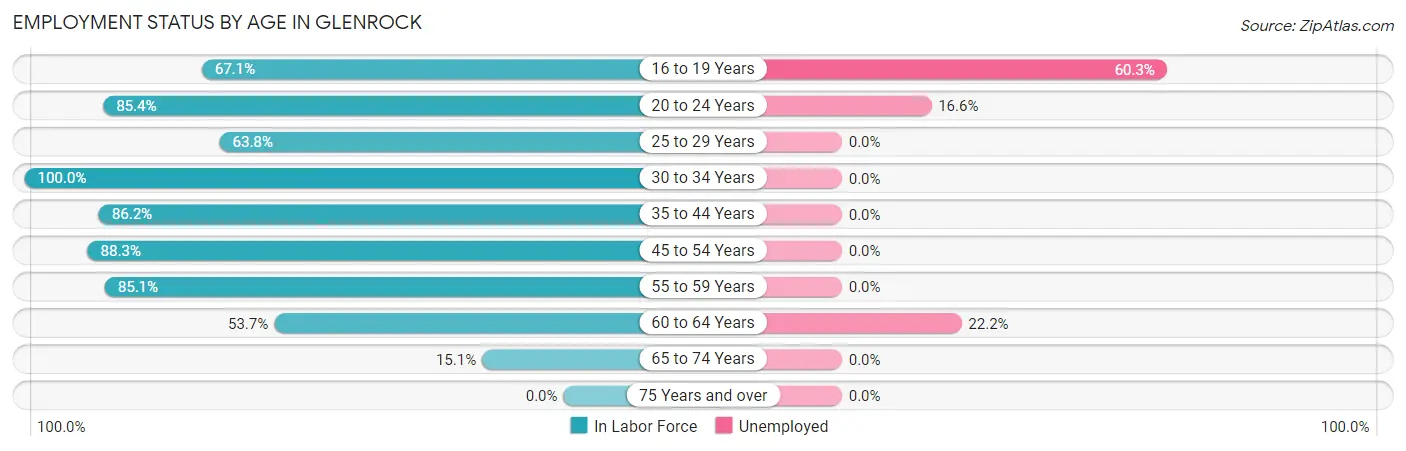
| Age Bracket | In Labor Force | Unemployed |
| 16 to 19 Years | 149 (67.1%) | 90 (60.3%) |
| 20 to 24 Years | 199 (85.4%) | 33 (16.6%) |
| 25 to 29 Years | 81 (63.8%) | 0 (0.0%) |
| 30 to 34 Years | 121 (100.0%) | 0 (0.0%) |
| 35 to 44 Years | 218 (86.2%) | 0 (0.0%) |
| 45 to 54 Years | 384 (88.3%) | 0 (0.0%) |
| 55 to 59 Years | 188 (85.1%) | 0 (0.0%) |
| 60 to 64 Years | 108 (53.7%) | 24 (22.2%) |
| 65 to 74 Years | 35 (15.1%) | 0 (0.0%) |
| 75 Years and over | 0 (0.0%) | 0 (0.0%) |
| Total | 1,482 (66.3%) | 138 (9.3%) |
Employment Status by Educational Attainment in Glenrock
According to labor force statistics for Glenrock, 81.0% of individuals (1,100) out of the total population between 25 and 64 years of age (1,358) are in the labor force, with 2.2% or 24 of them being unemployed. The group with the highest labor force participation rate are those with the educational attainment of bachelor's degree or higher, with 94.9% or 203 individuals in the labor force. Within the labor force, individuals with bachelor's degree or higher education have the highest percentage of unemployment, with 11.8% or 24 of them being unemployed.
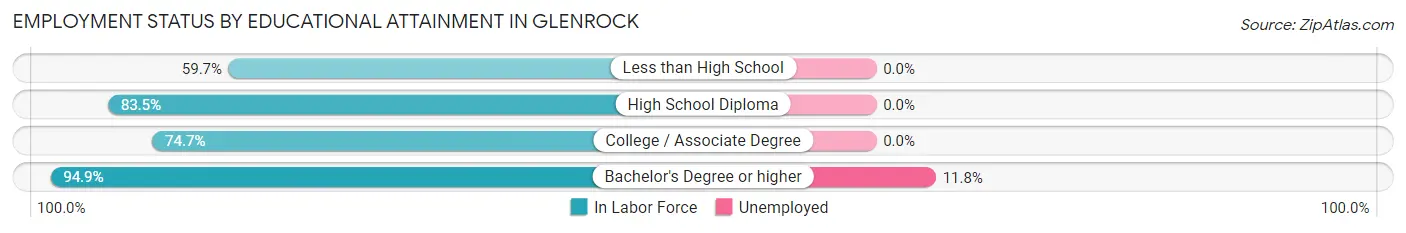
| Educational Attainment | In Labor Force | Unemployed |
| Less than High School | 43 (59.7%) | 0 (0.0%) |
| High School Diploma | 502 (83.5%) | 0 (0.0%) |
| College / Associate Degree | 352 (74.7%) | 0 (0.0%) |
| Bachelor's Degree or higher | 203 (94.9%) | 25 (11.8%) |
| Total | 1,100 (81.0%) | 30 (2.2%) |
Employment Occupations by Sex in Glenrock
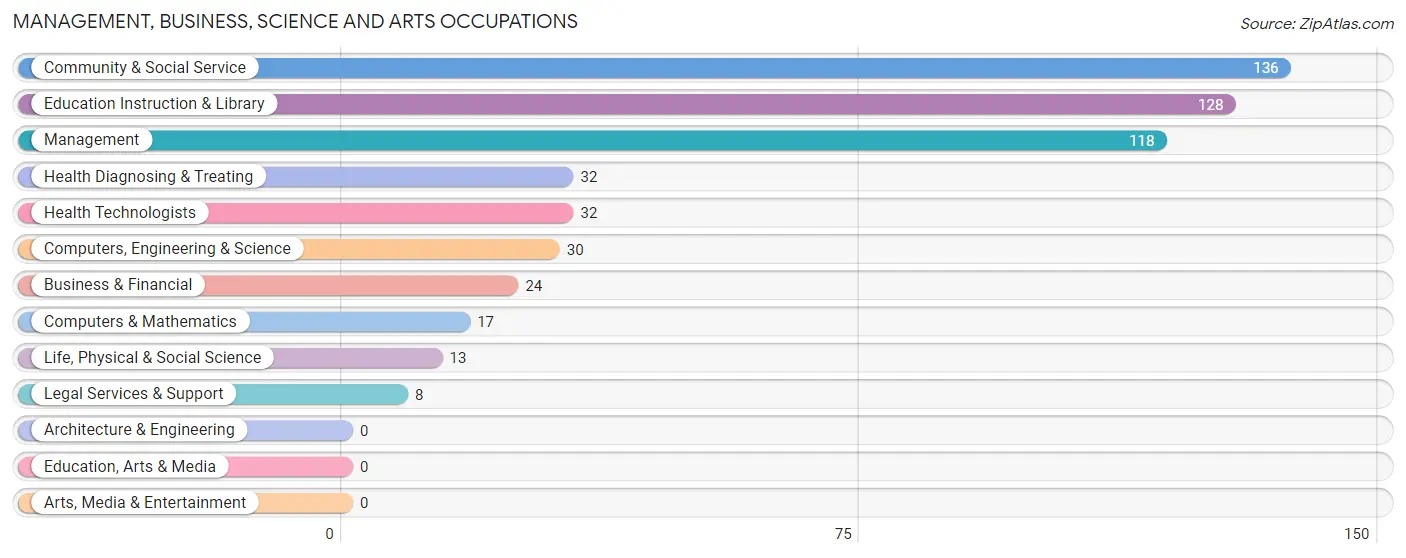
Management, Business, Science and Arts Occupations
The most common Management, Business, Science and Arts occupations in Glenrock are Community & Social Service (136 | 10.2%), Education Instruction & Library (128 | 9.6%), Management (118 | 8.9%), Health Diagnosing & Treating (32 | 2.4%), and Health Technologists (32 | 2.4%).
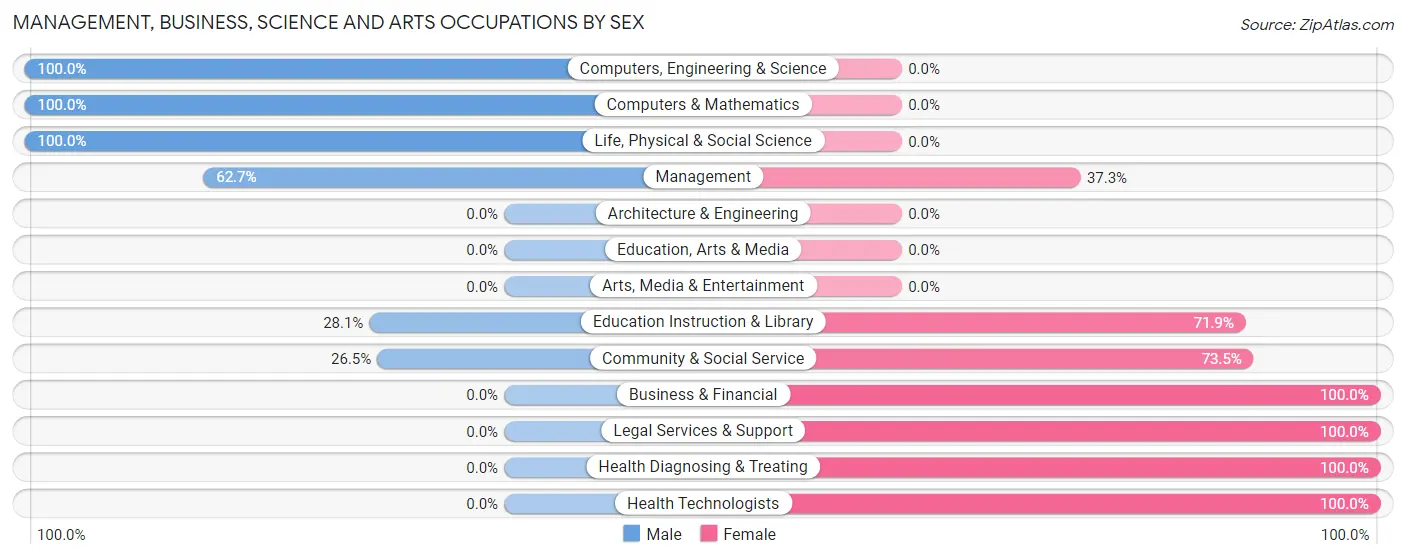
Management, Business, Science and Arts Occupations by Sex
Within the Management, Business, Science and Arts occupations in Glenrock, the most male-oriented occupations are Computers, Engineering & Science (100.0%), Computers & Mathematics (100.0%), and Life, Physical & Social Science (100.0%), while the most female-oriented occupations are Business & Financial (100.0%), Legal Services & Support (100.0%), and Health Diagnosing & Treating (100.0%).
| Occupation | Male | Female |
| Management | 74 (62.7%) | 44 (37.3%) |
| Business & Financial | 0 (0.0%) | 24 (100.0%) |
| Computers, Engineering & Science | 30 (100.0%) | 0 (0.0%) |
| Computers & Mathematics | 17 (100.0%) | 0 (0.0%) |
| Architecture & Engineering | 0 (0.0%) | 0 (0.0%) |
| Life, Physical & Social Science | 13 (100.0%) | 0 (0.0%) |
| Community & Social Service | 36 (26.5%) | 100 (73.5%) |
| Education, Arts & Media | 0 (0.0%) | 0 (0.0%) |
| Legal Services & Support | 0 (0.0%) | 8 (100.0%) |
| Education Instruction & Library | 36 (28.1%) | 92 (71.9%) |
| Arts, Media & Entertainment | 0 (0.0%) | 0 (0.0%) |
| Health Diagnosing & Treating | 0 (0.0%) | 32 (100.0%) |
| Health Technologists | 0 (0.0%) | 32 (100.0%) |
| Total (Category) | 140 (41.2%) | 200 (58.8%) |
| Total (Overall) | 789 (59.4%) | 540 (40.6%) |
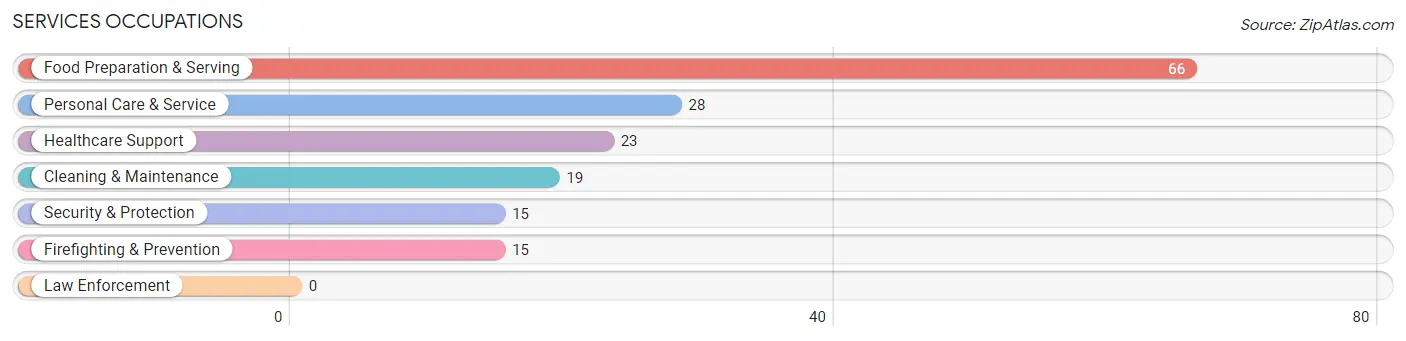
Services Occupations
The most common Services occupations in Glenrock are Food Preparation & Serving (66 | 5.0%), Personal Care & Service (28 | 2.1%), Healthcare Support (23 | 1.7%), Cleaning & Maintenance (19 | 1.4%), and Security & Protection (15 | 1.1%).
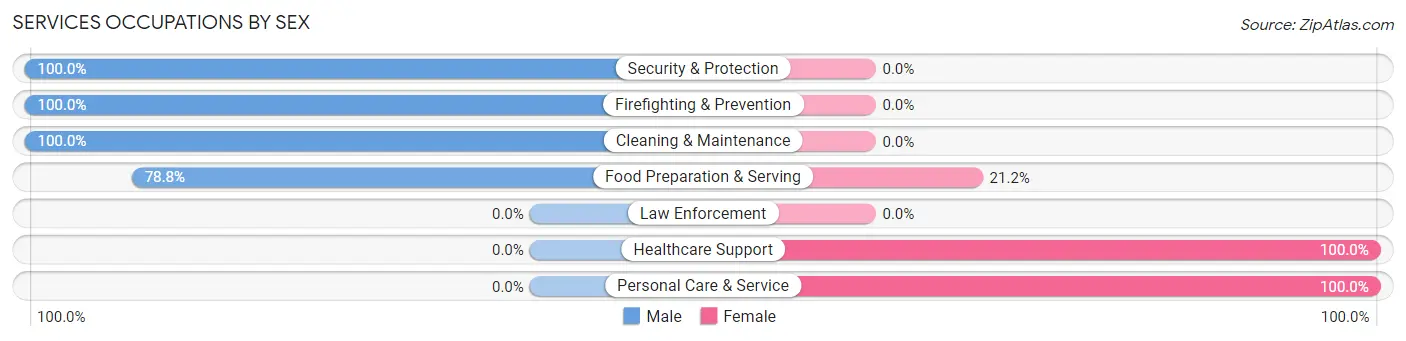
Services Occupations by Sex
Within the Services occupations in Glenrock, the most male-oriented occupations are Security & Protection (100.0%), Firefighting & Prevention (100.0%), and Cleaning & Maintenance (100.0%), while the most female-oriented occupations are Healthcare Support (100.0%), Personal Care & Service (100.0%), and Food Preparation & Serving (21.2%).
| Occupation | Male | Female |
| Healthcare Support | 0 (0.0%) | 23 (100.0%) |
| Security & Protection | 15 (100.0%) | 0 (0.0%) |
| Firefighting & Prevention | 15 (100.0%) | 0 (0.0%) |
| Law Enforcement | 0 (0.0%) | 0 (0.0%) |
| Food Preparation & Serving | 52 (78.8%) | 14 (21.2%) |
| Cleaning & Maintenance | 19 (100.0%) | 0 (0.0%) |
| Personal Care & Service | 0 (0.0%) | 28 (100.0%) |
| Total (Category) | 86 (57.0%) | 65 (43.0%) |
| Total (Overall) | 789 (59.4%) | 540 (40.6%) |
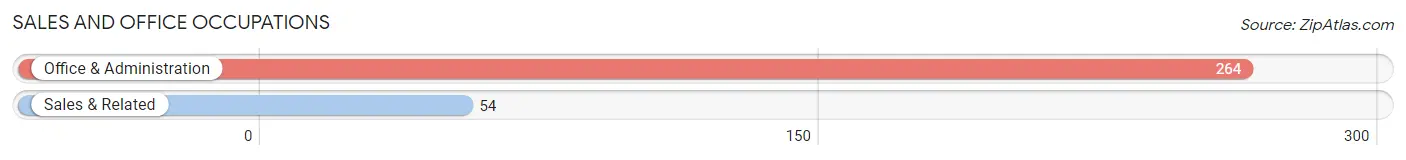
Sales and Office Occupations
The most common Sales and Office occupations in Glenrock are Office & Administration (264 | 19.9%), and Sales & Related (54 | 4.1%).
Sales and Office Occupations by Sex
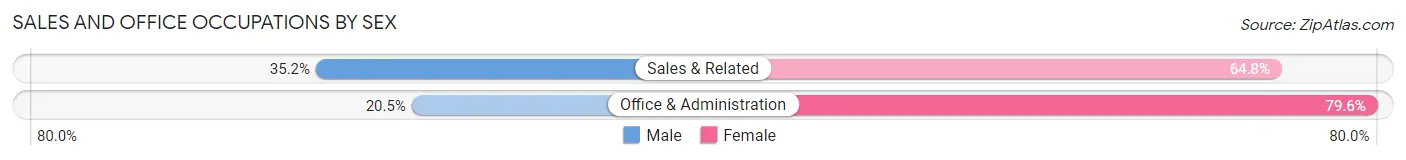
| Occupation | Male | Female |
| Sales & Related | 19 (35.2%) | 35 (64.8%) |
| Office & Administration | 54 (20.4%) | 210 (79.5%) |
| Total (Category) | 73 (23.0%) | 245 (77.0%) |
| Total (Overall) | 789 (59.4%) | 540 (40.6%) |
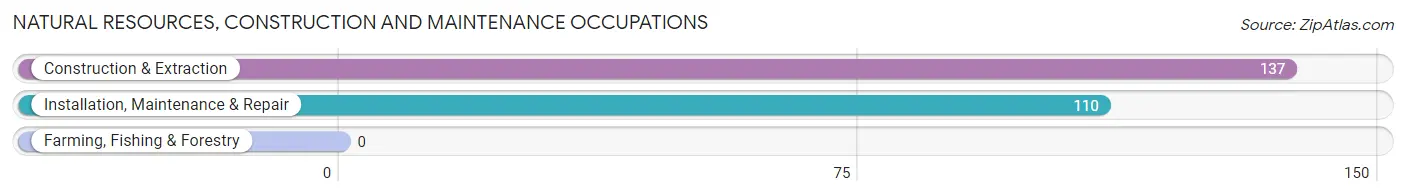
Natural Resources, Construction and Maintenance Occupations
The most common Natural Resources, Construction and Maintenance occupations in Glenrock are Construction & Extraction (137 | 10.3%), and Installation, Maintenance & Repair (110 | 8.3%).
Natural Resources, Construction and Maintenance Occupations by Sex
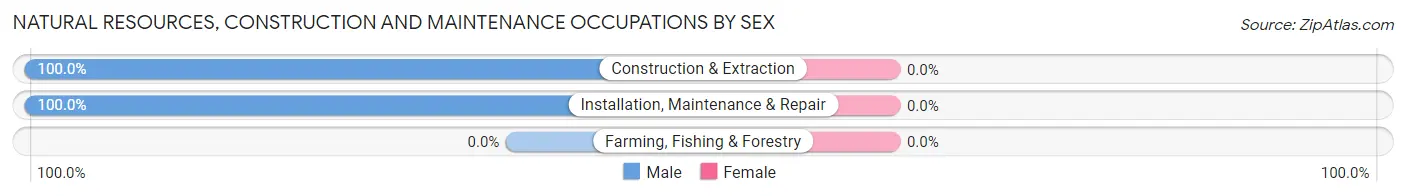
| Occupation | Male | Female |
| Farming, Fishing & Forestry | 0 (0.0%) | 0 (0.0%) |
| Construction & Extraction | 137 (100.0%) | 0 (0.0%) |
| Installation, Maintenance & Repair | 110 (100.0%) | 0 (0.0%) |
| Total (Category) | 247 (100.0%) | 0 (0.0%) |
| Total (Overall) | 789 (59.4%) | 540 (40.6%) |
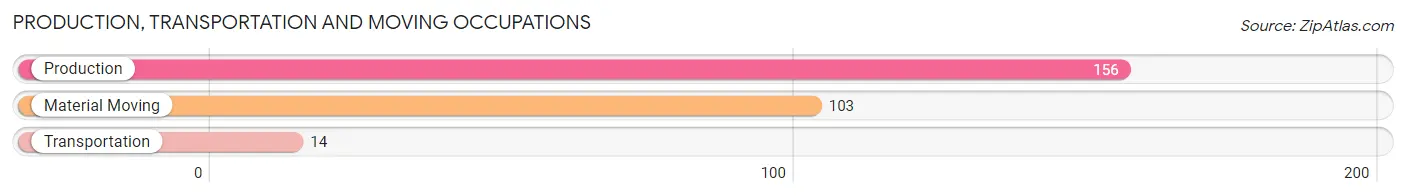
Production, Transportation and Moving Occupations
The most common Production, Transportation and Moving occupations in Glenrock are Production (156 | 11.7%), Material Moving (103 | 7.7%), and Transportation (14 | 1.1%).
Production, Transportation and Moving Occupations by Sex
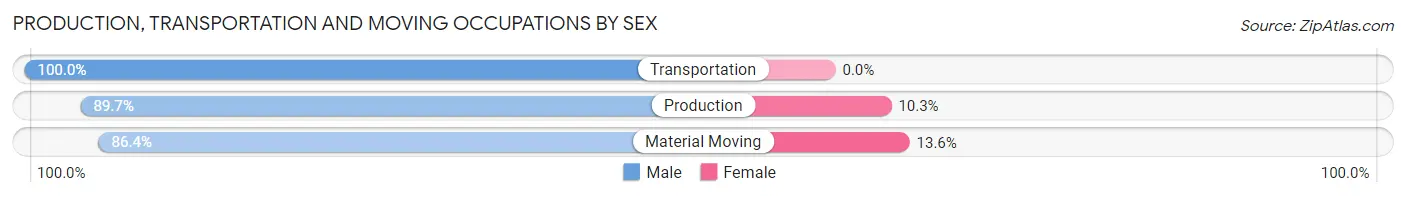
| Occupation | Male | Female |
| Production | 140 (89.7%) | 16 (10.3%) |
| Transportation | 14 (100.0%) | 0 (0.0%) |
| Material Moving | 89 (86.4%) | 14 (13.6%) |
| Total (Category) | 243 (89.0%) | 30 (11.0%) |
| Total (Overall) | 789 (59.4%) | 540 (40.6%) |
Employment Industries by Sex in Glenrock
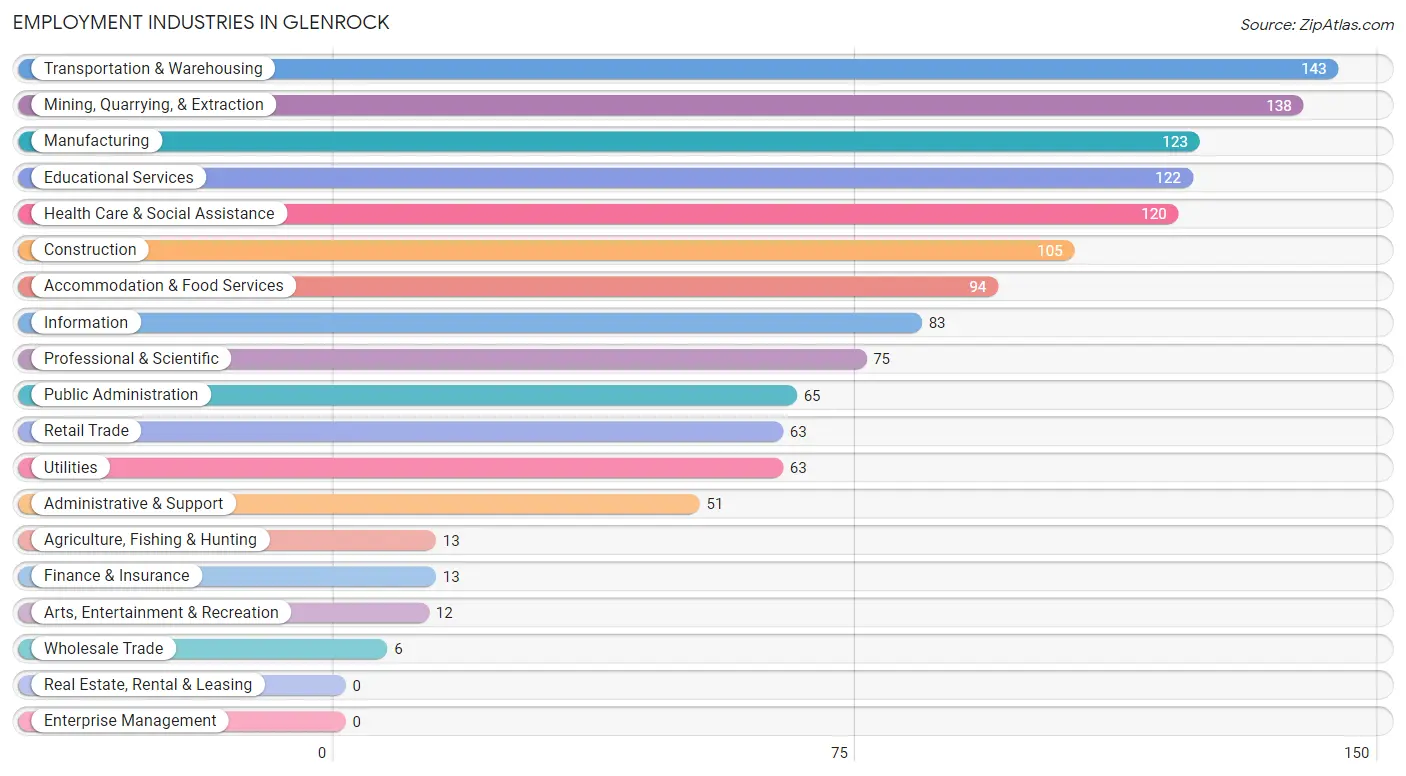
Employment Industries in Glenrock
The major employment industries in Glenrock include Transportation & Warehousing (143 | 10.8%), Mining, Quarrying, & Extraction (138 | 10.4%), Manufacturing (123 | 9.3%), Educational Services (122 | 9.2%), and Health Care & Social Assistance (120 | 9.0%).
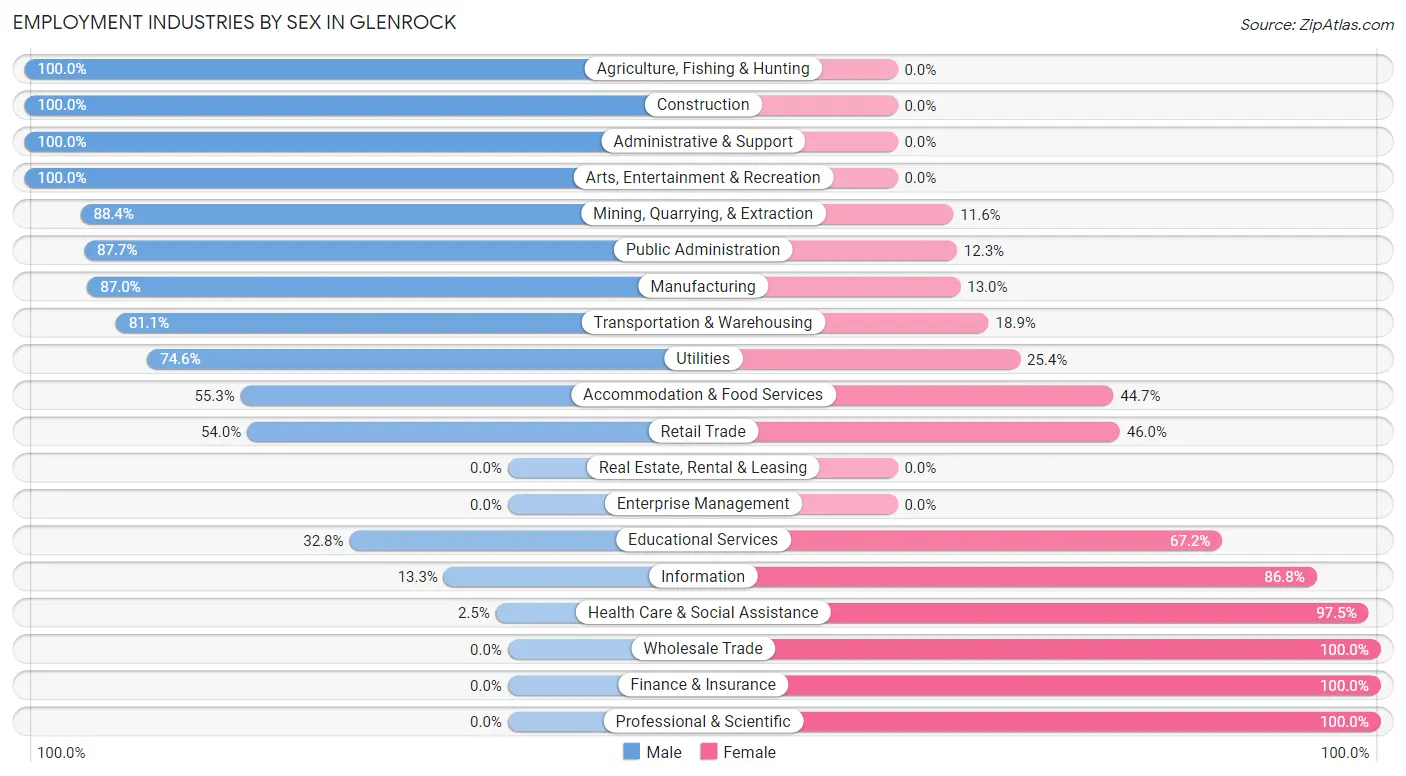
Employment Industries by Sex in Glenrock
The Glenrock industries that see more men than women are Agriculture, Fishing & Hunting (100.0%), Construction (100.0%), and Administrative & Support (100.0%), whereas the industries that tend to have a higher number of women are Wholesale Trade (100.0%), Finance & Insurance (100.0%), and Professional & Scientific (100.0%).
| Industry | Male | Female |
| Agriculture, Fishing & Hunting | 13 (100.0%) | 0 (0.0%) |
| Mining, Quarrying, & Extraction | 122 (88.4%) | 16 (11.6%) |
| Construction | 105 (100.0%) | 0 (0.0%) |
| Manufacturing | 107 (87.0%) | 16 (13.0%) |
| Wholesale Trade | 0 (0.0%) | 6 (100.0%) |
| Retail Trade | 34 (54.0%) | 29 (46.0%) |
| Transportation & Warehousing | 116 (81.1%) | 27 (18.9%) |
| Utilities | 47 (74.6%) | 16 (25.4%) |
| Information | 11 (13.3%) | 72 (86.8%) |
| Finance & Insurance | 0 (0.0%) | 13 (100.0%) |
| Real Estate, Rental & Leasing | 0 (0.0%) | 0 (0.0%) |
| Professional & Scientific | 0 (0.0%) | 75 (100.0%) |
| Enterprise Management | 0 (0.0%) | 0 (0.0%) |
| Administrative & Support | 51 (100.0%) | 0 (0.0%) |
| Educational Services | 40 (32.8%) | 82 (67.2%) |
| Health Care & Social Assistance | 3 (2.5%) | 117 (97.5%) |
| Arts, Entertainment & Recreation | 12 (100.0%) | 0 (0.0%) |
| Accommodation & Food Services | 52 (55.3%) | 42 (44.7%) |
| Public Administration | 57 (87.7%) | 8 (12.3%) |
| Total | 789 (59.4%) | 540 (40.6%) |
Education in Glenrock
School Enrollment in Glenrock
The most common levels of schooling among the 694 students in Glenrock are middle school (257 | 37.0%), high school (191 | 27.5%), and elementary school (110 | 15.9%).
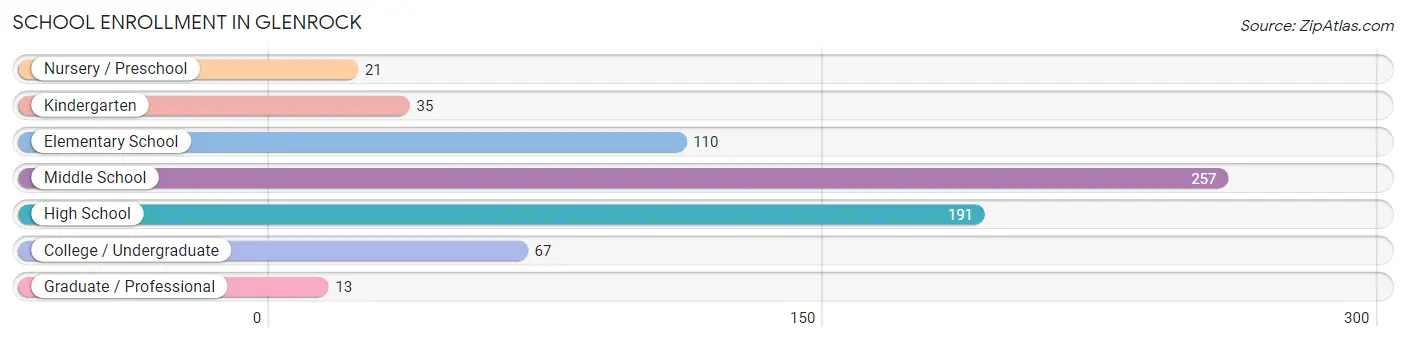
| School Level | # Students | % Students |
| Nursery / Preschool | 21 | 3.0% |
| Kindergarten | 35 | 5.0% |
| Elementary School | 110 | 15.9% |
| Middle School | 257 | 37.0% |
| High School | 191 | 27.5% |
| College / Undergraduate | 67 | 9.7% |
| Graduate / Professional | 13 | 1.9% |
| Total | 694 | 100.0% |
School Enrollment by Age by Funding Source in Glenrock
Out of a total of 694 students who are enrolled in schools in Glenrock, 93 (13.4%) attend a private institution, while the remaining 601 (86.6%) are enrolled in public schools. The age group of 35 years and over has the highest likelihood of being enrolled in private schools, with 9 (100.0% in the age bracket) enrolled. Conversely, the age group of 3 to 4 year olds has the lowest likelihood of being enrolled in a private school, with 21 (100.0% in the age bracket) attending a public institution.
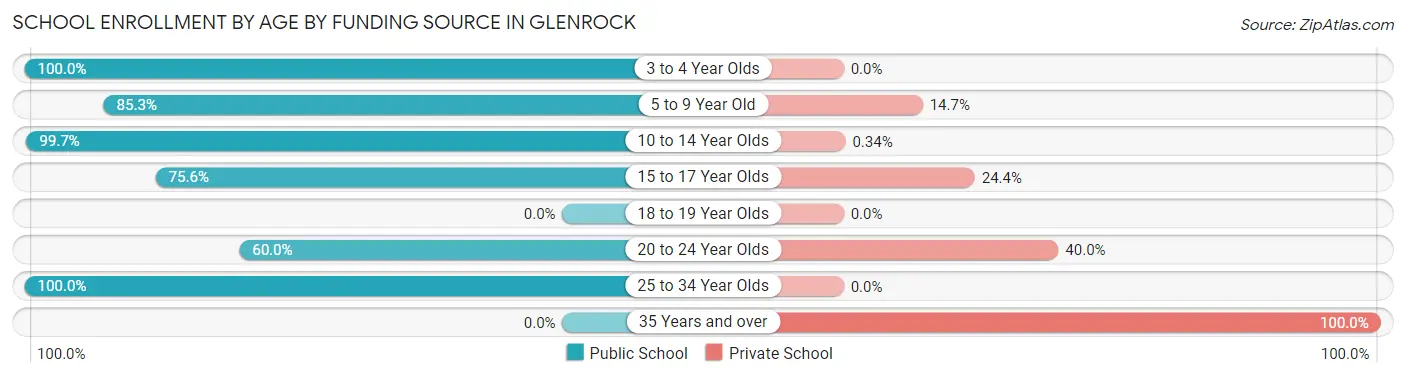
| Age Bracket | Public School | Private School |
| 3 to 4 Year Olds | 21 (100.0%) | 0 (0.0%) |
| 5 to 9 Year Old | 110 (85.3%) | 19 (14.7%) |
| 10 to 14 Year Olds | 291 (99.7%) | 1 (0.3%) |
| 15 to 17 Year Olds | 130 (75.6%) | 42 (24.4%) |
| 18 to 19 Year Olds | 0 (0.0%) | 0 (0.0%) |
| 20 to 24 Year Olds | 33 (60.0%) | 22 (40.0%) |
| 25 to 34 Year Olds | 16 (100.0%) | 0 (0.0%) |
| 35 Years and over | 0 (0.0%) | 9 (100.0%) |
| Total | 601 (86.6%) | 93 (13.4%) |
Educational Attainment by Field of Study in Glenrock
Education (107 | 39.3%), business (47 | 17.3%), arts & humanities (30 | 11.0%), science & technology (28 | 10.3%), and engineering (23 | 8.5%) are the most common fields of study among 272 individuals in Glenrock who have obtained a bachelor's degree or higher.
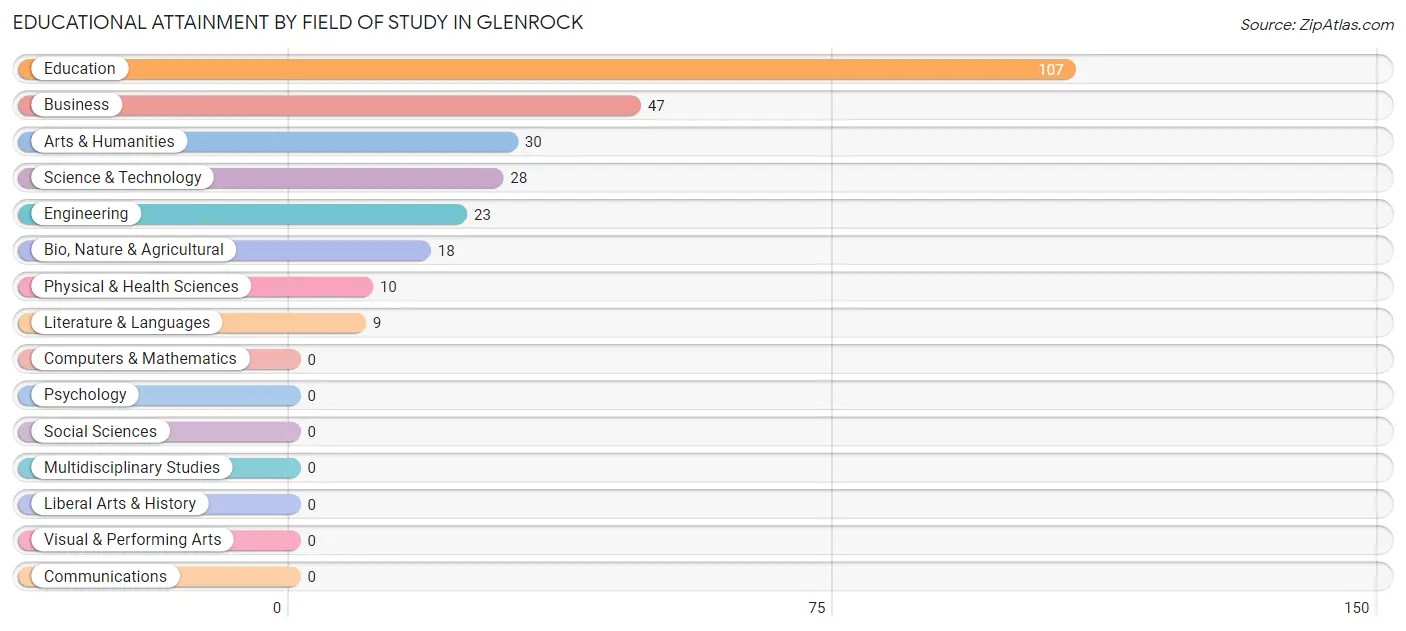
| Field of Study | # Graduates | % Graduates |
| Computers & Mathematics | 0 | 0.0% |
| Bio, Nature & Agricultural | 18 | 6.6% |
| Physical & Health Sciences | 10 | 3.7% |
| Psychology | 0 | 0.0% |
| Social Sciences | 0 | 0.0% |
| Engineering | 23 | 8.5% |
| Multidisciplinary Studies | 0 | 0.0% |
| Science & Technology | 28 | 10.3% |
| Business | 47 | 17.3% |
| Education | 107 | 39.3% |
| Literature & Languages | 9 | 3.3% |
| Liberal Arts & History | 0 | 0.0% |
| Visual & Performing Arts | 0 | 0.0% |
| Communications | 0 | 0.0% |
| Arts & Humanities | 30 | 11.0% |
| Total | 272 | 100.0% |
Transportation & Commute in Glenrock
Vehicle Availability by Sex in Glenrock
The most prevalent vehicle ownership categories in Glenrock are males with 3 vehicles (238, accounting for 30.2%) and females with 3 vehicles (175, making up 42.6%).
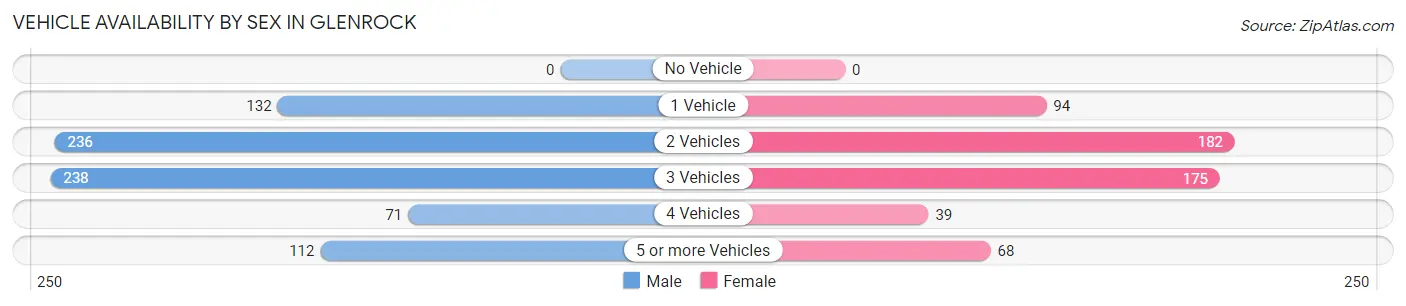
| Vehicles Available | Male | Female |
| No Vehicle | 0 (0.0%) | 0 (0.0%) |
| 1 Vehicle | 132 (16.7%) | 94 (16.9%) |
| 2 Vehicles | 236 (29.9%) | 182 (32.6%) |
| 3 Vehicles | 238 (30.2%) | 175 (31.4%) |
| 4 Vehicles | 71 (9.0%) | 39 (7.0%) |
| 5 or more Vehicles | 112 (14.2%) | 68 (12.2%) |
| Total | 789 (100.0%) | 558 (100.0%) |
Commute Time in Glenrock
The most frequently occuring commute durations in Glenrock are 30 to 34 minutes (446 commuters, 34.0%), 5 to 9 minutes (202 commuters, 15.4%), and less than 5 minutes (128 commuters, 9.8%).
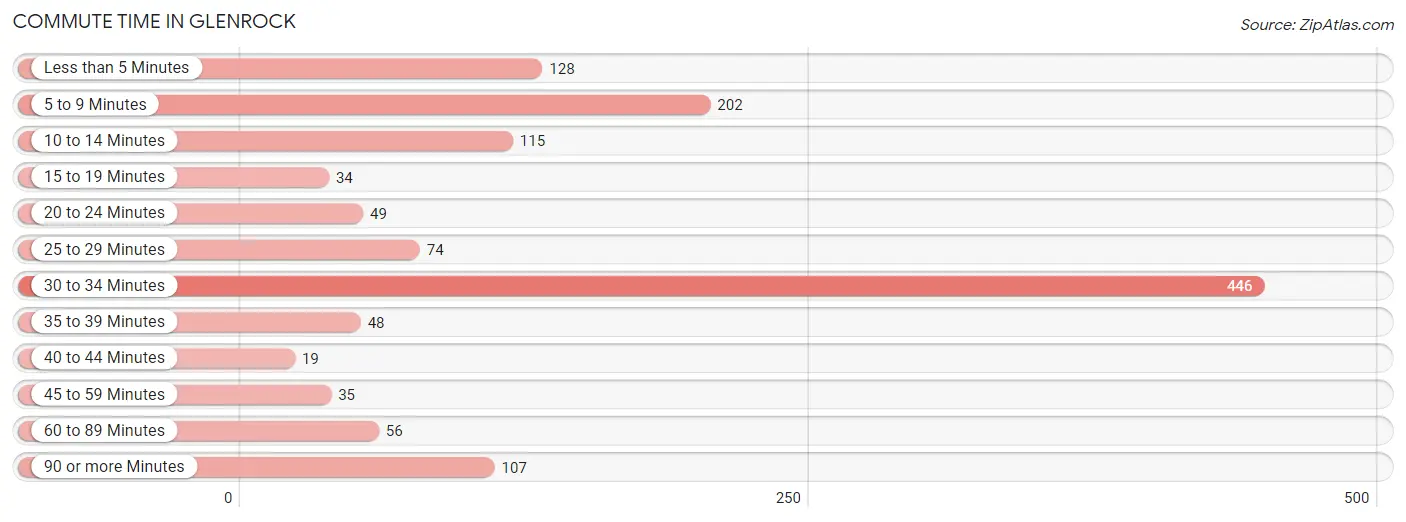
| Commute Time | # Commuters | % Commuters |
| Less than 5 Minutes | 128 | 9.8% |
| 5 to 9 Minutes | 202 | 15.4% |
| 10 to 14 Minutes | 115 | 8.8% |
| 15 to 19 Minutes | 34 | 2.6% |
| 20 to 24 Minutes | 49 | 3.7% |
| 25 to 29 Minutes | 74 | 5.6% |
| 30 to 34 Minutes | 446 | 34.0% |
| 35 to 39 Minutes | 48 | 3.7% |
| 40 to 44 Minutes | 19 | 1.5% |
| 45 to 59 Minutes | 35 | 2.7% |
| 60 to 89 Minutes | 56 | 4.3% |
| 90 or more Minutes | 107 | 8.2% |
Commute Time by Sex in Glenrock
The most common commute times in Glenrock are 30 to 34 minutes (280 commuters, 35.5%) for males and 30 to 34 minutes (166 commuters, 31.7%) for females.
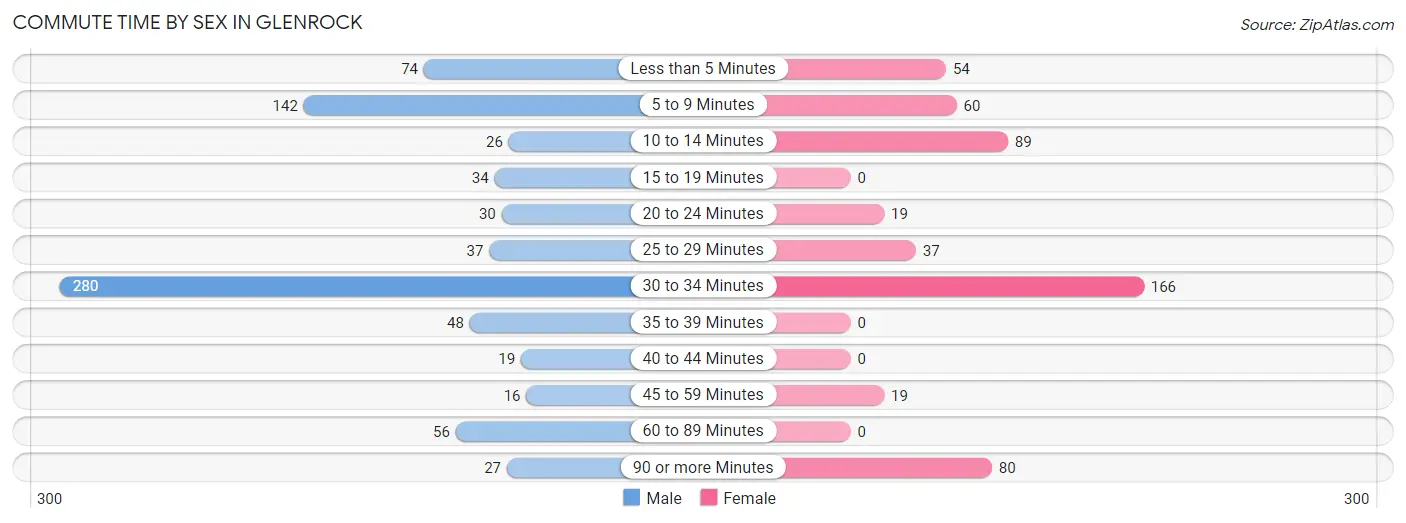
| Commute Time | Male | Female |
| Less than 5 Minutes | 74 (9.4%) | 54 (10.3%) |
| 5 to 9 Minutes | 142 (18.0%) | 60 (11.5%) |
| 10 to 14 Minutes | 26 (3.3%) | 89 (17.0%) |
| 15 to 19 Minutes | 34 (4.3%) | 0 (0.0%) |
| 20 to 24 Minutes | 30 (3.8%) | 19 (3.6%) |
| 25 to 29 Minutes | 37 (4.7%) | 37 (7.1%) |
| 30 to 34 Minutes | 280 (35.5%) | 166 (31.7%) |
| 35 to 39 Minutes | 48 (6.1%) | 0 (0.0%) |
| 40 to 44 Minutes | 19 (2.4%) | 0 (0.0%) |
| 45 to 59 Minutes | 16 (2.0%) | 19 (3.6%) |
| 60 to 89 Minutes | 56 (7.1%) | 0 (0.0%) |
| 90 or more Minutes | 27 (3.4%) | 80 (15.3%) |
Time of Departure to Work by Sex in Glenrock
The most frequent times of departure to work in Glenrock are 6:30 AM to 6:59 AM (215, 27.3%) for males and 7:00 AM to 7:29 AM (136, 26.0%) for females.
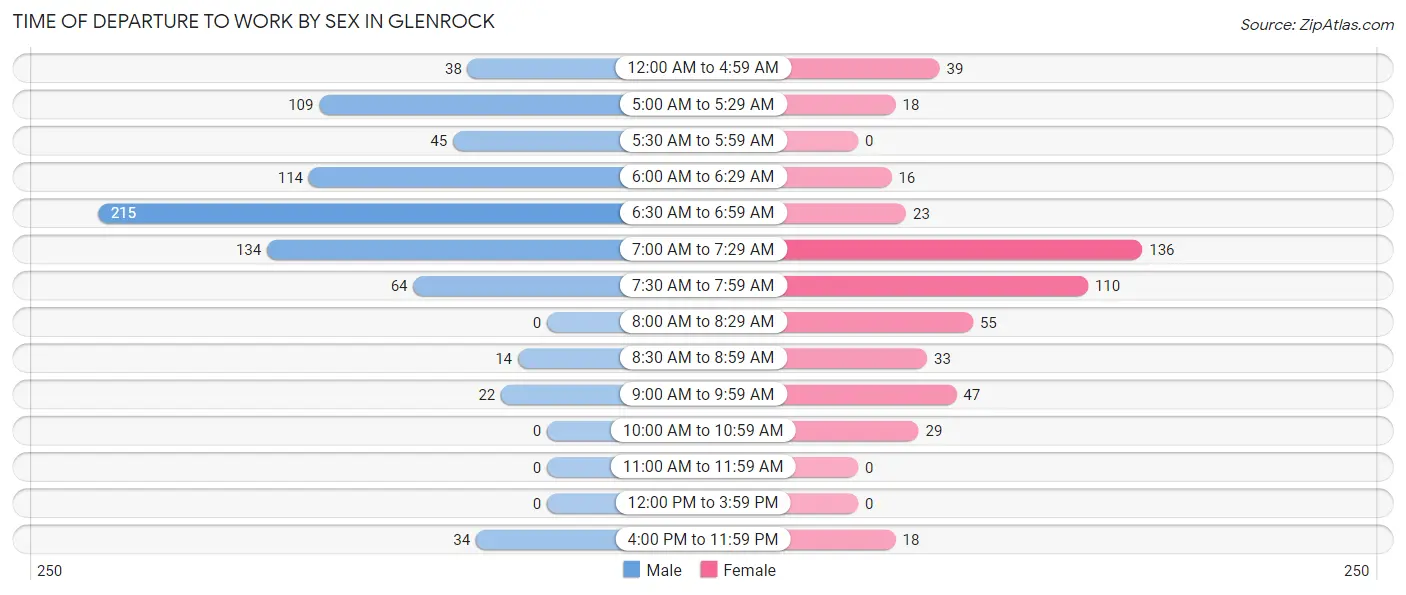
| Time of Departure | Male | Female |
| 12:00 AM to 4:59 AM | 38 (4.8%) | 39 (7.4%) |
| 5:00 AM to 5:29 AM | 109 (13.8%) | 18 (3.4%) |
| 5:30 AM to 5:59 AM | 45 (5.7%) | 0 (0.0%) |
| 6:00 AM to 6:29 AM | 114 (14.4%) | 16 (3.0%) |
| 6:30 AM to 6:59 AM | 215 (27.3%) | 23 (4.4%) |
| 7:00 AM to 7:29 AM | 134 (17.0%) | 136 (26.0%) |
| 7:30 AM to 7:59 AM | 64 (8.1%) | 110 (21.0%) |
| 8:00 AM to 8:29 AM | 0 (0.0%) | 55 (10.5%) |
| 8:30 AM to 8:59 AM | 14 (1.8%) | 33 (6.3%) |
| 9:00 AM to 9:59 AM | 22 (2.8%) | 47 (9.0%) |
| 10:00 AM to 10:59 AM | 0 (0.0%) | 29 (5.5%) |
| 11:00 AM to 11:59 AM | 0 (0.0%) | 0 (0.0%) |
| 12:00 PM to 3:59 PM | 0 (0.0%) | 0 (0.0%) |
| 4:00 PM to 11:59 PM | 34 (4.3%) | 18 (3.4%) |
| Total | 789 (100.0%) | 524 (100.0%) |
Housing Occupancy in Glenrock
Occupancy by Ownership in Glenrock
Of the total 1,079 dwellings in Glenrock, owner-occupied units account for 766 (71.0%), while renter-occupied units make up 313 (29.0%).
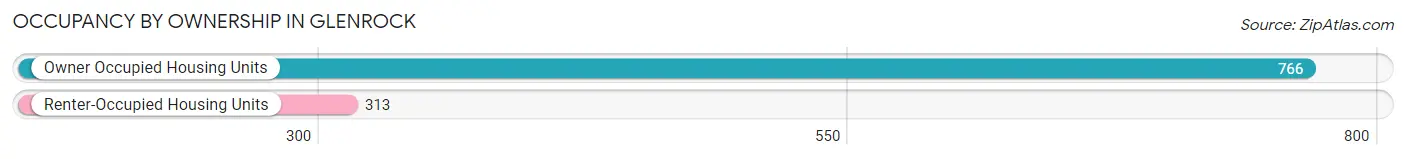
| Occupancy | # Housing Units | % Housing Units |
| Owner Occupied Housing Units | 766 | 71.0% |
| Renter-Occupied Housing Units | 313 | 29.0% |
| Total Occupied Housing Units | 1,079 | 100.0% |
Occupancy by Household Size in Glenrock
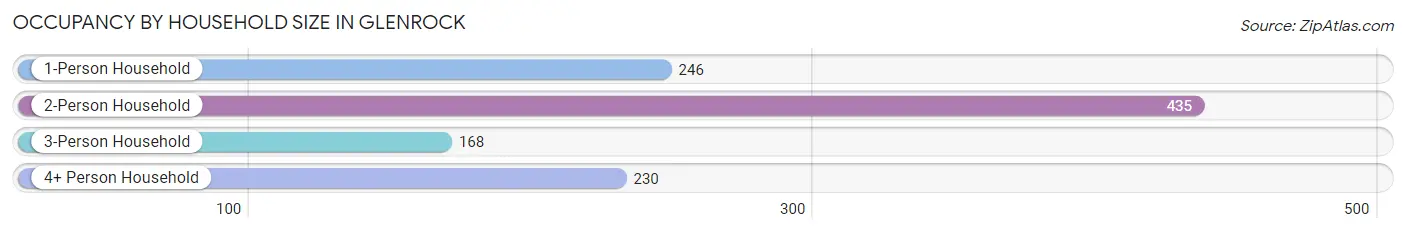
| Household Size | # Housing Units | % Housing Units |
| 1-Person Household | 246 | 22.8% |
| 2-Person Household | 435 | 40.3% |
| 3-Person Household | 168 | 15.6% |
| 4+ Person Household | 230 | 21.3% |
| Total Housing Units | 1,079 | 100.0% |
Occupancy by Ownership by Household Size in Glenrock
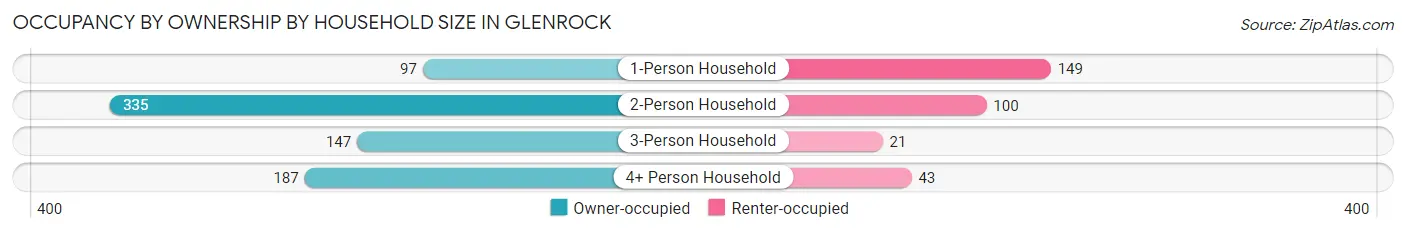
| Household Size | Owner-occupied | Renter-occupied |
| 1-Person Household | 97 (39.4%) | 149 (60.6%) |
| 2-Person Household | 335 (77.0%) | 100 (23.0%) |
| 3-Person Household | 147 (87.5%) | 21 (12.5%) |
| 4+ Person Household | 187 (81.3%) | 43 (18.7%) |
| Total Housing Units | 766 (71.0%) | 313 (29.0%) |
Occupancy by Educational Attainment in Glenrock
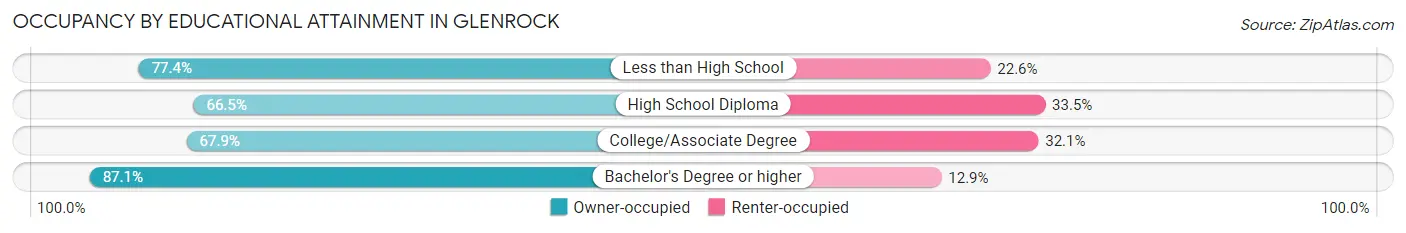
| Household Size | Owner-occupied | Renter-occupied |
| Less than High School | 41 (77.4%) | 12 (22.6%) |
| High School Diploma | 266 (66.5%) | 134 (33.5%) |
| College/Associate Degree | 304 (67.9%) | 144 (32.1%) |
| Bachelor's Degree or higher | 155 (87.1%) | 23 (12.9%) |
Occupancy by Age of Householder in Glenrock
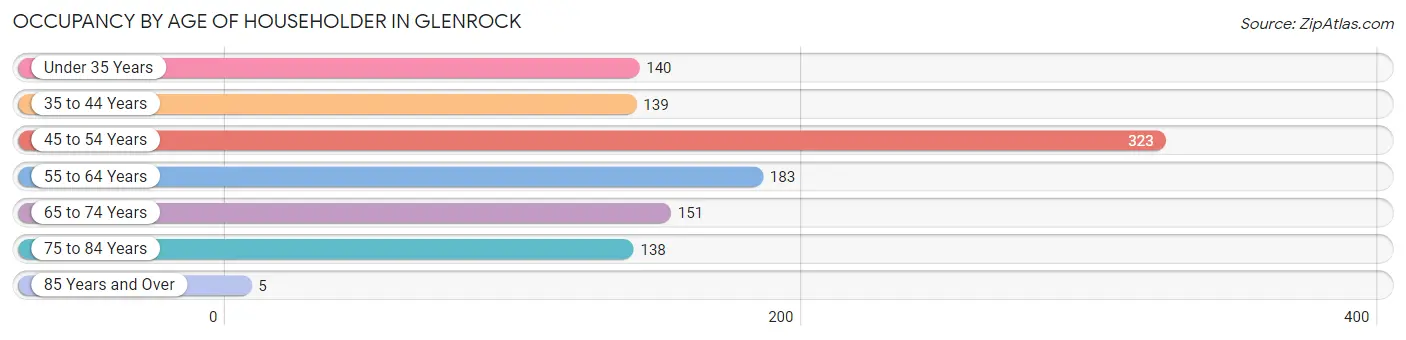
| Age Bracket | # Households | % Households |
| Under 35 Years | 140 | 13.0% |
| 35 to 44 Years | 139 | 12.9% |
| 45 to 54 Years | 323 | 29.9% |
| 55 to 64 Years | 183 | 17.0% |
| 65 to 74 Years | 151 | 14.0% |
| 75 to 84 Years | 138 | 12.8% |
| 85 Years and Over | 5 | 0.5% |
| Total | 1,079 | 100.0% |
Housing Finances in Glenrock
Median Income by Occupancy in Glenrock
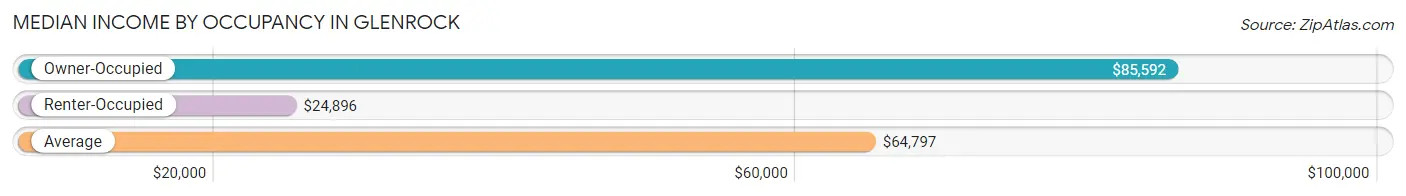
| Occupancy Type | # Households | Median Income |
| Owner-Occupied | 766 (71.0%) | $85,592 |
| Renter-Occupied | 313 (29.0%) | $24,896 |
| Average | 1,079 (100.0%) | $64,797 |
Occupancy by Householder Income Bracket in Glenrock
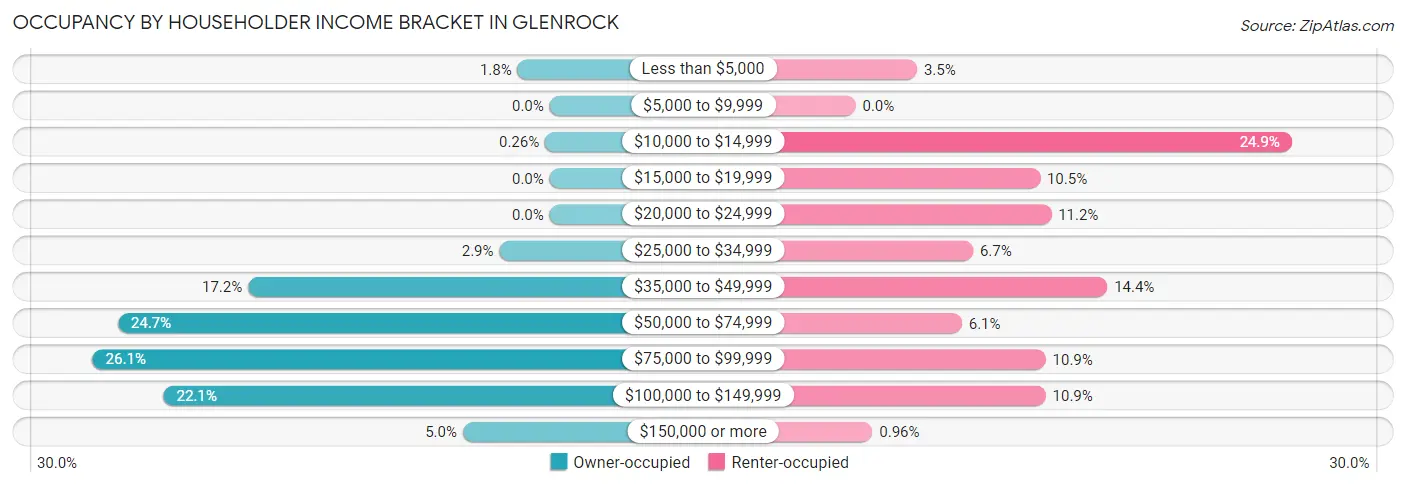
| Income Bracket | Owner-occupied | Renter-occupied |
| Less than $5,000 | 14 (1.8%) | 11 (3.5%) |
| $5,000 to $9,999 | 0 (0.0%) | 0 (0.0%) |
| $10,000 to $14,999 | 2 (0.3%) | 78 (24.9%) |
| $15,000 to $19,999 | 0 (0.0%) | 33 (10.5%) |
| $20,000 to $24,999 | 0 (0.0%) | 35 (11.2%) |
| $25,000 to $34,999 | 22 (2.9%) | 21 (6.7%) |
| $35,000 to $49,999 | 132 (17.2%) | 45 (14.4%) |
| $50,000 to $74,999 | 189 (24.7%) | 19 (6.1%) |
| $75,000 to $99,999 | 200 (26.1%) | 34 (10.9%) |
| $100,000 to $149,999 | 169 (22.1%) | 34 (10.9%) |
| $150,000 or more | 38 (5.0%) | 3 (1.0%) |
| Total | 766 (100.0%) | 313 (100.0%) |
Monthly Housing Cost Tiers in Glenrock
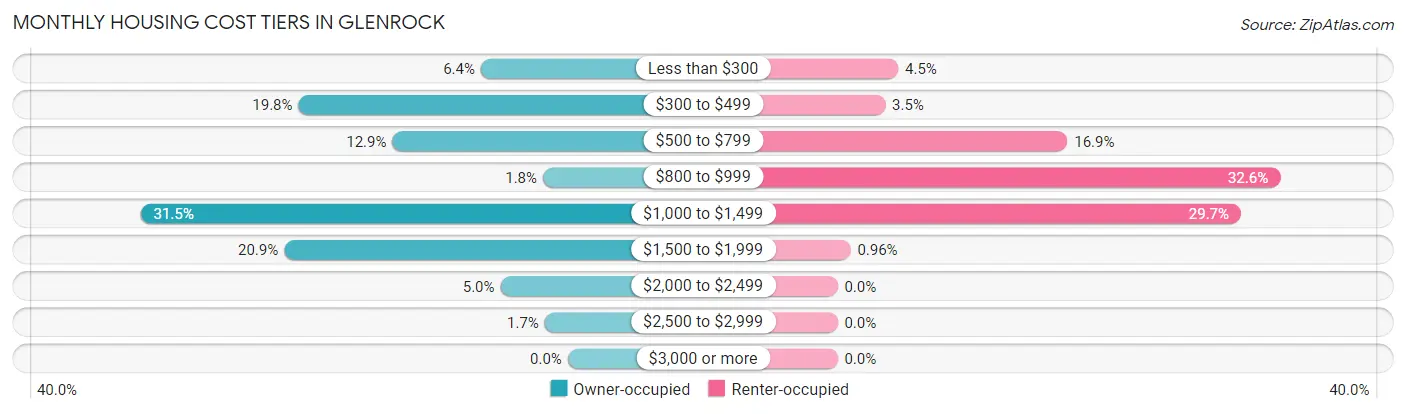
| Monthly Cost | Owner-occupied | Renter-occupied |
| Less than $300 | 49 (6.4%) | 14 (4.5%) |
| $300 to $499 | 152 (19.8%) | 11 (3.5%) |
| $500 to $799 | 99 (12.9%) | 53 (16.9%) |
| $800 to $999 | 14 (1.8%) | 102 (32.6%) |
| $1,000 to $1,499 | 241 (31.5%) | 93 (29.7%) |
| $1,500 to $1,999 | 160 (20.9%) | 3 (1.0%) |
| $2,000 to $2,499 | 38 (5.0%) | 0 (0.0%) |
| $2,500 to $2,999 | 13 (1.7%) | 0 (0.0%) |
| $3,000 or more | 0 (0.0%) | 0 (0.0%) |
| Total | 766 (100.0%) | 313 (100.0%) |
Physical Housing Characteristics in Glenrock
Housing Structures in Glenrock
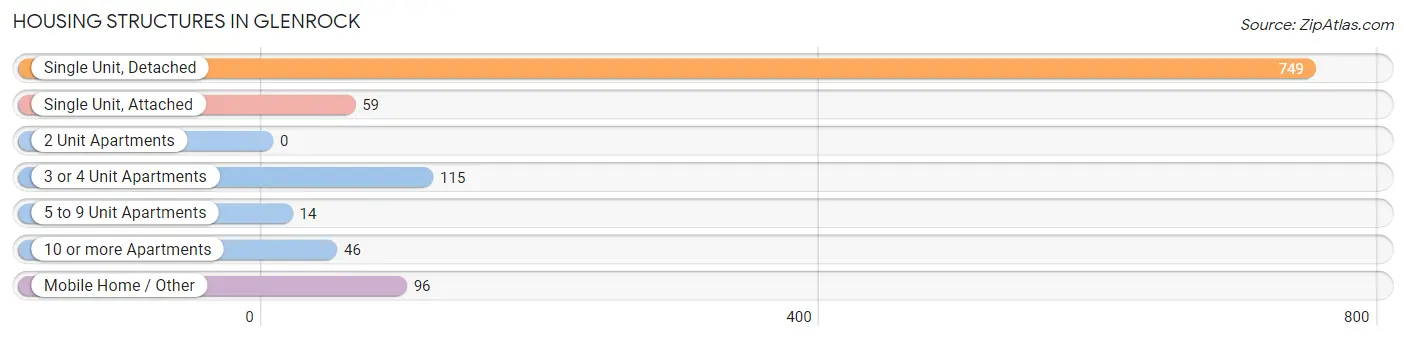
| Structure Type | # Housing Units | % Housing Units |
| Single Unit, Detached | 749 | 69.4% |
| Single Unit, Attached | 59 | 5.5% |
| 2 Unit Apartments | 0 | 0.0% |
| 3 or 4 Unit Apartments | 115 | 10.7% |
| 5 to 9 Unit Apartments | 14 | 1.3% |
| 10 or more Apartments | 46 | 4.3% |
| Mobile Home / Other | 96 | 8.9% |
| Total | 1,079 | 100.0% |
Housing Structures by Occupancy in Glenrock
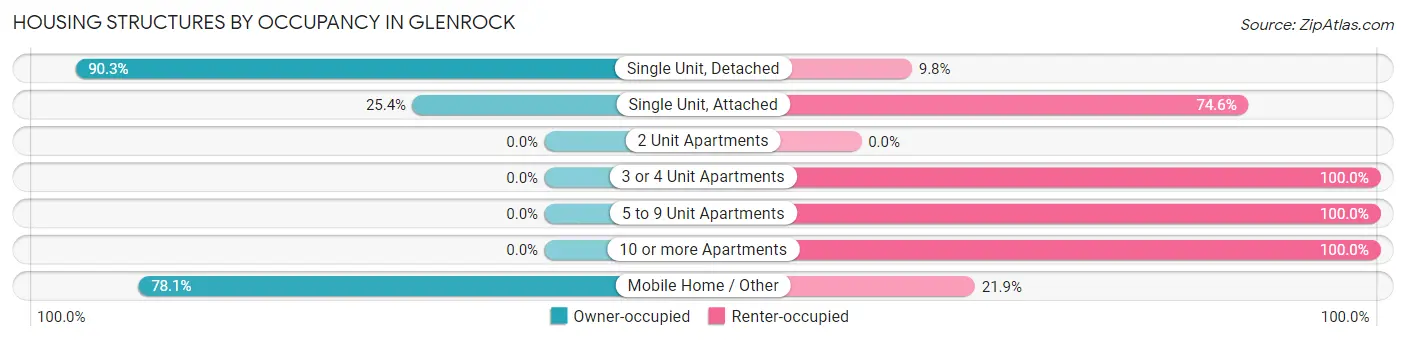
| Structure Type | Owner-occupied | Renter-occupied |
| Single Unit, Detached | 676 (90.2%) | 73 (9.8%) |
| Single Unit, Attached | 15 (25.4%) | 44 (74.6%) |
| 2 Unit Apartments | 0 (0.0%) | 0 (0.0%) |
| 3 or 4 Unit Apartments | 0 (0.0%) | 115 (100.0%) |
| 5 to 9 Unit Apartments | 0 (0.0%) | 14 (100.0%) |
| 10 or more Apartments | 0 (0.0%) | 46 (100.0%) |
| Mobile Home / Other | 75 (78.1%) | 21 (21.9%) |
| Total | 766 (71.0%) | 313 (29.0%) |
Housing Structures by Number of Rooms in Glenrock
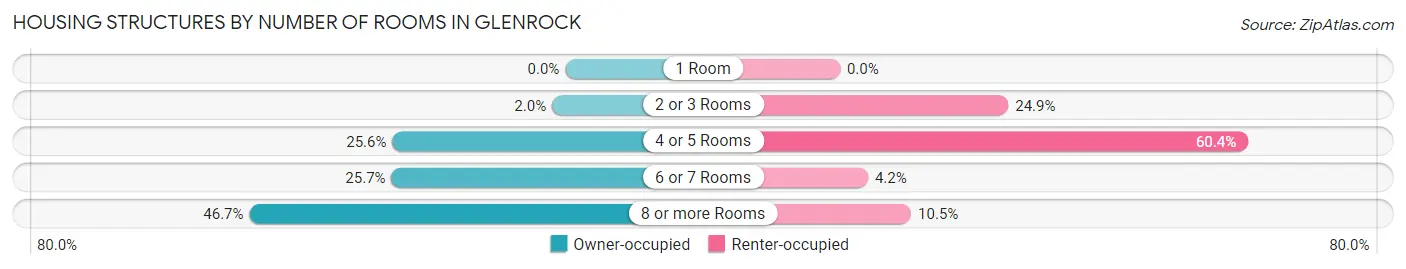
| Number of Rooms | Owner-occupied | Renter-occupied |
| 1 Room | 0 (0.0%) | 0 (0.0%) |
| 2 or 3 Rooms | 15 (2.0%) | 78 (24.9%) |
| 4 or 5 Rooms | 196 (25.6%) | 189 (60.4%) |
| 6 or 7 Rooms | 197 (25.7%) | 13 (4.2%) |
| 8 or more Rooms | 358 (46.7%) | 33 (10.5%) |
| Total | 766 (100.0%) | 313 (100.0%) |
Housing Structure by Heating Type in Glenrock
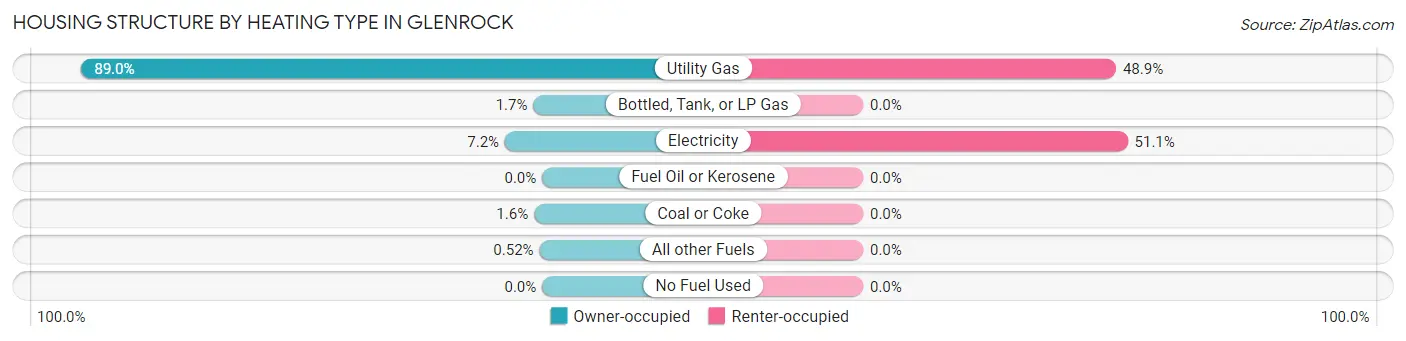
| Heating Type | Owner-occupied | Renter-occupied |
| Utility Gas | 682 (89.0%) | 153 (48.9%) |
| Bottled, Tank, or LP Gas | 13 (1.7%) | 0 (0.0%) |
| Electricity | 55 (7.2%) | 160 (51.1%) |
| Fuel Oil or Kerosene | 0 (0.0%) | 0 (0.0%) |
| Coal or Coke | 12 (1.6%) | 0 (0.0%) |
| All other Fuels | 4 (0.5%) | 0 (0.0%) |
| No Fuel Used | 0 (0.0%) | 0 (0.0%) |
| Total | 766 (100.0%) | 313 (100.0%) |
Household Vehicle Usage in Glenrock
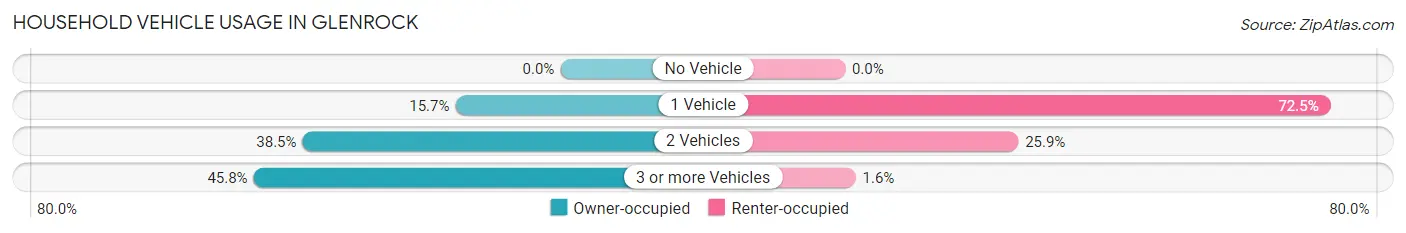
| Vehicles per Household | Owner-occupied | Renter-occupied |
| No Vehicle | 0 (0.0%) | 0 (0.0%) |
| 1 Vehicle | 120 (15.7%) | 227 (72.5%) |
| 2 Vehicles | 295 (38.5%) | 81 (25.9%) |
| 3 or more Vehicles | 351 (45.8%) | 5 (1.6%) |
| Total | 766 (100.0%) | 313 (100.0%) |
Real Estate & Mortgages in Glenrock
Real Estate and Mortgage Overview in Glenrock
| Characteristic | Without Mortgage | With Mortgage |
| Housing Units | 300 | 466 |
| Median Property Value | $155,400 | $224,600 |
| Median Household Income | $56,944 | $38 |
| Monthly Housing Costs | $446 | $0 |
| Real Estate Taxes | $1,122 | $0 |
Property Value by Mortgage Status in Glenrock
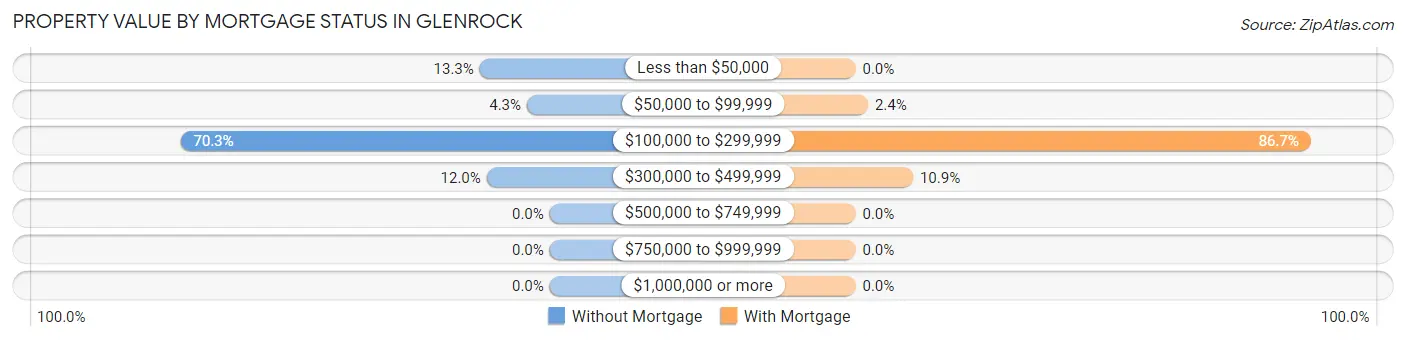
| Property Value | Without Mortgage | With Mortgage |
| Less than $50,000 | 40 (13.3%) | 0 (0.0%) |
| $50,000 to $99,999 | 13 (4.3%) | 11 (2.4%) |
| $100,000 to $299,999 | 211 (70.3%) | 404 (86.7%) |
| $300,000 to $499,999 | 36 (12.0%) | 51 (10.9%) |
| $500,000 to $749,999 | 0 (0.0%) | 0 (0.0%) |
| $750,000 to $999,999 | 0 (0.0%) | 0 (0.0%) |
| $1,000,000 or more | 0 (0.0%) | 0 (0.0%) |
| Total | 300 (100.0%) | 466 (100.0%) |
Household Income by Mortgage Status in Glenrock
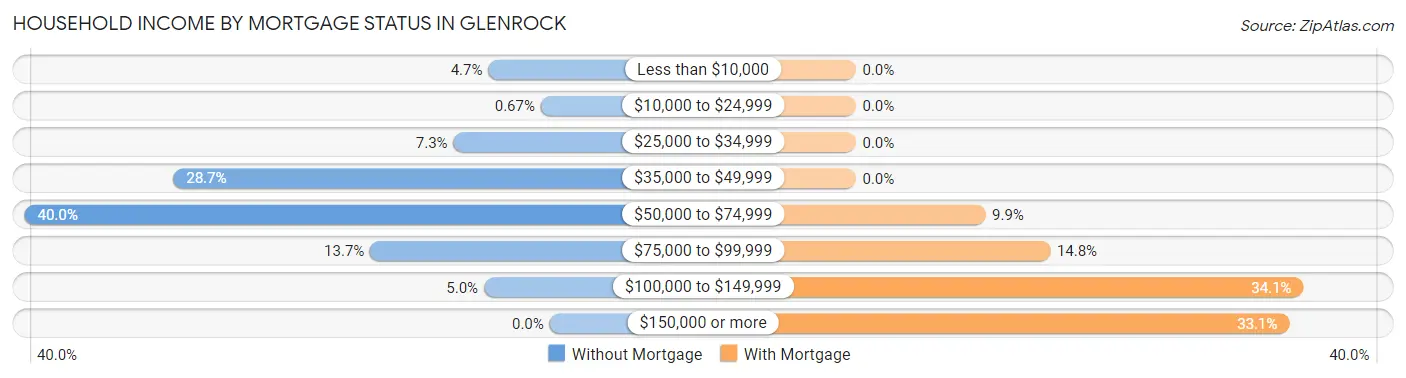
| Household Income | Without Mortgage | With Mortgage |
| Less than $10,000 | 14 (4.7%) | 0 (0.0%) |
| $10,000 to $24,999 | 2 (0.7%) | 0 (0.0%) |
| $25,000 to $34,999 | 22 (7.3%) | 0 (0.0%) |
| $35,000 to $49,999 | 86 (28.7%) | 0 (0.0%) |
| $50,000 to $74,999 | 120 (40.0%) | 46 (9.9%) |
| $75,000 to $99,999 | 41 (13.7%) | 69 (14.8%) |
| $100,000 to $149,999 | 15 (5.0%) | 159 (34.1%) |
| $150,000 or more | 0 (0.0%) | 154 (33.1%) |
| Total | 300 (100.0%) | 466 (100.0%) |
Property Value to Household Income Ratio in Glenrock
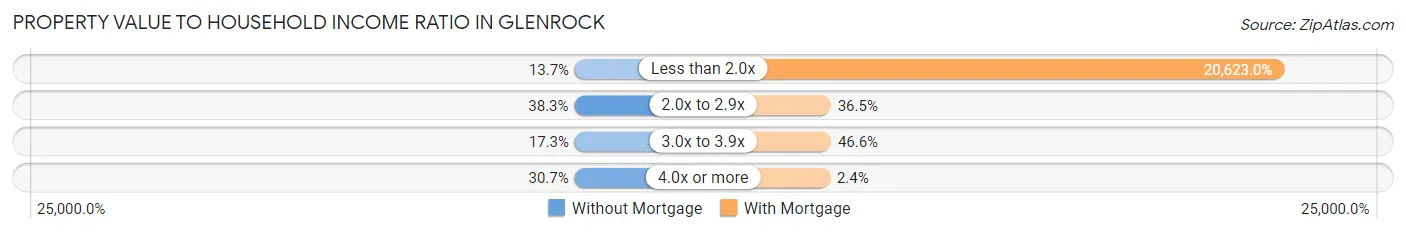
| Value-to-Income Ratio | Without Mortgage | With Mortgage |
| Less than 2.0x | 41 (13.7%) | 96,103 (20,623.0%) |
| 2.0x to 2.9x | 115 (38.3%) | 170 (36.5%) |
| 3.0x to 3.9x | 52 (17.3%) | 217 (46.6%) |
| 4.0x or more | 92 (30.7%) | 11 (2.4%) |
| Total | 300 (100.0%) | 466 (100.0%) |
Real Estate Taxes by Mortgage Status in Glenrock
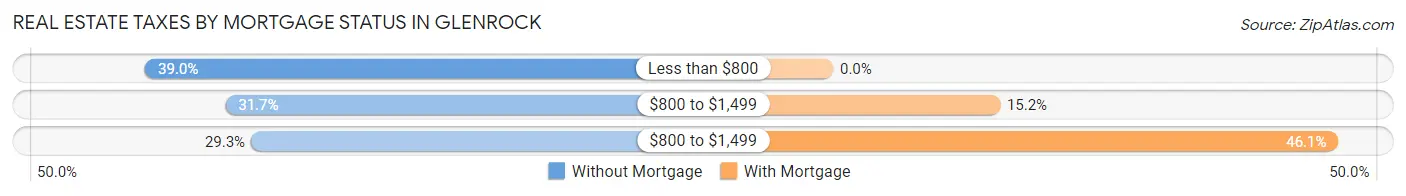
| Property Taxes | Without Mortgage | With Mortgage |
| Less than $800 | 117 (39.0%) | 0 (0.0%) |
| $800 to $1,499 | 95 (31.7%) | 71 (15.2%) |
| $800 to $1,499 | 88 (29.3%) | 215 (46.1%) |
| Total | 300 (100.0%) | 466 (100.0%) |
Health & Disability in Glenrock
Health Insurance Coverage by Age in Glenrock
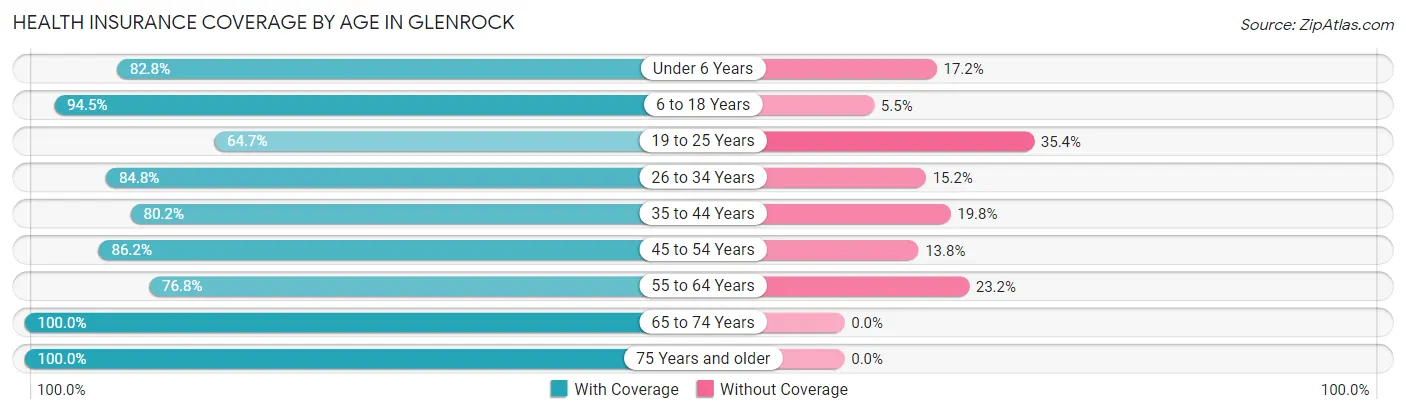
| Age Bracket | With Coverage | Without Coverage |
| Under 6 Years | 130 (82.8%) | 27 (17.2%) |
| 6 to 18 Years | 599 (94.5%) | 35 (5.5%) |
| 19 to 25 Years | 192 (64.6%) | 105 (35.3%) |
| 26 to 34 Years | 190 (84.8%) | 34 (15.2%) |
| 35 to 44 Years | 203 (80.2%) | 50 (19.8%) |
| 45 to 54 Years | 375 (86.2%) | 60 (13.8%) |
| 55 to 64 Years | 324 (76.8%) | 98 (23.2%) |
| 65 to 74 Years | 232 (100.0%) | 0 (0.0%) |
| 75 Years and older | 191 (100.0%) | 0 (0.0%) |
| Total | 2,436 (85.6%) | 409 (14.4%) |
Health Insurance Coverage by Citizenship Status in Glenrock
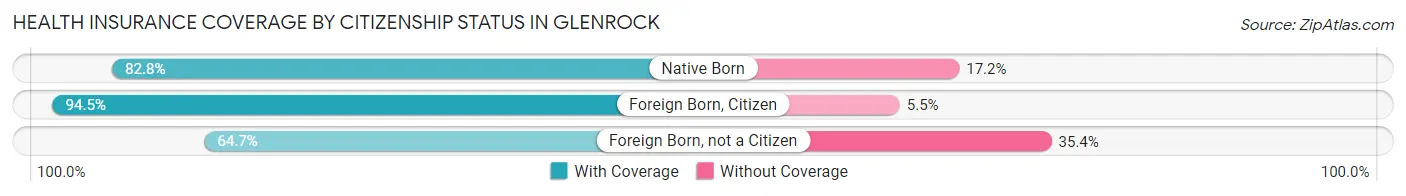
| Citizenship Status | With Coverage | Without Coverage |
| Native Born | 130 (82.8%) | 27 (17.2%) |
| Foreign Born, Citizen | 599 (94.5%) | 35 (5.5%) |
| Foreign Born, not a Citizen | 192 (64.6%) | 105 (35.3%) |
Health Insurance Coverage by Household Income in Glenrock
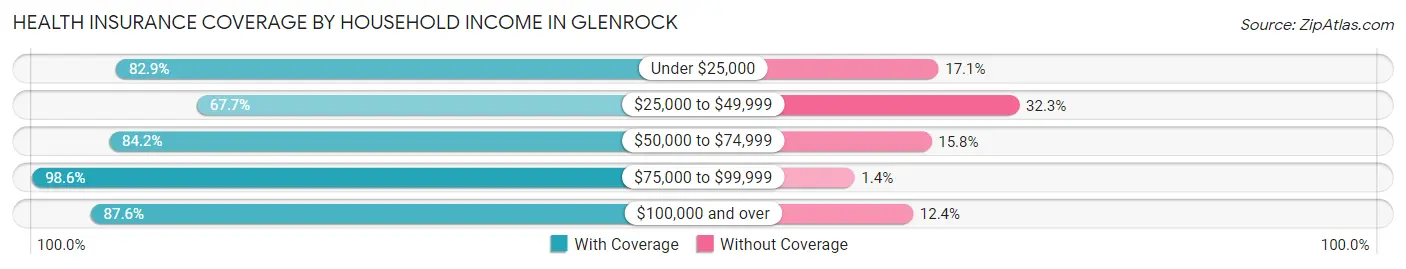
| Household Income | With Coverage | Without Coverage |
| Under $25,000 | 174 (82.9%) | 36 (17.1%) |
| $25,000 to $49,999 | 342 (67.7%) | 163 (32.3%) |
| $50,000 to $74,999 | 367 (84.2%) | 69 (15.8%) |
| $75,000 to $99,999 | 619 (98.6%) | 9 (1.4%) |
| $100,000 and over | 934 (87.6%) | 132 (12.4%) |
Public vs Private Health Insurance Coverage by Age in Glenrock
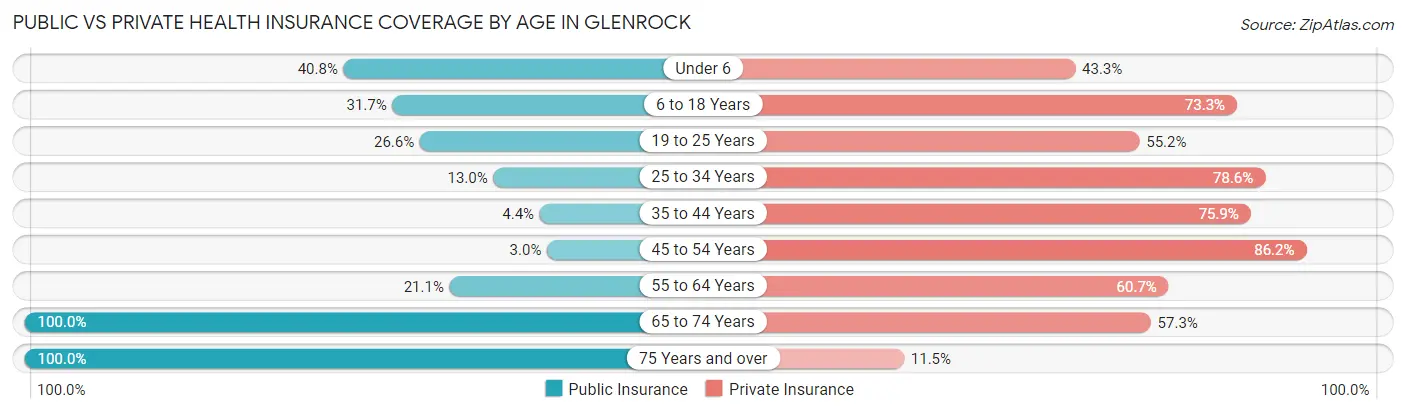
| Age Bracket | Public Insurance | Private Insurance |
| Under 6 | 64 (40.8%) | 68 (43.3%) |
| 6 to 18 Years | 201 (31.7%) | 465 (73.3%) |
| 19 to 25 Years | 79 (26.6%) | 164 (55.2%) |
| 25 to 34 Years | 29 (13.0%) | 176 (78.6%) |
| 35 to 44 Years | 11 (4.3%) | 192 (75.9%) |
| 45 to 54 Years | 13 (3.0%) | 375 (86.2%) |
| 55 to 64 Years | 89 (21.1%) | 256 (60.7%) |
| 65 to 74 Years | 232 (100.0%) | 133 (57.3%) |
| 75 Years and over | 191 (100.0%) | 22 (11.5%) |
| Total | 909 (32.0%) | 1,851 (65.1%) |
Disability Status by Sex by Age in Glenrock
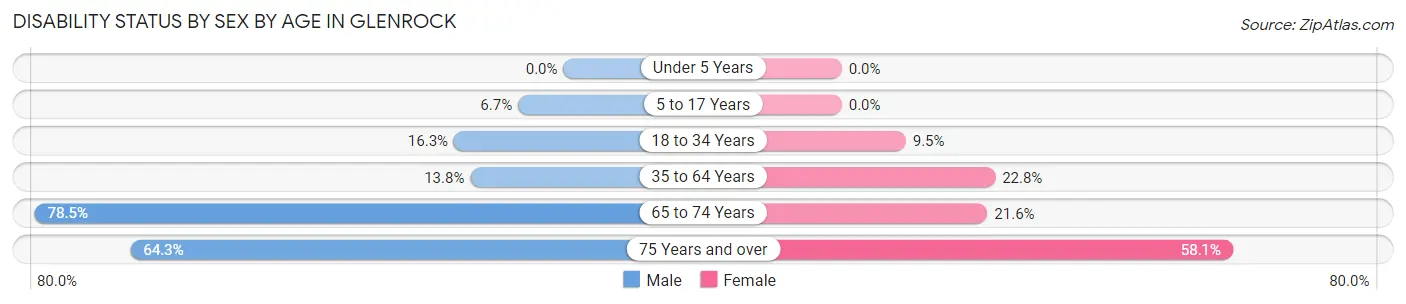
| Age Bracket | Male | Female |
| Under 5 Years | 0 (0.0%) | 0 (0.0%) |
| 5 to 17 Years | 23 (6.7%) | 0 (0.0%) |
| 18 to 34 Years | 58 (16.3%) | 21 (9.5%) |
| 35 to 64 Years | 74 (13.8%) | 131 (22.8%) |
| 65 to 74 Years | 95 (78.5%) | 24 (21.6%) |
| 75 Years and over | 63 (64.3%) | 54 (58.1%) |
Disability Class by Sex by Age in Glenrock
Disability Class: Hearing Difficulty
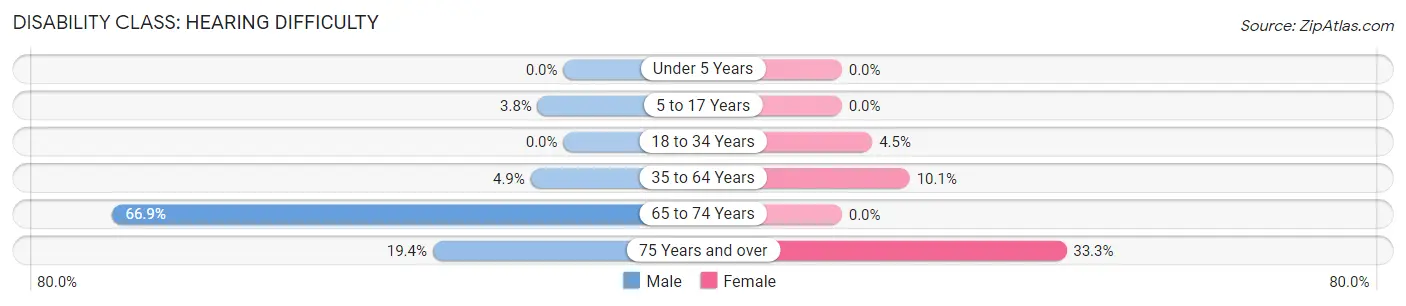
| Age Bracket | Male | Female |
| Under 5 Years | 0 (0.0%) | 0 (0.0%) |
| 5 to 17 Years | 13 (3.8%) | 0 (0.0%) |
| 18 to 34 Years | 0 (0.0%) | 10 (4.5%) |
| 35 to 64 Years | 26 (4.9%) | 58 (10.1%) |
| 65 to 74 Years | 81 (66.9%) | 0 (0.0%) |
| 75 Years and over | 19 (19.4%) | 31 (33.3%) |
Disability Class: Vision Difficulty
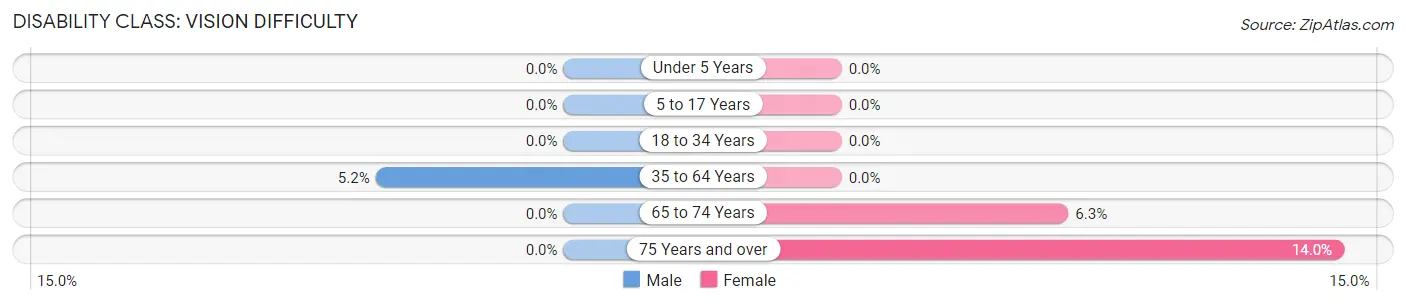
| Age Bracket | Male | Female |
| Under 5 Years | 0 (0.0%) | 0 (0.0%) |
| 5 to 17 Years | 0 (0.0%) | 0 (0.0%) |
| 18 to 34 Years | 0 (0.0%) | 0 (0.0%) |
| 35 to 64 Years | 28 (5.2%) | 0 (0.0%) |
| 65 to 74 Years | 0 (0.0%) | 7 (6.3%) |
| 75 Years and over | 0 (0.0%) | 13 (14.0%) |
Disability Class: Cognitive Difficulty
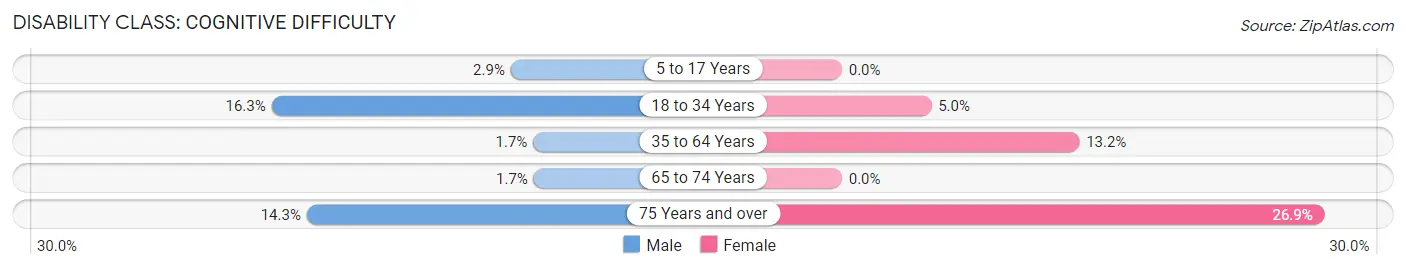
| Age Bracket | Male | Female |
| 5 to 17 Years | 10 (2.9%) | 0 (0.0%) |
| 18 to 34 Years | 58 (16.3%) | 11 (5.0%) |
| 35 to 64 Years | 9 (1.7%) | 76 (13.2%) |
| 65 to 74 Years | 2 (1.7%) | 0 (0.0%) |
| 75 Years and over | 14 (14.3%) | 25 (26.9%) |
Disability Class: Ambulatory Difficulty
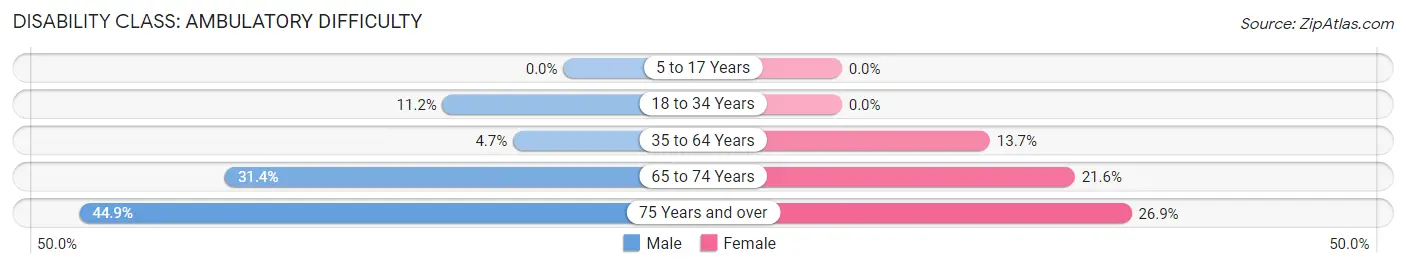
| Age Bracket | Male | Female |
| 5 to 17 Years | 0 (0.0%) | 0 (0.0%) |
| 18 to 34 Years | 40 (11.2%) | 0 (0.0%) |
| 35 to 64 Years | 25 (4.7%) | 79 (13.7%) |
| 65 to 74 Years | 38 (31.4%) | 24 (21.6%) |
| 75 Years and over | 44 (44.9%) | 25 (26.9%) |
Disability Class: Self-Care Difficulty
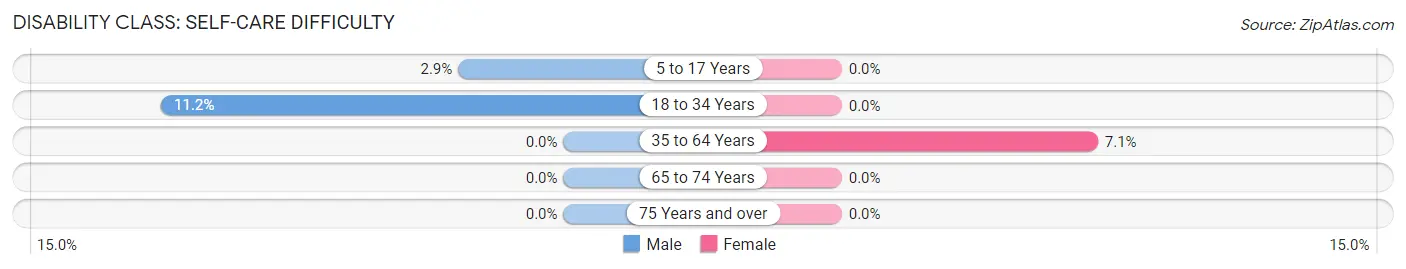
| Age Bracket | Male | Female |
| 5 to 17 Years | 10 (2.9%) | 0 (0.0%) |
| 18 to 34 Years | 40 (11.2%) | 0 (0.0%) |
| 35 to 64 Years | 0 (0.0%) | 41 (7.1%) |
| 65 to 74 Years | 0 (0.0%) | 0 (0.0%) |
| 75 Years and over | 0 (0.0%) | 0 (0.0%) |
Technology Access in Glenrock
Computing Device Access in Glenrock
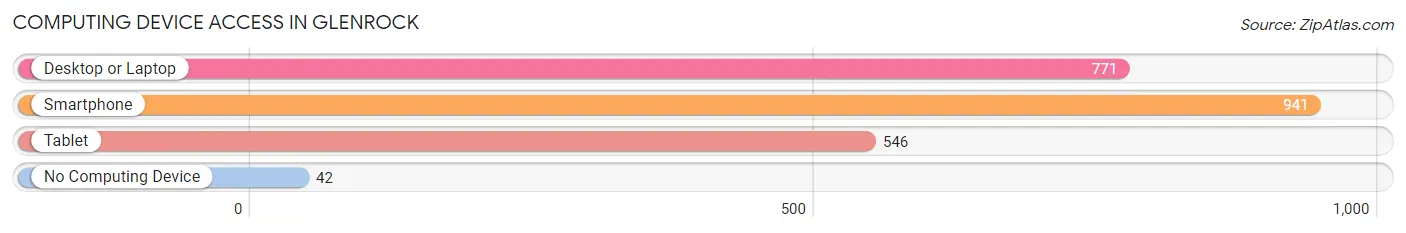
| Device Type | # Households | % Households |
| Desktop or Laptop | 771 | 71.5% |
| Smartphone | 941 | 87.2% |
| Tablet | 546 | 50.6% |
| No Computing Device | 42 | 3.9% |
| Total | 1,079 | 100.0% |
Internet Access in Glenrock
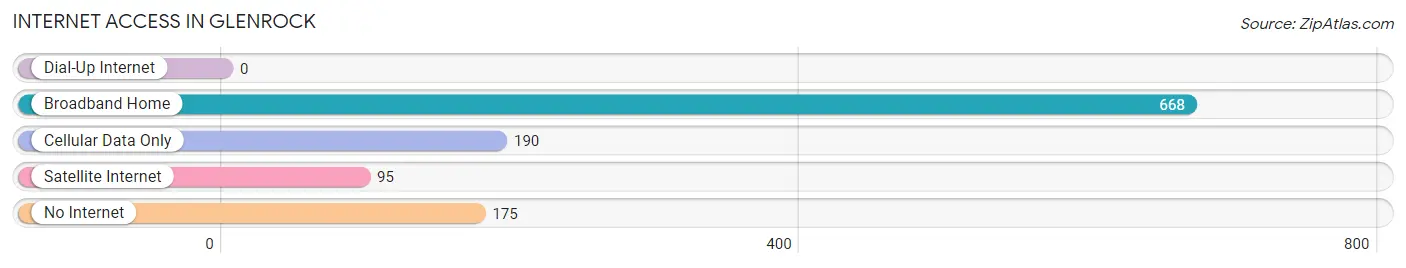
| Internet Type | # Households | % Households |
| Dial-Up Internet | 0 | 0.0% |
| Broadband Home | 668 | 61.9% |
| Cellular Data Only | 190 | 17.6% |
| Satellite Internet | 95 | 8.8% |
| No Internet | 175 | 16.2% |
| Total | 1,079 | 100.0% |
Glenrock Summary
Glenrock is a small town located in Converse County, Wyoming, United States. It is situated along the banks of the North Platte River, approximately 25 miles east of Casper. The town was founded in 1884 and was named after the nearby Glenrock Hills. As of the 2010 census, the population of Glenrock was 1,541.
History
Glenrock was founded in 1884 by the Union Pacific Railroad. The town was named after the nearby Glenrock Hills, which were named by a surveyor for the Union Pacific Railroad. The town was originally a stop on the Union Pacific Railroad, and it quickly grew into a small community.
In the early 1900s, Glenrock was a bustling town with a variety of businesses, including a hotel, a bank, a newspaper, a livery stable, a blacksmith shop, and a saloon. The town also had a school, a post office, and a variety of churches.
In the 1920s, the town began to decline as the railroad industry began to decline. The Great Depression further exacerbated the decline, and by the 1940s, the town was nearly abandoned.
In the 1950s, the town began to experience a resurgence as oil and gas exploration began in the area. The town experienced a boom in the 1970s and 1980s as the oil and gas industry continued to expand.
Geography
Glenrock is located in Converse County, Wyoming, approximately 25 miles east of Casper. The town is situated along the banks of the North Platte River. The town is located at an elevation of 4,890 feet above sea level.
The climate in Glenrock is semi-arid, with hot summers and cold winters. The average annual temperature is 48°F, and the average annual precipitation is 13.5 inches.
Economy
The economy of Glenrock is largely based on the oil and gas industry. The town is home to several oil and gas companies, including Anadarko Petroleum, Devon Energy, and Marathon Oil.
The town is also home to several other businesses, including a grocery store, a hardware store, a bank, and a variety of restaurants.
Demographics
As of the 2010 census, the population of Glenrock was 1,541. The racial makeup of the town was 95.3% White, 0.7% Native American, 0.3% Asian, 0.2% African American, and 3.5% from other races.
The median household income in Glenrock was $45,938, and the median family income was $51,938. The per capita income in Glenrock was $20,938.
Conclusion
Glenrock is a small town located in Converse County, Wyoming. The town was founded in 1884 and was originally a stop on the Union Pacific Railroad. The town experienced a decline in the early 1900s, but experienced a resurgence in the 1950s with the expansion of the oil and gas industry. The economy of Glenrock is largely based on the oil and gas industry, and the town is home to several businesses, including a grocery store, a hardware store, a bank, and a variety of restaurants. As of the 2010 census, the population of Glenrock was 1,541.
Common Questions
What is Per Capita Income in Glenrock?
Per Capita income in Glenrock is $28,514.
What is the Median Family Income in Glenrock?
Median Family Income in Glenrock is $68,409.
What is the Median Household income in Glenrock?
Median Household Income in Glenrock is $64,797.
What is Income or Wage Gap in Glenrock?
Income or Wage Gap in Glenrock is 58.8%.
Women in Glenrock earn 41.2 cents for every dollar earned by a man.
What is Inequality or Gini Index in Glenrock?
Inequality or Gini Index in Glenrock is 0.35.
What is the Total Population of Glenrock?
Total Population of Glenrock is 2,863.
What is the Total Male Population of Glenrock?
Total Male Population of Glenrock is 1,505.
What is the Total Female Population of Glenrock?
Total Female Population of Glenrock is 1,358.
What is the Ratio of Males per 100 Females in Glenrock?
There are 110.82 Males per 100 Females in Glenrock.
What is the Ratio of Females per 100 Males in Glenrock?
There are 90.23 Females per 100 Males in Glenrock.
What is the Median Population Age in Glenrock?
Median Population Age in Glenrock is 41.8 Years.
What is the Average Family Size in Glenrock
Average Family Size in Glenrock is 3.1 People.
What is the Average Household Size in Glenrock
Average Household Size in Glenrock is 2.6 People.
How Large is the Labor Force in Glenrock?
There are 1,482 People in the Labor Forcein in Glenrock.
What is the Percentage of People in the Labor Force in Glenrock?
66.3% of People are in the Labor Force in Glenrock.
What is the Unemployment Rate in Glenrock?
Unemployment Rate in Glenrock is 9.3%.