Johnstown, WY Map & Demographics
Johnstown Map
Johnstown Overview
$33,421
PER CAPITA INCOME
$86,250
AVG FAMILY INCOME
$56,250
AVG HOUSEHOLD INCOME
0.49
INEQUALITY / GINI INDEX
231
TOTAL POPULATION
138
MALE POPULATION
93
FEMALE POPULATION
148.39
MALES / 100 FEMALES
67.39
FEMALES / 100 MALES
53.2
MEDIAN AGE
4.1
AVG FAMILY SIZE
3.1
AVG HOUSEHOLD SIZE
123
LABOR FORCE [ PEOPLE ]
59.7%
PERCENT IN LABOR FORCE
4.9%
UNEMPLOYMENT RATE
Income in Johnstown
Income Overview in Johnstown
Per Capita Income in Johnstown is $33,421, while median incomes of families and households are $86,250 and $56,250 respectively.
| Characteristic | Number | Measure |
| Per Capita Income | 231 | $33,421 |
| Median Family Income | 48 | $86,250 |
| Mean Family Income | 48 | $107,373 |
| Median Household Income | 74 | $56,250 |
| Mean Household Income | 74 | $91,036 |
| Income Deficit | 48 | $0 |
| Wage / Income Gap (%) | 231 | 0.00% |
| Wage / Income Gap ($) | 231 | 100.00¢ per $1 |
| Gini / Inequality Index | 231 | 0.49 |
Earnings by Sex in Johnstown
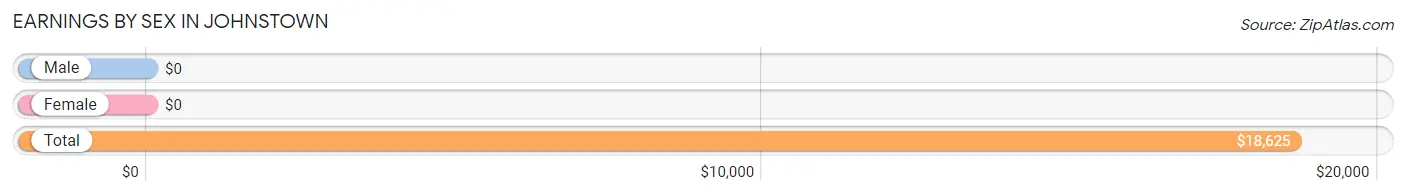
| Sex | Number | Average Earnings |
| Male | 79 (57.7%) | $0 |
| Female | 58 (42.3%) | $0 |
| Total | 137 (100.0%) | $18,625 |
Earnings by Sex by Income Bracket in Johnstown
The most common earnings brackets in Johnstown are $2,500 to $4,999 for men (21 | 26.6%) and $2,499 or less for women (13 | 22.4%).
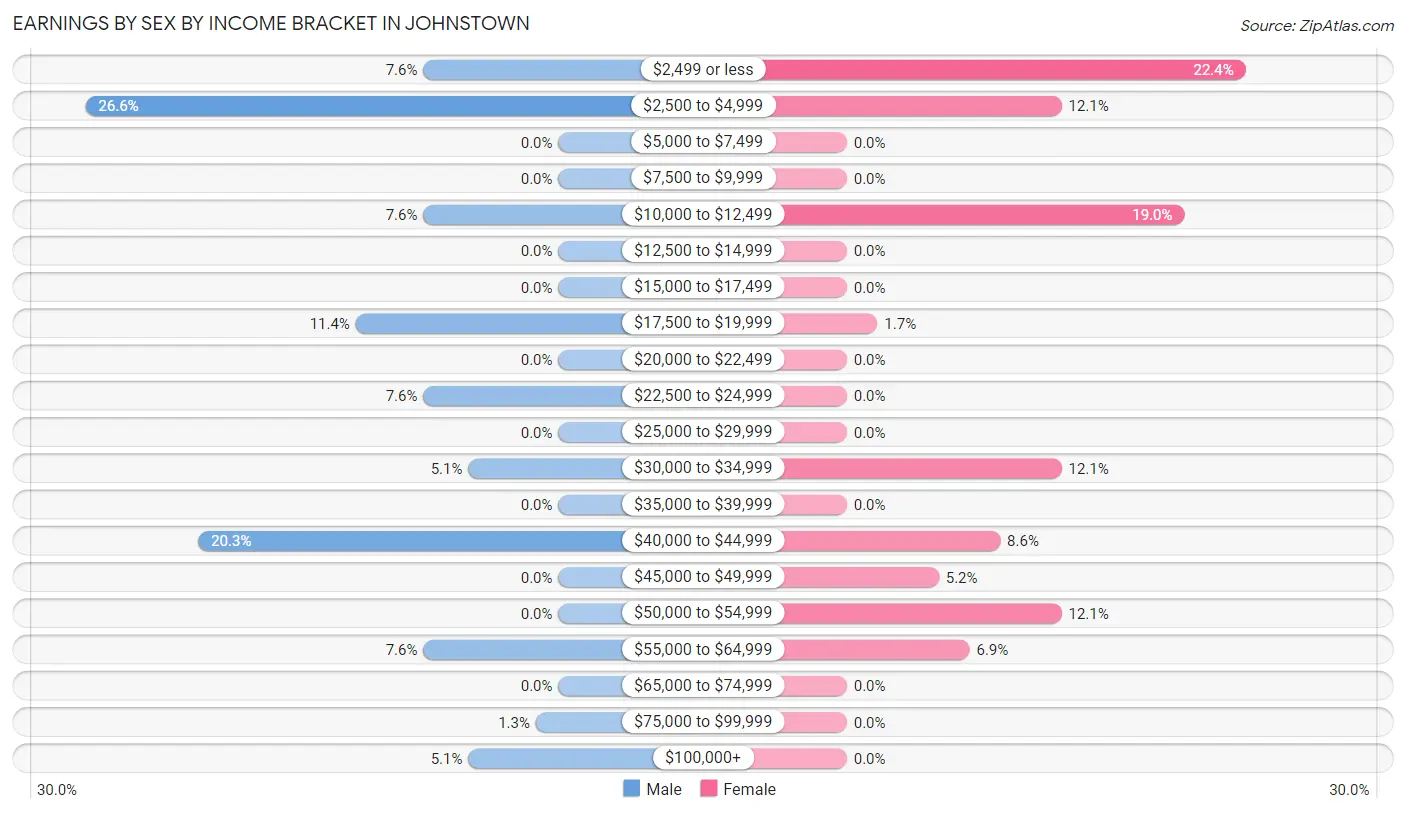
| Income | Male | Female |
| $2,499 or less | 6 (7.6%) | 13 (22.4%) |
| $2,500 to $4,999 | 21 (26.6%) | 7 (12.1%) |
| $5,000 to $7,499 | 0 (0.0%) | 0 (0.0%) |
| $7,500 to $9,999 | 0 (0.0%) | 0 (0.0%) |
| $10,000 to $12,499 | 6 (7.6%) | 11 (19.0%) |
| $12,500 to $14,999 | 0 (0.0%) | 0 (0.0%) |
| $15,000 to $17,499 | 0 (0.0%) | 0 (0.0%) |
| $17,500 to $19,999 | 9 (11.4%) | 1 (1.7%) |
| $20,000 to $22,499 | 0 (0.0%) | 0 (0.0%) |
| $22,500 to $24,999 | 6 (7.6%) | 0 (0.0%) |
| $25,000 to $29,999 | 0 (0.0%) | 0 (0.0%) |
| $30,000 to $34,999 | 4 (5.1%) | 7 (12.1%) |
| $35,000 to $39,999 | 0 (0.0%) | 0 (0.0%) |
| $40,000 to $44,999 | 16 (20.3%) | 5 (8.6%) |
| $45,000 to $49,999 | 0 (0.0%) | 3 (5.2%) |
| $50,000 to $54,999 | 0 (0.0%) | 7 (12.1%) |
| $55,000 to $64,999 | 6 (7.6%) | 4 (6.9%) |
| $65,000 to $74,999 | 0 (0.0%) | 0 (0.0%) |
| $75,000 to $99,999 | 1 (1.3%) | 0 (0.0%) |
| $100,000+ | 4 (5.1%) | 0 (0.0%) |
| Total | 79 (100.0%) | 58 (100.0%) |
Earnings by Sex by Educational Attainment in Johnstown
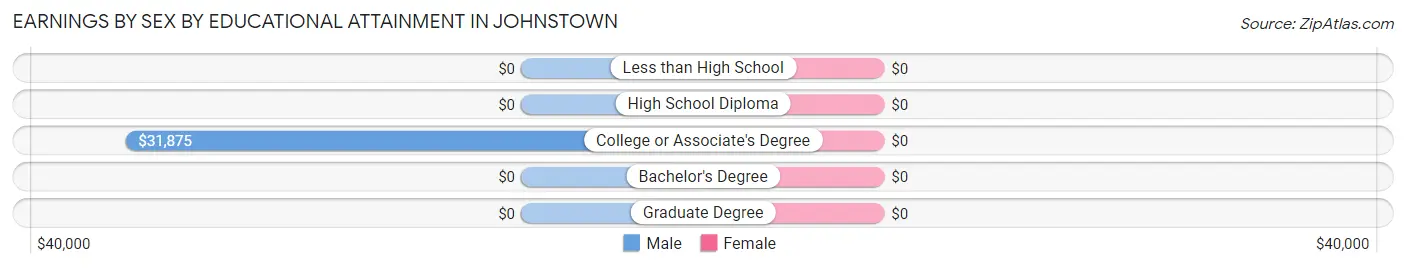
| Educational Attainment | Male Income | Female Income |
| Less than High School | - | - |
| High School Diploma | - | - |
| College or Associate's Degree | $31,875 | $0 |
| Bachelor's Degree | - | - |
| Graduate Degree | - | - |
| Total | $24,167 | $34,821 |
Family Income in Johnstown
Family Income Brackets in Johnstown
According to the Johnstown family income data, there are 15 families falling into the $75,000 to $99,999 income range, which is the most common income bracket and makes up 31.2% of all families.
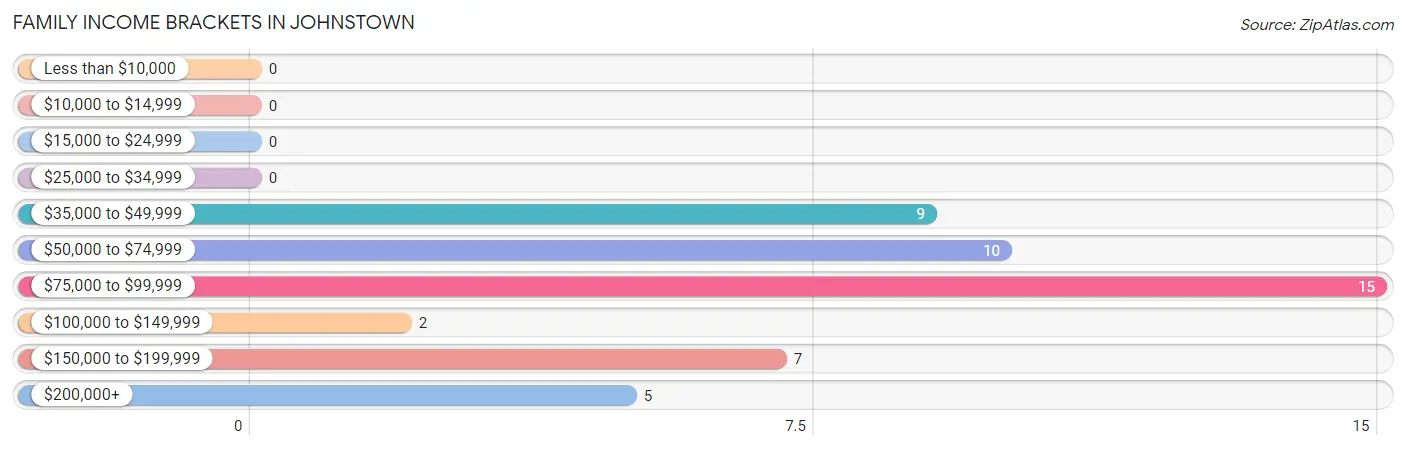
| Income Bracket | # Families | % Families |
| Less than $10,000 | 0 | 0.0% |
| $10,000 to $14,999 | 0 | 0.0% |
| $15,000 to $24,999 | 0 | 0.0% |
| $25,000 to $34,999 | 0 | 0.0% |
| $35,000 to $49,999 | 9 | 18.8% |
| $50,000 to $74,999 | 10 | 20.8% |
| $75,000 to $99,999 | 15 | 31.3% |
| $100,000 to $149,999 | 2 | 4.2% |
| $150,000 to $199,999 | 7 | 14.6% |
| $200,000+ | 5 | 10.4% |
Family Income by Famaliy Size in Johnstown
| Income Bracket | # Families | Median Income |
| 2-Person Families | 23 (47.9%) | $0 |
| 3-Person Families | 9 (18.8%) | $0 |
| 4-Person Families | 7 (14.6%) | $0 |
| 5-Person Families | 8 (16.7%) | $0 |
| 6-Person Families | 0 (0.0%) | $0 |
| 7+ Person Families | 1 (2.1%) | $0 |
| Total | 48 (100.0%) | $86,250 |
Family Income by Number of Earners in Johnstown

| Number of Earners | # Families | Median Income |
| No Earners | 1 (2.1%) | $0 |
| 1 Earner | 12 (25.0%) | $0 |
| 2 Earners | 13 (27.1%) | $57,813 |
| 3+ Earners | 22 (45.8%) | $81,000 |
| Total | 48 (100.0%) | $86,250 |
Household Income in Johnstown
Household Income Brackets in Johnstown
With 15 households falling in the category, the $75,000 to $99,999 income range is the most frequent in Johnstown, accounting for 20.3% of all households.
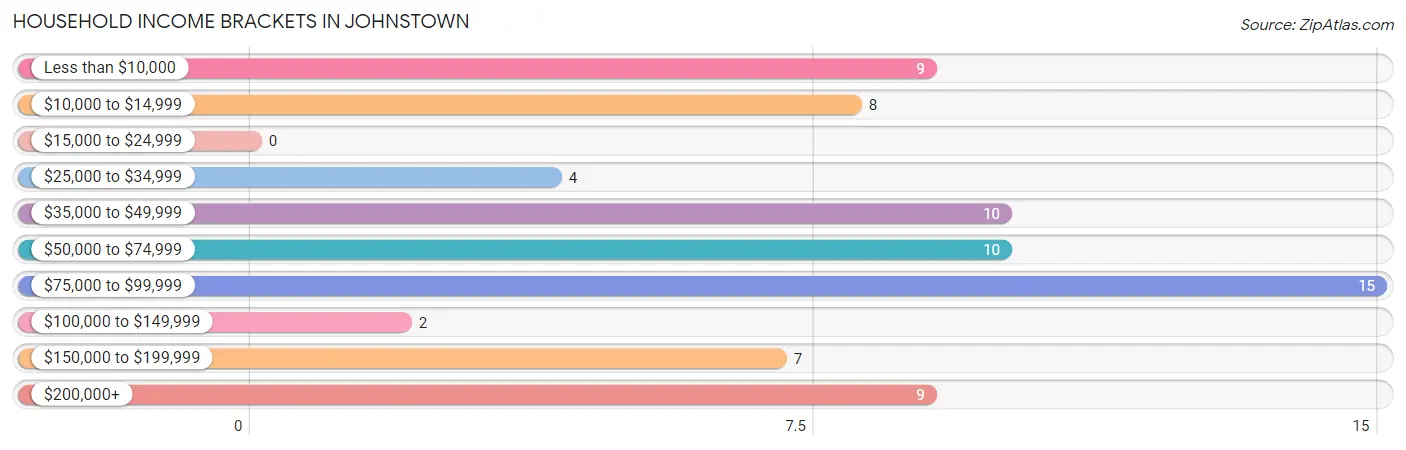
| Income Bracket | # Households | % Households |
| Less than $10,000 | 9 | 12.2% |
| $10,000 to $14,999 | 8 | 10.8% |
| $15,000 to $24,999 | 0 | 0.0% |
| $25,000 to $34,999 | 4 | 5.4% |
| $35,000 to $49,999 | 10 | 13.5% |
| $50,000 to $74,999 | 10 | 13.5% |
| $75,000 to $99,999 | 15 | 20.3% |
| $100,000 to $149,999 | 2 | 2.7% |
| $150,000 to $199,999 | 7 | 9.5% |
| $200,000+ | 9 | 12.2% |
Household Income by Householder Age in Johnstown
The median household income in Johnstown is $56,250, with the highest median household income of $90,521 found in the 45 to 64 years age bracket for the primary householder. A total of 43 households (58.1%) fall into this category.
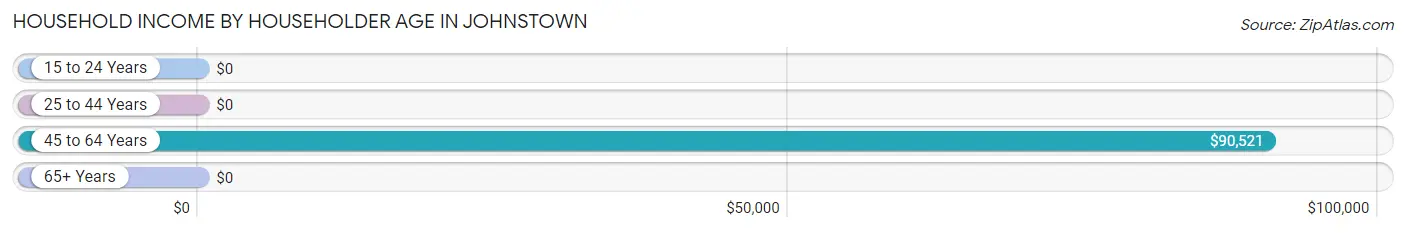
| Income Bracket | # Households | Median Income |
| 15 to 24 Years | 0 (0.0%) | $0 |
| 25 to 44 Years | 16 (21.6%) | $0 |
| 45 to 64 Years | 43 (58.1%) | $90,521 |
| 65+ Years | 15 (20.3%) | $0 |
| Total | 74 (100.0%) | $56,250 |
Poverty in Johnstown
Income Below Poverty by Sex and Age in Johnstown
With 5.8% poverty level for males and 18.3% for females among the residents of Johnstown, 25 to 34 year old males and 75 year old and over females are the most vulnerable to poverty, with 8 males (32.0%) and 9 females (90.0%) in their respective age groups living below the poverty level.
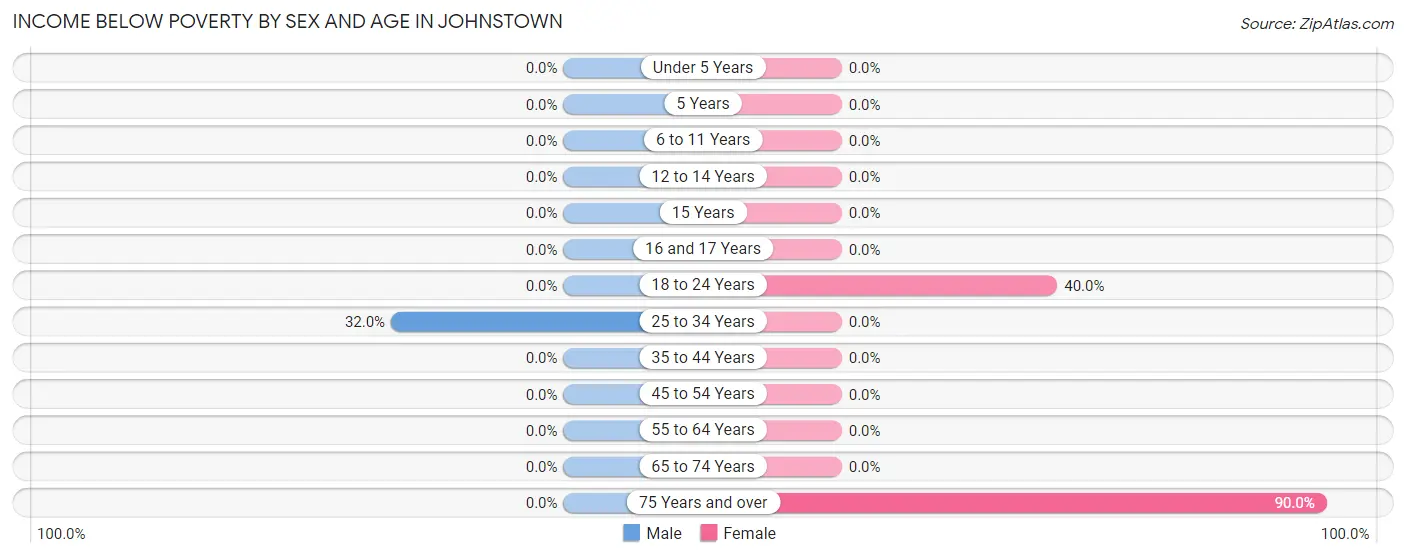
| Age Bracket | Male | Female |
| Under 5 Years | 0 (0.0%) | 0 (0.0%) |
| 5 Years | 0 (0.0%) | 0 (0.0%) |
| 6 to 11 Years | 0 (0.0%) | 0 (0.0%) |
| 12 to 14 Years | 0 (0.0%) | 0 (0.0%) |
| 15 Years | 0 (0.0%) | 0 (0.0%) |
| 16 and 17 Years | 0 (0.0%) | 0 (0.0%) |
| 18 to 24 Years | 0 (0.0%) | 8 (40.0%) |
| 25 to 34 Years | 8 (32.0%) | 0 (0.0%) |
| 35 to 44 Years | 0 (0.0%) | 0 (0.0%) |
| 45 to 54 Years | 0 (0.0%) | 0 (0.0%) |
| 55 to 64 Years | 0 (0.0%) | 0 (0.0%) |
| 65 to 74 Years | 0 (0.0%) | 0 (0.0%) |
| 75 Years and over | 0 (0.0%) | 9 (90.0%) |
| Total | 8 (5.8%) | 17 (18.3%) |
Income Above Poverty by Sex and Age in Johnstown
According to the poverty statistics in Johnstown, males aged under 5 years and females aged under 5 years are the age groups that are most secure financially, with 100.0% of males and 100.0% of females in these age groups living above the poverty line.
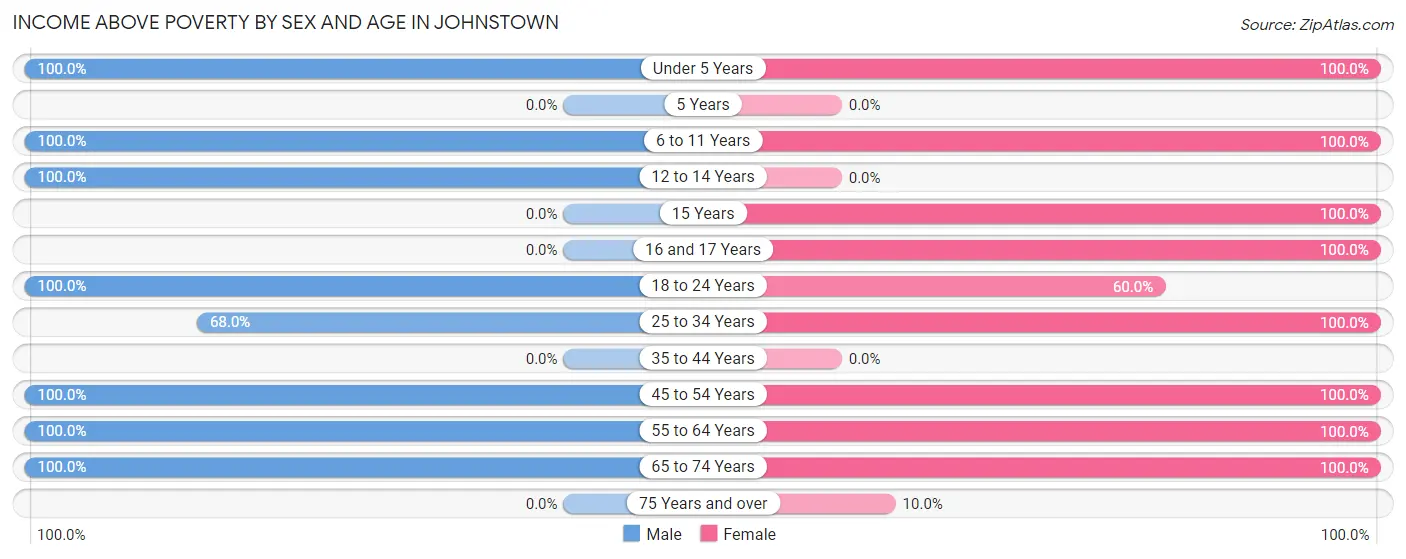
| Age Bracket | Male | Female |
| Under 5 Years | 4 (100.0%) | 3 (100.0%) |
| 5 Years | 0 (0.0%) | 0 (0.0%) |
| 6 to 11 Years | 7 (100.0%) | 7 (100.0%) |
| 12 to 14 Years | 3 (100.0%) | 0 (0.0%) |
| 15 Years | 0 (0.0%) | 1 (100.0%) |
| 16 and 17 Years | 0 (0.0%) | 8 (100.0%) |
| 18 to 24 Years | 13 (100.0%) | 12 (60.0%) |
| 25 to 34 Years | 17 (68.0%) | 4 (100.0%) |
| 35 to 44 Years | 0 (0.0%) | 0 (0.0%) |
| 45 to 54 Years | 16 (100.0%) | 16 (100.0%) |
| 55 to 64 Years | 20 (100.0%) | 17 (100.0%) |
| 65 to 74 Years | 50 (100.0%) | 7 (100.0%) |
| 75 Years and over | 0 (0.0%) | 1 (10.0%) |
| Total | 130 (94.2%) | 76 (81.7%) |
Income Below Poverty Among Married-Couple Families in Johnstown
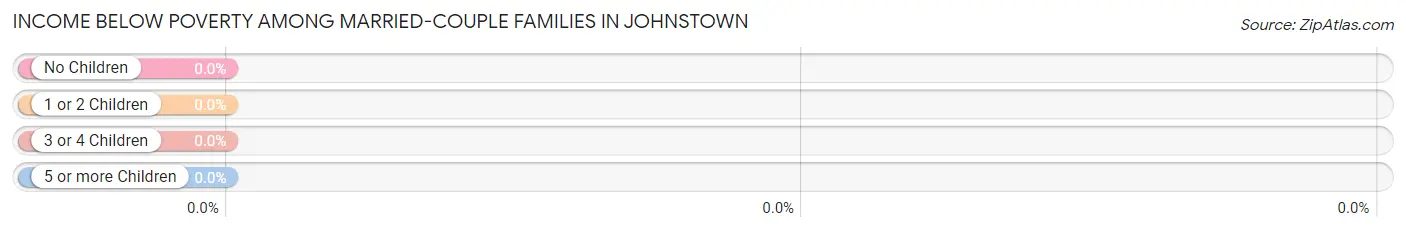
| Children | Above Poverty | Below Poverty |
| No Children | 27 (100.0%) | 0 (0.0%) |
| 1 or 2 Children | 12 (100.0%) | 0 (0.0%) |
| 3 or 4 Children | 3 (100.0%) | 0 (0.0%) |
| 5 or more Children | 0 (0.0%) | 0 (0.0%) |
| Total | 42 (100.0%) | 0 (0.0%) |
Income Below Poverty Among Single-Parent Households in Johnstown
| Children | Single Father | Single Mother |
| No Children | 0 (0.0%) | 0 (0.0%) |
| 1 or 2 Children | 0 (0.0%) | 0 (0.0%) |
| 3 or 4 Children | 0 (0.0%) | 0 (0.0%) |
| 5 or more Children | 0 (0.0%) | 0 (0.0%) |
| Total | 0 (0.0%) | 0 (0.0%) |
Income Below Poverty Among Married-Couple vs Single-Parent Households in Johnstown
| Children | Married-Couple Families | Single-Parent Households |
| No Children | 0 (0.0%) | 0 (0.0%) |
| 1 or 2 Children | 0 (0.0%) | 0 (0.0%) |
| 3 or 4 Children | 0 (0.0%) | 0 (0.0%) |
| 5 or more Children | 0 (0.0%) | 0 (0.0%) |
| Total | 0 (0.0%) | 0 (0.0%) |
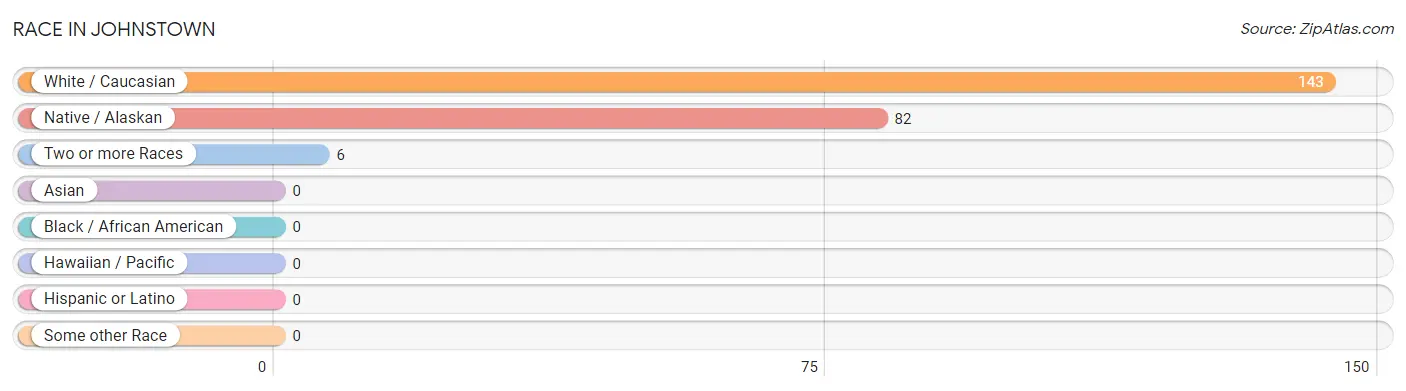
Race in Johnstown
The most populous races in Johnstown are White / Caucasian (143 | 61.9%), Native / Alaskan (82 | 35.5%), and Two or more Races (6 | 2.6%).
| Race | # Population | % Population |
| Asian | 0 | 0.0% |
| Black / African American | 0 | 0.0% |
| Hawaiian / Pacific | 0 | 0.0% |
| Hispanic or Latino | 0 | 0.0% |
| Native / Alaskan | 82 | 35.5% |
| White / Caucasian | 143 | 61.9% |
| Two or more Races | 6 | 2.6% |
| Some other Race | 0 | 0.0% |
| Total | 231 | 100.0% |
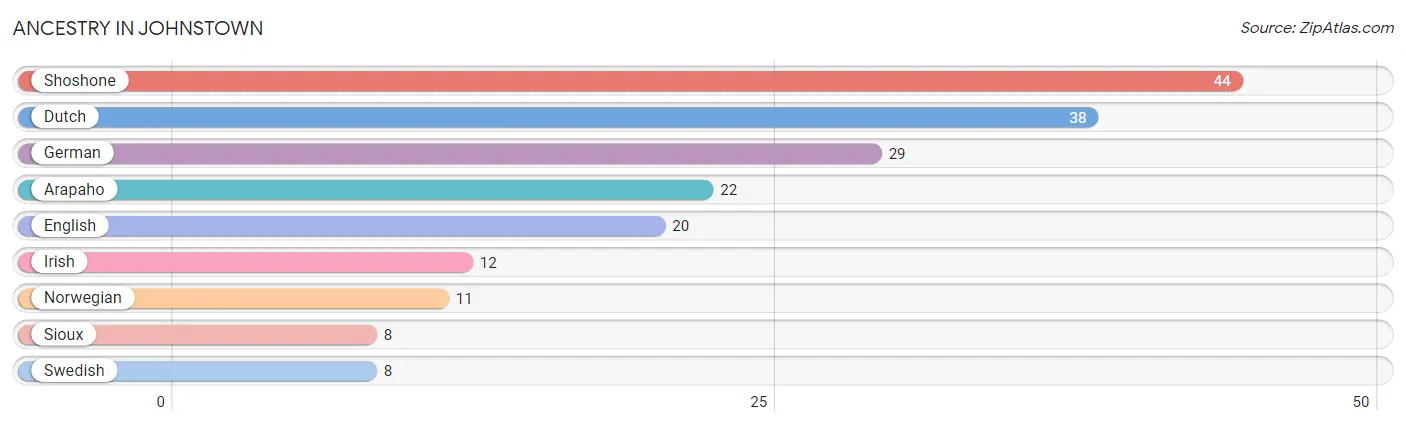
Ancestry in Johnstown
The most populous ancestries reported in Johnstown are Shoshone (44 | 19.1%), Dutch (38 | 16.5%), German (29 | 12.6%), Arapaho (22 | 9.5%), and English (20 | 8.7%), together accounting for 66.2% of all Johnstown residents.
| Ancestry | # Population | % Population |
| Arapaho | 22 | 9.5% |
| Dutch | 38 | 16.5% |
| English | 20 | 8.7% |
| German | 29 | 12.6% |
| Irish | 12 | 5.2% |
| Norwegian | 11 | 4.8% |
| Shoshone | 44 | 19.1% |
| Sioux | 8 | 3.5% |
| Swedish | 8 | 3.5% | View All 9 Rows |
Immigrants in Johnstown

| Immigration Origin | # Population | % Population | View All 0 Rows |
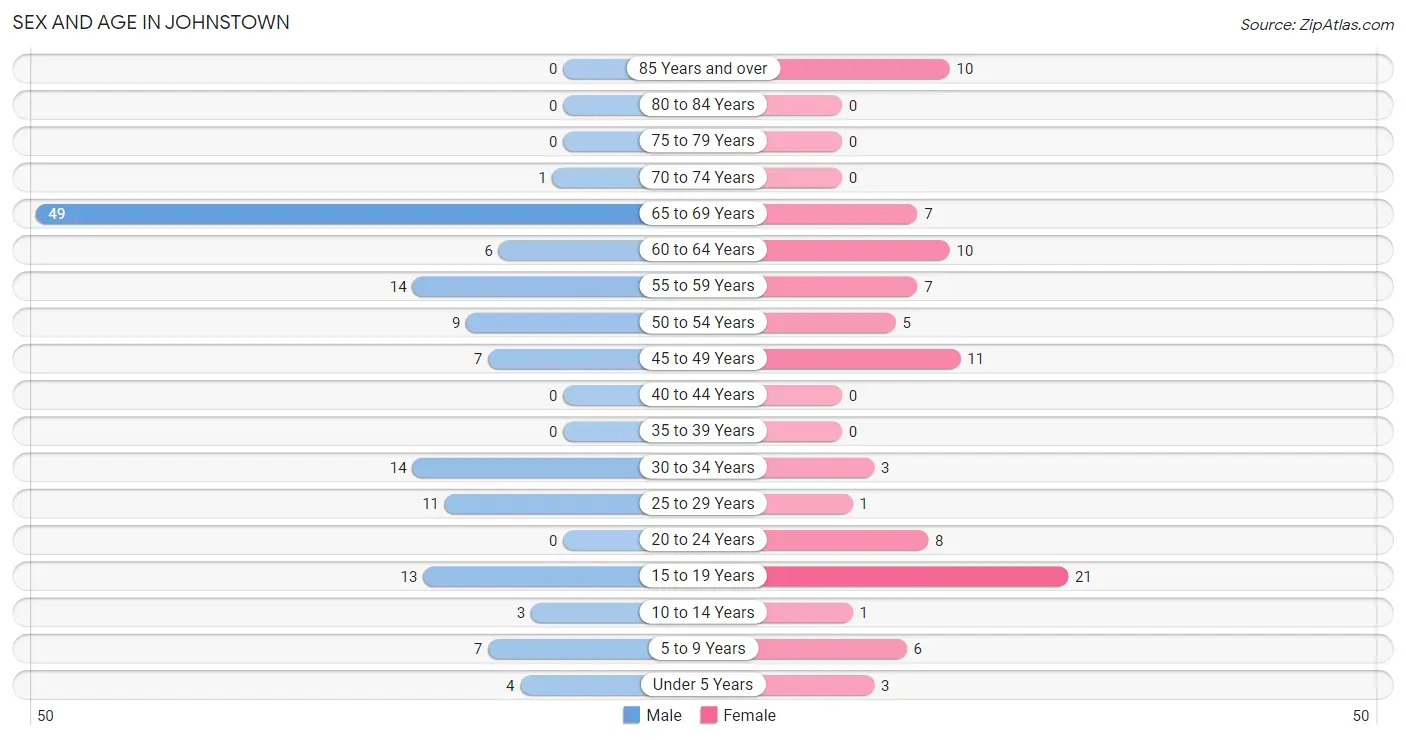
Sex and Age in Johnstown
Sex and Age in Johnstown
The most populous age groups in Johnstown are 65 to 69 Years (49 | 35.5%) for men and 15 to 19 Years (21 | 22.6%) for women.
| Age Bracket | Male | Female |
| Under 5 Years | 4 (2.9%) | 3 (3.2%) |
| 5 to 9 Years | 7 (5.1%) | 6 (6.5%) |
| 10 to 14 Years | 3 (2.2%) | 1 (1.1%) |
| 15 to 19 Years | 13 (9.4%) | 21 (22.6%) |
| 20 to 24 Years | 0 (0.0%) | 8 (8.6%) |
| 25 to 29 Years | 11 (8.0%) | 1 (1.1%) |
| 30 to 34 Years | 14 (10.1%) | 3 (3.2%) |
| 35 to 39 Years | 0 (0.0%) | 0 (0.0%) |
| 40 to 44 Years | 0 (0.0%) | 0 (0.0%) |
| 45 to 49 Years | 7 (5.1%) | 11 (11.8%) |
| 50 to 54 Years | 9 (6.5%) | 5 (5.4%) |
| 55 to 59 Years | 14 (10.1%) | 7 (7.5%) |
| 60 to 64 Years | 6 (4.3%) | 10 (10.7%) |
| 65 to 69 Years | 49 (35.5%) | 7 (7.5%) |
| 70 to 74 Years | 1 (0.7%) | 0 (0.0%) |
| 75 to 79 Years | 0 (0.0%) | 0 (0.0%) |
| 80 to 84 Years | 0 (0.0%) | 0 (0.0%) |
| 85 Years and over | 0 (0.0%) | 10 (10.7%) |
| Total | 138 (100.0%) | 93 (100.0%) |
Families and Households in Johnstown
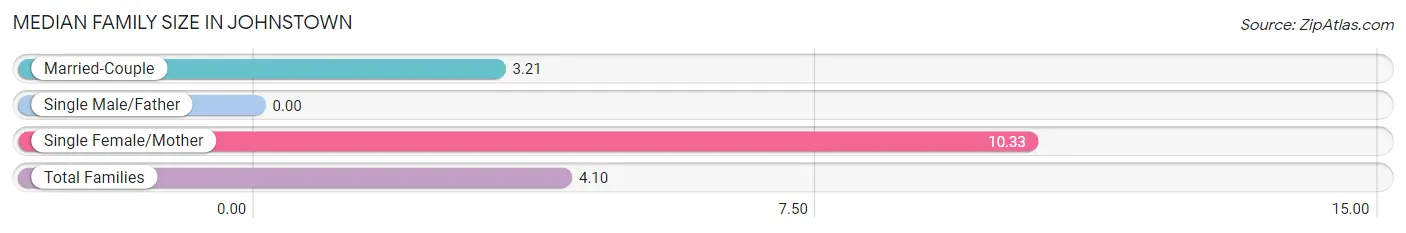
Median Family Size in Johnstown
| Family Type | # Families | Family Size |
| Married-Couple | 42 (87.5%) | 3.21 |
| Single Male/Father | 0 (0.0%) | - |
| Single Female/Mother | 6 (12.5%) | 10.33 |
| Total Families | 48 (100.0%) | 4.10 |
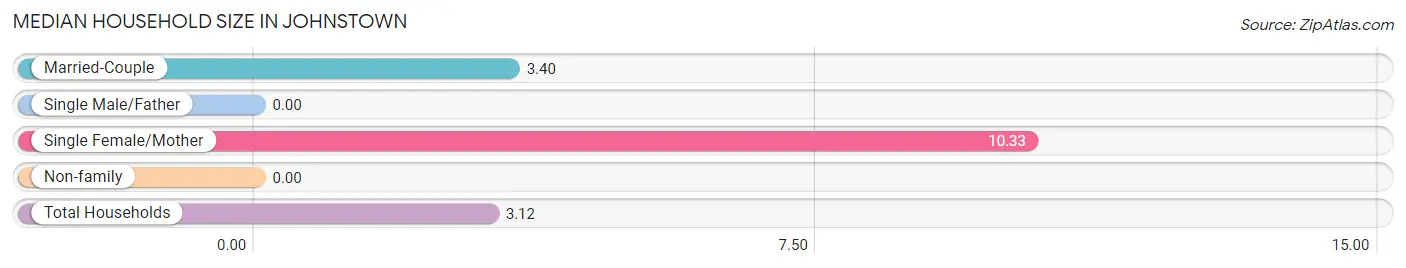
Median Household Size in Johnstown
| Household Type | # Households | Household Size |
| Married-Couple | 42 (56.8%) | 3.40 |
| Single Male/Father | 0 (0.0%) | - |
| Single Female/Mother | 6 (8.1%) | 10.33 |
| Non-family | 26 (35.1%) | - |
| Total Households | 74 (100.0%) | 3.12 |
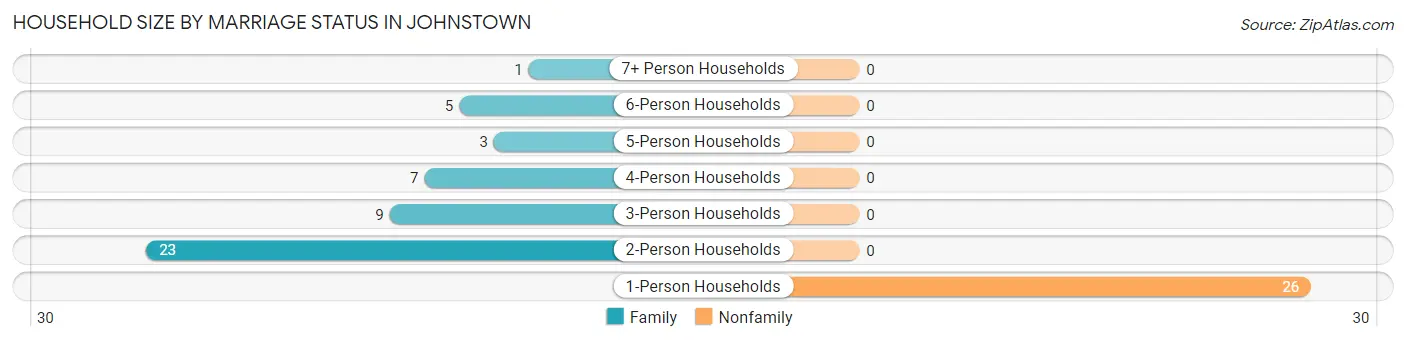
Household Size by Marriage Status in Johnstown
Out of a total of 74 households in Johnstown, 48 (64.9%) are family households, while 26 (35.1%) are nonfamily households. The most numerous type of family households are 2-person households, comprising 23, and the most common type of nonfamily households are 1-person households, comprising 26.
| Household Size | Family Households | Nonfamily Households |
| 1-Person Households | - | 26 (35.1%) |
| 2-Person Households | 23 (31.1%) | 0 (0.0%) |
| 3-Person Households | 9 (12.2%) | 0 (0.0%) |
| 4-Person Households | 7 (9.5%) | 0 (0.0%) |
| 5-Person Households | 3 (4.1%) | 0 (0.0%) |
| 6-Person Households | 5 (6.8%) | 0 (0.0%) |
| 7+ Person Households | 1 (1.3%) | 0 (0.0%) |
| Total | 48 (64.9%) | 26 (35.1%) |
Female Fertility in Johnstown
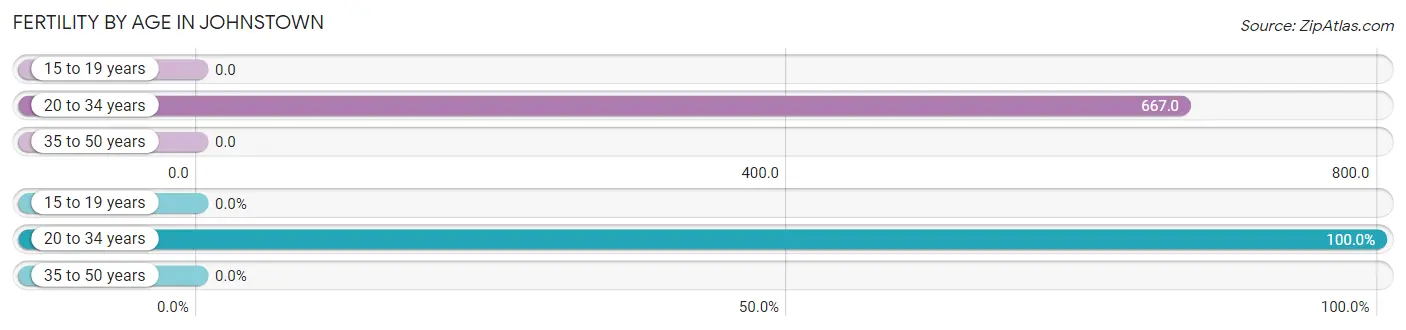
Fertility by Age in Johnstown
Average fertility rate in Johnstown is 182.0 births per 1,000 women. Women in the age bracket of 20 to 34 years have the highest fertility rate with 667.0 births per 1,000 women. Women in the age bracket of 20 to 34 years acount for 100.0% of all women with births.
| Age Bracket | Women with Births | Births / 1,000 Women |
| 15 to 19 years | 0 (0.0%) | 0.0 |
| 20 to 34 years | 8 (100.0%) | 667.0 |
| 35 to 50 years | 0 (0.0%) | 0.0 |
| Total | 8 (100.0%) | 182.0 |
Fertility by Age by Marriage Status in Johnstown
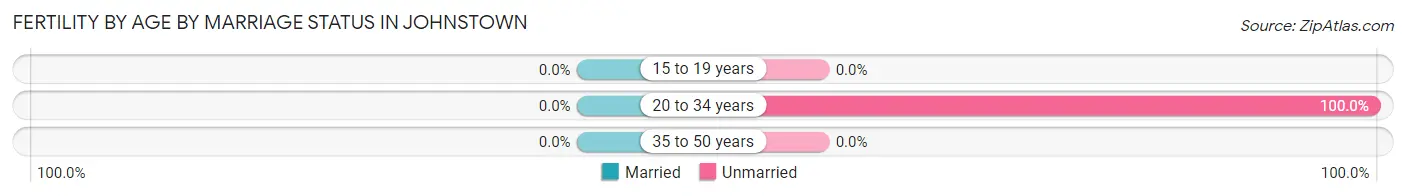
| Age Bracket | Married | Unmarried |
| 15 to 19 years | 0 (0.0%) | 0 (0.0%) |
| 20 to 34 years | 0 (0.0%) | 8 (100.0%) |
| 35 to 50 years | 0 (0.0%) | 0 (0.0%) |
| Total | 0 (0.0%) | 8 (100.0%) |
Fertility by Education in Johnstown
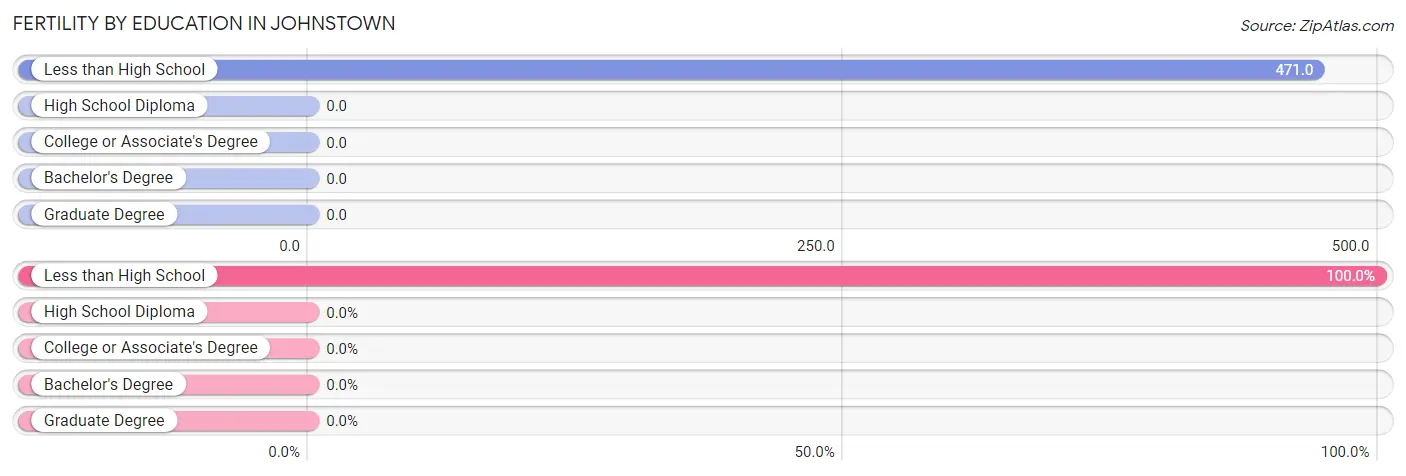
| Educational Attainment | Women with Births | Births / 1,000 Women |
| Less than High School | 8 (100.0%) | 471.0 |
| High School Diploma | 0 (0.0%) | 0.0 |
| College or Associate's Degree | 0 (0.0%) | 0.0 |
| Bachelor's Degree | 0 (0.0%) | 0.0 |
| Graduate Degree | 0 (0.0%) | 0.0 |
| Total | 8 (100.0%) | 182.0 |
Fertility by Education by Marriage Status in Johnstown
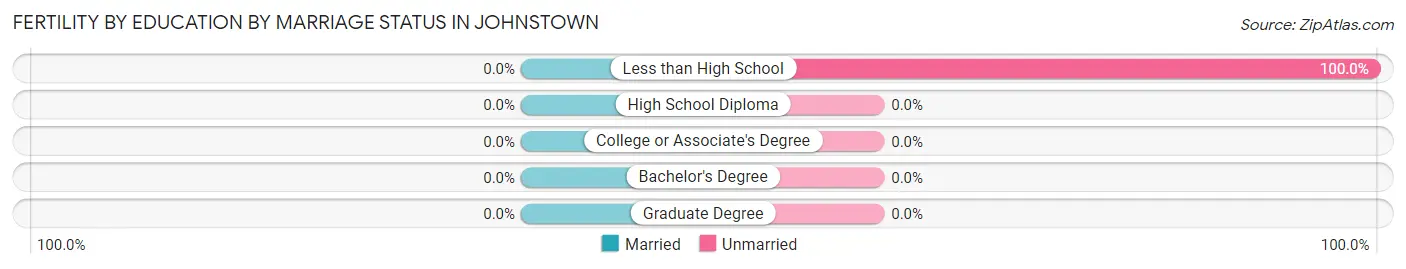
| Educational Attainment | Married | Unmarried |
| Less than High School | 0 (0.0%) | 8 (100.0%) |
| High School Diploma | 0 (0.0%) | 0 (0.0%) |
| College or Associate's Degree | 0 (0.0%) | 0 (0.0%) |
| Bachelor's Degree | 0 (0.0%) | 0 (0.0%) |
| Graduate Degree | 0 (0.0%) | 0 (0.0%) |
| Total | 0 (0.0%) | 8 (100.0%) |
Employment Characteristics in Johnstown
Employment by Class of Employer in Johnstown
Among the 101 employed individuals in Johnstown, private company employees (57 | 56.4%), self-employed (not incorporated) (19 | 18.8%), and local government employees (7 | 6.9%) make up the most common classes of employment.
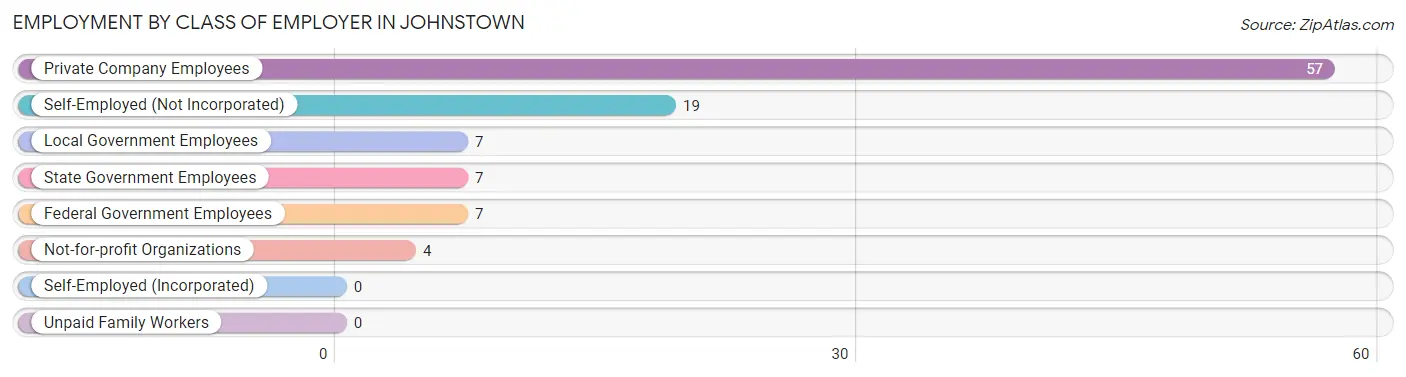
| Employer Class | # Employees | % Employees |
| Private Company Employees | 57 | 56.4% |
| Self-Employed (Incorporated) | 0 | 0.0% |
| Self-Employed (Not Incorporated) | 19 | 18.8% |
| Not-for-profit Organizations | 4 | 4.0% |
| Local Government Employees | 7 | 6.9% |
| State Government Employees | 7 | 6.9% |
| Federal Government Employees | 7 | 6.9% |
| Unpaid Family Workers | 0 | 0.0% |
| Total | 101 | 100.0% |
Employment Status by Age in Johnstown
According to the labor force statistics for Johnstown, out of the total population over 16 years of age (206), 59.7% or 123 individuals are in the labor force, with 4.9% or 6 of them unemployed. The age group with the highest labor force participation rate is 25 to 29 years, with 100.0% or 12 individuals in the labor force. Within the labor force, the 16 to 19 years age range has the highest percentage of unemployed individuals, with 24.0% or 6 of them being unemployed.
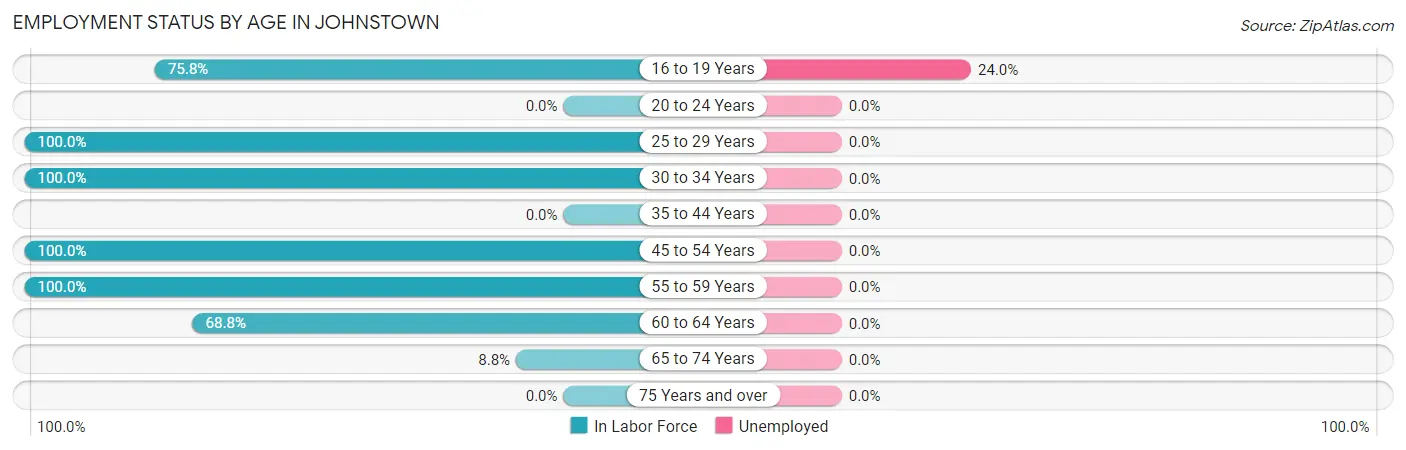
| Age Bracket | In Labor Force | Unemployed |
| 16 to 19 Years | 25 (75.8%) | 6 (24.0%) |
| 20 to 24 Years | 0 (0.0%) | 0 (0.0%) |
| 25 to 29 Years | 12 (100.0%) | 0 (0.0%) |
| 30 to 34 Years | 17 (100.0%) | 0 (0.0%) |
| 35 to 44 Years | 0 (0.0%) | 0 (0.0%) |
| 45 to 54 Years | 32 (100.0%) | 0 (0.0%) |
| 55 to 59 Years | 21 (100.0%) | 0 (0.0%) |
| 60 to 64 Years | 11 (68.8%) | 0 (0.0%) |
| 65 to 74 Years | 5 (8.8%) | 0 (0.0%) |
| 75 Years and over | 0 (0.0%) | 0 (0.0%) |
| Total | 123 (59.7%) | 6 (4.9%) |
Employment Status by Educational Attainment in Johnstown
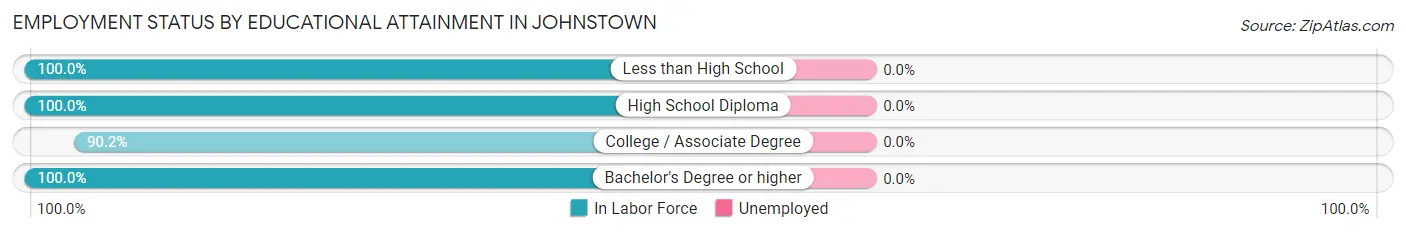
| Educational Attainment | In Labor Force | Unemployed |
| Less than High School | 6 (100.0%) | 0 (0.0%) |
| High School Diploma | 25 (100.0%) | 0 (0.0%) |
| College / Associate Degree | 46 (90.2%) | 0 (0.0%) |
| Bachelor's Degree or higher | 16 (100.0%) | 0 (0.0%) |
| Total | 93 (94.9%) | 0 (0.0%) |
Employment Occupations by Sex in Johnstown
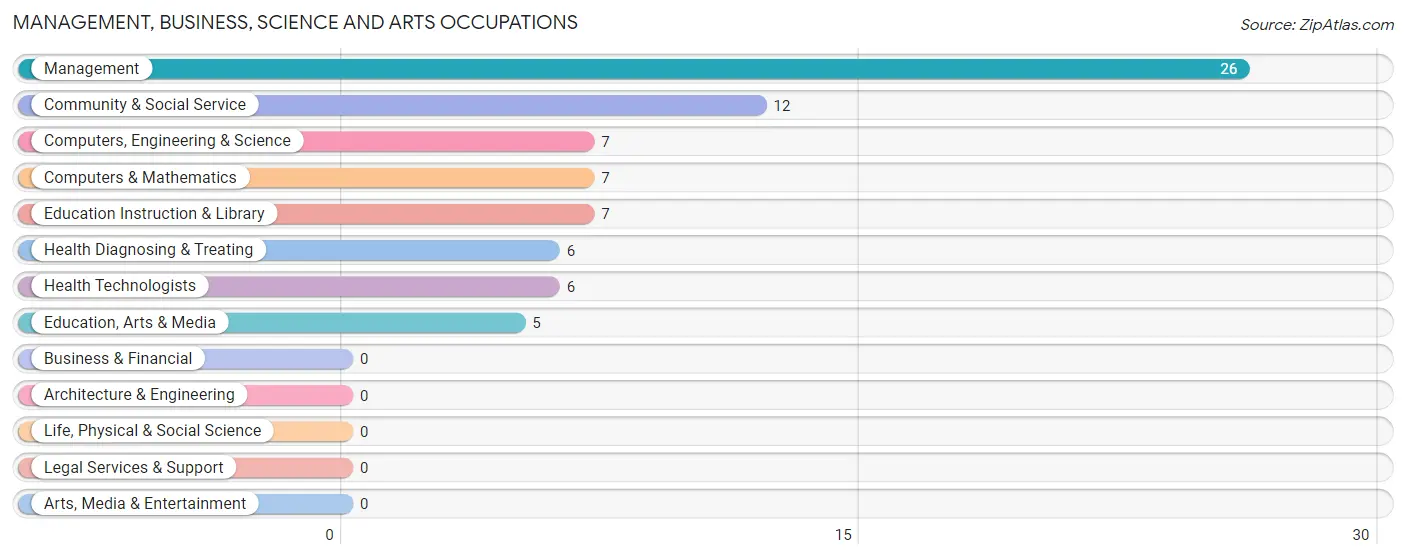
Management, Business, Science and Arts Occupations
The most common Management, Business, Science and Arts occupations in Johnstown are Management (26 | 22.2%), Community & Social Service (12 | 10.3%), Computers, Engineering & Science (7 | 6.0%), Computers & Mathematics (7 | 6.0%), and Education Instruction & Library (7 | 6.0%).
Management, Business, Science and Arts Occupations by Sex
Within the Management, Business, Science and Arts occupations in Johnstown, the most male-oriented occupations are Health Diagnosing & Treating (100.0%), Health Technologists (100.0%), and Education Instruction & Library (85.7%), while the most female-oriented occupations are Computers, Engineering & Science (100.0%), Computers & Mathematics (100.0%), and Education, Arts & Media (100.0%).
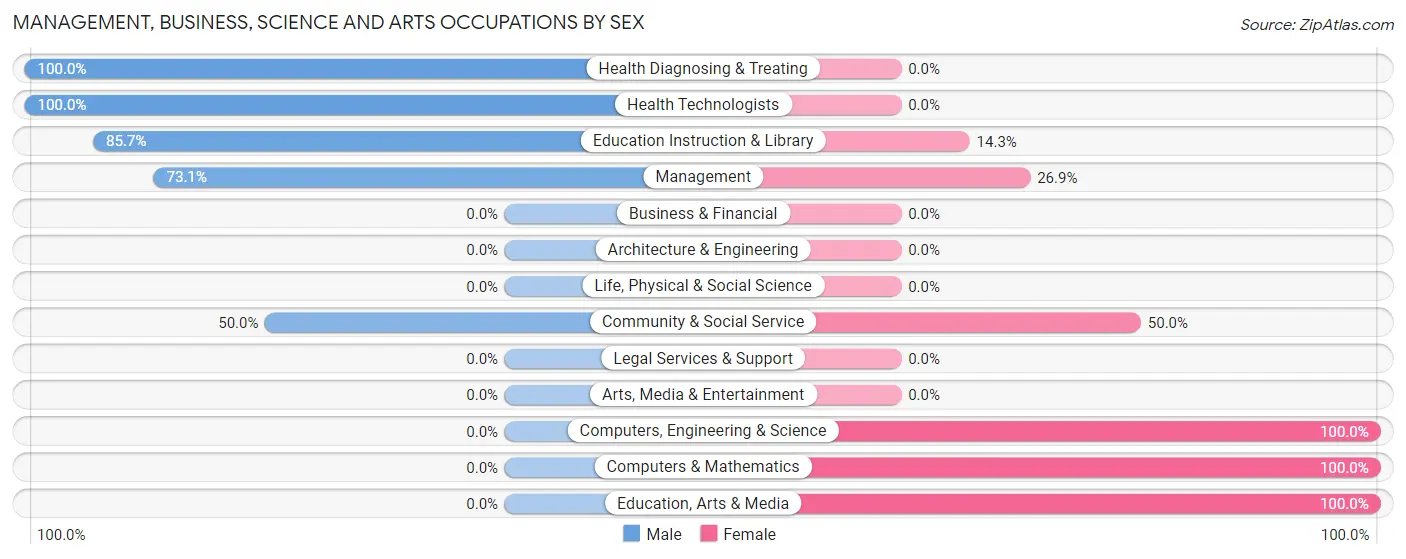
| Occupation | Male | Female |
| Management | 19 (73.1%) | 7 (26.9%) |
| Business & Financial | 0 (0.0%) | 0 (0.0%) |
| Computers, Engineering & Science | 0 (0.0%) | 7 (100.0%) |
| Computers & Mathematics | 0 (0.0%) | 7 (100.0%) |
| Architecture & Engineering | 0 (0.0%) | 0 (0.0%) |
| Life, Physical & Social Science | 0 (0.0%) | 0 (0.0%) |
| Community & Social Service | 6 (50.0%) | 6 (50.0%) |
| Education, Arts & Media | 0 (0.0%) | 5 (100.0%) |
| Legal Services & Support | 0 (0.0%) | 0 (0.0%) |
| Education Instruction & Library | 6 (85.7%) | 1 (14.3%) |
| Arts, Media & Entertainment | 0 (0.0%) | 0 (0.0%) |
| Health Diagnosing & Treating | 6 (100.0%) | 0 (0.0%) |
| Health Technologists | 6 (100.0%) | 0 (0.0%) |
| Total (Category) | 31 (60.8%) | 20 (39.2%) |
| Total (Overall) | 79 (67.5%) | 38 (32.5%) |
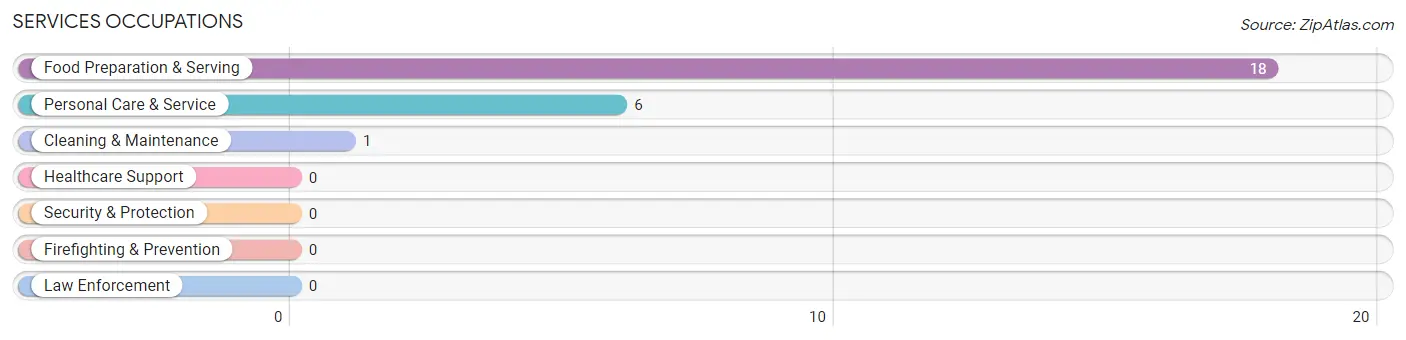
Services Occupations
The most common Services occupations in Johnstown are Food Preparation & Serving (18 | 15.4%), Personal Care & Service (6 | 5.1%), and Cleaning & Maintenance (1 | 0.9%).
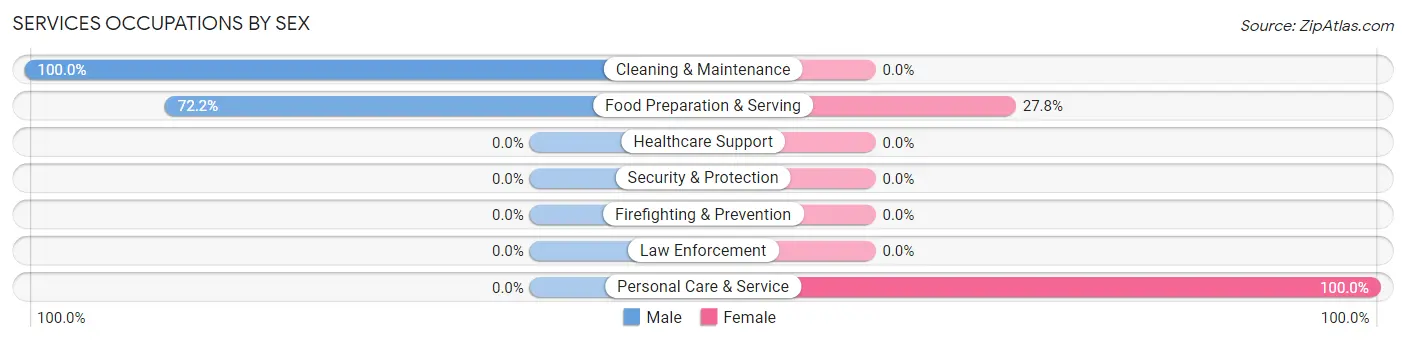
Services Occupations by Sex
Within the Services occupations in Johnstown, the most male-oriented occupations are Cleaning & Maintenance (100.0%), and Food Preparation & Serving (72.2%), while the most female-oriented occupations are Personal Care & Service (100.0%), and Food Preparation & Serving (27.8%).
| Occupation | Male | Female |
| Healthcare Support | 0 (0.0%) | 0 (0.0%) |
| Security & Protection | 0 (0.0%) | 0 (0.0%) |
| Firefighting & Prevention | 0 (0.0%) | 0 (0.0%) |
| Law Enforcement | 0 (0.0%) | 0 (0.0%) |
| Food Preparation & Serving | 13 (72.2%) | 5 (27.8%) |
| Cleaning & Maintenance | 1 (100.0%) | 0 (0.0%) |
| Personal Care & Service | 0 (0.0%) | 6 (100.0%) |
| Total (Category) | 14 (56.0%) | 11 (44.0%) |
| Total (Overall) | 79 (67.5%) | 38 (32.5%) |
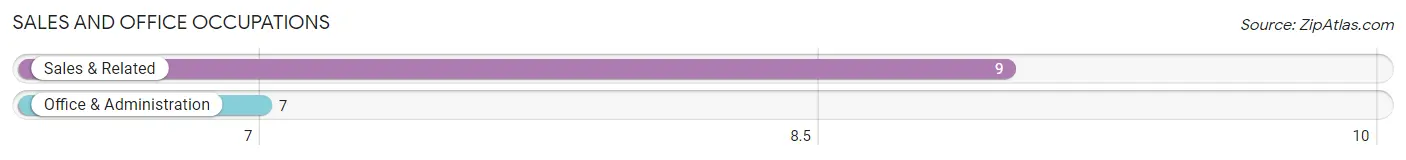
Sales and Office Occupations
The most common Sales and Office occupations in Johnstown are Sales & Related (9 | 7.7%), and Office & Administration (7 | 6.0%).
Sales and Office Occupations by Sex

| Occupation | Male | Female |
| Sales & Related | 9 (100.0%) | 0 (0.0%) |
| Office & Administration | 0 (0.0%) | 7 (100.0%) |
| Total (Category) | 9 (56.2%) | 7 (43.8%) |
| Total (Overall) | 79 (67.5%) | 38 (32.5%) |
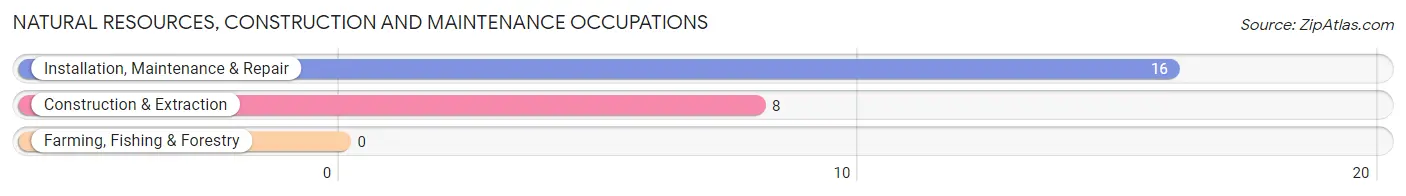
Natural Resources, Construction and Maintenance Occupations
The most common Natural Resources, Construction and Maintenance occupations in Johnstown are Installation, Maintenance & Repair (16 | 13.7%), and Construction & Extraction (8 | 6.8%).
Natural Resources, Construction and Maintenance Occupations by Sex
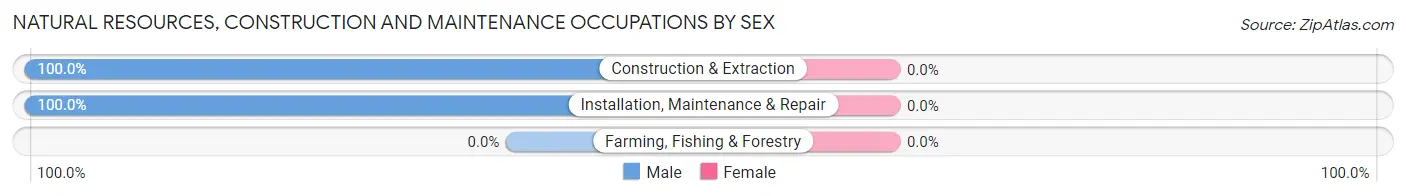
| Occupation | Male | Female |
| Farming, Fishing & Forestry | 0 (0.0%) | 0 (0.0%) |
| Construction & Extraction | 8 (100.0%) | 0 (0.0%) |
| Installation, Maintenance & Repair | 16 (100.0%) | 0 (0.0%) |
| Total (Category) | 24 (100.0%) | 0 (0.0%) |
| Total (Overall) | 79 (67.5%) | 38 (32.5%) |
Production, Transportation and Moving Occupations
The most common Production, Transportation and Moving occupations in Johnstown are , and Transportation (1 | 0.9%).
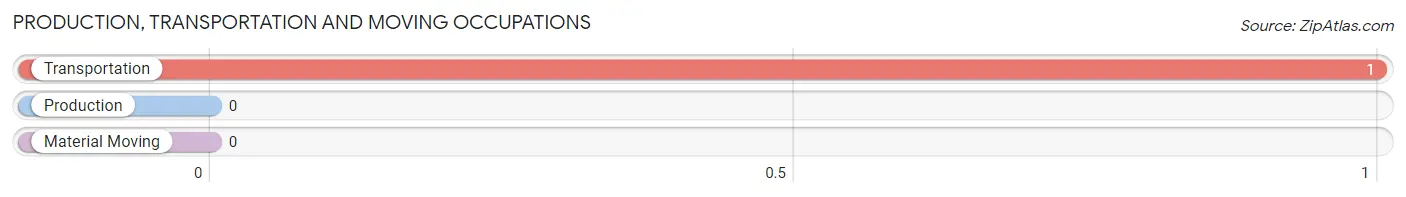
Production, Transportation and Moving Occupations by Sex
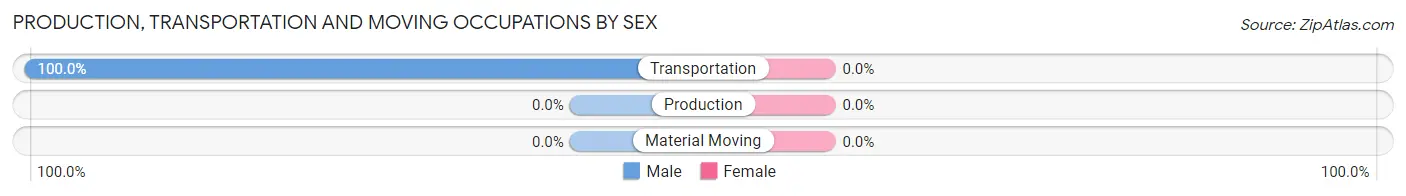
| Occupation | Male | Female |
| Production | 0 (0.0%) | 0 (0.0%) |
| Transportation | 1 (100.0%) | 0 (0.0%) |
| Material Moving | 0 (0.0%) | 0 (0.0%) |
| Total (Category) | 1 (100.0%) | 0 (0.0%) |
| Total (Overall) | 79 (67.5%) | 38 (32.5%) |
Employment Industries by Sex in Johnstown
Employment Industries in Johnstown
The major employment industries in Johnstown include Health Care & Social Assistance (22 | 18.8%), Public Administration (20 | 17.1%), Agriculture, Fishing & Hunting (17 | 14.5%), Retail Trade (13 | 11.1%), and Accommodation & Food Services (13 | 11.1%).
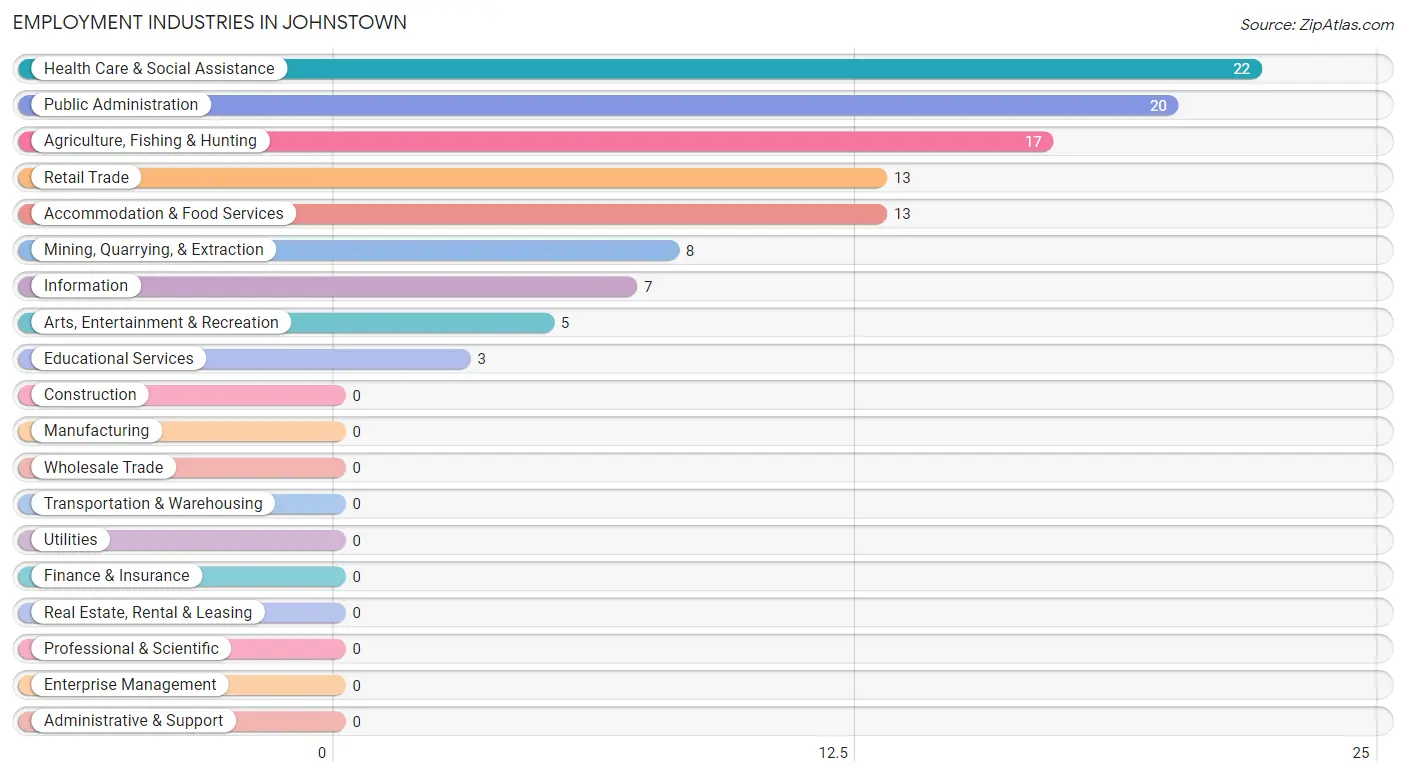
Employment Industries by Sex in Johnstown
The Johnstown industries that see more men than women are Agriculture, Fishing & Hunting (100.0%), Mining, Quarrying, & Extraction (100.0%), and Retail Trade (100.0%), whereas the industries that tend to have a higher number of women are Information (100.0%), Arts, Entertainment & Recreation (100.0%), and Public Administration (60.0%).
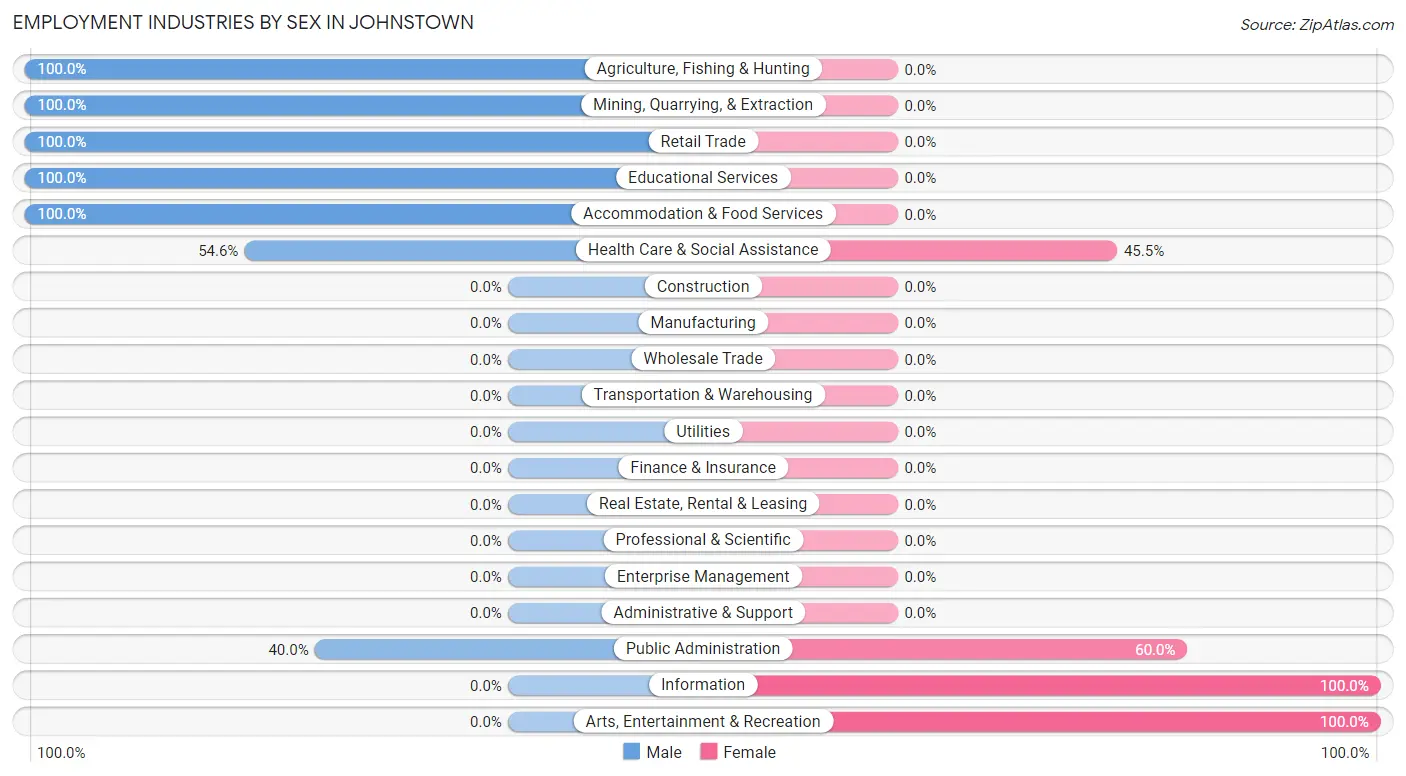
| Industry | Male | Female |
| Agriculture, Fishing & Hunting | 17 (100.0%) | 0 (0.0%) |
| Mining, Quarrying, & Extraction | 8 (100.0%) | 0 (0.0%) |
| Construction | 0 (0.0%) | 0 (0.0%) |
| Manufacturing | 0 (0.0%) | 0 (0.0%) |
| Wholesale Trade | 0 (0.0%) | 0 (0.0%) |
| Retail Trade | 13 (100.0%) | 0 (0.0%) |
| Transportation & Warehousing | 0 (0.0%) | 0 (0.0%) |
| Utilities | 0 (0.0%) | 0 (0.0%) |
| Information | 0 (0.0%) | 7 (100.0%) |
| Finance & Insurance | 0 (0.0%) | 0 (0.0%) |
| Real Estate, Rental & Leasing | 0 (0.0%) | 0 (0.0%) |
| Professional & Scientific | 0 (0.0%) | 0 (0.0%) |
| Enterprise Management | 0 (0.0%) | 0 (0.0%) |
| Administrative & Support | 0 (0.0%) | 0 (0.0%) |
| Educational Services | 3 (100.0%) | 0 (0.0%) |
| Health Care & Social Assistance | 12 (54.5%) | 10 (45.5%) |
| Arts, Entertainment & Recreation | 0 (0.0%) | 5 (100.0%) |
| Accommodation & Food Services | 13 (100.0%) | 0 (0.0%) |
| Public Administration | 8 (40.0%) | 12 (60.0%) |
| Total | 79 (67.5%) | 38 (32.5%) |
Education in Johnstown
School Enrollment in Johnstown
The most common levels of schooling among the 36 students in Johnstown are college / undergraduate (13 | 36.1%), high school (9 | 25.0%), and elementary school (5 | 13.9%).
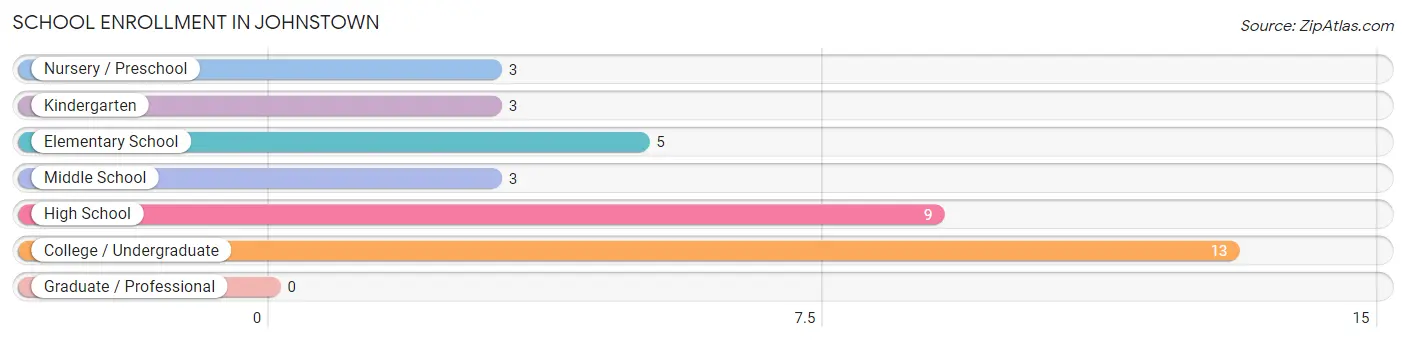
| School Level | # Students | % Students |
| Nursery / Preschool | 3 | 8.3% |
| Kindergarten | 3 | 8.3% |
| Elementary School | 5 | 13.9% |
| Middle School | 3 | 8.3% |
| High School | 9 | 25.0% |
| College / Undergraduate | 13 | 36.1% |
| Graduate / Professional | 0 | 0.0% |
| Total | 36 | 100.0% |
School Enrollment by Age by Funding Source in Johnstown
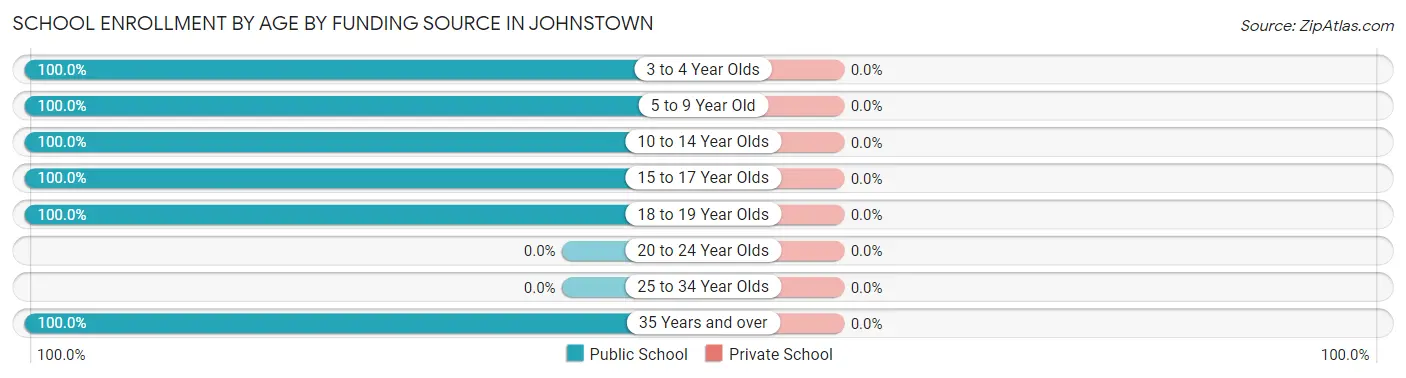
| Age Bracket | Public School | Private School |
| 3 to 4 Year Olds | 3 (100.0%) | 0 (0.0%) |
| 5 to 9 Year Old | 7 (100.0%) | 0 (0.0%) |
| 10 to 14 Year Olds | 4 (100.0%) | 0 (0.0%) |
| 15 to 17 Year Olds | 9 (100.0%) | 0 (0.0%) |
| 18 to 19 Year Olds | 6 (100.0%) | 0 (0.0%) |
| 20 to 24 Year Olds | 0 (0.0%) | 0 (0.0%) |
| 25 to 34 Year Olds | 0 (0.0%) | 0 (0.0%) |
| 35 Years and over | 7 (100.0%) | 0 (0.0%) |
| Total | 36 (100.0%) | 0 (0.0%) |
Educational Attainment by Field of Study in Johnstown
Engineering (7 | 25.9%), science & technology (7 | 25.9%), arts & humanities (5 | 18.5%), psychology (4 | 14.8%), and education (4 | 14.8%) are the most common fields of study among 27 individuals in Johnstown who have obtained a bachelor's degree or higher.
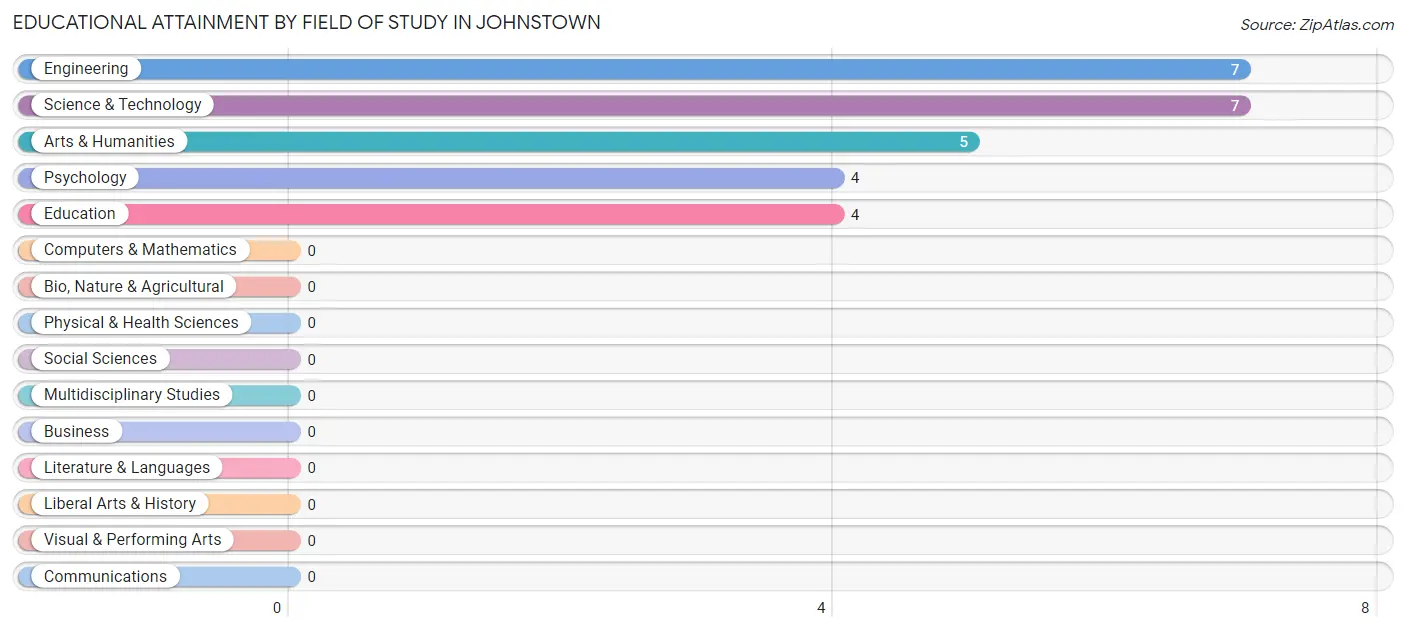
| Field of Study | # Graduates | % Graduates |
| Computers & Mathematics | 0 | 0.0% |
| Bio, Nature & Agricultural | 0 | 0.0% |
| Physical & Health Sciences | 0 | 0.0% |
| Psychology | 4 | 14.8% |
| Social Sciences | 0 | 0.0% |
| Engineering | 7 | 25.9% |
| Multidisciplinary Studies | 0 | 0.0% |
| Science & Technology | 7 | 25.9% |
| Business | 0 | 0.0% |
| Education | 4 | 14.8% |
| Literature & Languages | 0 | 0.0% |
| Liberal Arts & History | 0 | 0.0% |
| Visual & Performing Arts | 0 | 0.0% |
| Communications | 0 | 0.0% |
| Arts & Humanities | 5 | 18.5% |
| Total | 27 | 100.0% |
Transportation & Commute in Johnstown
Vehicle Availability by Sex in Johnstown
The most prevalent vehicle ownership categories in Johnstown are males with 4 vehicles (33, accounting for 45.2%) and females with 4 vehicles (13, making up 117.9%).
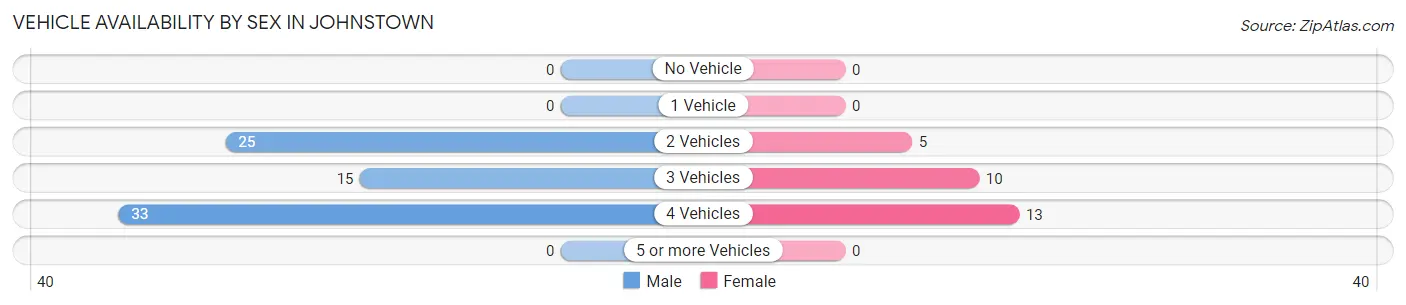
| Vehicles Available | Male | Female |
| No Vehicle | 0 (0.0%) | 0 (0.0%) |
| 1 Vehicle | 0 (0.0%) | 0 (0.0%) |
| 2 Vehicles | 25 (34.3%) | 5 (17.9%) |
| 3 Vehicles | 15 (20.5%) | 10 (35.7%) |
| 4 Vehicles | 33 (45.2%) | 13 (46.4%) |
| 5 or more Vehicles | 0 (0.0%) | 0 (0.0%) |
| Total | 73 (100.0%) | 28 (100.0%) |
Commute Time in Johnstown
The most frequently occuring commute durations in Johnstown are 20 to 24 minutes (24 commuters, 25.5%), 90 or more minutes (21 commuters, 22.3%), and 25 to 29 minutes (19 commuters, 20.2%).
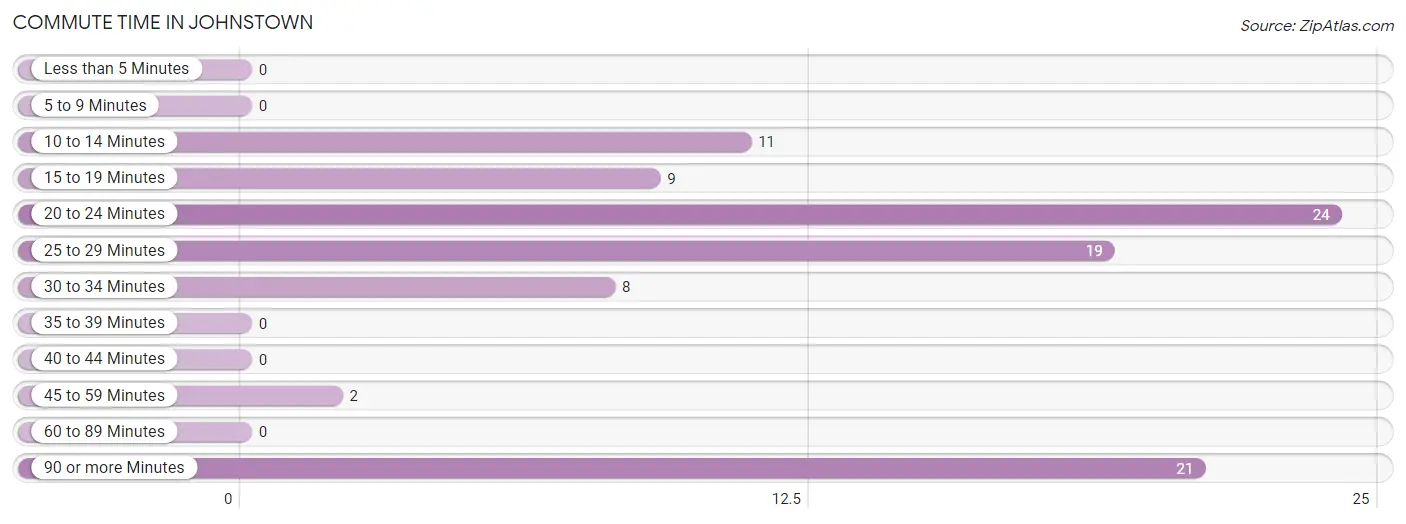
| Commute Time | # Commuters | % Commuters |
| Less than 5 Minutes | 0 | 0.0% |
| 5 to 9 Minutes | 0 | 0.0% |
| 10 to 14 Minutes | 11 | 11.7% |
| 15 to 19 Minutes | 9 | 9.6% |
| 20 to 24 Minutes | 24 | 25.5% |
| 25 to 29 Minutes | 19 | 20.2% |
| 30 to 34 Minutes | 8 | 8.5% |
| 35 to 39 Minutes | 0 | 0.0% |
| 40 to 44 Minutes | 0 | 0.0% |
| 45 to 59 Minutes | 2 | 2.1% |
| 60 to 89 Minutes | 0 | 0.0% |
| 90 or more Minutes | 21 | 22.3% |
Commute Time by Sex in Johnstown
The most common commute times in Johnstown are 90 or more minutes (21 commuters, 31.8%) for males and 25 to 29 minutes (13 commuters, 46.4%) for females.
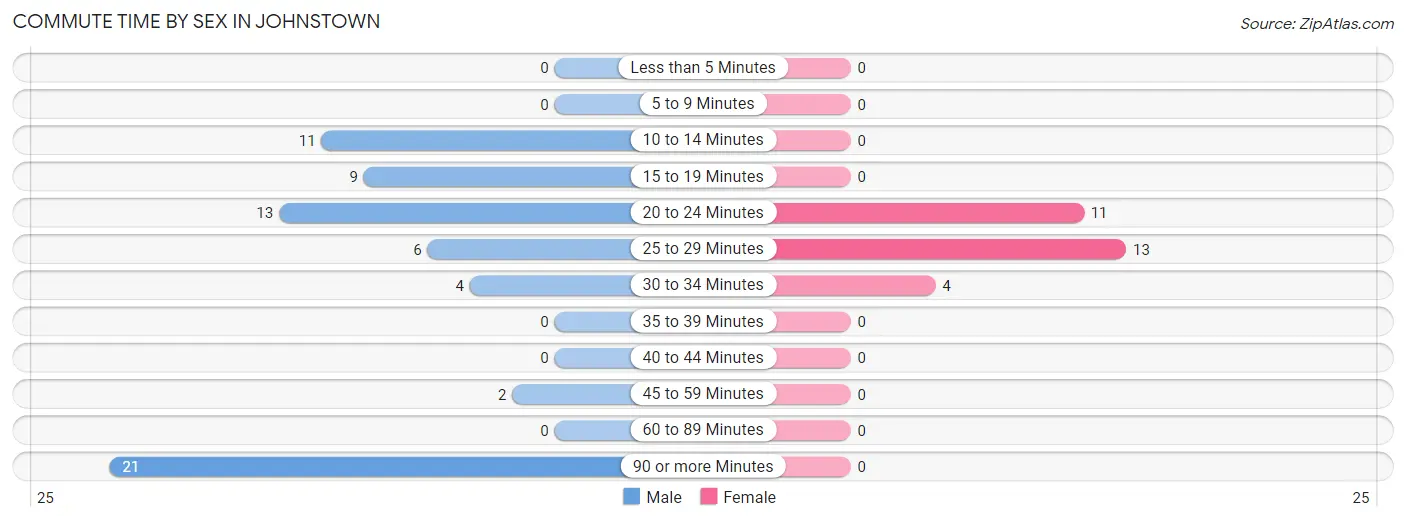
| Commute Time | Male | Female |
| Less than 5 Minutes | 0 (0.0%) | 0 (0.0%) |
| 5 to 9 Minutes | 0 (0.0%) | 0 (0.0%) |
| 10 to 14 Minutes | 11 (16.7%) | 0 (0.0%) |
| 15 to 19 Minutes | 9 (13.6%) | 0 (0.0%) |
| 20 to 24 Minutes | 13 (19.7%) | 11 (39.3%) |
| 25 to 29 Minutes | 6 (9.1%) | 13 (46.4%) |
| 30 to 34 Minutes | 4 (6.1%) | 4 (14.3%) |
| 35 to 39 Minutes | 0 (0.0%) | 0 (0.0%) |
| 40 to 44 Minutes | 0 (0.0%) | 0 (0.0%) |
| 45 to 59 Minutes | 2 (3.0%) | 0 (0.0%) |
| 60 to 89 Minutes | 0 (0.0%) | 0 (0.0%) |
| 90 or more Minutes | 21 (31.8%) | 0 (0.0%) |
Time of Departure to Work by Sex in Johnstown
The most frequent times of departure to work in Johnstown are 6:30 AM to 6:59 AM (19, 28.8%) for males and 7:30 AM to 7:59 AM (11, 39.3%) for females.
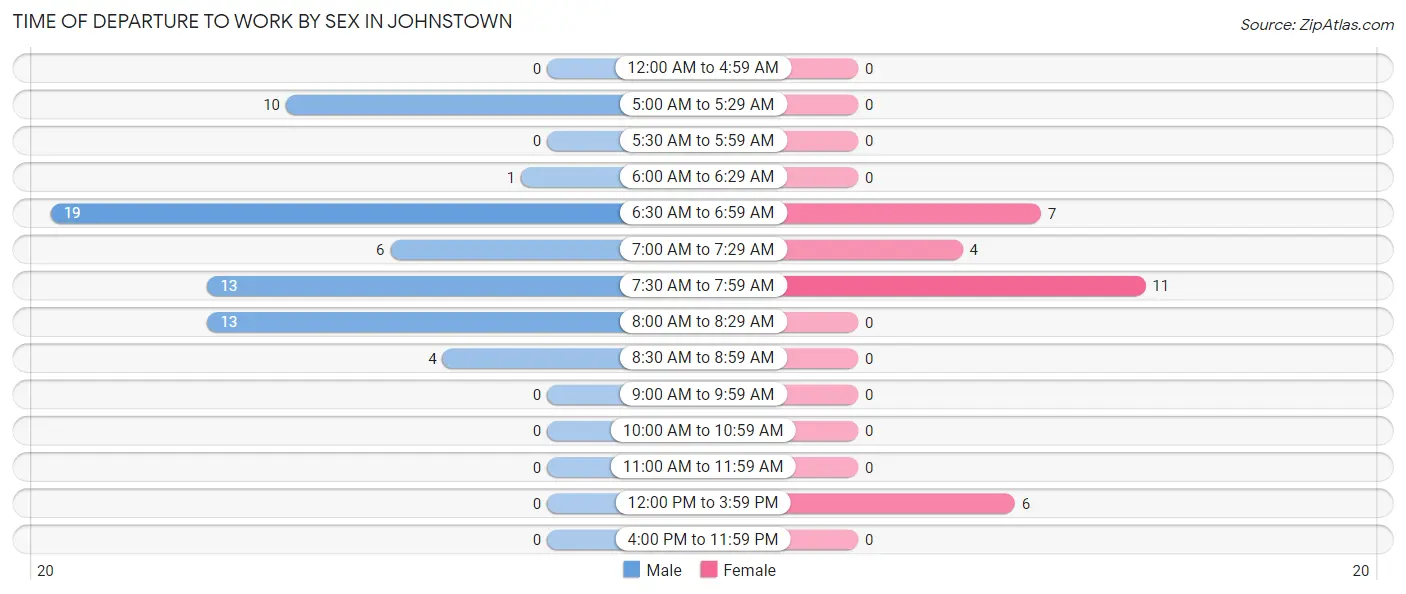
| Time of Departure | Male | Female |
| 12:00 AM to 4:59 AM | 0 (0.0%) | 0 (0.0%) |
| 5:00 AM to 5:29 AM | 10 (15.1%) | 0 (0.0%) |
| 5:30 AM to 5:59 AM | 0 (0.0%) | 0 (0.0%) |
| 6:00 AM to 6:29 AM | 1 (1.5%) | 0 (0.0%) |
| 6:30 AM to 6:59 AM | 19 (28.8%) | 7 (25.0%) |
| 7:00 AM to 7:29 AM | 6 (9.1%) | 4 (14.3%) |
| 7:30 AM to 7:59 AM | 13 (19.7%) | 11 (39.3%) |
| 8:00 AM to 8:29 AM | 13 (19.7%) | 0 (0.0%) |
| 8:30 AM to 8:59 AM | 4 (6.1%) | 0 (0.0%) |
| 9:00 AM to 9:59 AM | 0 (0.0%) | 0 (0.0%) |
| 10:00 AM to 10:59 AM | 0 (0.0%) | 0 (0.0%) |
| 11:00 AM to 11:59 AM | 0 (0.0%) | 0 (0.0%) |
| 12:00 PM to 3:59 PM | 0 (0.0%) | 6 (21.4%) |
| 4:00 PM to 11:59 PM | 0 (0.0%) | 0 (0.0%) |
| Total | 66 (100.0%) | 28 (100.0%) |
Housing Occupancy in Johnstown
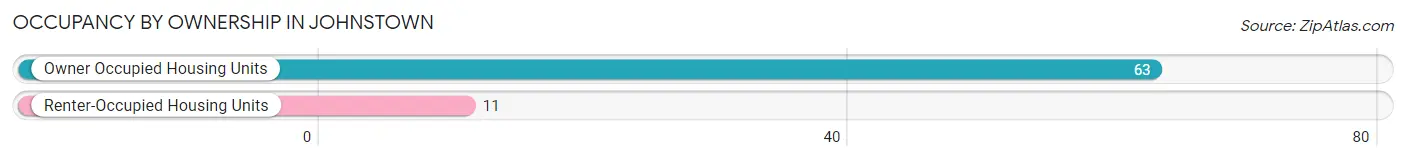
Occupancy by Ownership in Johnstown
Of the total 74 dwellings in Johnstown, owner-occupied units account for 63 (85.1%), while renter-occupied units make up 11 (14.9%).
| Occupancy | # Housing Units | % Housing Units |
| Owner Occupied Housing Units | 63 | 85.1% |
| Renter-Occupied Housing Units | 11 | 14.9% |
| Total Occupied Housing Units | 74 | 100.0% |
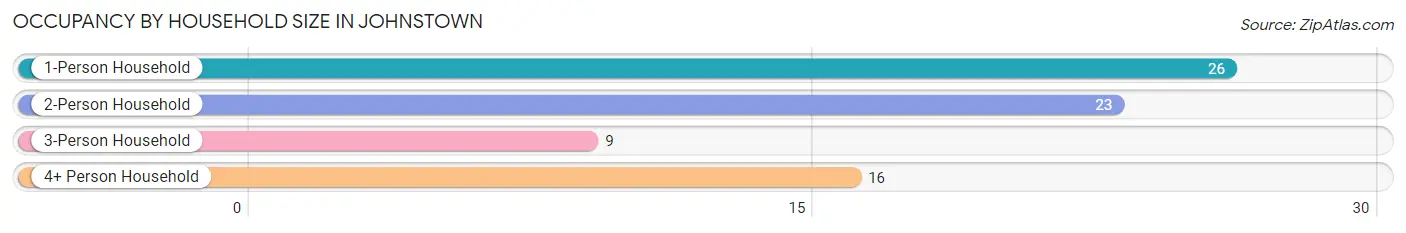
Occupancy by Household Size in Johnstown
| Household Size | # Housing Units | % Housing Units |
| 1-Person Household | 26 | 35.1% |
| 2-Person Household | 23 | 31.1% |
| 3-Person Household | 9 | 12.2% |
| 4+ Person Household | 16 | 21.6% |
| Total Housing Units | 74 | 100.0% |
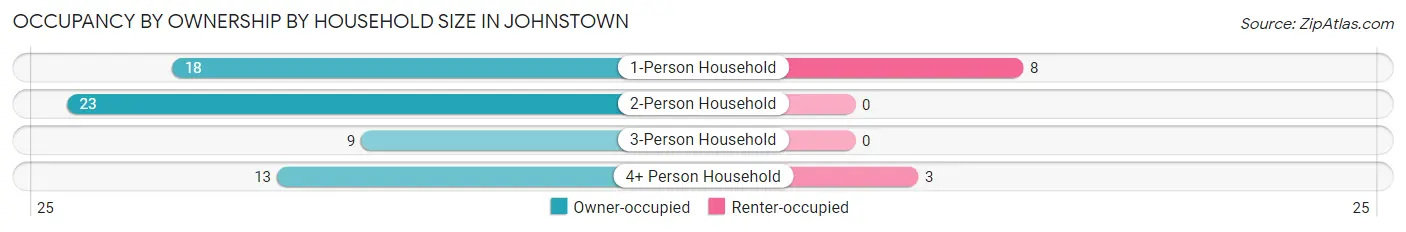
Occupancy by Ownership by Household Size in Johnstown
| Household Size | Owner-occupied | Renter-occupied |
| 1-Person Household | 18 (69.2%) | 8 (30.8%) |
| 2-Person Household | 23 (100.0%) | 0 (0.0%) |
| 3-Person Household | 9 (100.0%) | 0 (0.0%) |
| 4+ Person Household | 13 (81.2%) | 3 (18.8%) |
| Total Housing Units | 63 (85.1%) | 11 (14.9%) |
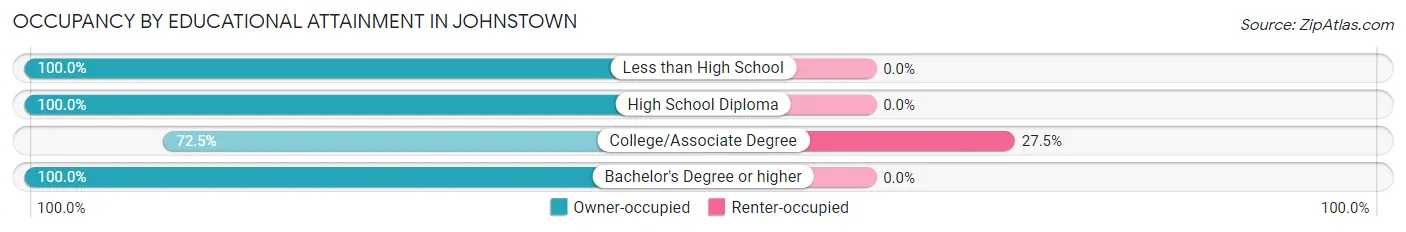
Occupancy by Educational Attainment in Johnstown
| Household Size | Owner-occupied | Renter-occupied |
| Less than High School | 10 (100.0%) | 0 (0.0%) |
| High School Diploma | 13 (100.0%) | 0 (0.0%) |
| College/Associate Degree | 29 (72.5%) | 11 (27.5%) |
| Bachelor's Degree or higher | 11 (100.0%) | 0 (0.0%) |
Occupancy by Age of Householder in Johnstown
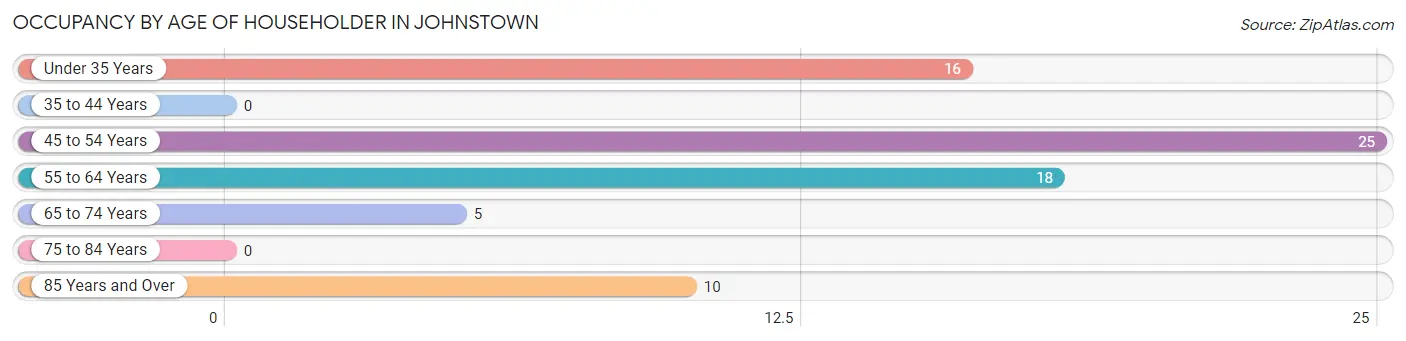
| Age Bracket | # Households | % Households |
| Under 35 Years | 16 | 21.6% |
| 35 to 44 Years | 0 | 0.0% |
| 45 to 54 Years | 25 | 33.8% |
| 55 to 64 Years | 18 | 24.3% |
| 65 to 74 Years | 5 | 6.8% |
| 75 to 84 Years | 0 | 0.0% |
| 85 Years and Over | 10 | 13.5% |
| Total | 74 | 100.0% |
Housing Finances in Johnstown
Median Income by Occupancy in Johnstown
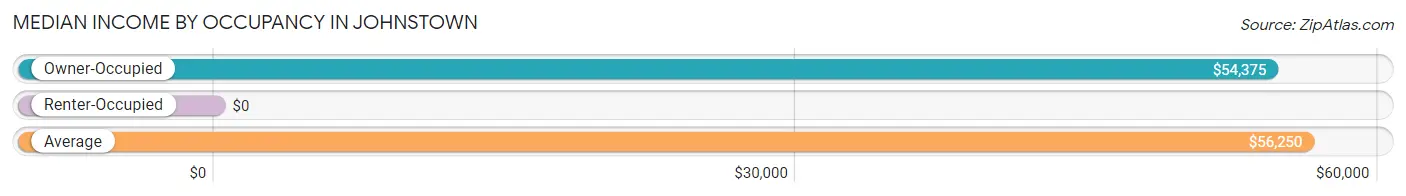
| Occupancy Type | # Households | Median Income |
| Owner-Occupied | 63 (85.1%) | $54,375 |
| Renter-Occupied | 11 (14.9%) | $0 |
| Average | 74 (100.0%) | $56,250 |
Occupancy by Householder Income Bracket in Johnstown
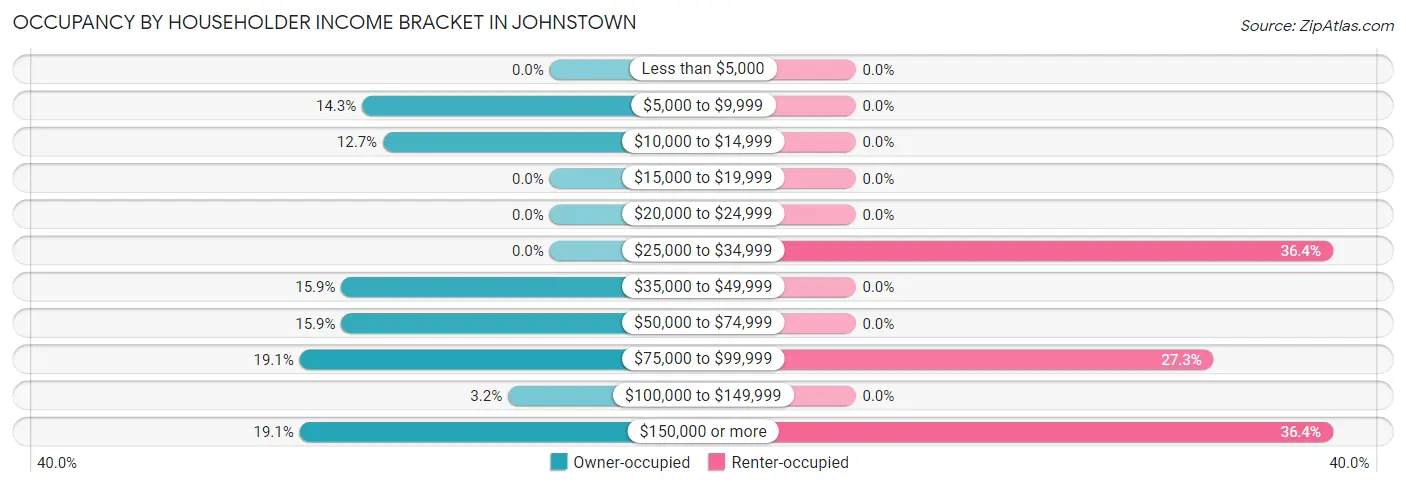
| Income Bracket | Owner-occupied | Renter-occupied |
| Less than $5,000 | 0 (0.0%) | 0 (0.0%) |
| $5,000 to $9,999 | 9 (14.3%) | 0 (0.0%) |
| $10,000 to $14,999 | 8 (12.7%) | 0 (0.0%) |
| $15,000 to $19,999 | 0 (0.0%) | 0 (0.0%) |
| $20,000 to $24,999 | 0 (0.0%) | 0 (0.0%) |
| $25,000 to $34,999 | 0 (0.0%) | 4 (36.4%) |
| $35,000 to $49,999 | 10 (15.9%) | 0 (0.0%) |
| $50,000 to $74,999 | 10 (15.9%) | 0 (0.0%) |
| $75,000 to $99,999 | 12 (19.1%) | 3 (27.3%) |
| $100,000 to $149,999 | 2 (3.2%) | 0 (0.0%) |
| $150,000 or more | 12 (19.1%) | 4 (36.4%) |
| Total | 63 (100.0%) | 11 (100.0%) |
Monthly Housing Cost Tiers in Johnstown
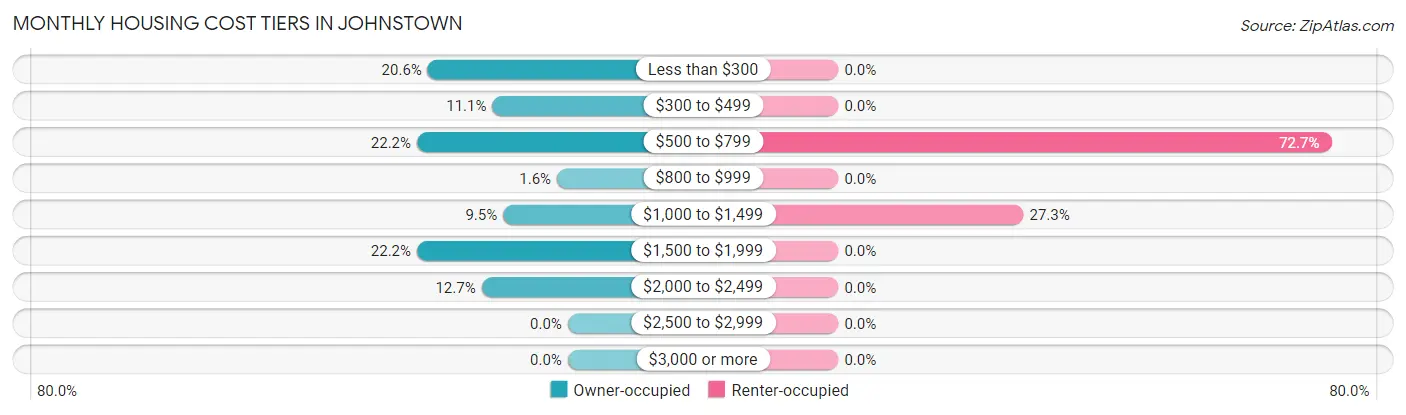
| Monthly Cost | Owner-occupied | Renter-occupied |
| Less than $300 | 13 (20.6%) | 0 (0.0%) |
| $300 to $499 | 7 (11.1%) | 0 (0.0%) |
| $500 to $799 | 14 (22.2%) | 8 (72.7%) |
| $800 to $999 | 1 (1.6%) | 0 (0.0%) |
| $1,000 to $1,499 | 6 (9.5%) | 3 (27.3%) |
| $1,500 to $1,999 | 14 (22.2%) | 0 (0.0%) |
| $2,000 to $2,499 | 8 (12.7%) | 0 (0.0%) |
| $2,500 to $2,999 | 0 (0.0%) | 0 (0.0%) |
| $3,000 or more | 0 (0.0%) | 0 (0.0%) |
| Total | 63 (100.0%) | 11 (100.0%) |
Physical Housing Characteristics in Johnstown
Housing Structures in Johnstown
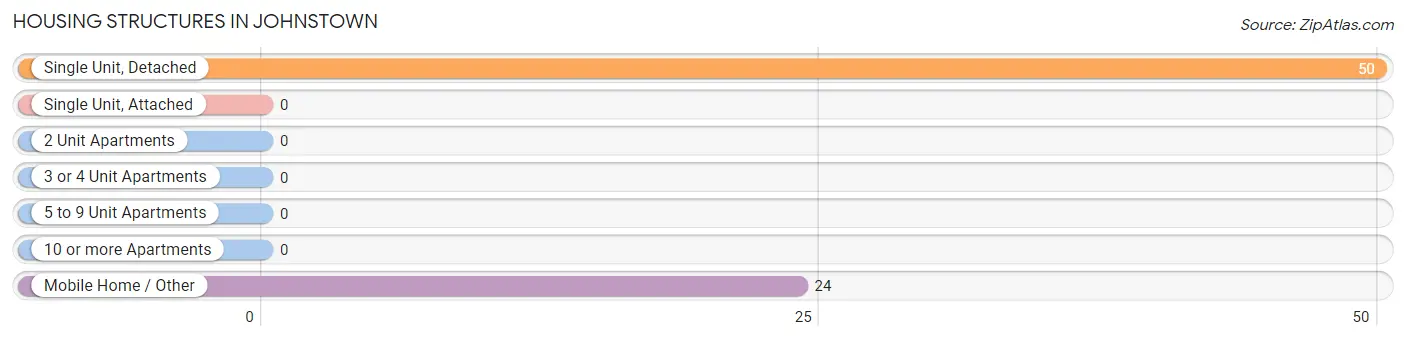
| Structure Type | # Housing Units | % Housing Units |
| Single Unit, Detached | 50 | 67.6% |
| Single Unit, Attached | 0 | 0.0% |
| 2 Unit Apartments | 0 | 0.0% |
| 3 or 4 Unit Apartments | 0 | 0.0% |
| 5 to 9 Unit Apartments | 0 | 0.0% |
| 10 or more Apartments | 0 | 0.0% |
| Mobile Home / Other | 24 | 32.4% |
| Total | 74 | 100.0% |
Housing Structures by Occupancy in Johnstown
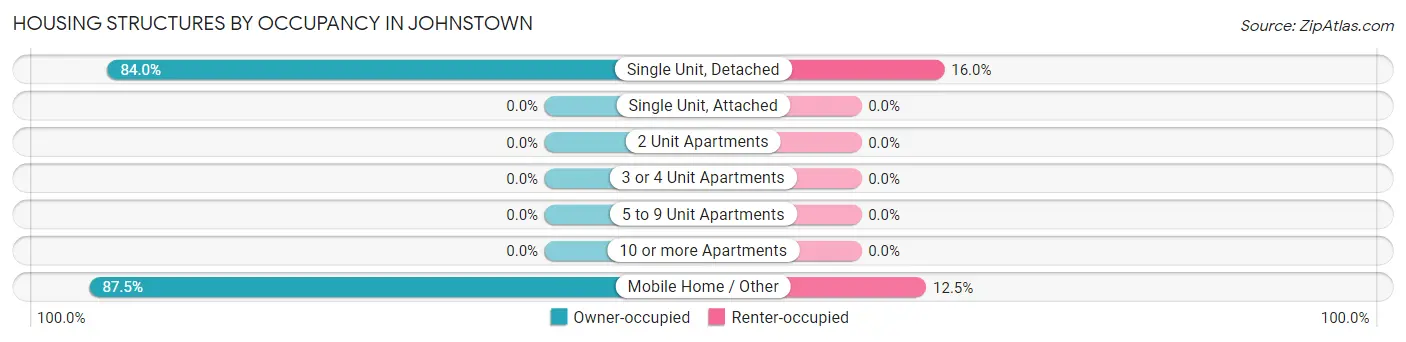
| Structure Type | Owner-occupied | Renter-occupied |
| Single Unit, Detached | 42 (84.0%) | 8 (16.0%) |
| Single Unit, Attached | 0 (0.0%) | 0 (0.0%) |
| 2 Unit Apartments | 0 (0.0%) | 0 (0.0%) |
| 3 or 4 Unit Apartments | 0 (0.0%) | 0 (0.0%) |
| 5 to 9 Unit Apartments | 0 (0.0%) | 0 (0.0%) |
| 10 or more Apartments | 0 (0.0%) | 0 (0.0%) |
| Mobile Home / Other | 21 (87.5%) | 3 (12.5%) |
| Total | 63 (85.1%) | 11 (14.9%) |
Housing Structures by Number of Rooms in Johnstown
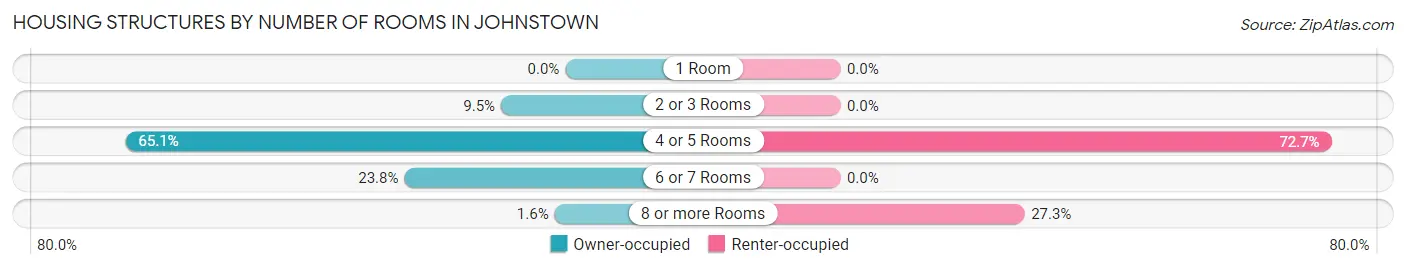
| Number of Rooms | Owner-occupied | Renter-occupied |
| 1 Room | 0 (0.0%) | 0 (0.0%) |
| 2 or 3 Rooms | 6 (9.5%) | 0 (0.0%) |
| 4 or 5 Rooms | 41 (65.1%) | 8 (72.7%) |
| 6 or 7 Rooms | 15 (23.8%) | 0 (0.0%) |
| 8 or more Rooms | 1 (1.6%) | 3 (27.3%) |
| Total | 63 (100.0%) | 11 (100.0%) |
Housing Structure by Heating Type in Johnstown
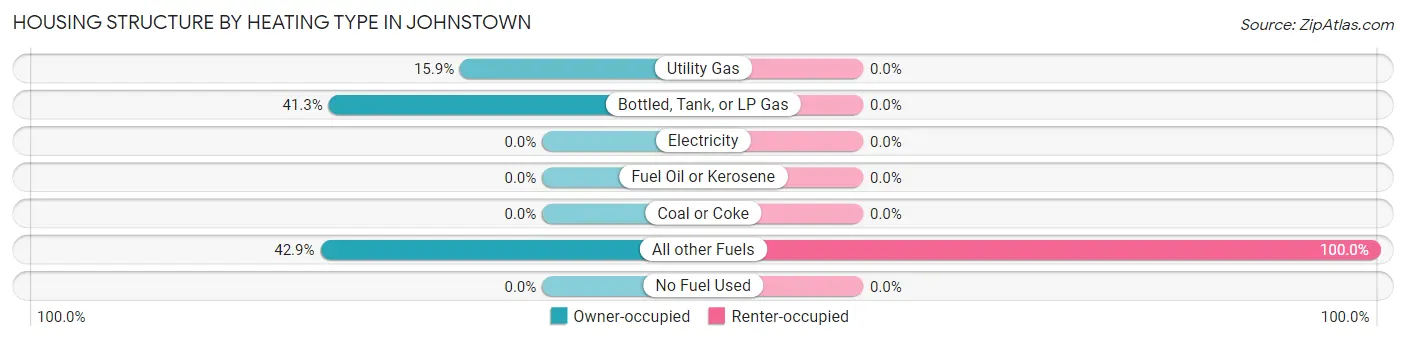
| Heating Type | Owner-occupied | Renter-occupied |
| Utility Gas | 10 (15.9%) | 0 (0.0%) |
| Bottled, Tank, or LP Gas | 26 (41.3%) | 0 (0.0%) |
| Electricity | 0 (0.0%) | 0 (0.0%) |
| Fuel Oil or Kerosene | 0 (0.0%) | 0 (0.0%) |
| Coal or Coke | 0 (0.0%) | 0 (0.0%) |
| All other Fuels | 27 (42.9%) | 11 (100.0%) |
| No Fuel Used | 0 (0.0%) | 0 (0.0%) |
| Total | 63 (100.0%) | 11 (100.0%) |
Household Vehicle Usage in Johnstown
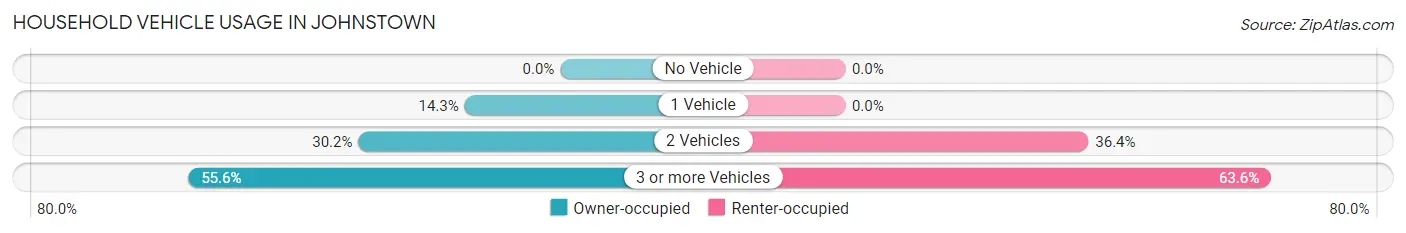
| Vehicles per Household | Owner-occupied | Renter-occupied |
| No Vehicle | 0 (0.0%) | 0 (0.0%) |
| 1 Vehicle | 9 (14.3%) | 0 (0.0%) |
| 2 Vehicles | 19 (30.2%) | 4 (36.4%) |
| 3 or more Vehicles | 35 (55.6%) | 7 (63.6%) |
| Total | 63 (100.0%) | 11 (100.0%) |
Real Estate & Mortgages in Johnstown
Real Estate and Mortgage Overview in Johnstown
| Characteristic | Without Mortgage | With Mortgage |
| Housing Units | 34 | 29 |
| Median Property Value | $285,700 | $0 |
| Median Household Income | $91,071 | $0 |
| Monthly Housing Costs | $457 | $0 |
| Real Estate Taxes | $2,208 | $6 |
Property Value by Mortgage Status in Johnstown
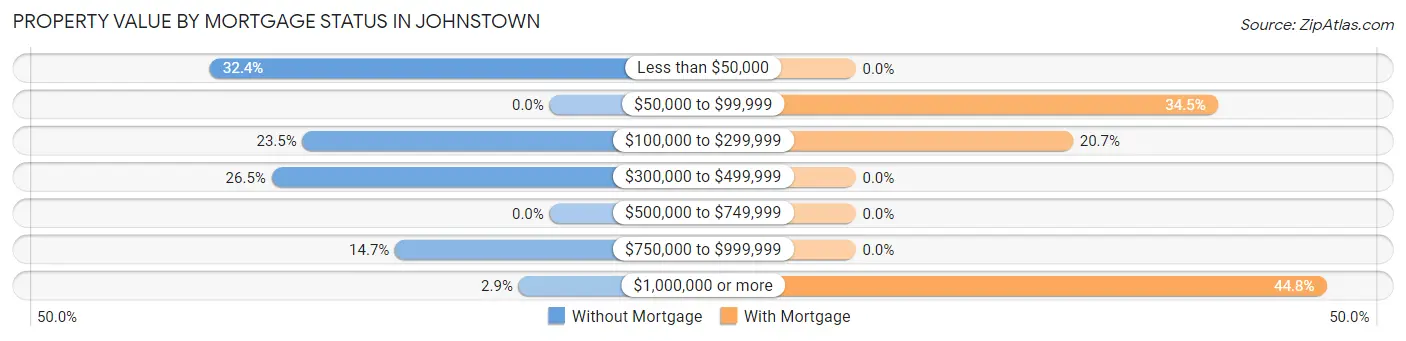
| Property Value | Without Mortgage | With Mortgage |
| Less than $50,000 | 11 (32.4%) | 0 (0.0%) |
| $50,000 to $99,999 | 0 (0.0%) | 10 (34.5%) |
| $100,000 to $299,999 | 8 (23.5%) | 6 (20.7%) |
| $300,000 to $499,999 | 9 (26.5%) | 0 (0.0%) |
| $500,000 to $749,999 | 0 (0.0%) | 0 (0.0%) |
| $750,000 to $999,999 | 5 (14.7%) | 0 (0.0%) |
| $1,000,000 or more | 1 (2.9%) | 13 (44.8%) |
| Total | 34 (100.0%) | 29 (100.0%) |
Household Income by Mortgage Status in Johnstown
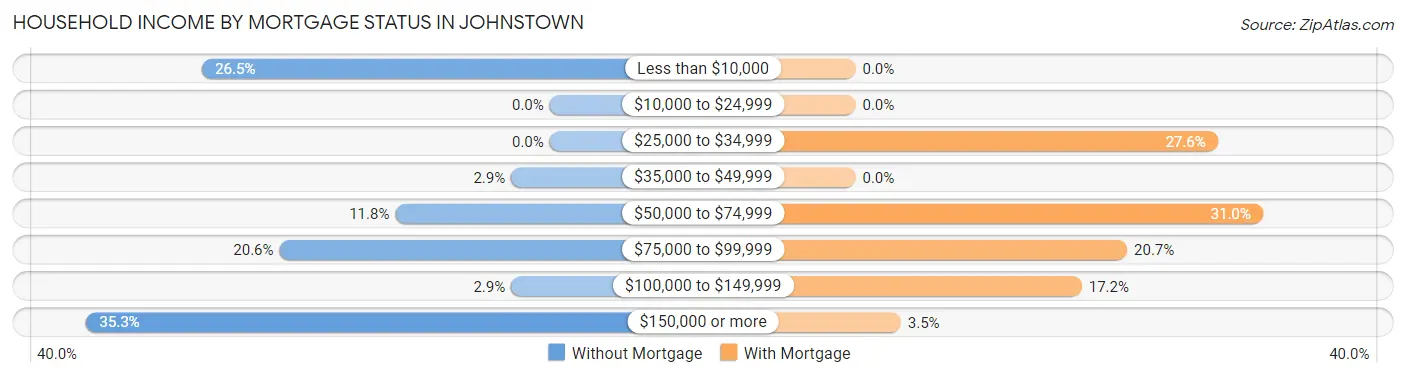
| Household Income | Without Mortgage | With Mortgage |
| Less than $10,000 | 9 (26.5%) | 0 (0.0%) |
| $10,000 to $24,999 | 0 (0.0%) | 0 (0.0%) |
| $25,000 to $34,999 | 0 (0.0%) | 8 (27.6%) |
| $35,000 to $49,999 | 1 (2.9%) | 0 (0.0%) |
| $50,000 to $74,999 | 4 (11.8%) | 9 (31.0%) |
| $75,000 to $99,999 | 7 (20.6%) | 6 (20.7%) |
| $100,000 to $149,999 | 1 (2.9%) | 5 (17.2%) |
| $150,000 or more | 12 (35.3%) | 1 (3.5%) |
| Total | 34 (100.0%) | 29 (100.0%) |
Property Value to Household Income Ratio in Johnstown
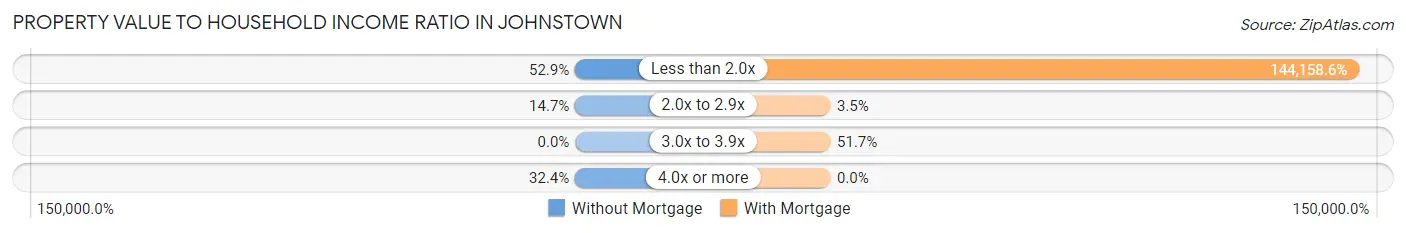
| Value-to-Income Ratio | Without Mortgage | With Mortgage |
| Less than 2.0x | 18 (52.9%) | 41,806 (144,158.6%) |
| 2.0x to 2.9x | 5 (14.7%) | 1 (3.5%) |
| 3.0x to 3.9x | 0 (0.0%) | 15 (51.7%) |
| 4.0x or more | 11 (32.4%) | 0 (0.0%) |
| Total | 34 (100.0%) | 29 (100.0%) |
Real Estate Taxes by Mortgage Status in Johnstown
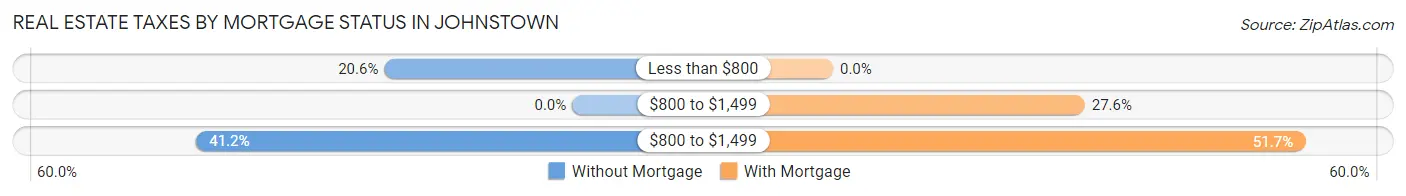
| Property Taxes | Without Mortgage | With Mortgage |
| Less than $800 | 7 (20.6%) | 0 (0.0%) |
| $800 to $1,499 | 0 (0.0%) | 8 (27.6%) |
| $800 to $1,499 | 14 (41.2%) | 15 (51.7%) |
| Total | 34 (100.0%) | 29 (100.0%) |
Health & Disability in Johnstown
Health Insurance Coverage by Age in Johnstown
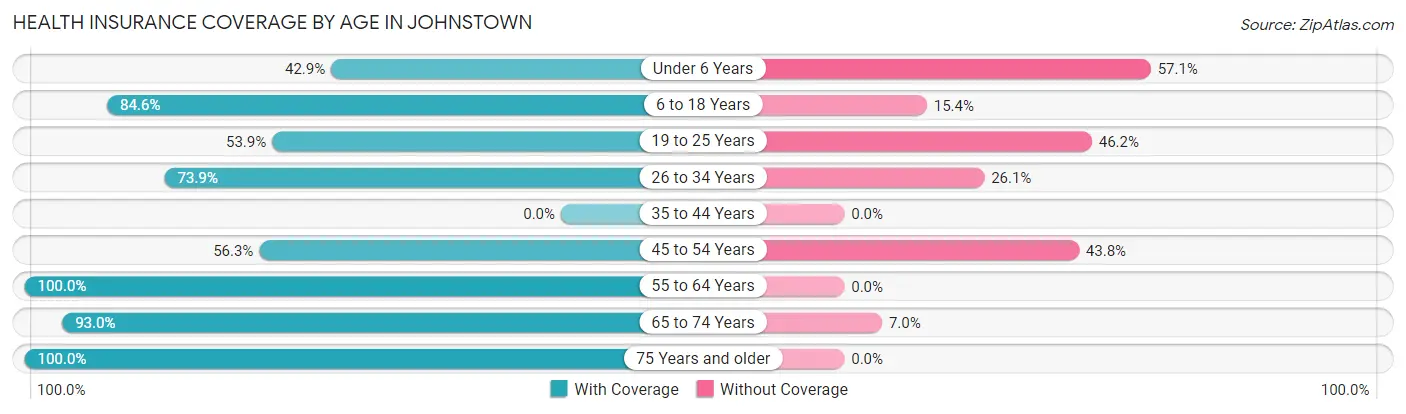
| Age Bracket | With Coverage | Without Coverage |
| Under 6 Years | 3 (42.9%) | 4 (57.1%) |
| 6 to 18 Years | 33 (84.6%) | 6 (15.4%) |
| 19 to 25 Years | 14 (53.8%) | 12 (46.2%) |
| 26 to 34 Years | 17 (73.9%) | 6 (26.1%) |
| 35 to 44 Years | 0 (0.0%) | 0 (0.0%) |
| 45 to 54 Years | 18 (56.2%) | 14 (43.8%) |
| 55 to 64 Years | 37 (100.0%) | 0 (0.0%) |
| 65 to 74 Years | 53 (93.0%) | 4 (7.0%) |
| 75 Years and older | 10 (100.0%) | 0 (0.0%) |
| Total | 185 (80.1%) | 46 (19.9%) |
Health Insurance Coverage by Citizenship Status in Johnstown
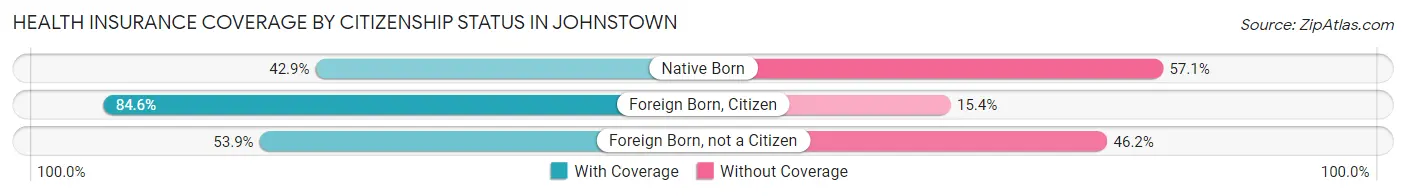
| Citizenship Status | With Coverage | Without Coverage |
| Native Born | 3 (42.9%) | 4 (57.1%) |
| Foreign Born, Citizen | 33 (84.6%) | 6 (15.4%) |
| Foreign Born, not a Citizen | 14 (53.8%) | 12 (46.2%) |
Health Insurance Coverage by Household Income in Johnstown
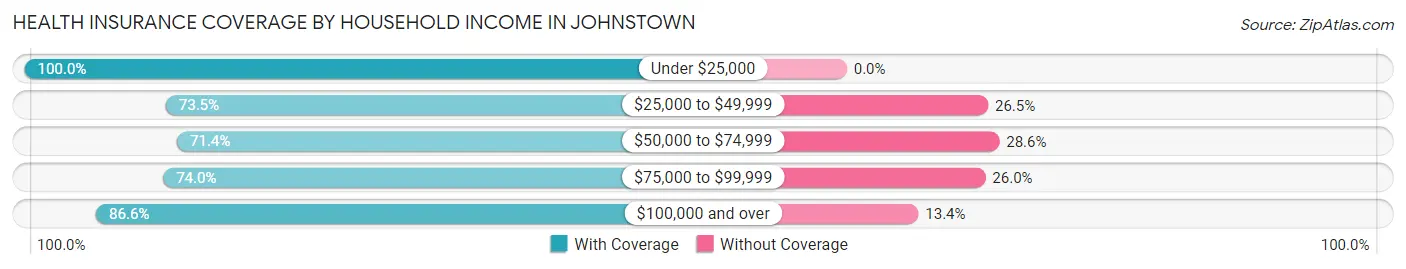
| Household Income | With Coverage | Without Coverage |
| Under $25,000 | 17 (100.0%) | 0 (0.0%) |
| $25,000 to $49,999 | 25 (73.5%) | 9 (26.5%) |
| $50,000 to $74,999 | 15 (71.4%) | 6 (28.6%) |
| $75,000 to $99,999 | 57 (74.0%) | 20 (26.0%) |
| $100,000 and over | 71 (86.6%) | 11 (13.4%) |
Public vs Private Health Insurance Coverage by Age in Johnstown
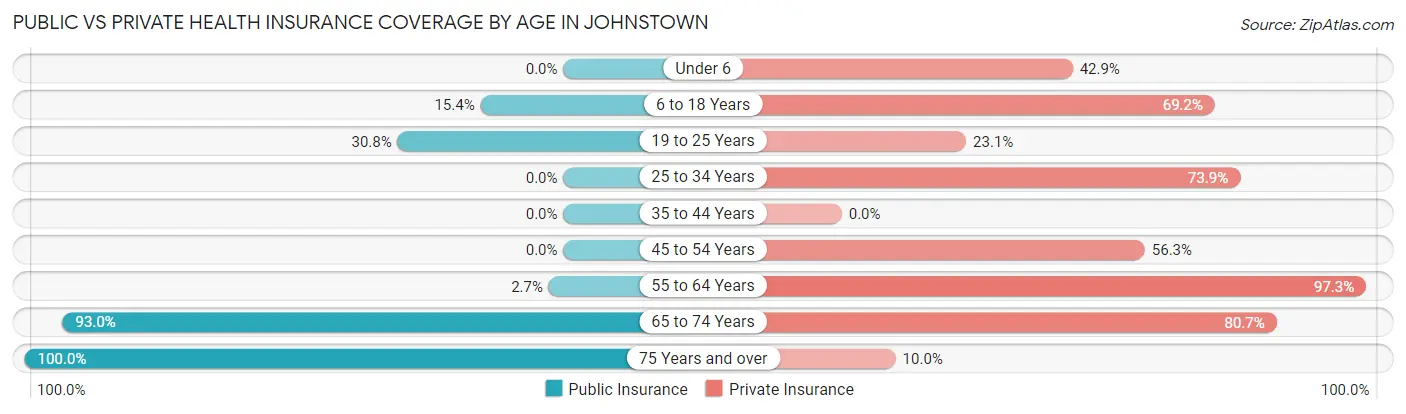
| Age Bracket | Public Insurance | Private Insurance |
| Under 6 | 0 (0.0%) | 3 (42.9%) |
| 6 to 18 Years | 6 (15.4%) | 27 (69.2%) |
| 19 to 25 Years | 8 (30.8%) | 6 (23.1%) |
| 25 to 34 Years | 0 (0.0%) | 17 (73.9%) |
| 35 to 44 Years | 0 (0.0%) | 0 (0.0%) |
| 45 to 54 Years | 0 (0.0%) | 18 (56.2%) |
| 55 to 64 Years | 1 (2.7%) | 36 (97.3%) |
| 65 to 74 Years | 53 (93.0%) | 46 (80.7%) |
| 75 Years and over | 10 (100.0%) | 1 (10.0%) |
| Total | 78 (33.8%) | 154 (66.7%) |
Disability Status by Sex by Age in Johnstown
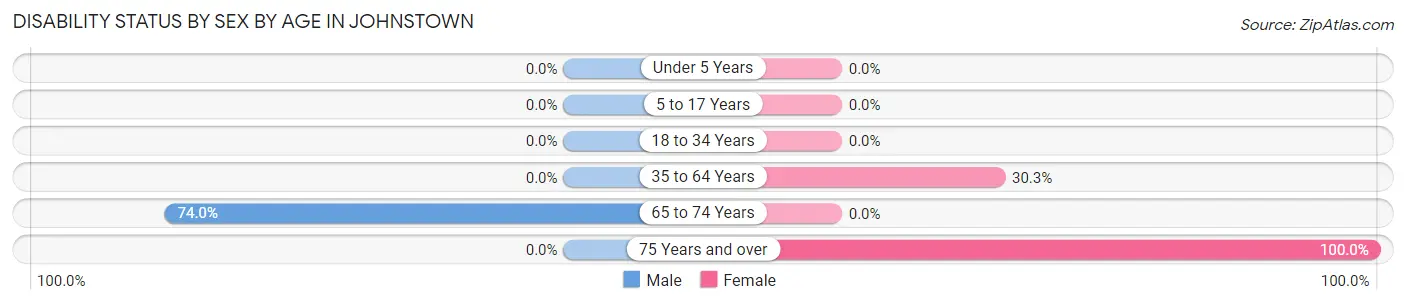
| Age Bracket | Male | Female |
| Under 5 Years | 0 (0.0%) | 0 (0.0%) |
| 5 to 17 Years | 0 (0.0%) | 0 (0.0%) |
| 18 to 34 Years | 0 (0.0%) | 0 (0.0%) |
| 35 to 64 Years | 0 (0.0%) | 10 (30.3%) |
| 65 to 74 Years | 37 (74.0%) | 0 (0.0%) |
| 75 Years and over | 0 (0.0%) | 10 (100.0%) |
Disability Class by Sex by Age in Johnstown
Disability Class: Hearing Difficulty
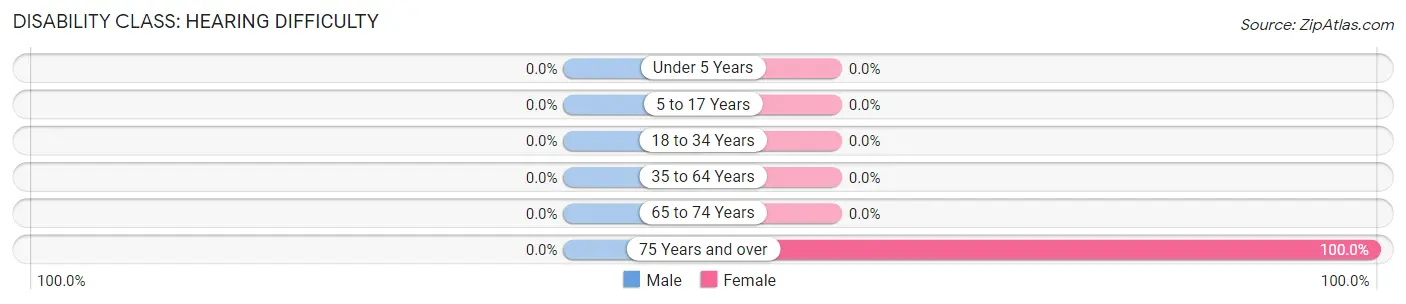
| Age Bracket | Male | Female |
| Under 5 Years | 0 (0.0%) | 0 (0.0%) |
| 5 to 17 Years | 0 (0.0%) | 0 (0.0%) |
| 18 to 34 Years | 0 (0.0%) | 0 (0.0%) |
| 35 to 64 Years | 0 (0.0%) | 0 (0.0%) |
| 65 to 74 Years | 0 (0.0%) | 0 (0.0%) |
| 75 Years and over | 0 (0.0%) | 10 (100.0%) |
Disability Class: Vision Difficulty
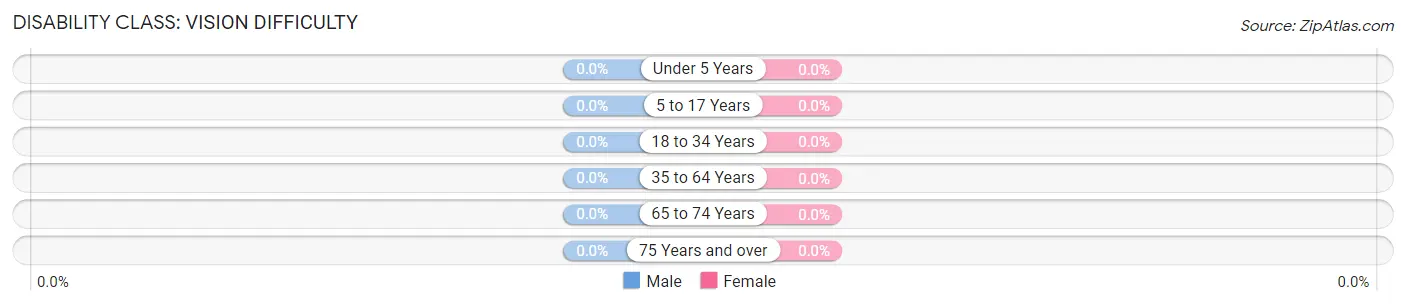
| Age Bracket | Male | Female |
| Under 5 Years | 0 (0.0%) | 0 (0.0%) |
| 5 to 17 Years | 0 (0.0%) | 0 (0.0%) |
| 18 to 34 Years | 0 (0.0%) | 0 (0.0%) |
| 35 to 64 Years | 0 (0.0%) | 0 (0.0%) |
| 65 to 74 Years | 0 (0.0%) | 0 (0.0%) |
| 75 Years and over | 0 (0.0%) | 0 (0.0%) |
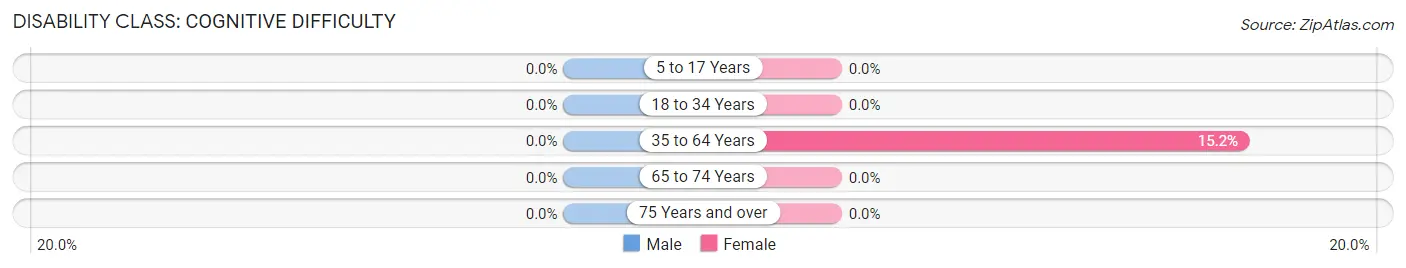
Disability Class: Cognitive Difficulty
| Age Bracket | Male | Female |
| 5 to 17 Years | 0 (0.0%) | 0 (0.0%) |
| 18 to 34 Years | 0 (0.0%) | 0 (0.0%) |
| 35 to 64 Years | 0 (0.0%) | 5 (15.1%) |
| 65 to 74 Years | 0 (0.0%) | 0 (0.0%) |
| 75 Years and over | 0 (0.0%) | 0 (0.0%) |
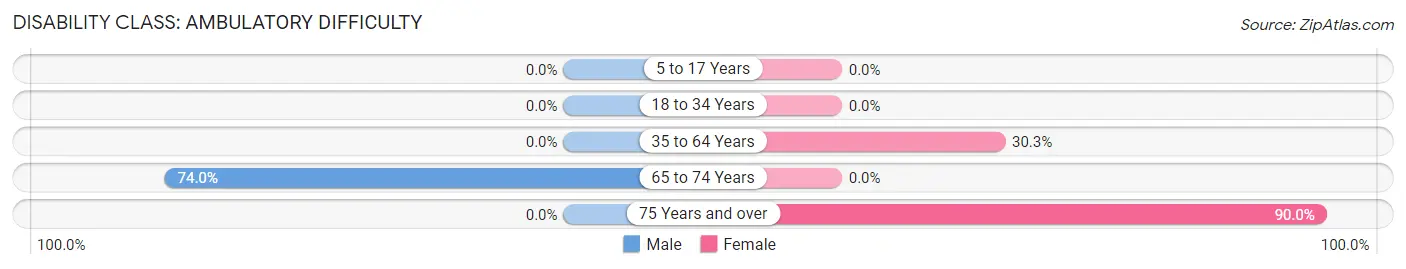
Disability Class: Ambulatory Difficulty
| Age Bracket | Male | Female |
| 5 to 17 Years | 0 (0.0%) | 0 (0.0%) |
| 18 to 34 Years | 0 (0.0%) | 0 (0.0%) |
| 35 to 64 Years | 0 (0.0%) | 10 (30.3%) |
| 65 to 74 Years | 37 (74.0%) | 0 (0.0%) |
| 75 Years and over | 0 (0.0%) | 9 (90.0%) |
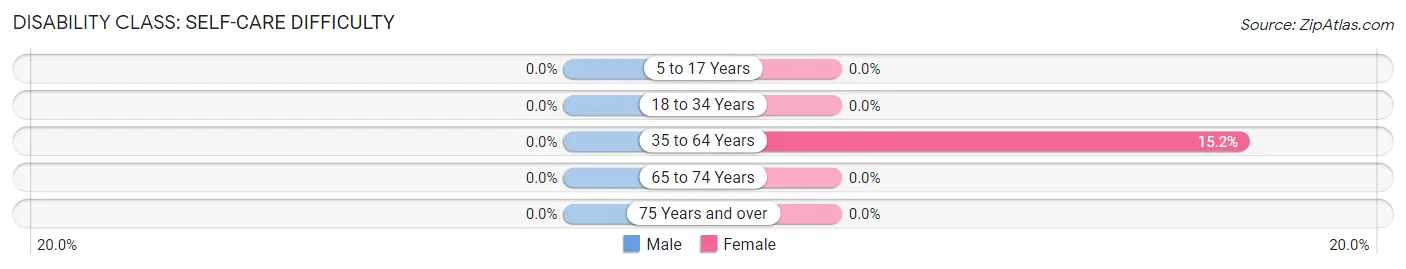
Disability Class: Self-Care Difficulty
| Age Bracket | Male | Female |
| 5 to 17 Years | 0 (0.0%) | 0 (0.0%) |
| 18 to 34 Years | 0 (0.0%) | 0 (0.0%) |
| 35 to 64 Years | 0 (0.0%) | 5 (15.1%) |
| 65 to 74 Years | 0 (0.0%) | 0 (0.0%) |
| 75 Years and over | 0 (0.0%) | 0 (0.0%) |
Technology Access in Johnstown
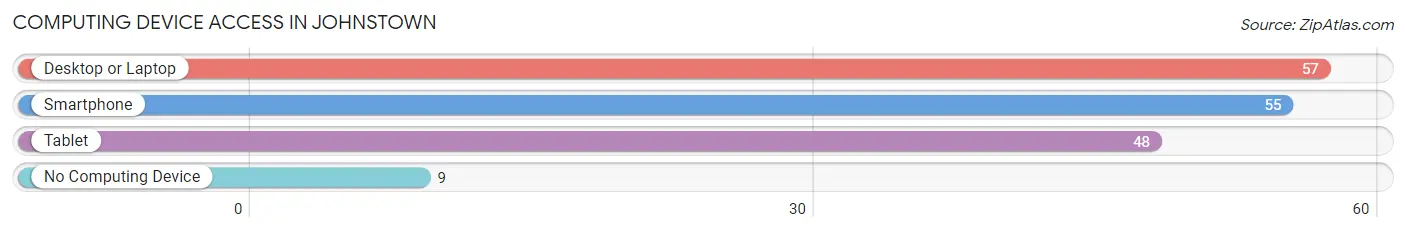
Computing Device Access in Johnstown
| Device Type | # Households | % Households |
| Desktop or Laptop | 57 | 77.0% |
| Smartphone | 55 | 74.3% |
| Tablet | 48 | 64.9% |
| No Computing Device | 9 | 12.2% |
| Total | 74 | 100.0% |
Internet Access in Johnstown
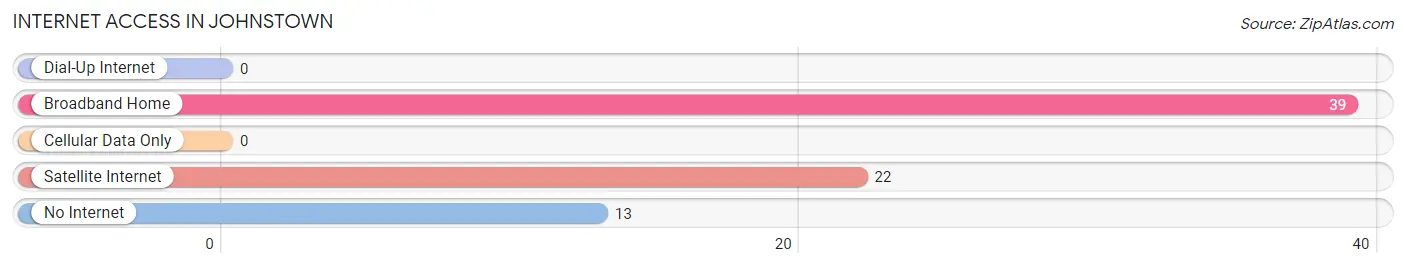
| Internet Type | # Households | % Households |
| Dial-Up Internet | 0 | 0.0% |
| Broadband Home | 39 | 52.7% |
| Cellular Data Only | 0 | 0.0% |
| Satellite Internet | 22 | 29.7% |
| No Internet | 13 | 17.6% |
| Total | 74 | 100.0% |
Johnstown Summary
Johnstown, Wyoming is a small town located in the southeastern corner of the state, near the border of Colorado and Nebraska. It is part of the Cheyenne metropolitan area and is the county seat of Laramie County. The town was founded in 1868 and has a population of just over 500 people.
Johnstown is located in the Laramie Basin, which is a large, flat area of land surrounded by mountains. The town is situated at an elevation of 6,000 feet and is surrounded by the Laramie Mountains to the west, the Medicine Bow Mountains to the north, and the Snowy Range to the east. The town is located on the banks of the Laramie River, which is a tributary of the North Platte River.
Johnstown has a semi-arid climate, with hot summers and cold winters. The average high temperature in July is 85 degrees Fahrenheit, and the average low temperature in January is -7 degrees Fahrenheit. The town receives an average of 16 inches of precipitation per year, with most of it falling in the form of snow.
Johnstown's economy is largely based on agriculture and ranching. The town is home to several large ranches, and the surrounding area is used for grazing cattle and sheep. The town also has a small manufacturing sector, with several small businesses producing a variety of products.
Johnstown is served by the Laramie County School District, which includes two elementary schools, one middle school, and one high school. The town also has a library, a post office, and several churches.
Johnstown's population is largely white, with a small Hispanic population. The median household income is $45,000, and the median home value is $150,000. The town has a low unemployment rate, and the poverty rate is below the national average.
Johnstown is a small town with a rich history and a bright future. It is a great place to live, work, and raise a family. The town has a strong sense of community and is a great place to call home.
Common Questions
What is Per Capita Income in Johnstown?
Per Capita income in Johnstown is $33,421.
What is the Median Family Income in Johnstown?
Median Family Income in Johnstown is $86,250.
What is the Median Household income in Johnstown?
Median Household Income in Johnstown is $56,250.
What is Inequality or Gini Index in Johnstown?
Inequality or Gini Index in Johnstown is 0.49.
What is the Total Population of Johnstown?
Total Population of Johnstown is 231.
What is the Total Male Population of Johnstown?
Total Male Population of Johnstown is 138.
What is the Total Female Population of Johnstown?
Total Female Population of Johnstown is 93.
What is the Ratio of Males per 100 Females in Johnstown?
There are 148.39 Males per 100 Females in Johnstown.
What is the Ratio of Females per 100 Males in Johnstown?
There are 67.39 Females per 100 Males in Johnstown.
What is the Median Population Age in Johnstown?
Median Population Age in Johnstown is 53.2 Years.
What is the Average Family Size in Johnstown
Average Family Size in Johnstown is 4.1 People.
What is the Average Household Size in Johnstown
Average Household Size in Johnstown is 3.1 People.
How Large is the Labor Force in Johnstown?
There are 123 People in the Labor Forcein in Johnstown.
What is the Percentage of People in the Labor Force in Johnstown?
59.7% of People are in the Labor Force in Johnstown.
What is the Unemployment Rate in Johnstown?
Unemployment Rate in Johnstown is 4.9%.