Dayton, WY Map & Demographics
Dayton Map
Dayton Overview
$35,349
PER CAPITA INCOME
$104,231
AVG FAMILY INCOME
$86,786
AVG HOUSEHOLD INCOME
19.0%
WAGE / INCOME GAP [ % ]
81.0¢/ $1
WAGE / INCOME GAP [ $ ]
0.42
INEQUALITY / GINI INDEX
871
TOTAL POPULATION
445
MALE POPULATION
426
FEMALE POPULATION
104.46
MALES / 100 FEMALES
95.73
FEMALES / 100 MALES
42.5
MEDIAN AGE
4.0
AVG FAMILY SIZE
3.1
AVG HOUSEHOLD SIZE
443
LABOR FORCE [ PEOPLE ]
66.7%
PERCENT IN LABOR FORCE
0.7%
UNEMPLOYMENT RATE
Dayton Zip Codes
Dayton Area Codes
Income in Dayton
Income Overview in Dayton
Per Capita Income in Dayton is $35,349, while median incomes of families and households are $104,231 and $86,786 respectively.
| Characteristic | Number | Measure |
| Per Capita Income | 871 | $35,349 |
| Median Family Income | 192 | $104,231 |
| Mean Family Income | 192 | $122,522 |
| Median Household Income | 282 | $86,786 |
| Mean Household Income | 282 | $100,900 |
| Income Deficit | 192 | $0 |
| Wage / Income Gap (%) | 871 | 18.97% |
| Wage / Income Gap ($) | 871 | 81.03¢ per $1 |
| Gini / Inequality Index | 871 | 0.42 |
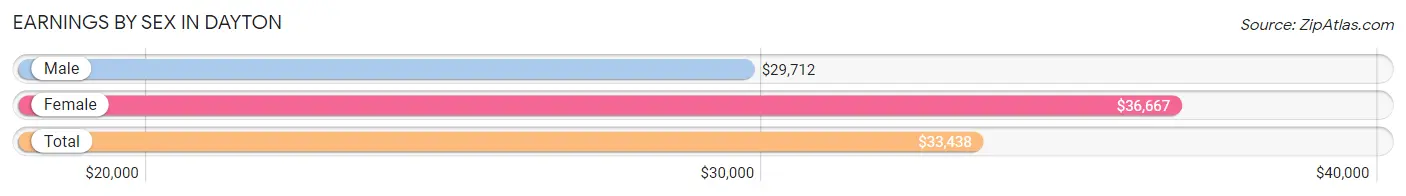
Earnings by Sex in Dayton
Average Earnings in Dayton are $33,438, $29,712 for men and $36,667 for women, a difference of 19.0%.
| Sex | Number | Average Earnings |
| Male | 291 (63.1%) | $29,712 |
| Female | 170 (36.9%) | $36,667 |
| Total | 461 (100.0%) | $33,438 |
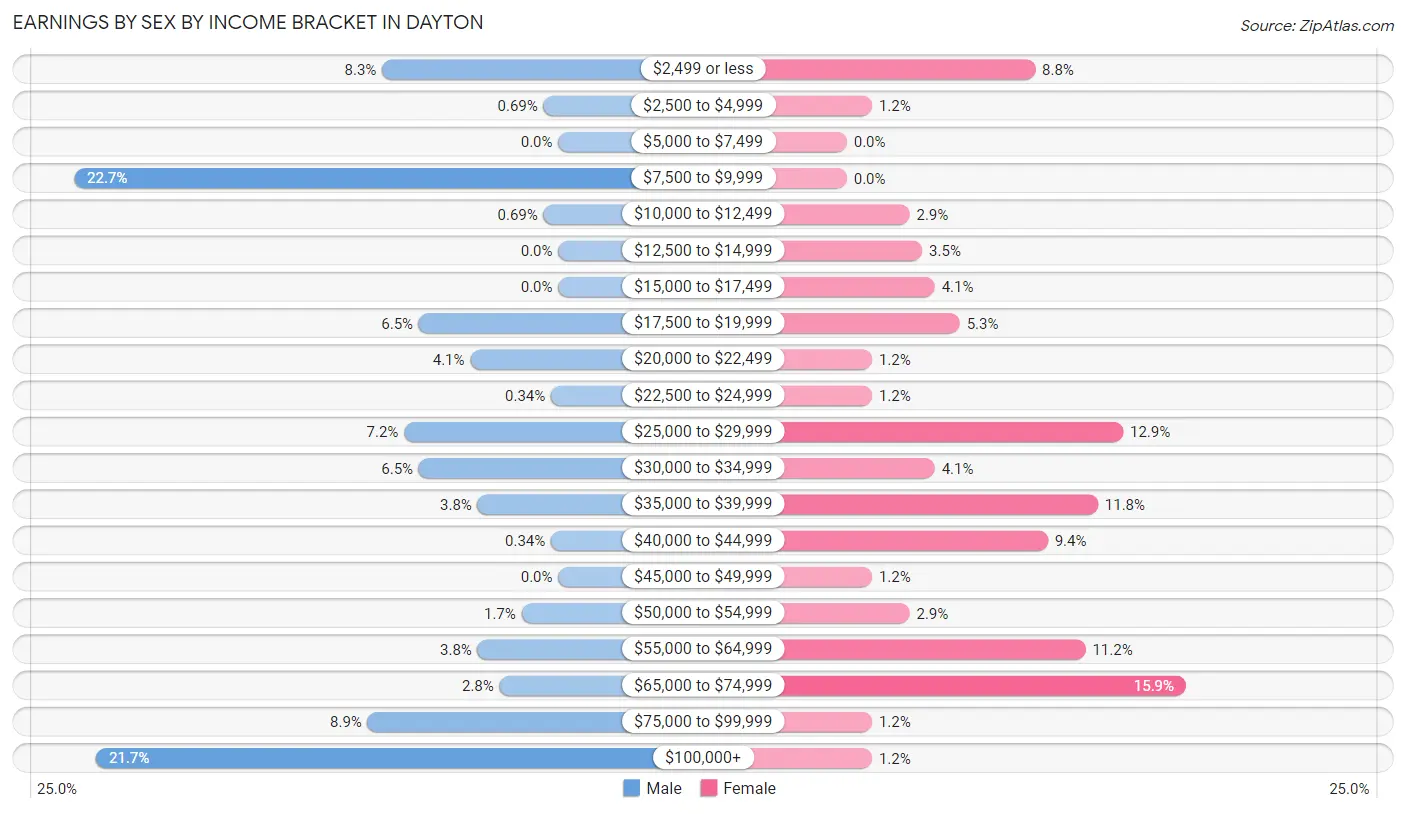
Earnings by Sex by Income Bracket in Dayton
The most common earnings brackets in Dayton are $7,500 to $9,999 for men (66 | 22.7%) and $65,000 to $74,999 for women (27 | 15.9%).
| Income | Male | Female |
| $2,499 or less | 24 (8.3%) | 15 (8.8%) |
| $2,500 to $4,999 | 2 (0.7%) | 2 (1.2%) |
| $5,000 to $7,499 | 0 (0.0%) | 0 (0.0%) |
| $7,500 to $9,999 | 66 (22.7%) | 0 (0.0%) |
| $10,000 to $12,499 | 2 (0.7%) | 5 (2.9%) |
| $12,500 to $14,999 | 0 (0.0%) | 6 (3.5%) |
| $15,000 to $17,499 | 0 (0.0%) | 7 (4.1%) |
| $17,500 to $19,999 | 19 (6.5%) | 9 (5.3%) |
| $20,000 to $22,499 | 12 (4.1%) | 2 (1.2%) |
| $22,500 to $24,999 | 1 (0.3%) | 2 (1.2%) |
| $25,000 to $29,999 | 21 (7.2%) | 22 (12.9%) |
| $30,000 to $34,999 | 19 (6.5%) | 7 (4.1%) |
| $35,000 to $39,999 | 11 (3.8%) | 20 (11.8%) |
| $40,000 to $44,999 | 1 (0.3%) | 16 (9.4%) |
| $45,000 to $49,999 | 0 (0.0%) | 2 (1.2%) |
| $50,000 to $54,999 | 5 (1.7%) | 5 (2.9%) |
| $55,000 to $64,999 | 11 (3.8%) | 19 (11.2%) |
| $65,000 to $74,999 | 8 (2.8%) | 27 (15.9%) |
| $75,000 to $99,999 | 26 (8.9%) | 2 (1.2%) |
| $100,000+ | 63 (21.6%) | 2 (1.2%) |
| Total | 291 (100.0%) | 170 (100.0%) |
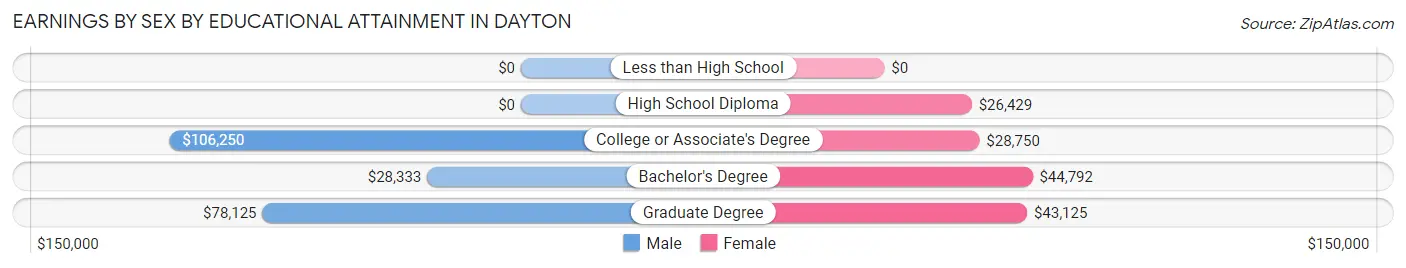
Earnings by Sex by Educational Attainment in Dayton
Average earnings in Dayton are $34,833 for men and $38,281 for women, a difference of 9.0%. Men with an educational attainment of college or associate's degree enjoy the highest average annual earnings of $106,250, while those with bachelor's degree education earn the least with $28,333. Women with an educational attainment of bachelor's degree earn the most with the average annual earnings of $44,792, while those with high school diploma education have the smallest earnings of $26,429.
| Educational Attainment | Male Income | Female Income |
| Less than High School | - | - |
| High School Diploma | - | - |
| College or Associate's Degree | $106,250 | $28,750 |
| Bachelor's Degree | $28,333 | $44,792 |
| Graduate Degree | $78,125 | $43,125 |
| Total | $34,833 | $38,281 |
Family Income in Dayton
Family Income Brackets in Dayton
According to the Dayton family income data, there are 66 families falling into the $100,000 to $149,999 income range, which is the most common income bracket and makes up 34.4% of all families.
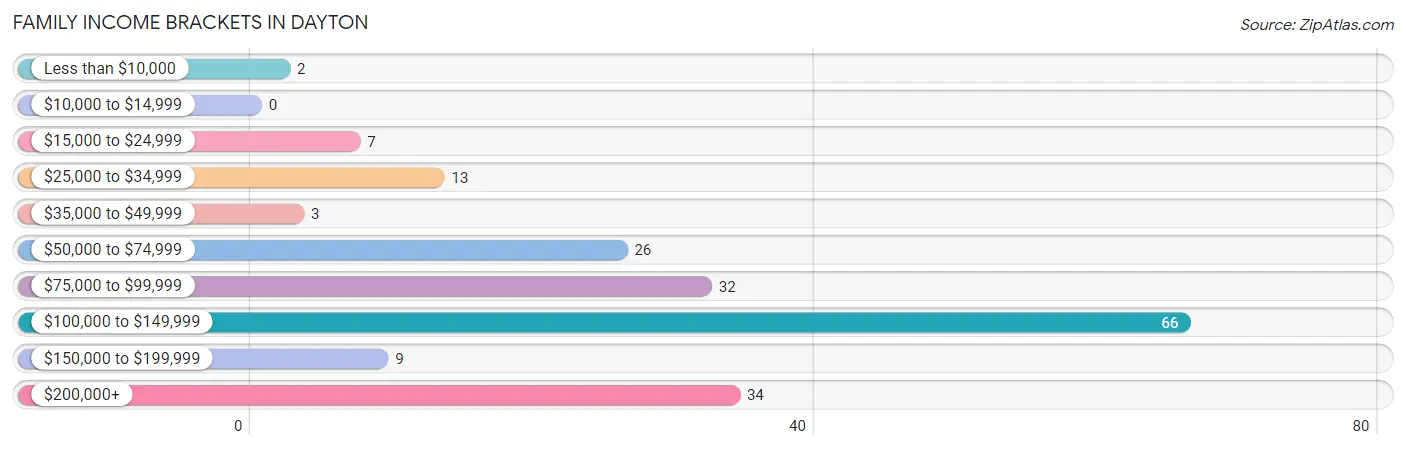
| Income Bracket | # Families | % Families |
| Less than $10,000 | 2 | 1.0% |
| $10,000 to $14,999 | 0 | 0.0% |
| $15,000 to $24,999 | 7 | 3.6% |
| $25,000 to $34,999 | 13 | 6.8% |
| $35,000 to $49,999 | 3 | 1.6% |
| $50,000 to $74,999 | 26 | 13.5% |
| $75,000 to $99,999 | 32 | 16.7% |
| $100,000 to $149,999 | 66 | 34.4% |
| $150,000 to $199,999 | 9 | 4.7% |
| $200,000+ | 34 | 17.7% |
Family Income by Famaliy Size in Dayton
4-person families (27 | 14.1%) account for the highest median family income in Dayton with $139,375 per family, while 2-person families (88 | 45.8%) have the highest median income of $35,000 per family member.
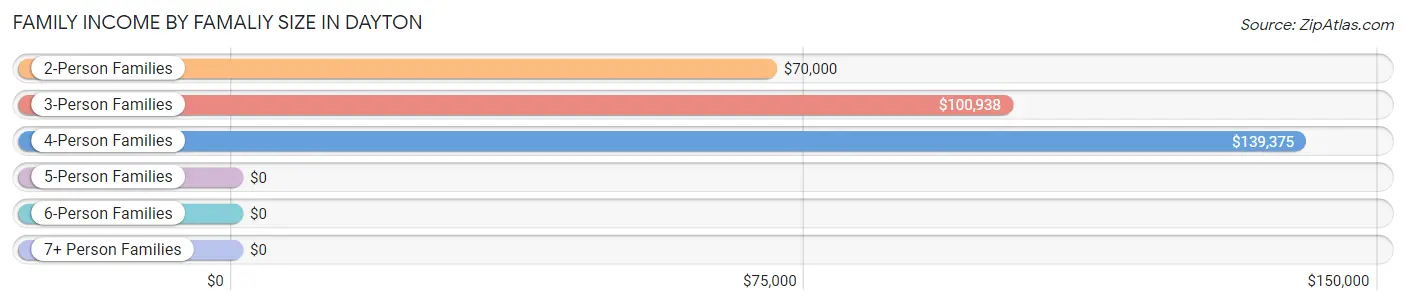
| Income Bracket | # Families | Median Income |
| 2-Person Families | 88 (45.8%) | $70,000 |
| 3-Person Families | 29 (15.1%) | $100,938 |
| 4-Person Families | 27 (14.1%) | $139,375 |
| 5-Person Families | 46 (24.0%) | $0 |
| 6-Person Families | 2 (1.0%) | $0 |
| 7+ Person Families | 0 (0.0%) | $0 |
| Total | 192 (100.0%) | $104,231 |
Family Income by Number of Earners in Dayton
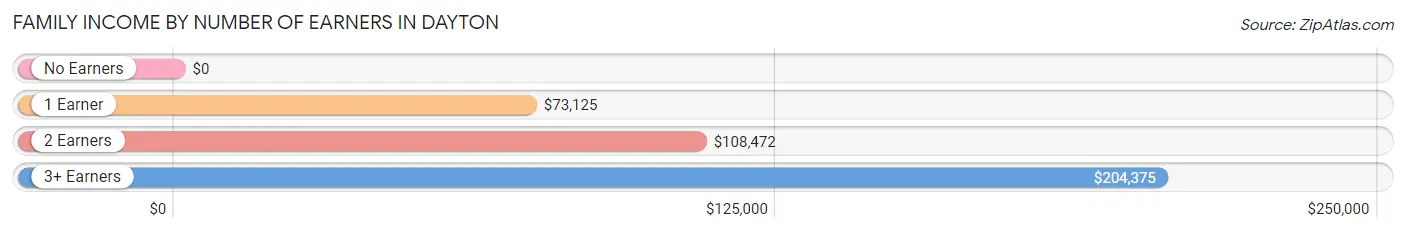
| Number of Earners | # Families | Median Income |
| No Earners | 32 (16.7%) | $0 |
| 1 Earner | 31 (16.2%) | $73,125 |
| 2 Earners | 94 (49.0%) | $108,472 |
| 3+ Earners | 35 (18.2%) | $204,375 |
| Total | 192 (100.0%) | $104,231 |
Household Income in Dayton
Household Income Brackets in Dayton
With 66 households falling in the category, the $100,000 to $149,999 income range is the most frequent in Dayton, accounting for 23.4% of all households.
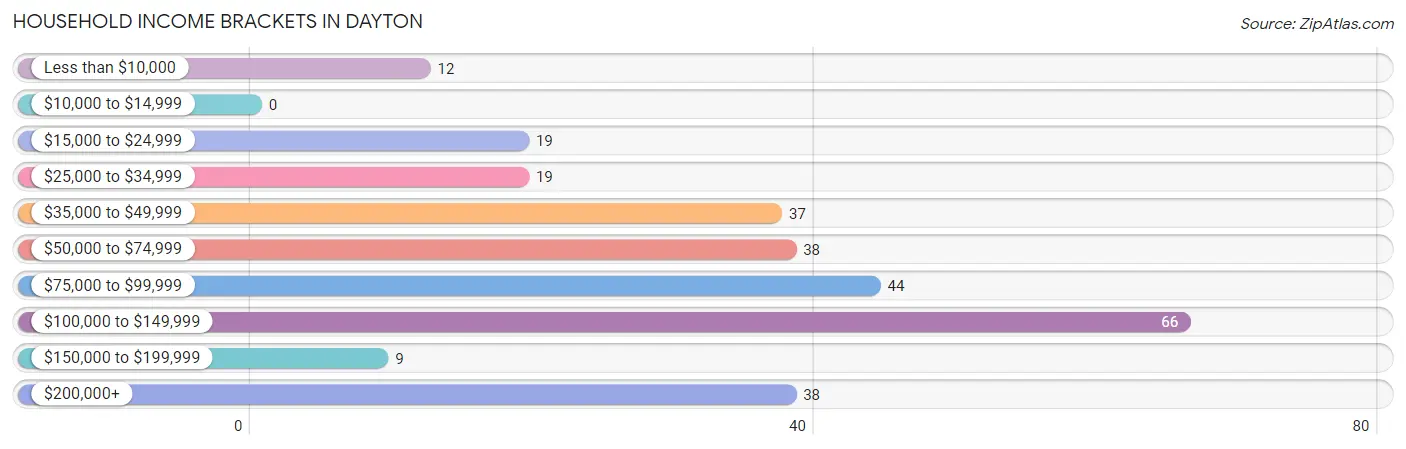
| Income Bracket | # Households | % Households |
| Less than $10,000 | 12 | 4.3% |
| $10,000 to $14,999 | 0 | 0.0% |
| $15,000 to $24,999 | 19 | 6.7% |
| $25,000 to $34,999 | 19 | 6.7% |
| $35,000 to $49,999 | 37 | 13.1% |
| $50,000 to $74,999 | 38 | 13.5% |
| $75,000 to $99,999 | 44 | 15.6% |
| $100,000 to $149,999 | 66 | 23.4% |
| $150,000 to $199,999 | 9 | 3.2% |
| $200,000+ | 38 | 13.5% |
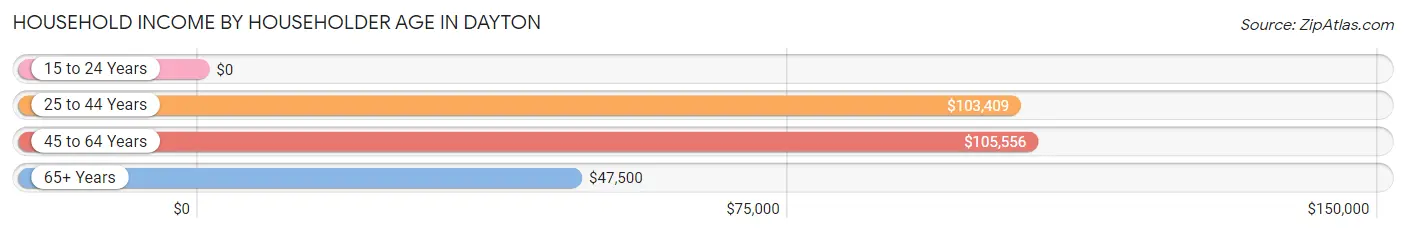
Household Income by Householder Age in Dayton
The median household income in Dayton is $86,786, with the highest median household income of $105,556 found in the 45 to 64 years age bracket for the primary householder. A total of 146 households (51.8%) fall into this category.
| Income Bracket | # Households | Median Income |
| 15 to 24 Years | 0 (0.0%) | $0 |
| 25 to 44 Years | 30 (10.6%) | $103,409 |
| 45 to 64 Years | 146 (51.8%) | $105,556 |
| 65+ Years | 106 (37.6%) | $47,500 |
| Total | 282 (100.0%) | $86,786 |
Poverty in Dayton
Income Below Poverty by Sex and Age in Dayton
With 2.5% poverty level for males and 2.4% for females among the residents of Dayton, 55 to 64 year old males and 75 year old and over females are the most vulnerable to poverty, with 8 males (19.5%) and 4 females (14.8%) in their respective age groups living below the poverty level.
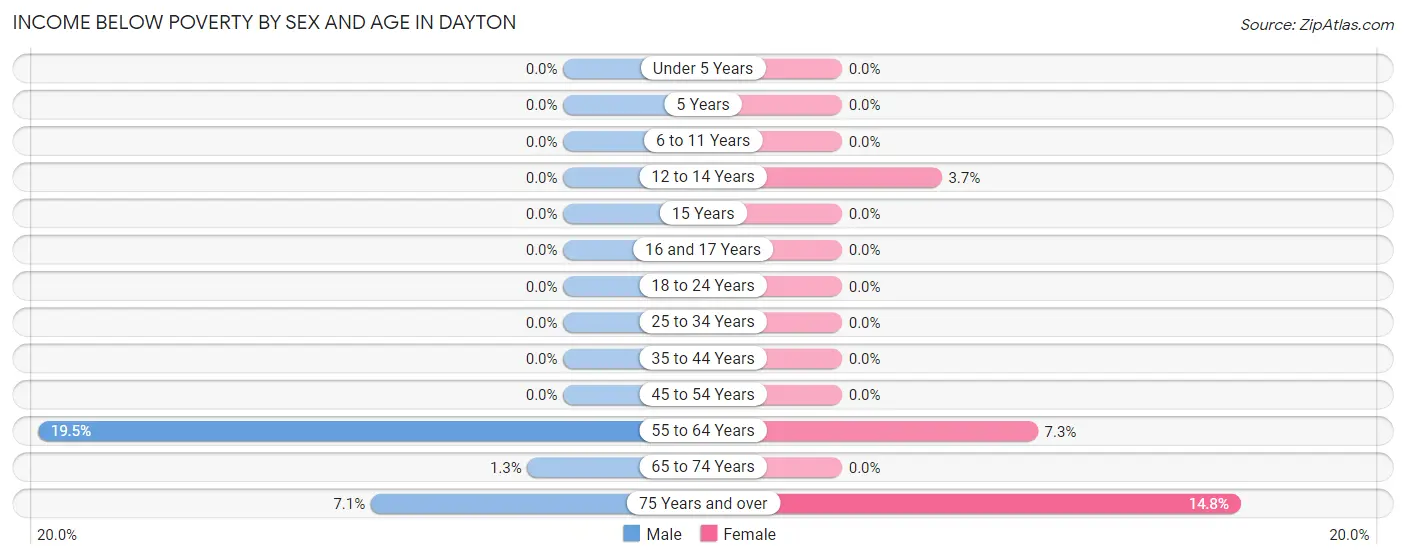
| Age Bracket | Male | Female |
| Under 5 Years | 0 (0.0%) | 0 (0.0%) |
| 5 Years | 0 (0.0%) | 0 (0.0%) |
| 6 to 11 Years | 0 (0.0%) | 0 (0.0%) |
| 12 to 14 Years | 0 (0.0%) | 2 (3.7%) |
| 15 Years | 0 (0.0%) | 0 (0.0%) |
| 16 and 17 Years | 0 (0.0%) | 0 (0.0%) |
| 18 to 24 Years | 0 (0.0%) | 0 (0.0%) |
| 25 to 34 Years | 0 (0.0%) | 0 (0.0%) |
| 35 to 44 Years | 0 (0.0%) | 0 (0.0%) |
| 45 to 54 Years | 0 (0.0%) | 0 (0.0%) |
| 55 to 64 Years | 8 (19.5%) | 4 (7.3%) |
| 65 to 74 Years | 1 (1.3%) | 0 (0.0%) |
| 75 Years and over | 2 (7.1%) | 4 (14.8%) |
| Total | 11 (2.5%) | 10 (2.4%) |
Income Above Poverty by Sex and Age in Dayton
According to the poverty statistics in Dayton, males aged under 5 years and females aged under 5 years are the age groups that are most secure financially, with 100.0% of males and 100.0% of females in these age groups living above the poverty line.
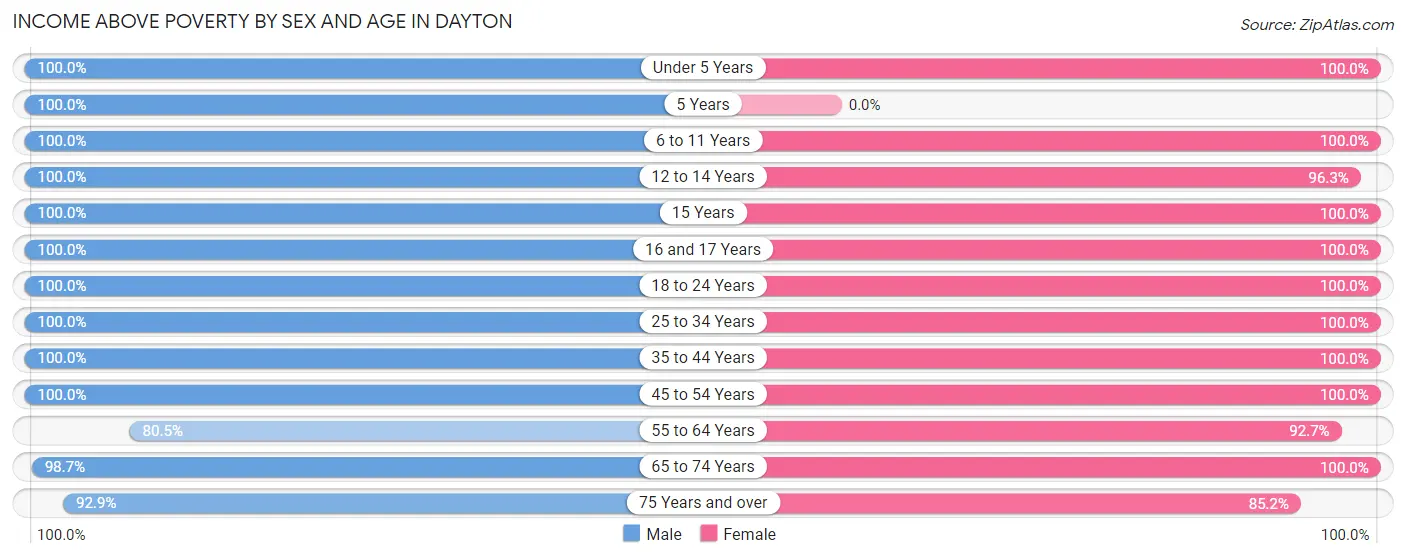
| Age Bracket | Male | Female |
| Under 5 Years | 7 (100.0%) | 7 (100.0%) |
| 5 Years | 12 (100.0%) | 0 (0.0%) |
| 6 to 11 Years | 15 (100.0%) | 78 (100.0%) |
| 12 to 14 Years | 19 (100.0%) | 52 (96.3%) |
| 15 Years | 8 (100.0%) | 7 (100.0%) |
| 16 and 17 Years | 8 (100.0%) | 42 (100.0%) |
| 18 to 24 Years | 36 (100.0%) | 4 (100.0%) |
| 25 to 34 Years | 79 (100.0%) | 11 (100.0%) |
| 35 to 44 Years | 64 (100.0%) | 28 (100.0%) |
| 45 to 54 Years | 53 (100.0%) | 40 (100.0%) |
| 55 to 64 Years | 33 (80.5%) | 51 (92.7%) |
| 65 to 74 Years | 74 (98.7%) | 73 (100.0%) |
| 75 Years and over | 26 (92.9%) | 23 (85.2%) |
| Total | 434 (97.5%) | 416 (97.7%) |
Income Below Poverty Among Married-Couple Families in Dayton
The poverty statistics for married-couple families in Dayton show that 2.9% or 5 of the total 172 families live below the poverty line. Families with 1 or 2 children have the highest poverty rate of 3.7%, comprising of 2 families. On the other hand, families with 3 or 4 children have the lowest poverty rate of 0.0%, which includes 0 families.
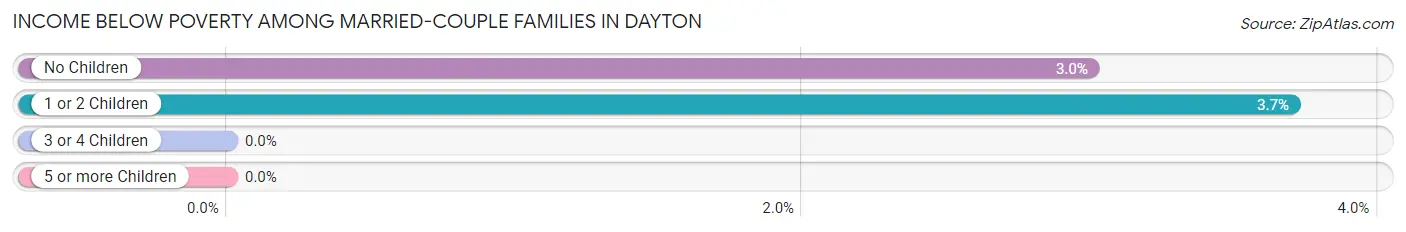
| Children | Above Poverty | Below Poverty |
| No Children | 97 (97.0%) | 3 (3.0%) |
| 1 or 2 Children | 52 (96.3%) | 2 (3.7%) |
| 3 or 4 Children | 18 (100.0%) | 0 (0.0%) |
| 5 or more Children | 0 (0.0%) | 0 (0.0%) |
| Total | 167 (97.1%) | 5 (2.9%) |
Income Below Poverty Among Single-Parent Households in Dayton
| Children | Single Father | Single Mother |
| No Children | 0 (0.0%) | 0 (0.0%) |
| 1 or 2 Children | 0 (0.0%) | 0 (0.0%) |
| 3 or 4 Children | 0 (0.0%) | 0 (0.0%) |
| 5 or more Children | 0 (0.0%) | 0 (0.0%) |
| Total | 0 (0.0%) | 0 (0.0%) |
Income Below Poverty Among Married-Couple vs Single-Parent Households in Dayton
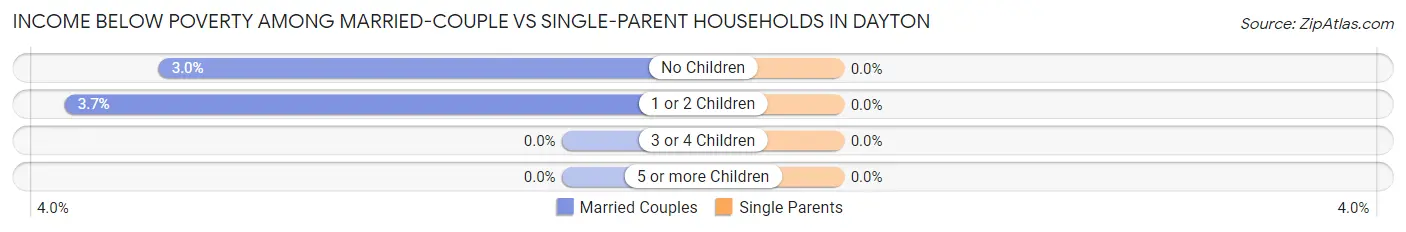
| Children | Married-Couple Families | Single-Parent Households |
| No Children | 3 (3.0%) | 0 (0.0%) |
| 1 or 2 Children | 2 (3.7%) | 0 (0.0%) |
| 3 or 4 Children | 0 (0.0%) | 0 (0.0%) |
| 5 or more Children | 0 (0.0%) | 0 (0.0%) |
| Total | 5 (2.9%) | 0 (0.0%) |
Race in Dayton
The most populous races in Dayton are White / Caucasian (834 | 95.8%), Hispanic or Latino (18 | 2.1%), and Asian (14 | 1.6%).
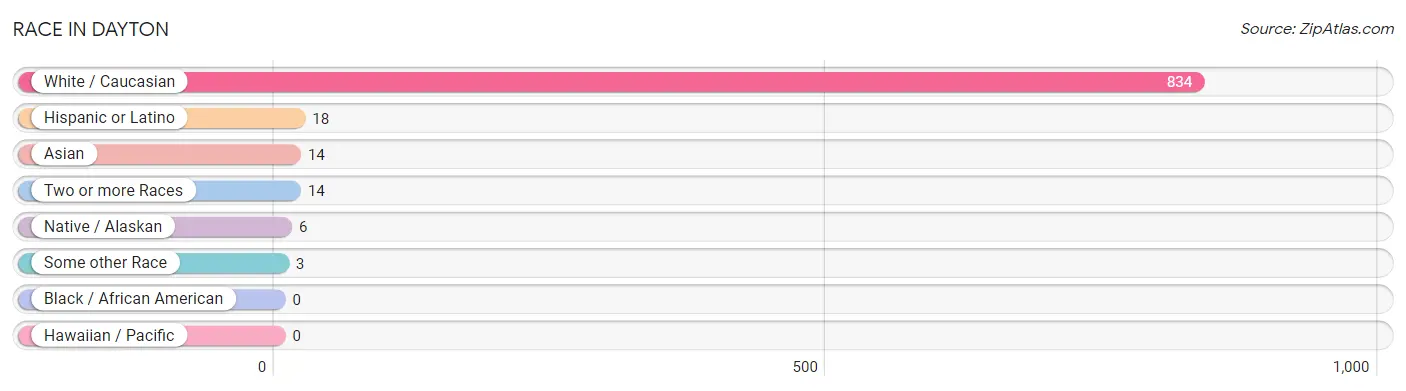
| Race | # Population | % Population |
| Asian | 14 | 1.6% |
| Black / African American | 0 | 0.0% |
| Hawaiian / Pacific | 0 | 0.0% |
| Hispanic or Latino | 18 | 2.1% |
| Native / Alaskan | 6 | 0.7% |
| White / Caucasian | 834 | 95.8% |
| Two or more Races | 14 | 1.6% |
| Some other Race | 3 | 0.3% |
| Total | 871 | 100.0% |
Ancestry in Dayton
The most populous ancestries reported in Dayton are German (126 | 14.5%), English (63 | 7.2%), French (23 | 2.6%), Irish (17 | 1.9%), and Korean (14 | 1.6%), together accounting for 27.9% of all Dayton residents.
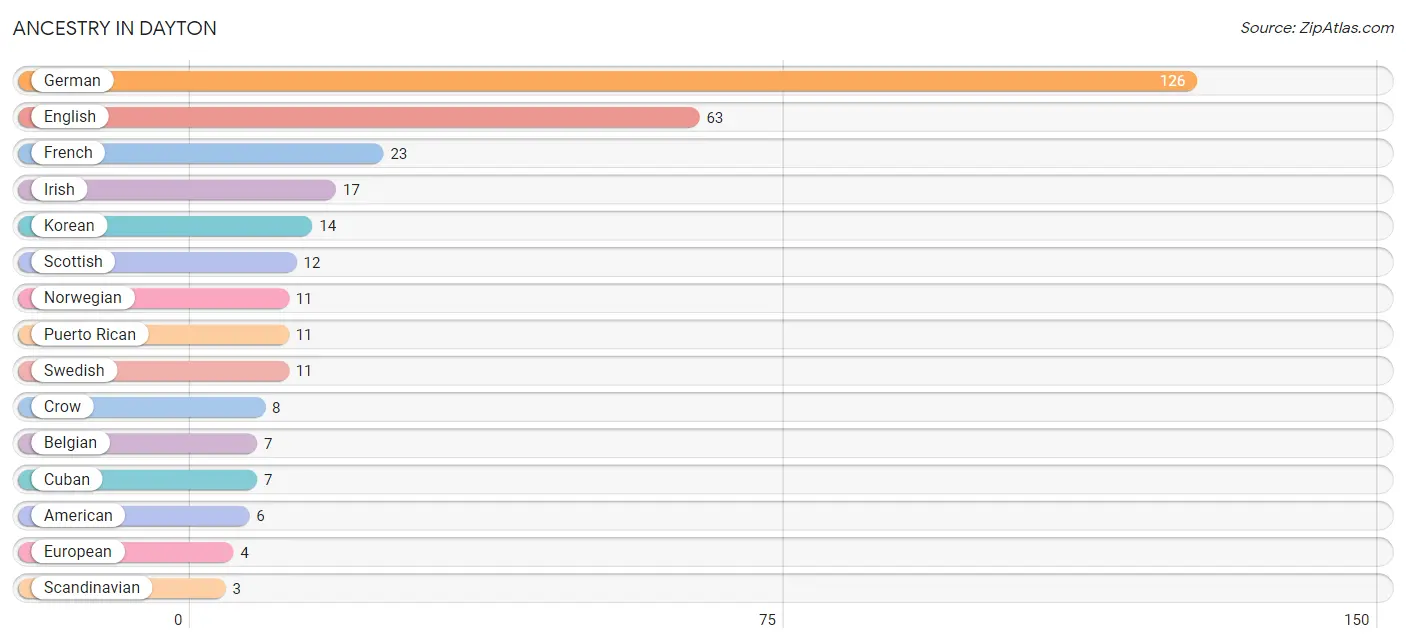
| Ancestry | # Population | % Population |
| American | 6 | 0.7% |
| Belgian | 7 | 0.8% |
| Cheyenne | 1 | 0.1% |
| Croatian | 2 | 0.2% |
| Crow | 8 | 0.9% |
| Cuban | 7 | 0.8% |
| English | 63 | 7.2% |
| European | 4 | 0.5% |
| French | 23 | 2.6% |
| French Canadian | 1 | 0.1% |
| German | 126 | 14.5% |
| Indian (Asian) | 2 | 0.2% |
| Irish | 17 | 1.9% |
| Italian | 1 | 0.1% |
| Korean | 14 | 1.6% |
| Norwegian | 11 | 1.3% |
| Polish | 2 | 0.2% |
| Puerto Rican | 11 | 1.3% |
| Romanian | 2 | 0.2% |
| Scandinavian | 3 | 0.3% |
| Scotch-Irish | 2 | 0.2% |
| Scottish | 12 | 1.4% |
| Swedish | 11 | 1.3% |
| Swiss | 2 | 0.2% | View All 24 Rows |
Immigrants in Dayton
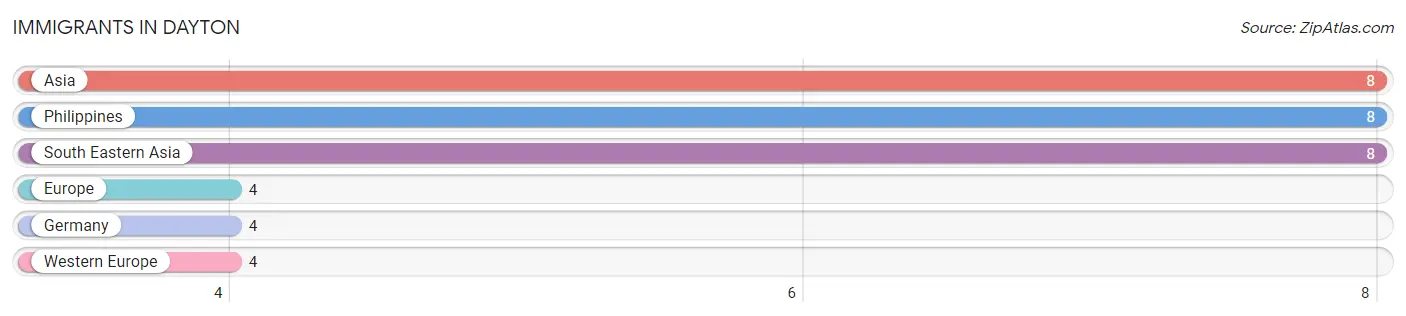
The most numerous immigrant groups reported in Dayton came from Asia (8 | 0.9%), Philippines (8 | 0.9%), South Eastern Asia (8 | 0.9%), Europe (4 | 0.5%), and Germany (4 | 0.5%), together accounting for 3.7% of all Dayton residents.
| Immigration Origin | # Population | % Population |
| Asia | 8 | 0.9% |
| Europe | 4 | 0.5% |
| Germany | 4 | 0.5% |
| Philippines | 8 | 0.9% |
| South Eastern Asia | 8 | 0.9% |
| Western Europe | 4 | 0.5% | View All 6 Rows |
Sex and Age in Dayton
Sex and Age in Dayton
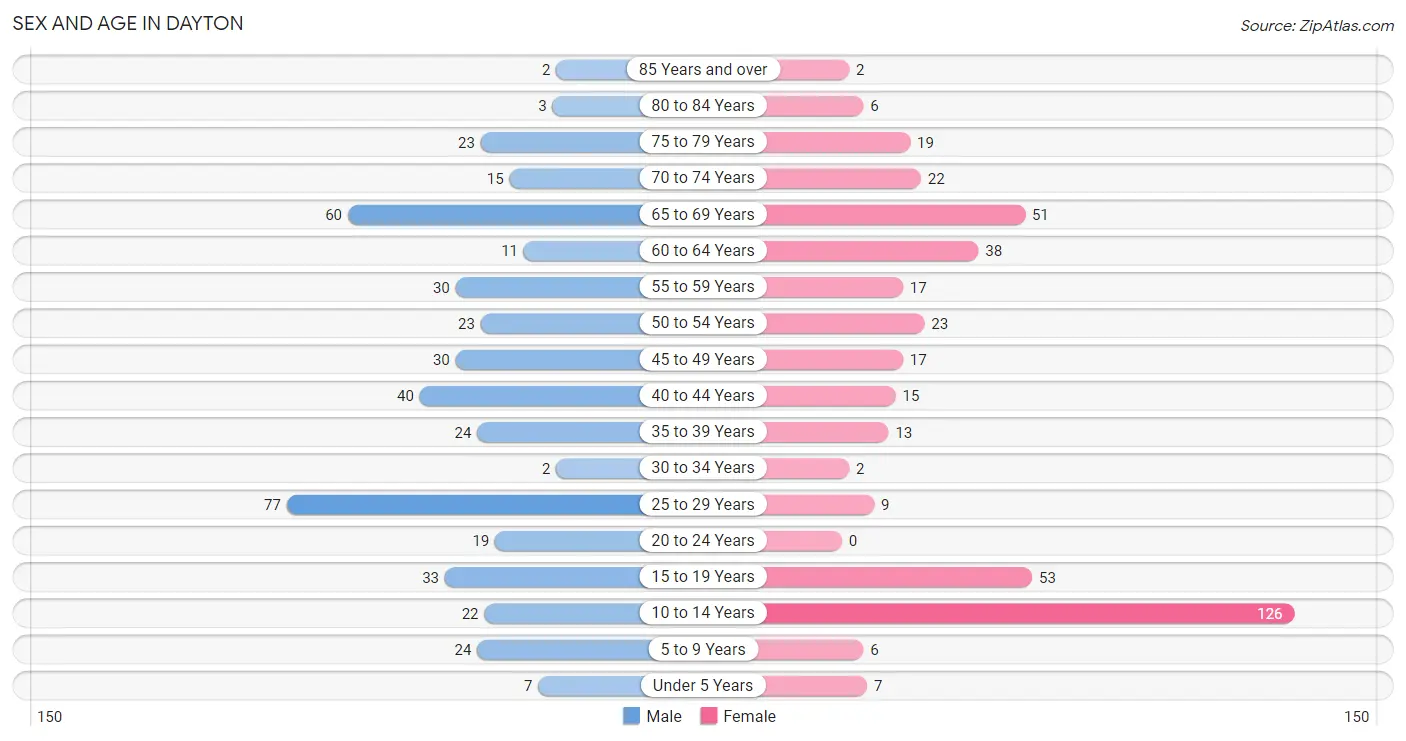
The most populous age groups in Dayton are 25 to 29 Years (77 | 17.3%) for men and 10 to 14 Years (126 | 29.6%) for women.
| Age Bracket | Male | Female |
| Under 5 Years | 7 (1.6%) | 7 (1.6%) |
| 5 to 9 Years | 24 (5.4%) | 6 (1.4%) |
| 10 to 14 Years | 22 (4.9%) | 126 (29.6%) |
| 15 to 19 Years | 33 (7.4%) | 53 (12.4%) |
| 20 to 24 Years | 19 (4.3%) | 0 (0.0%) |
| 25 to 29 Years | 77 (17.3%) | 9 (2.1%) |
| 30 to 34 Years | 2 (0.4%) | 2 (0.5%) |
| 35 to 39 Years | 24 (5.4%) | 13 (3.0%) |
| 40 to 44 Years | 40 (9.0%) | 15 (3.5%) |
| 45 to 49 Years | 30 (6.7%) | 17 (4.0%) |
| 50 to 54 Years | 23 (5.2%) | 23 (5.4%) |
| 55 to 59 Years | 30 (6.7%) | 17 (4.0%) |
| 60 to 64 Years | 11 (2.5%) | 38 (8.9%) |
| 65 to 69 Years | 60 (13.5%) | 51 (12.0%) |
| 70 to 74 Years | 15 (3.4%) | 22 (5.2%) |
| 75 to 79 Years | 23 (5.2%) | 19 (4.5%) |
| 80 to 84 Years | 3 (0.7%) | 6 (1.4%) |
| 85 Years and over | 2 (0.4%) | 2 (0.5%) |
| Total | 445 (100.0%) | 426 (100.0%) |
Families and Households in Dayton
Median Family Size in Dayton
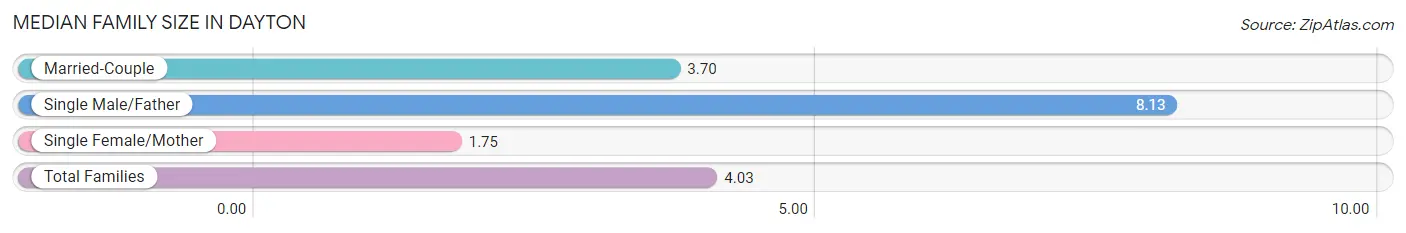
The median family size in Dayton is 4.03 persons per family, with single male/father families (16 | 8.3%) accounting for the largest median family size of 8.13 persons per family. On the other hand, single female/mother families (4 | 2.1%) represent the smallest median family size with 1.75 persons per family.
| Family Type | # Families | Family Size |
| Married-Couple | 172 (89.6%) | 3.70 |
| Single Male/Father | 16 (8.3%) | 8.13 |
| Single Female/Mother | 4 (2.1%) | 1.75 |
| Total Families | 192 (100.0%) | 4.03 |
Median Household Size in Dayton
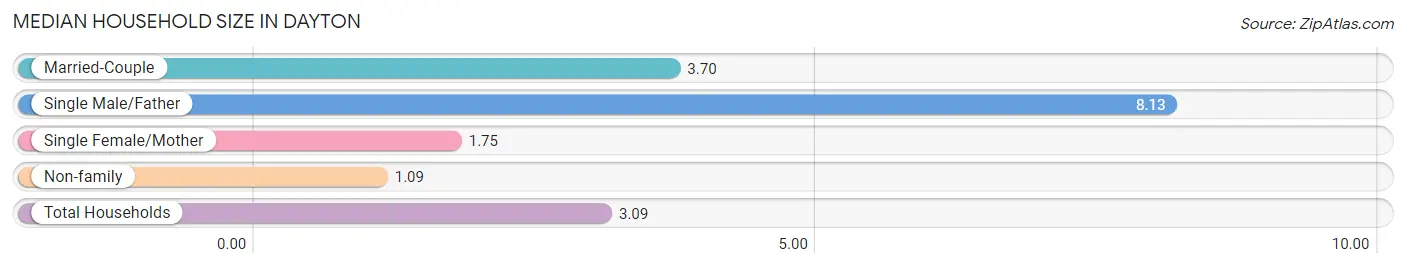
The median household size in Dayton is 3.09 persons per household, with single male/father households (16 | 5.7%) accounting for the largest median household size of 8.13 persons per household. non-family households (90 | 31.9%) represent the smallest median household size with 1.09 persons per household.
| Household Type | # Households | Household Size |
| Married-Couple | 172 (61.0%) | 3.70 |
| Single Male/Father | 16 (5.7%) | 8.13 |
| Single Female/Mother | 4 (1.4%) | 1.75 |
| Non-family | 90 (31.9%) | 1.09 |
| Total Households | 282 (100.0%) | 3.09 |
Household Size by Marriage Status in Dayton
Out of a total of 282 households in Dayton, 192 (68.1%) are family households, while 90 (31.9%) are nonfamily households. The most numerous type of family households are 2-person households, comprising 88, and the most common type of nonfamily households are 1-person households, comprising 87.
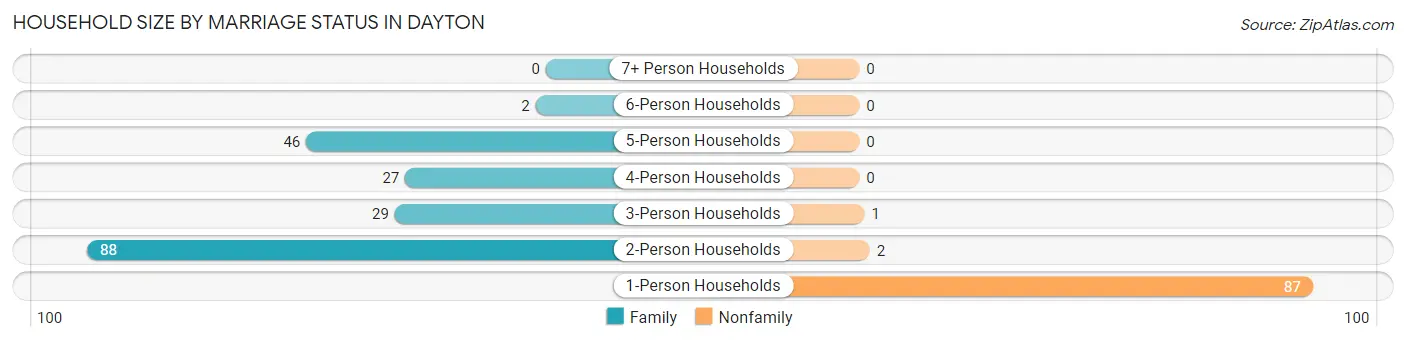
| Household Size | Family Households | Nonfamily Households |
| 1-Person Households | - | 87 (30.8%) |
| 2-Person Households | 88 (31.2%) | 2 (0.7%) |
| 3-Person Households | 29 (10.3%) | 1 (0.4%) |
| 4-Person Households | 27 (9.6%) | 0 (0.0%) |
| 5-Person Households | 46 (16.3%) | 0 (0.0%) |
| 6-Person Households | 2 (0.7%) | 0 (0.0%) |
| 7+ Person Households | 0 (0.0%) | 0 (0.0%) |
| Total | 192 (68.1%) | 90 (31.9%) |
Female Fertility in Dayton
Fertility by Age in Dayton
Average fertility rate in Dayton is 25.0 births per 1,000 women. Women in the age bracket of 35 to 50 years have the highest fertility rate with 55.0 births per 1,000 women. Women in the age bracket of 35 to 50 years acount for 100.0% of all women with births.
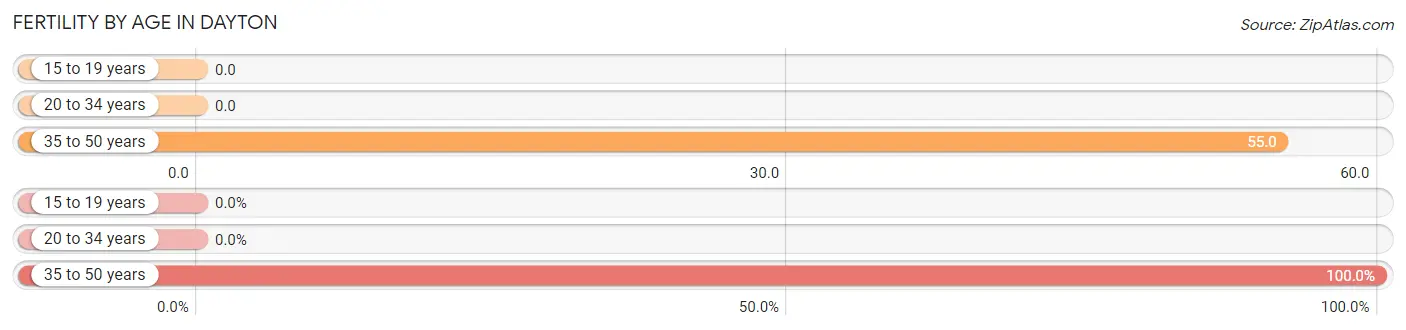
| Age Bracket | Women with Births | Births / 1,000 Women |
| 15 to 19 years | 0 (0.0%) | 0.0 |
| 20 to 34 years | 0 (0.0%) | 0.0 |
| 35 to 50 years | 3 (100.0%) | 55.0 |
| Total | 3 (100.0%) | 25.0 |
Fertility by Age by Marriage Status in Dayton
33.3% of women with births (3) in Dayton are married. The highest percentage of unmarried women with births falls into 35 to 50 years age bracket with 66.7% of them unmarried at the time of birth, while the lowest percentage of unmarried women with births belong to 35 to 50 years age bracket with 66.7% of them unmarried.
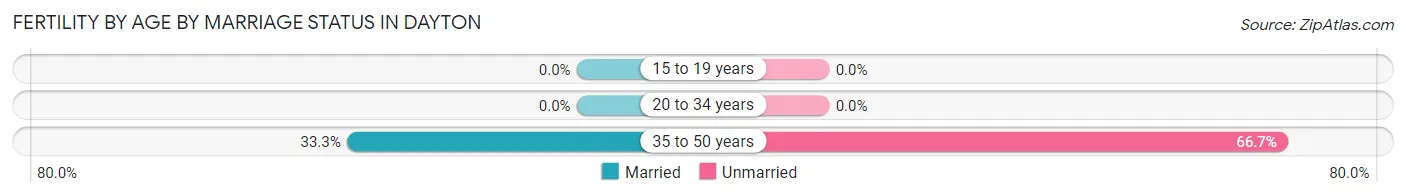
| Age Bracket | Married | Unmarried |
| 15 to 19 years | 0 (0.0%) | 0 (0.0%) |
| 20 to 34 years | 0 (0.0%) | 0 (0.0%) |
| 35 to 50 years | 1 (33.3%) | 2 (66.7%) |
| Total | 1 (33.3%) | 2 (66.7%) |
Fertility by Education in Dayton
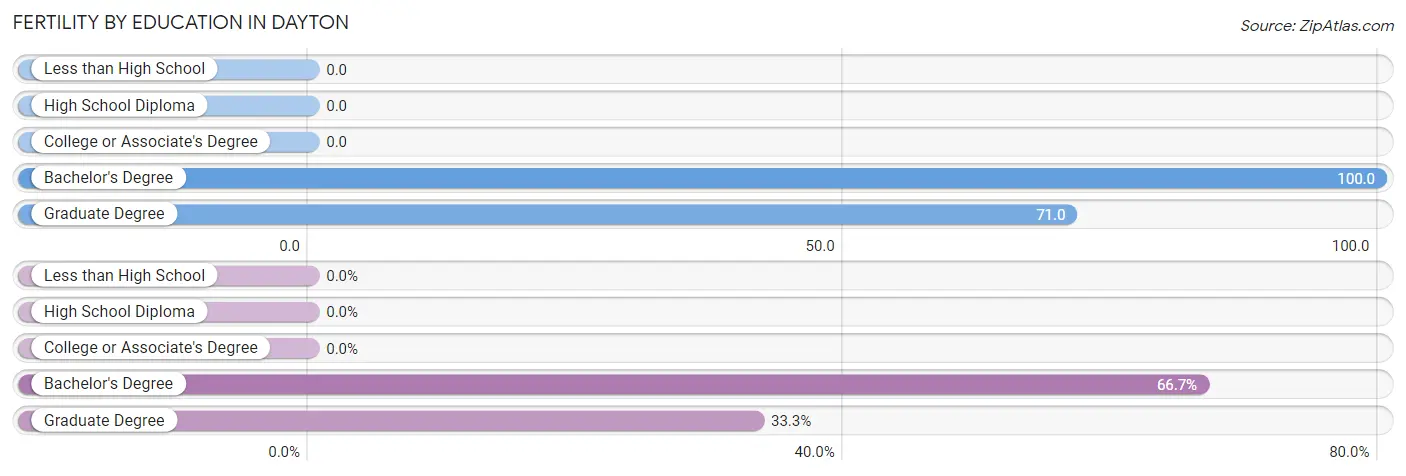
| Educational Attainment | Women with Births | Births / 1,000 Women |
| Less than High School | 0 (0.0%) | 0.0 |
| High School Diploma | 0 (0.0%) | 0.0 |
| College or Associate's Degree | 0 (0.0%) | 0.0 |
| Bachelor's Degree | 2 (66.7%) | 100.0 |
| Graduate Degree | 1 (33.3%) | 71.0 |
| Total | 3 (100.0%) | 25.0 |
Fertility by Education by Marriage Status in Dayton
66.7% of women with births in Dayton are unmarried. Women with the educational attainment of graduate degree are most likely to be married with 100.0% of them married at childbirth, while women with the educational attainment of bachelor's degree are least likely to be married with 100.0% of them unmarried at childbirth.
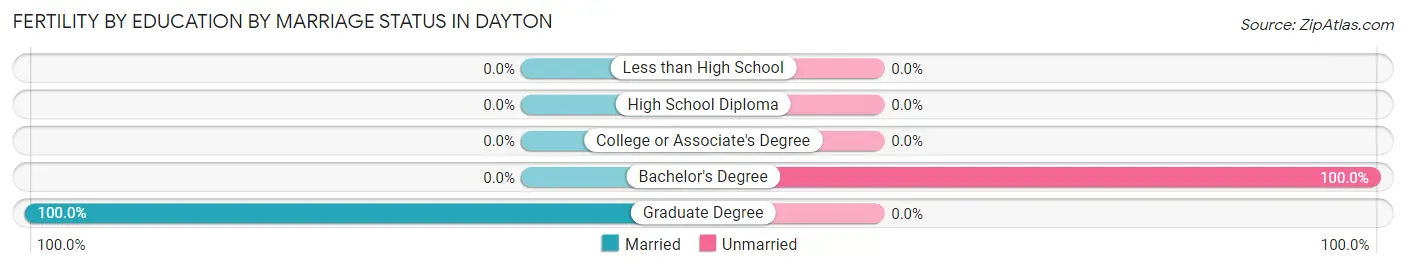
| Educational Attainment | Married | Unmarried |
| Less than High School | 0 (0.0%) | 0 (0.0%) |
| High School Diploma | 0 (0.0%) | 0 (0.0%) |
| College or Associate's Degree | 0 (0.0%) | 0 (0.0%) |
| Bachelor's Degree | 0 (0.0%) | 2 (100.0%) |
| Graduate Degree | 1 (100.0%) | 0 (0.0%) |
| Total | 1 (33.3%) | 2 (66.7%) |
Employment Characteristics in Dayton
Employment by Class of Employer in Dayton
Among the 436 employed individuals in Dayton, private company employees (310 | 71.1%), local government employees (42 | 9.6%), and not-for-profit organizations (24 | 5.5%) make up the most common classes of employment.
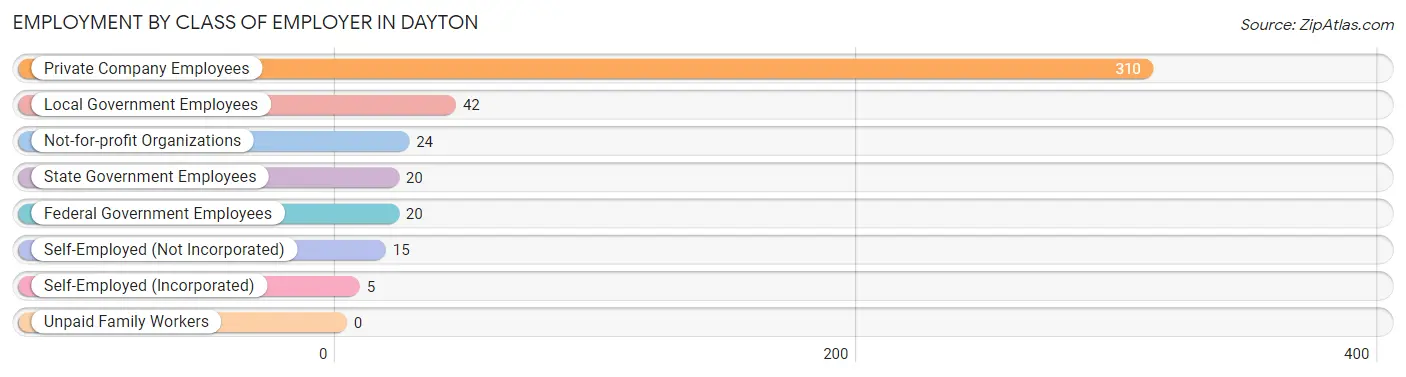
| Employer Class | # Employees | % Employees |
| Private Company Employees | 310 | 71.1% |
| Self-Employed (Incorporated) | 5 | 1.1% |
| Self-Employed (Not Incorporated) | 15 | 3.4% |
| Not-for-profit Organizations | 24 | 5.5% |
| Local Government Employees | 42 | 9.6% |
| State Government Employees | 20 | 4.6% |
| Federal Government Employees | 20 | 4.6% |
| Unpaid Family Workers | 0 | 0.0% |
| Total | 436 | 100.0% |
Employment Status by Age in Dayton
According to the labor force statistics for Dayton, out of the total population over 16 years of age (664), 66.7% or 443 individuals are in the labor force, with 0.7% or 3 of them unemployed. The age group with the highest labor force participation rate is 20 to 24 years, with 100.0% or 19 individuals in the labor force. Within the labor force, the 60 to 64 years age range has the highest percentage of unemployed individuals, with 8.1% or 3 of them being unemployed.
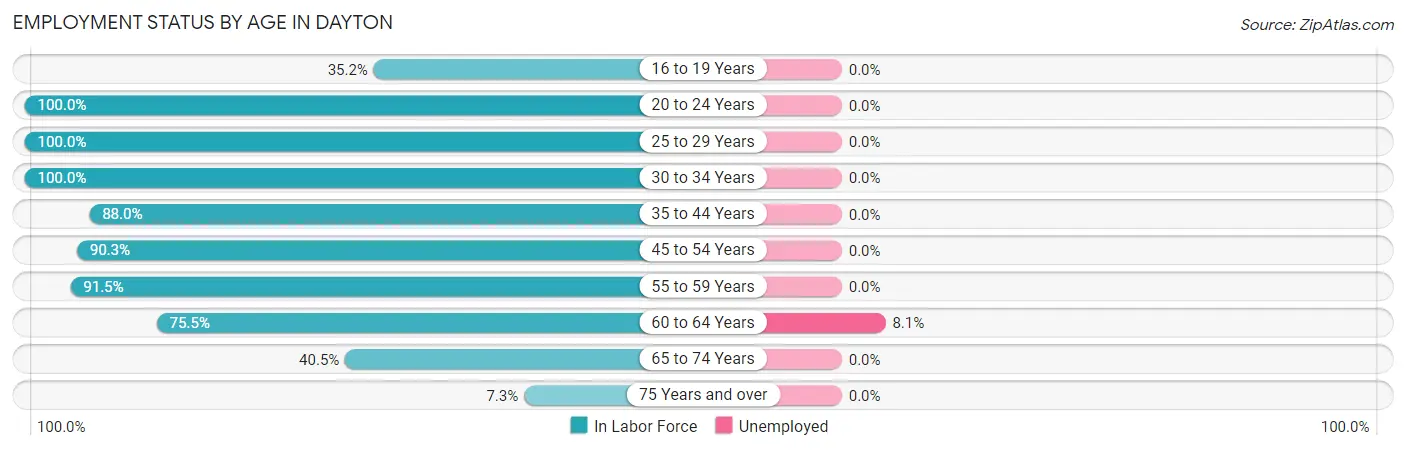
| Age Bracket | In Labor Force | Unemployed |
| 16 to 19 Years | 25 (35.2%) | 0 (0.0%) |
| 20 to 24 Years | 19 (100.0%) | 0 (0.0%) |
| 25 to 29 Years | 86 (100.0%) | 0 (0.0%) |
| 30 to 34 Years | 4 (100.0%) | 0 (0.0%) |
| 35 to 44 Years | 81 (88.0%) | 0 (0.0%) |
| 45 to 54 Years | 84 (90.3%) | 0 (0.0%) |
| 55 to 59 Years | 43 (91.5%) | 0 (0.0%) |
| 60 to 64 Years | 37 (75.5%) | 3 (8.1%) |
| 65 to 74 Years | 60 (40.5%) | 0 (0.0%) |
| 75 Years and over | 4 (7.3%) | 0 (0.0%) |
| Total | 443 (66.7%) | 3 (0.7%) |
Employment Status by Educational Attainment in Dayton
According to labor force statistics for Dayton, 90.3% of individuals (335) out of the total population between 25 and 64 years of age (371) are in the labor force, with 0.9% or 3 of them being unemployed. The group with the highest labor force participation rate are those with the educational attainment of bachelor's degree or higher, with 96.1% or 98 individuals in the labor force. Within the labor force, individuals with college / associate degree education have the highest percentage of unemployment, with 2.7% or 3 of them being unemployed.
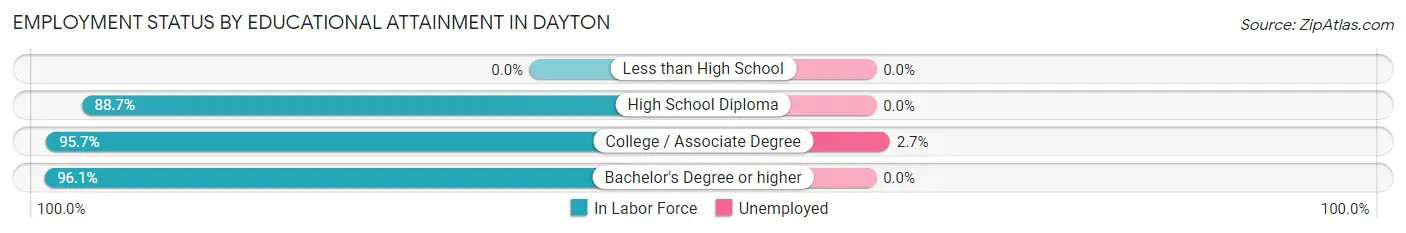
| Educational Attainment | In Labor Force | Unemployed |
| Less than High School | 0 (0.0%) | 0 (0.0%) |
| High School Diploma | 125 (88.7%) | 0 (0.0%) |
| College / Associate Degree | 112 (95.7%) | 3 (2.7%) |
| Bachelor's Degree or higher | 98 (96.1%) | 0 (0.0%) |
| Total | 335 (90.3%) | 3 (0.9%) |
Employment Occupations by Sex in Dayton
Management, Business, Science and Arts Occupations
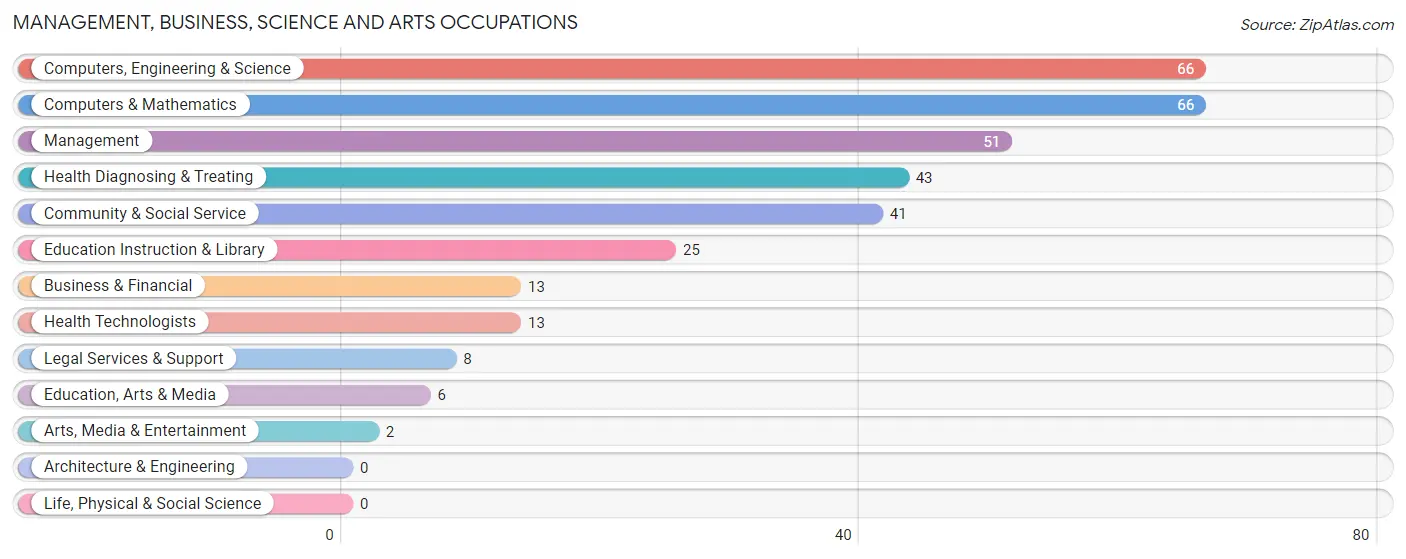
The most common Management, Business, Science and Arts occupations in Dayton are Computers, Engineering & Science (66 | 15.0%), Computers & Mathematics (66 | 15.0%), Management (51 | 11.6%), Health Diagnosing & Treating (43 | 9.8%), and Community & Social Service (41 | 9.3%).
Management, Business, Science and Arts Occupations by Sex
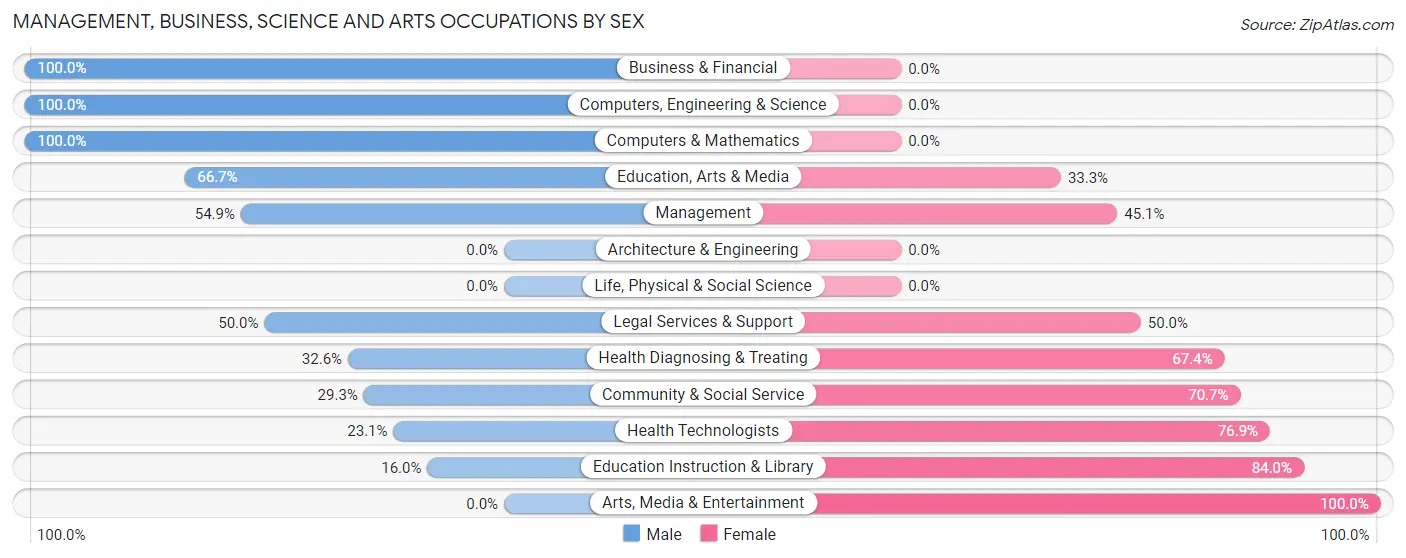
Within the Management, Business, Science and Arts occupations in Dayton, the most male-oriented occupations are Business & Financial (100.0%), Computers, Engineering & Science (100.0%), and Computers & Mathematics (100.0%), while the most female-oriented occupations are Arts, Media & Entertainment (100.0%), Education Instruction & Library (84.0%), and Health Technologists (76.9%).
| Occupation | Male | Female |
| Management | 28 (54.9%) | 23 (45.1%) |
| Business & Financial | 13 (100.0%) | 0 (0.0%) |
| Computers, Engineering & Science | 66 (100.0%) | 0 (0.0%) |
| Computers & Mathematics | 66 (100.0%) | 0 (0.0%) |
| Architecture & Engineering | 0 (0.0%) | 0 (0.0%) |
| Life, Physical & Social Science | 0 (0.0%) | 0 (0.0%) |
| Community & Social Service | 12 (29.3%) | 29 (70.7%) |
| Education, Arts & Media | 4 (66.7%) | 2 (33.3%) |
| Legal Services & Support | 4 (50.0%) | 4 (50.0%) |
| Education Instruction & Library | 4 (16.0%) | 21 (84.0%) |
| Arts, Media & Entertainment | 0 (0.0%) | 2 (100.0%) |
| Health Diagnosing & Treating | 14 (32.6%) | 29 (67.4%) |
| Health Technologists | 3 (23.1%) | 10 (76.9%) |
| Total (Category) | 133 (62.2%) | 81 (37.9%) |
| Total (Overall) | 281 (63.9%) | 159 (36.1%) |
Services Occupations
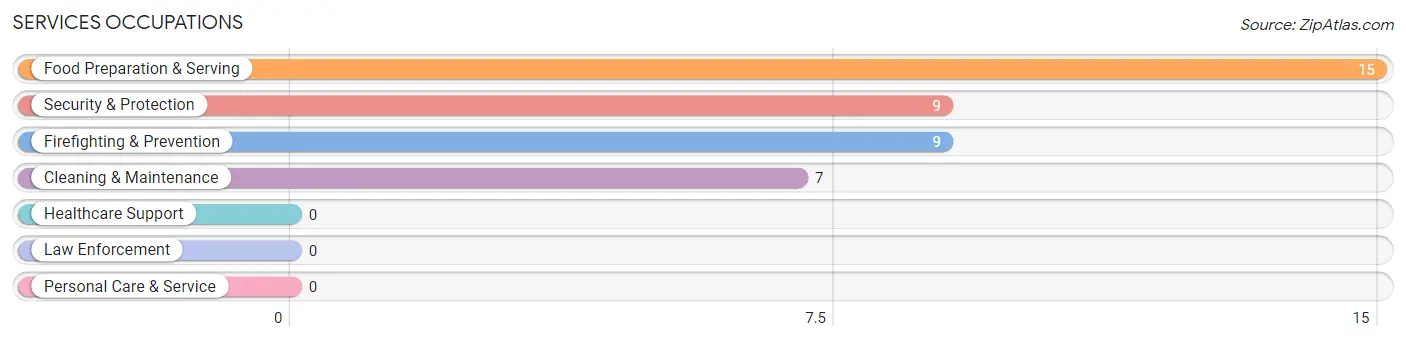
The most common Services occupations in Dayton are Food Preparation & Serving (15 | 3.4%), Security & Protection (9 | 2.1%), Firefighting & Prevention (9 | 2.1%), and Cleaning & Maintenance (7 | 1.6%).
Services Occupations by Sex
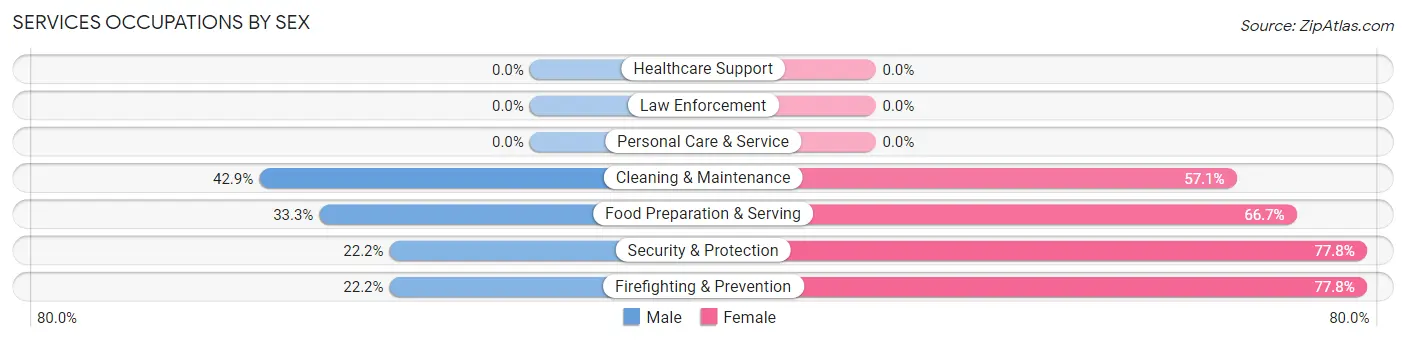
Within the Services occupations in Dayton, the most male-oriented occupations are Cleaning & Maintenance (42.9%), Food Preparation & Serving (33.3%), and Security & Protection (22.2%), while the most female-oriented occupations are Security & Protection (77.8%), Firefighting & Prevention (77.8%), and Food Preparation & Serving (66.7%).
| Occupation | Male | Female |
| Healthcare Support | 0 (0.0%) | 0 (0.0%) |
| Security & Protection | 2 (22.2%) | 7 (77.8%) |
| Firefighting & Prevention | 2 (22.2%) | 7 (77.8%) |
| Law Enforcement | 0 (0.0%) | 0 (0.0%) |
| Food Preparation & Serving | 5 (33.3%) | 10 (66.7%) |
| Cleaning & Maintenance | 3 (42.9%) | 4 (57.1%) |
| Personal Care & Service | 0 (0.0%) | 0 (0.0%) |
| Total (Category) | 10 (32.3%) | 21 (67.7%) |
| Total (Overall) | 281 (63.9%) | 159 (36.1%) |
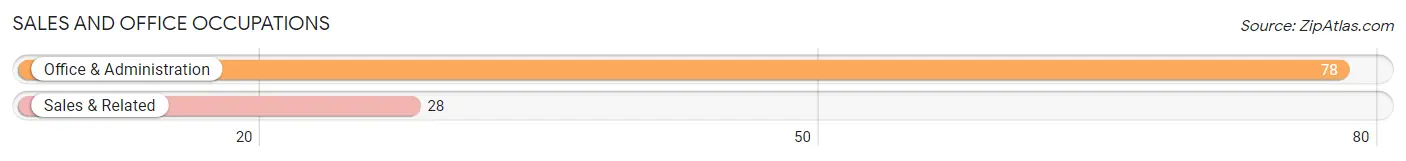
Sales and Office Occupations
The most common Sales and Office occupations in Dayton are Office & Administration (78 | 17.7%), and Sales & Related (28 | 6.4%).
Sales and Office Occupations by Sex
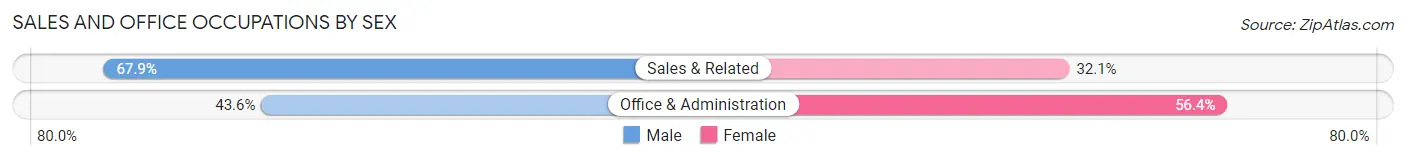
| Occupation | Male | Female |
| Sales & Related | 19 (67.9%) | 9 (32.1%) |
| Office & Administration | 34 (43.6%) | 44 (56.4%) |
| Total (Category) | 53 (50.0%) | 53 (50.0%) |
| Total (Overall) | 281 (63.9%) | 159 (36.1%) |
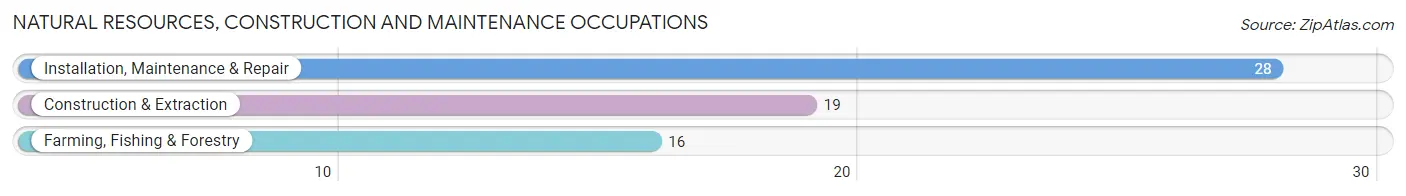
Natural Resources, Construction and Maintenance Occupations
The most common Natural Resources, Construction and Maintenance occupations in Dayton are Installation, Maintenance & Repair (28 | 6.4%), Construction & Extraction (19 | 4.3%), and Farming, Fishing & Forestry (16 | 3.6%).
Natural Resources, Construction and Maintenance Occupations by Sex
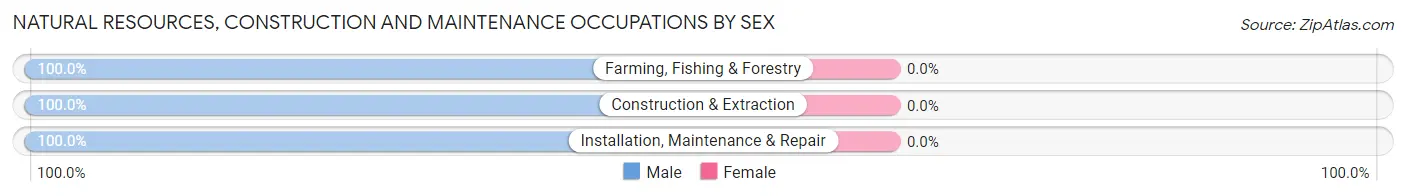
| Occupation | Male | Female |
| Farming, Fishing & Forestry | 16 (100.0%) | 0 (0.0%) |
| Construction & Extraction | 19 (100.0%) | 0 (0.0%) |
| Installation, Maintenance & Repair | 28 (100.0%) | 0 (0.0%) |
| Total (Category) | 63 (100.0%) | 0 (0.0%) |
| Total (Overall) | 281 (63.9%) | 159 (36.1%) |
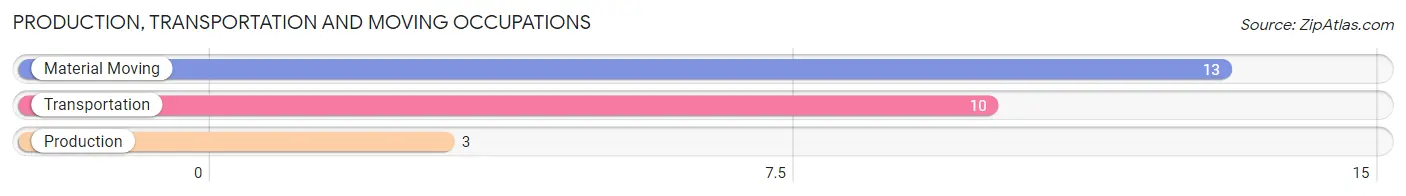
Production, Transportation and Moving Occupations
The most common Production, Transportation and Moving occupations in Dayton are Material Moving (13 | 2.9%), Transportation (10 | 2.3%), and Production (3 | 0.7%).
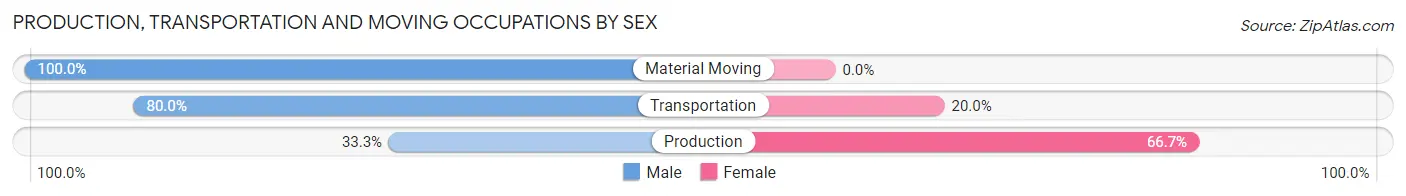
Production, Transportation and Moving Occupations by Sex
| Occupation | Male | Female |
| Production | 1 (33.3%) | 2 (66.7%) |
| Transportation | 8 (80.0%) | 2 (20.0%) |
| Material Moving | 13 (100.0%) | 0 (0.0%) |
| Total (Category) | 22 (84.6%) | 4 (15.4%) |
| Total (Overall) | 281 (63.9%) | 159 (36.1%) |
Employment Industries by Sex in Dayton
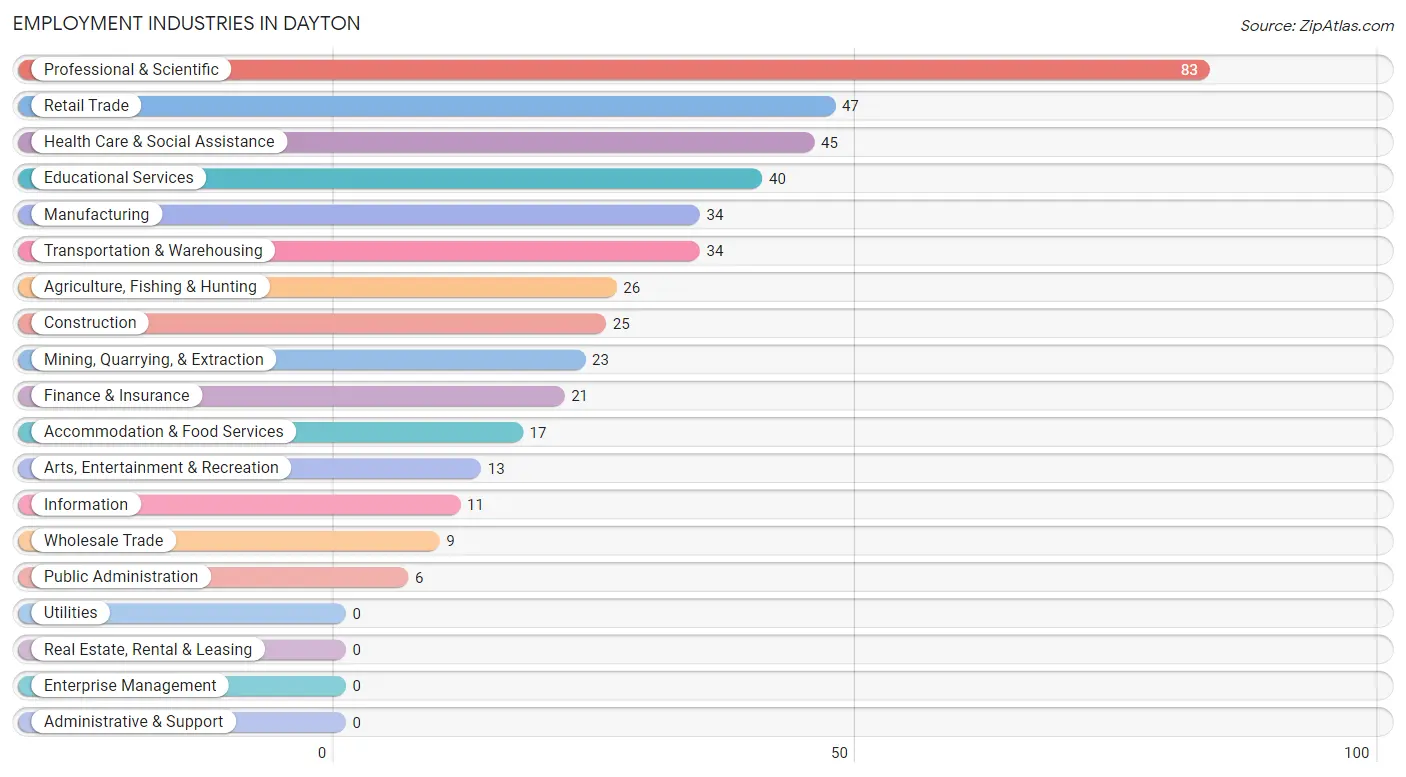
Employment Industries in Dayton
The major employment industries in Dayton include Professional & Scientific (83 | 18.9%), Retail Trade (47 | 10.7%), Health Care & Social Assistance (45 | 10.2%), Educational Services (40 | 9.1%), and Manufacturing (34 | 7.7%).
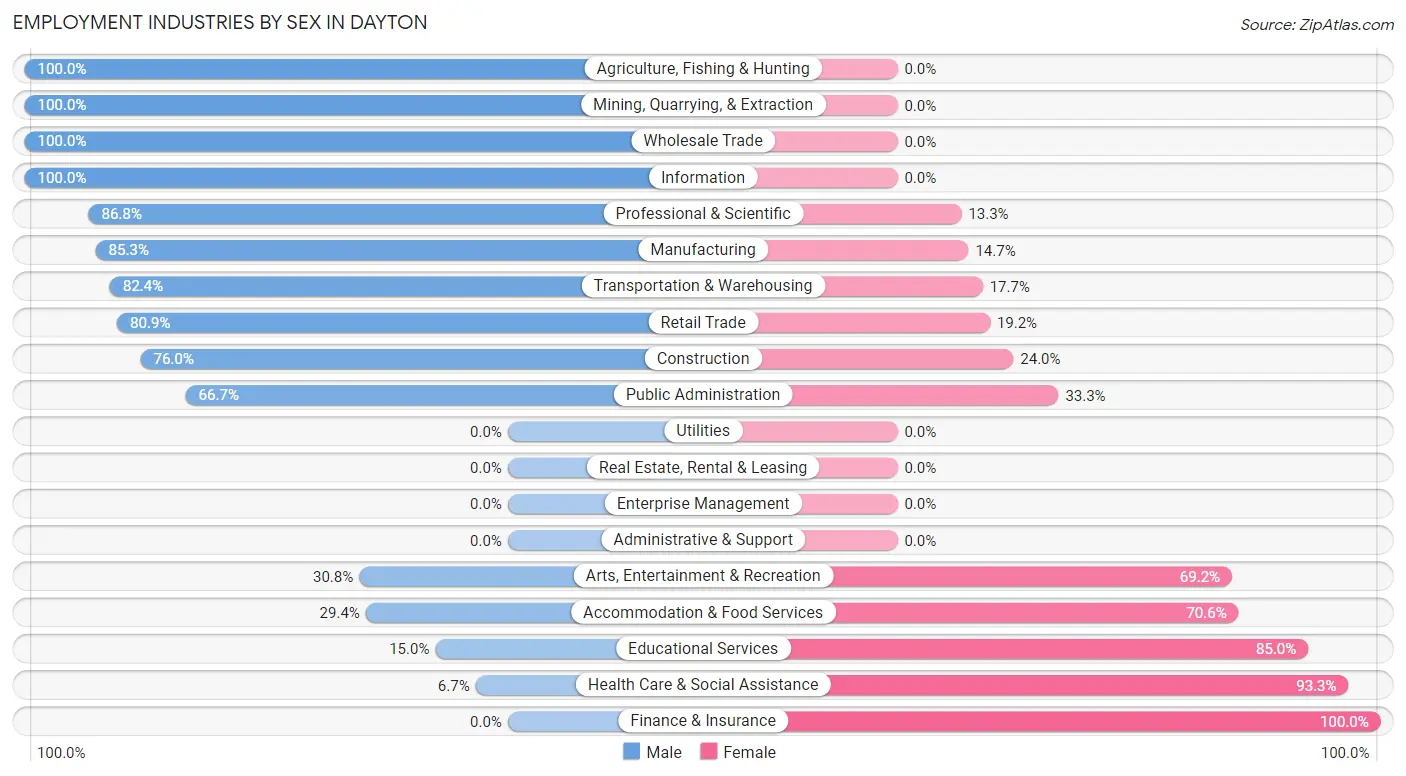
Employment Industries by Sex in Dayton
The Dayton industries that see more men than women are Agriculture, Fishing & Hunting (100.0%), Mining, Quarrying, & Extraction (100.0%), and Wholesale Trade (100.0%), whereas the industries that tend to have a higher number of women are Finance & Insurance (100.0%), Health Care & Social Assistance (93.3%), and Educational Services (85.0%).
| Industry | Male | Female |
| Agriculture, Fishing & Hunting | 26 (100.0%) | 0 (0.0%) |
| Mining, Quarrying, & Extraction | 23 (100.0%) | 0 (0.0%) |
| Construction | 19 (76.0%) | 6 (24.0%) |
| Manufacturing | 29 (85.3%) | 5 (14.7%) |
| Wholesale Trade | 9 (100.0%) | 0 (0.0%) |
| Retail Trade | 38 (80.8%) | 9 (19.2%) |
| Transportation & Warehousing | 28 (82.4%) | 6 (17.6%) |
| Utilities | 0 (0.0%) | 0 (0.0%) |
| Information | 11 (100.0%) | 0 (0.0%) |
| Finance & Insurance | 0 (0.0%) | 21 (100.0%) |
| Real Estate, Rental & Leasing | 0 (0.0%) | 0 (0.0%) |
| Professional & Scientific | 72 (86.8%) | 11 (13.3%) |
| Enterprise Management | 0 (0.0%) | 0 (0.0%) |
| Administrative & Support | 0 (0.0%) | 0 (0.0%) |
| Educational Services | 6 (15.0%) | 34 (85.0%) |
| Health Care & Social Assistance | 3 (6.7%) | 42 (93.3%) |
| Arts, Entertainment & Recreation | 4 (30.8%) | 9 (69.2%) |
| Accommodation & Food Services | 5 (29.4%) | 12 (70.6%) |
| Public Administration | 4 (66.7%) | 2 (33.3%) |
| Total | 281 (63.9%) | 159 (36.1%) |
Education in Dayton
School Enrollment in Dayton
The most common levels of schooling among the 282 students in Dayton are middle school (108 | 38.3%), high school (85 | 30.1%), and elementary school (58 | 20.6%).
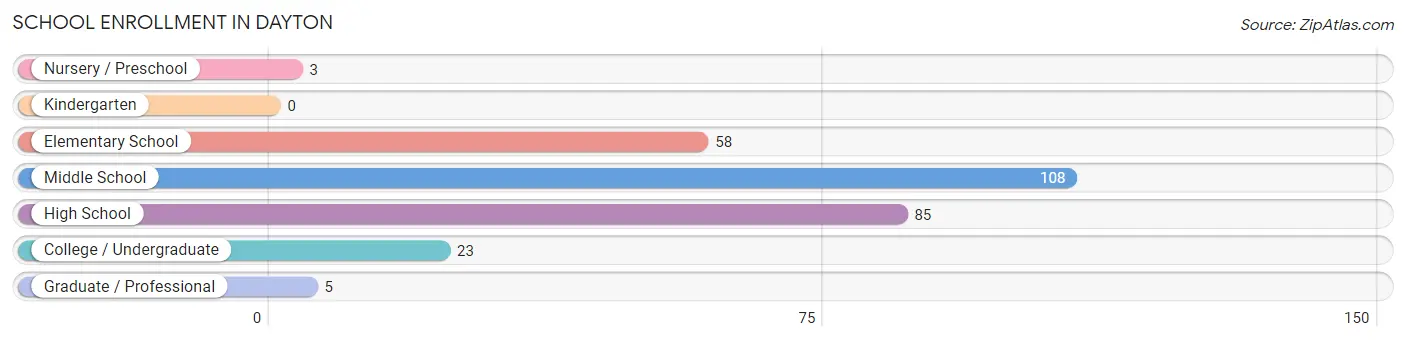
| School Level | # Students | % Students |
| Nursery / Preschool | 3 | 1.1% |
| Kindergarten | 0 | 0.0% |
| Elementary School | 58 | 20.6% |
| Middle School | 108 | 38.3% |
| High School | 85 | 30.1% |
| College / Undergraduate | 23 | 8.2% |
| Graduate / Professional | 5 | 1.8% |
| Total | 282 | 100.0% |
School Enrollment by Age by Funding Source in Dayton
Out of a total of 282 students who are enrolled in schools in Dayton, 6 (2.1%) attend a private institution, while the remaining 276 (97.9%) are enrolled in public schools. The age group of 3 to 4 year olds has the highest likelihood of being enrolled in private schools, with 3 (100.0% in the age bracket) enrolled. Conversely, the age group of 5 to 9 year old has the lowest likelihood of being enrolled in a private school, with 18 (100.0% in the age bracket) attending a public institution.
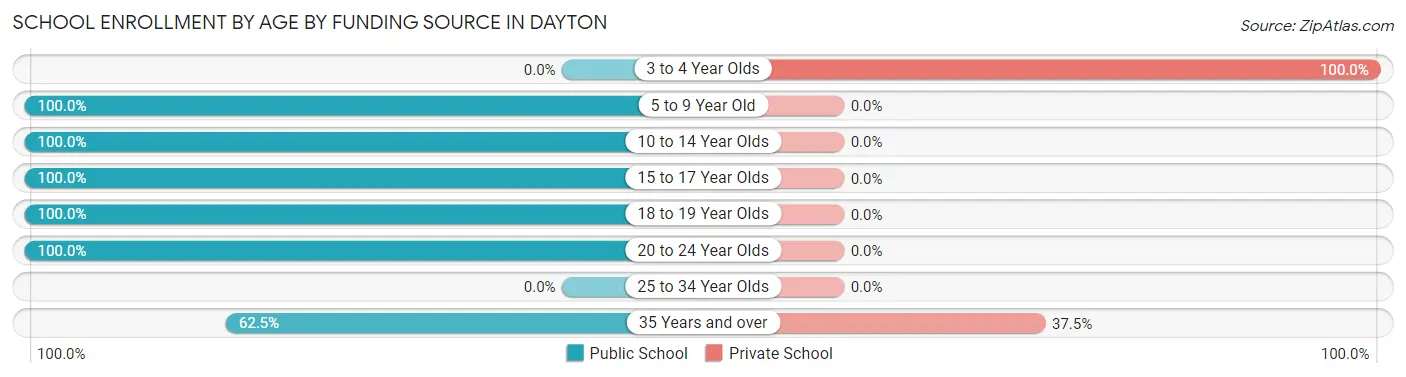
| Age Bracket | Public School | Private School |
| 3 to 4 Year Olds | 0 (0.0%) | 3 (100.0%) |
| 5 to 9 Year Old | 18 (100.0%) | 0 (0.0%) |
| 10 to 14 Year Olds | 148 (100.0%) | 0 (0.0%) |
| 15 to 17 Year Olds | 65 (100.0%) | 0 (0.0%) |
| 18 to 19 Year Olds | 21 (100.0%) | 0 (0.0%) |
| 20 to 24 Year Olds | 19 (100.0%) | 0 (0.0%) |
| 25 to 34 Year Olds | 0 (0.0%) | 0 (0.0%) |
| 35 Years and over | 5 (62.5%) | 3 (37.5%) |
| Total | 276 (97.9%) | 6 (2.1%) |
Educational Attainment by Field of Study in Dayton
Education (47 | 26.4%), business (38 | 21.3%), science & technology (26 | 14.6%), computers & mathematics (19 | 10.7%), and communications (11 | 6.2%) are the most common fields of study among 178 individuals in Dayton who have obtained a bachelor's degree or higher.
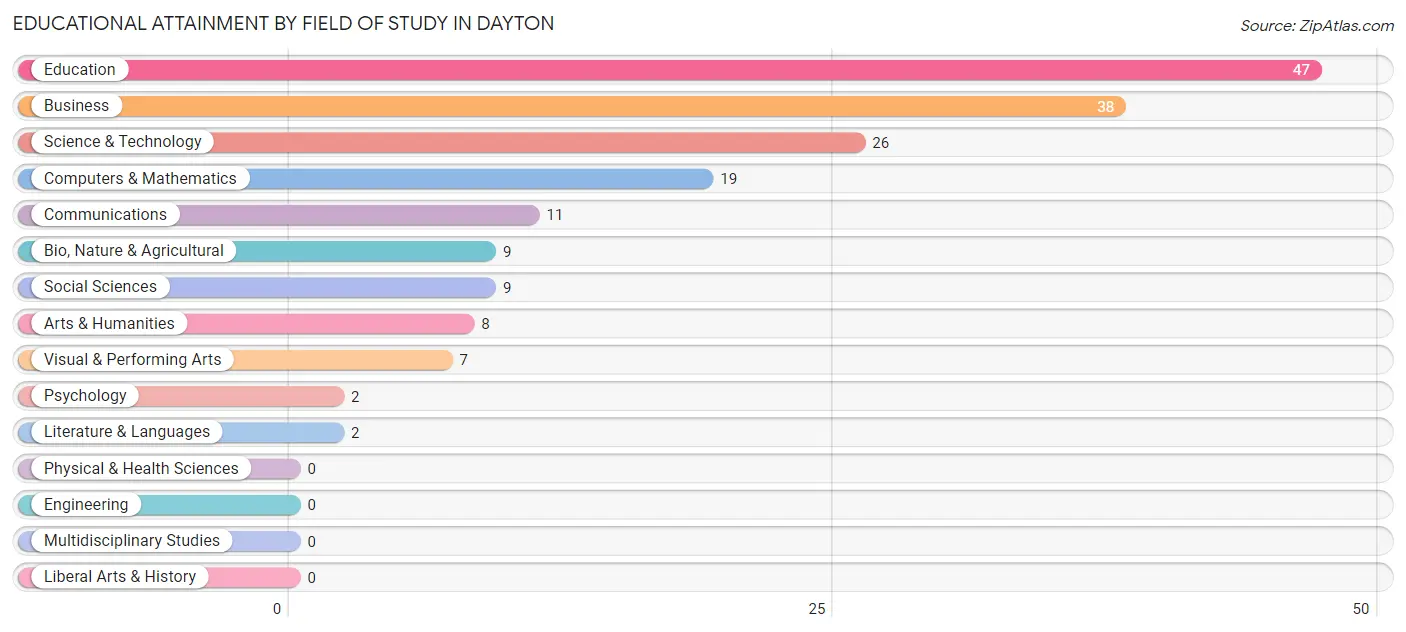
| Field of Study | # Graduates | % Graduates |
| Computers & Mathematics | 19 | 10.7% |
| Bio, Nature & Agricultural | 9 | 5.1% |
| Physical & Health Sciences | 0 | 0.0% |
| Psychology | 2 | 1.1% |
| Social Sciences | 9 | 5.1% |
| Engineering | 0 | 0.0% |
| Multidisciplinary Studies | 0 | 0.0% |
| Science & Technology | 26 | 14.6% |
| Business | 38 | 21.3% |
| Education | 47 | 26.4% |
| Literature & Languages | 2 | 1.1% |
| Liberal Arts & History | 0 | 0.0% |
| Visual & Performing Arts | 7 | 3.9% |
| Communications | 11 | 6.2% |
| Arts & Humanities | 8 | 4.5% |
| Total | 178 | 100.0% |
Transportation & Commute in Dayton
Vehicle Availability by Sex in Dayton
The most prevalent vehicle ownership categories in Dayton are males with 5 or more vehicles (101, accounting for 36.3%) and females with 5 or more vehicles (10, making up 63.9%).
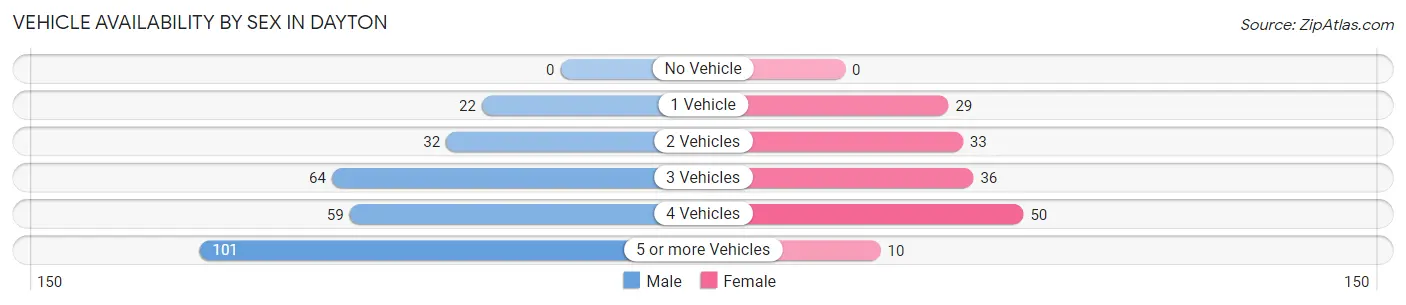
| Vehicles Available | Male | Female |
| No Vehicle | 0 (0.0%) | 0 (0.0%) |
| 1 Vehicle | 22 (7.9%) | 29 (18.3%) |
| 2 Vehicles | 32 (11.5%) | 33 (20.9%) |
| 3 Vehicles | 64 (23.0%) | 36 (22.8%) |
| 4 Vehicles | 59 (21.2%) | 50 (31.7%) |
| 5 or more Vehicles | 101 (36.3%) | 10 (6.3%) |
| Total | 278 (100.0%) | 158 (100.0%) |
Commute Time in Dayton
The most frequently occuring commute durations in Dayton are 30 to 34 minutes (224 commuters, 53.6%), 15 to 19 minutes (43 commuters, 10.3%), and 10 to 14 minutes (33 commuters, 7.9%).
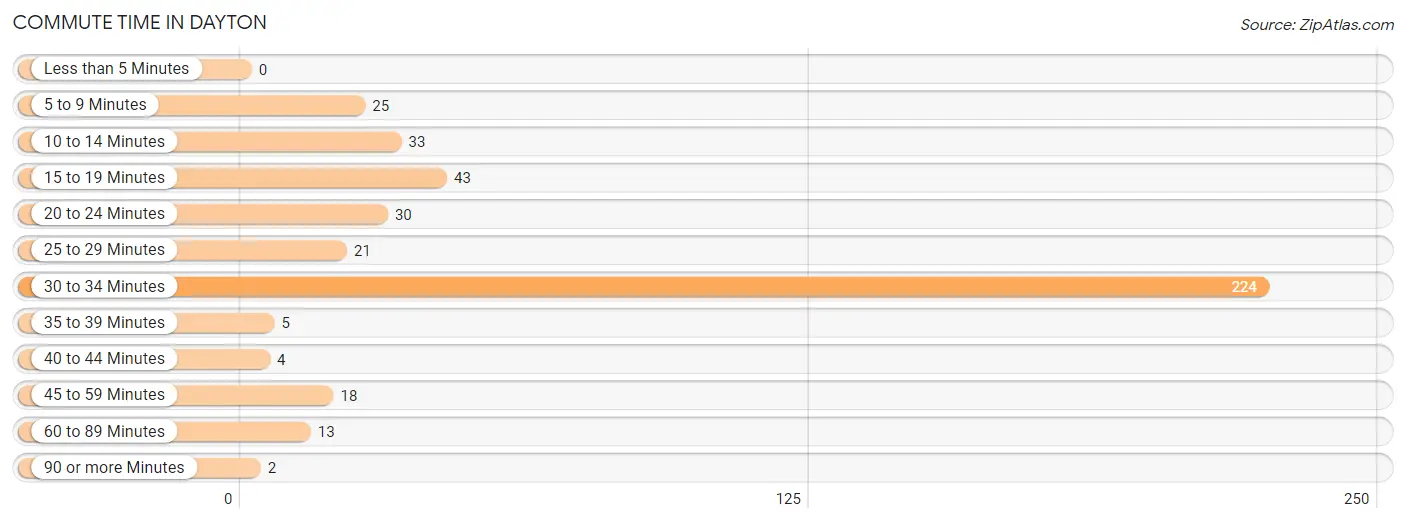
| Commute Time | # Commuters | % Commuters |
| Less than 5 Minutes | 0 | 0.0% |
| 5 to 9 Minutes | 25 | 6.0% |
| 10 to 14 Minutes | 33 | 7.9% |
| 15 to 19 Minutes | 43 | 10.3% |
| 20 to 24 Minutes | 30 | 7.2% |
| 25 to 29 Minutes | 21 | 5.0% |
| 30 to 34 Minutes | 224 | 53.6% |
| 35 to 39 Minutes | 5 | 1.2% |
| 40 to 44 Minutes | 4 | 1.0% |
| 45 to 59 Minutes | 18 | 4.3% |
| 60 to 89 Minutes | 13 | 3.1% |
| 90 or more Minutes | 2 | 0.5% |
Commute Time by Sex in Dayton
The most common commute times in Dayton are 30 to 34 minutes (154 commuters, 58.1%) for males and 30 to 34 minutes (70 commuters, 45.8%) for females.
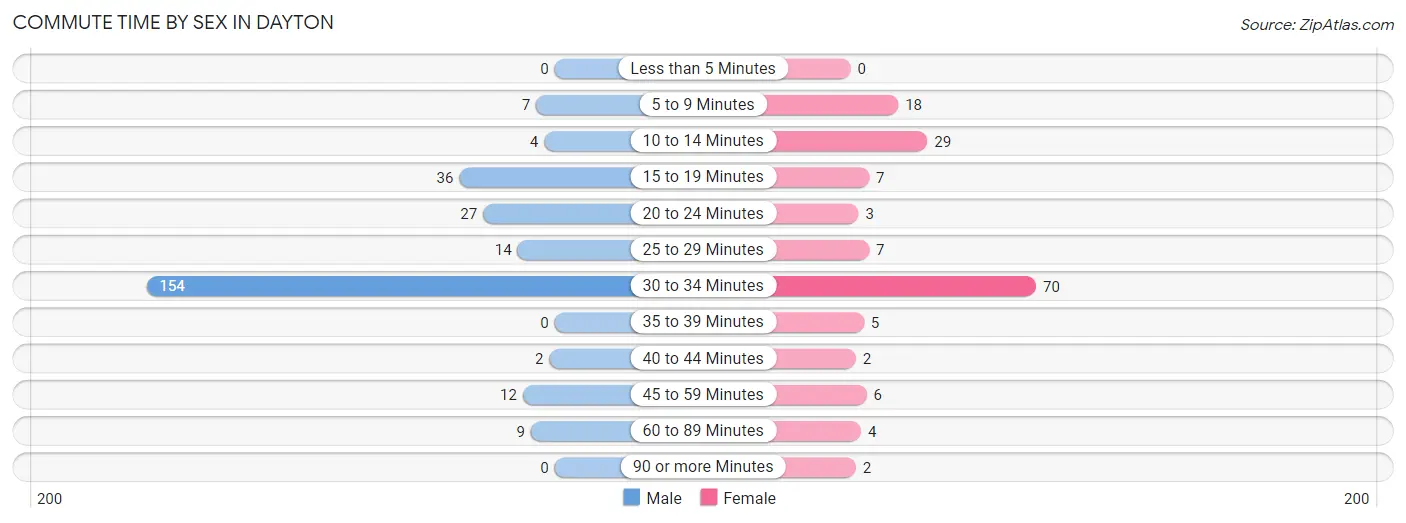
| Commute Time | Male | Female |
| Less than 5 Minutes | 0 (0.0%) | 0 (0.0%) |
| 5 to 9 Minutes | 7 (2.6%) | 18 (11.8%) |
| 10 to 14 Minutes | 4 (1.5%) | 29 (19.0%) |
| 15 to 19 Minutes | 36 (13.6%) | 7 (4.6%) |
| 20 to 24 Minutes | 27 (10.2%) | 3 (2.0%) |
| 25 to 29 Minutes | 14 (5.3%) | 7 (4.6%) |
| 30 to 34 Minutes | 154 (58.1%) | 70 (45.8%) |
| 35 to 39 Minutes | 0 (0.0%) | 5 (3.3%) |
| 40 to 44 Minutes | 2 (0.7%) | 2 (1.3%) |
| 45 to 59 Minutes | 12 (4.5%) | 6 (3.9%) |
| 60 to 89 Minutes | 9 (3.4%) | 4 (2.6%) |
| 90 or more Minutes | 0 (0.0%) | 2 (1.3%) |
Time of Departure to Work by Sex in Dayton
The most frequent times of departure to work in Dayton are 4:00 PM to 11:59 PM (66, 24.9%) for males and 7:00 AM to 7:29 AM (44, 28.8%) for females.
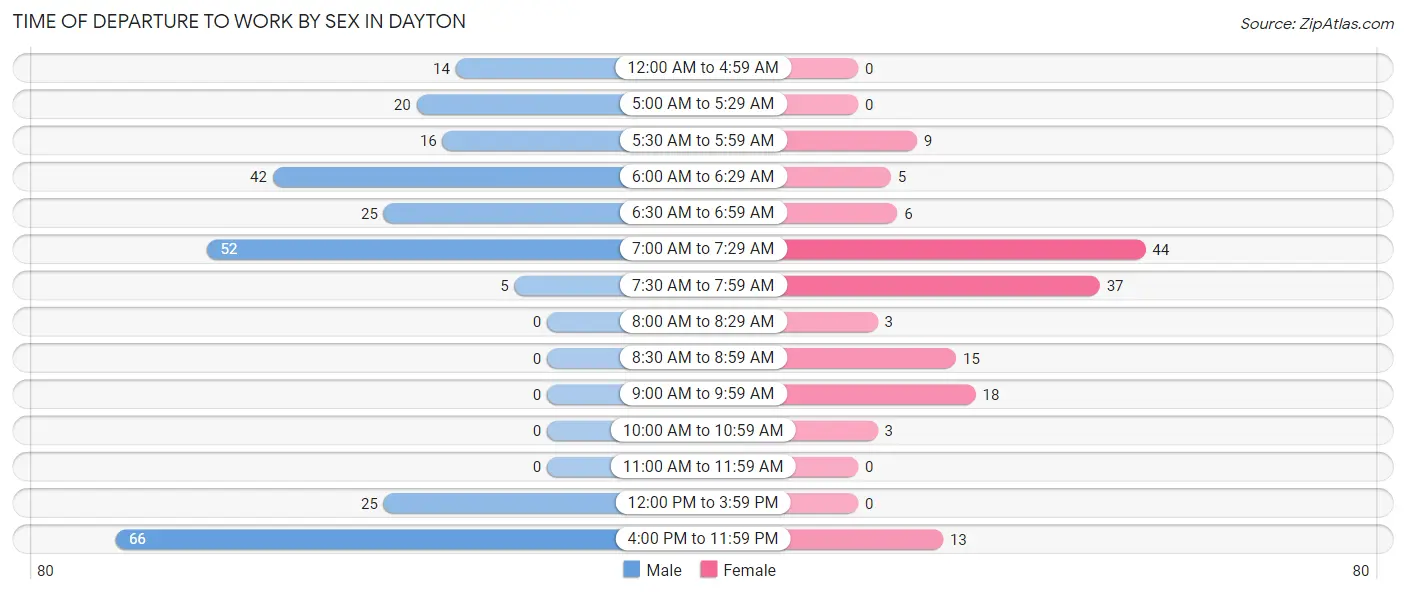
| Time of Departure | Male | Female |
| 12:00 AM to 4:59 AM | 14 (5.3%) | 0 (0.0%) |
| 5:00 AM to 5:29 AM | 20 (7.5%) | 0 (0.0%) |
| 5:30 AM to 5:59 AM | 16 (6.0%) | 9 (5.9%) |
| 6:00 AM to 6:29 AM | 42 (15.9%) | 5 (3.3%) |
| 6:30 AM to 6:59 AM | 25 (9.4%) | 6 (3.9%) |
| 7:00 AM to 7:29 AM | 52 (19.6%) | 44 (28.8%) |
| 7:30 AM to 7:59 AM | 5 (1.9%) | 37 (24.2%) |
| 8:00 AM to 8:29 AM | 0 (0.0%) | 3 (2.0%) |
| 8:30 AM to 8:59 AM | 0 (0.0%) | 15 (9.8%) |
| 9:00 AM to 9:59 AM | 0 (0.0%) | 18 (11.8%) |
| 10:00 AM to 10:59 AM | 0 (0.0%) | 3 (2.0%) |
| 11:00 AM to 11:59 AM | 0 (0.0%) | 0 (0.0%) |
| 12:00 PM to 3:59 PM | 25 (9.4%) | 0 (0.0%) |
| 4:00 PM to 11:59 PM | 66 (24.9%) | 13 (8.5%) |
| Total | 265 (100.0%) | 153 (100.0%) |
Housing Occupancy in Dayton
Occupancy by Ownership in Dayton
Of the total 282 dwellings in Dayton, owner-occupied units account for 246 (87.2%), while renter-occupied units make up 36 (12.8%).
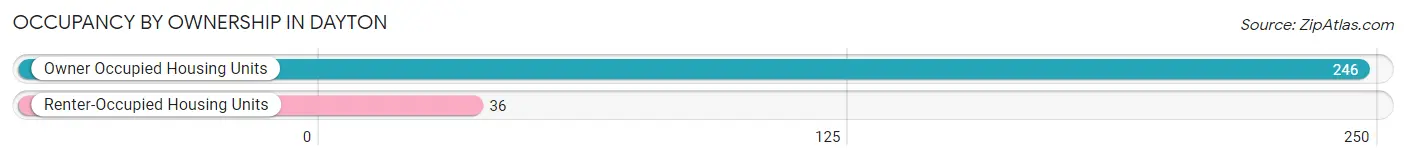
| Occupancy | # Housing Units | % Housing Units |
| Owner Occupied Housing Units | 246 | 87.2% |
| Renter-Occupied Housing Units | 36 | 12.8% |
| Total Occupied Housing Units | 282 | 100.0% |
Occupancy by Household Size in Dayton
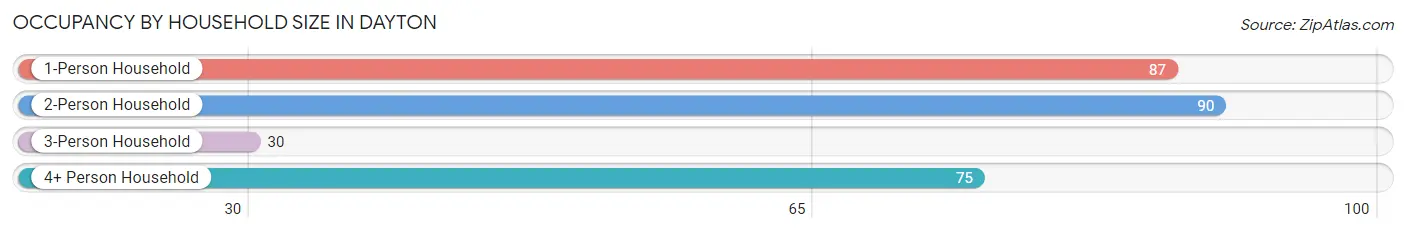
| Household Size | # Housing Units | % Housing Units |
| 1-Person Household | 87 | 30.8% |
| 2-Person Household | 90 | 31.9% |
| 3-Person Household | 30 | 10.6% |
| 4+ Person Household | 75 | 26.6% |
| Total Housing Units | 282 | 100.0% |
Occupancy by Ownership by Household Size in Dayton
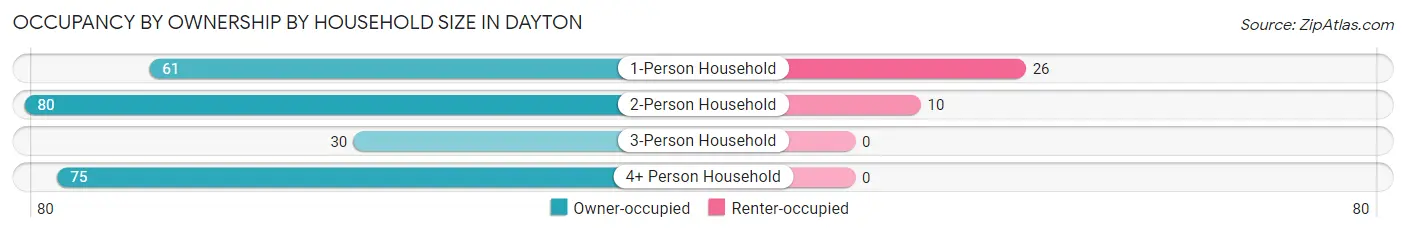
| Household Size | Owner-occupied | Renter-occupied |
| 1-Person Household | 61 (70.1%) | 26 (29.9%) |
| 2-Person Household | 80 (88.9%) | 10 (11.1%) |
| 3-Person Household | 30 (100.0%) | 0 (0.0%) |
| 4+ Person Household | 75 (100.0%) | 0 (0.0%) |
| Total Housing Units | 246 (87.2%) | 36 (12.8%) |
Occupancy by Educational Attainment in Dayton
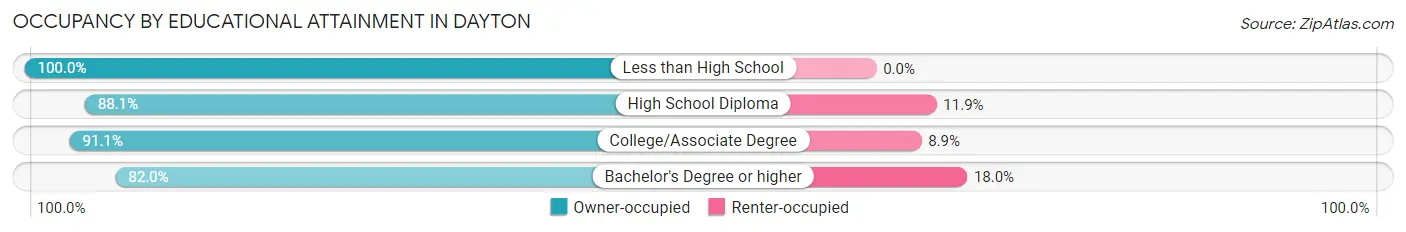
| Household Size | Owner-occupied | Renter-occupied |
| Less than High School | 3 (100.0%) | 0 (0.0%) |
| High School Diploma | 59 (88.1%) | 8 (11.9%) |
| College/Associate Degree | 102 (91.1%) | 10 (8.9%) |
| Bachelor's Degree or higher | 82 (82.0%) | 18 (18.0%) |
Occupancy by Age of Householder in Dayton
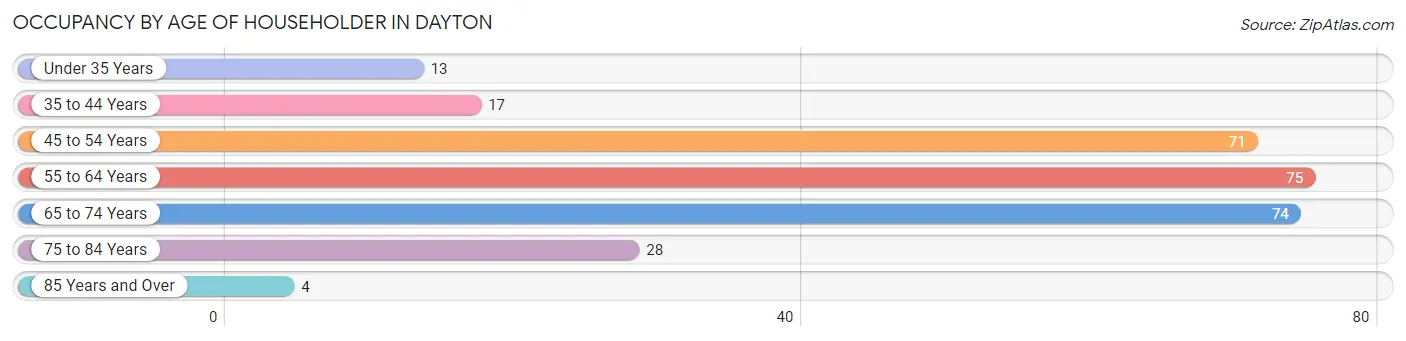
| Age Bracket | # Households | % Households |
| Under 35 Years | 13 | 4.6% |
| 35 to 44 Years | 17 | 6.0% |
| 45 to 54 Years | 71 | 25.2% |
| 55 to 64 Years | 75 | 26.6% |
| 65 to 74 Years | 74 | 26.2% |
| 75 to 84 Years | 28 | 9.9% |
| 85 Years and Over | 4 | 1.4% |
| Total | 282 | 100.0% |
Housing Finances in Dayton
Median Income by Occupancy in Dayton
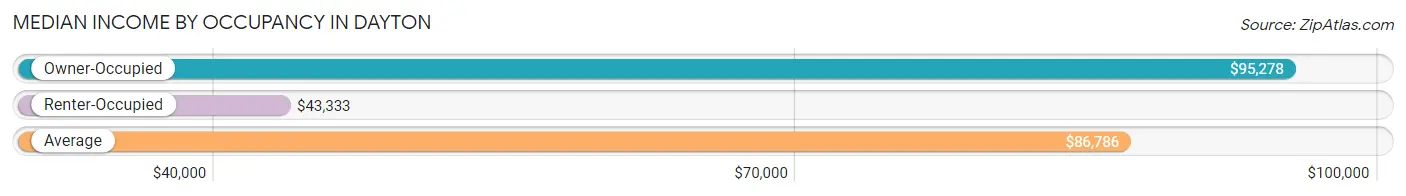
| Occupancy Type | # Households | Median Income |
| Owner-Occupied | 246 (87.2%) | $95,278 |
| Renter-Occupied | 36 (12.8%) | $43,333 |
| Average | 282 (100.0%) | $86,786 |
Occupancy by Householder Income Bracket in Dayton
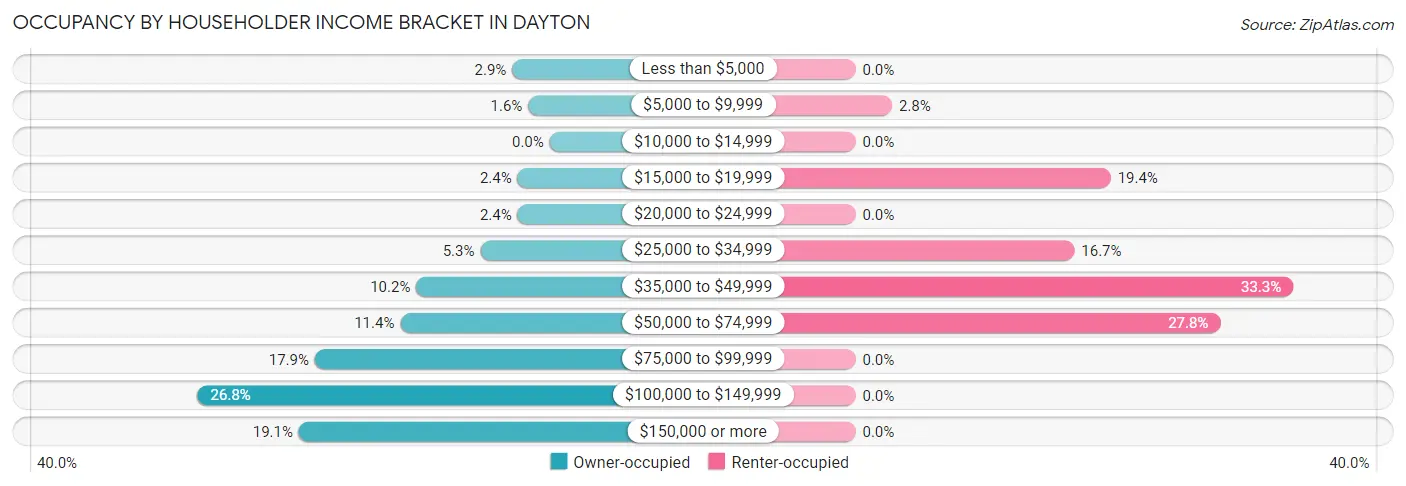
| Income Bracket | Owner-occupied | Renter-occupied |
| Less than $5,000 | 7 (2.9%) | 0 (0.0%) |
| $5,000 to $9,999 | 4 (1.6%) | 1 (2.8%) |
| $10,000 to $14,999 | 0 (0.0%) | 0 (0.0%) |
| $15,000 to $19,999 | 6 (2.4%) | 7 (19.4%) |
| $20,000 to $24,999 | 6 (2.4%) | 0 (0.0%) |
| $25,000 to $34,999 | 13 (5.3%) | 6 (16.7%) |
| $35,000 to $49,999 | 25 (10.2%) | 12 (33.3%) |
| $50,000 to $74,999 | 28 (11.4%) | 10 (27.8%) |
| $75,000 to $99,999 | 44 (17.9%) | 0 (0.0%) |
| $100,000 to $149,999 | 66 (26.8%) | 0 (0.0%) |
| $150,000 or more | 47 (19.1%) | 0 (0.0%) |
| Total | 246 (100.0%) | 36 (100.0%) |
Monthly Housing Cost Tiers in Dayton
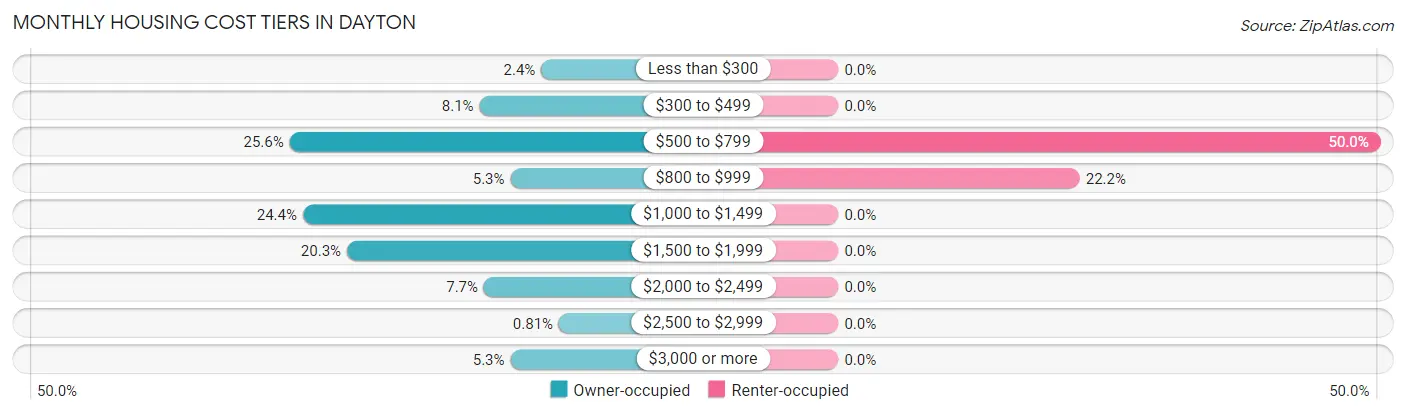
| Monthly Cost | Owner-occupied | Renter-occupied |
| Less than $300 | 6 (2.4%) | 0 (0.0%) |
| $300 to $499 | 20 (8.1%) | 0 (0.0%) |
| $500 to $799 | 63 (25.6%) | 18 (50.0%) |
| $800 to $999 | 13 (5.3%) | 8 (22.2%) |
| $1,000 to $1,499 | 60 (24.4%) | 0 (0.0%) |
| $1,500 to $1,999 | 50 (20.3%) | 0 (0.0%) |
| $2,000 to $2,499 | 19 (7.7%) | 0 (0.0%) |
| $2,500 to $2,999 | 2 (0.8%) | 0 (0.0%) |
| $3,000 or more | 13 (5.3%) | 0 (0.0%) |
| Total | 246 (100.0%) | 36 (100.0%) |
Physical Housing Characteristics in Dayton
Housing Structures in Dayton
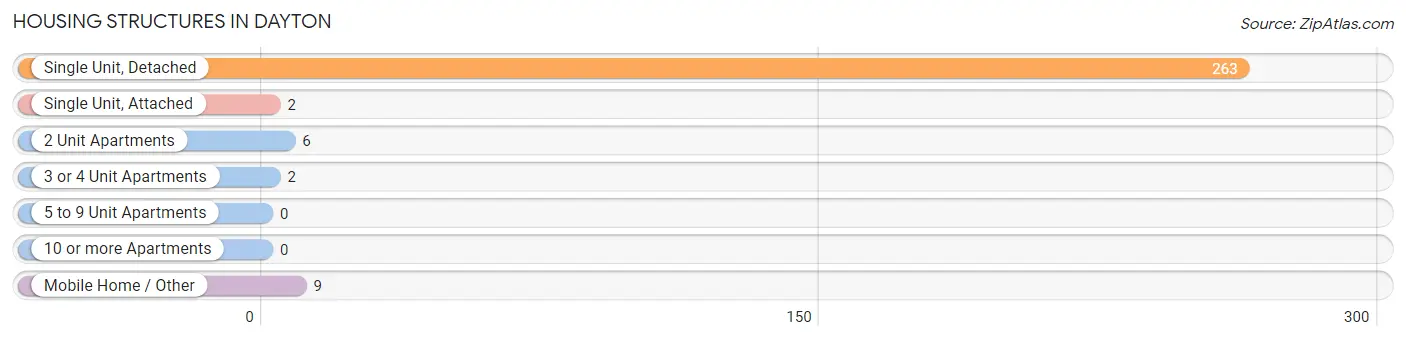
| Structure Type | # Housing Units | % Housing Units |
| Single Unit, Detached | 263 | 93.3% |
| Single Unit, Attached | 2 | 0.7% |
| 2 Unit Apartments | 6 | 2.1% |
| 3 or 4 Unit Apartments | 2 | 0.7% |
| 5 to 9 Unit Apartments | 0 | 0.0% |
| 10 or more Apartments | 0 | 0.0% |
| Mobile Home / Other | 9 | 3.2% |
| Total | 282 | 100.0% |
Housing Structures by Occupancy in Dayton
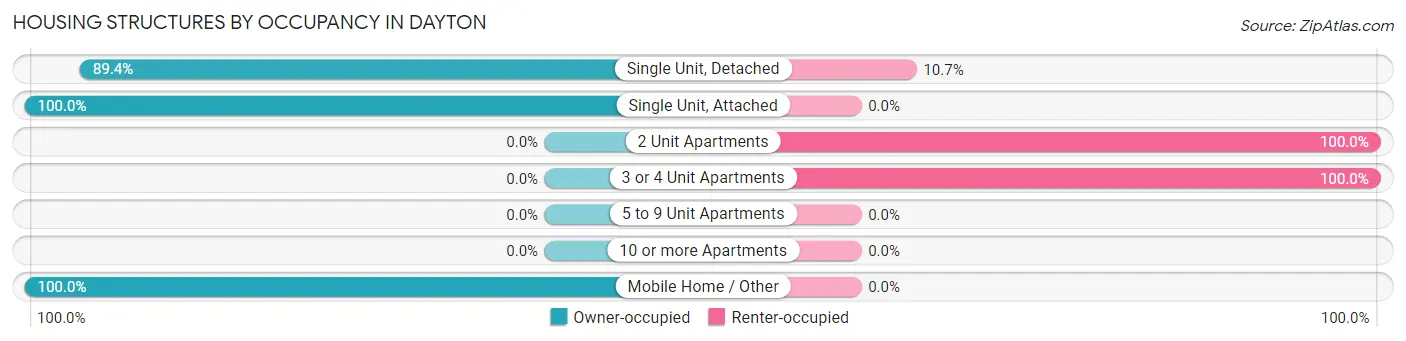
| Structure Type | Owner-occupied | Renter-occupied |
| Single Unit, Detached | 235 (89.3%) | 28 (10.6%) |
| Single Unit, Attached | 2 (100.0%) | 0 (0.0%) |
| 2 Unit Apartments | 0 (0.0%) | 6 (100.0%) |
| 3 or 4 Unit Apartments | 0 (0.0%) | 2 (100.0%) |
| 5 to 9 Unit Apartments | 0 (0.0%) | 0 (0.0%) |
| 10 or more Apartments | 0 (0.0%) | 0 (0.0%) |
| Mobile Home / Other | 9 (100.0%) | 0 (0.0%) |
| Total | 246 (87.2%) | 36 (12.8%) |
Housing Structures by Number of Rooms in Dayton
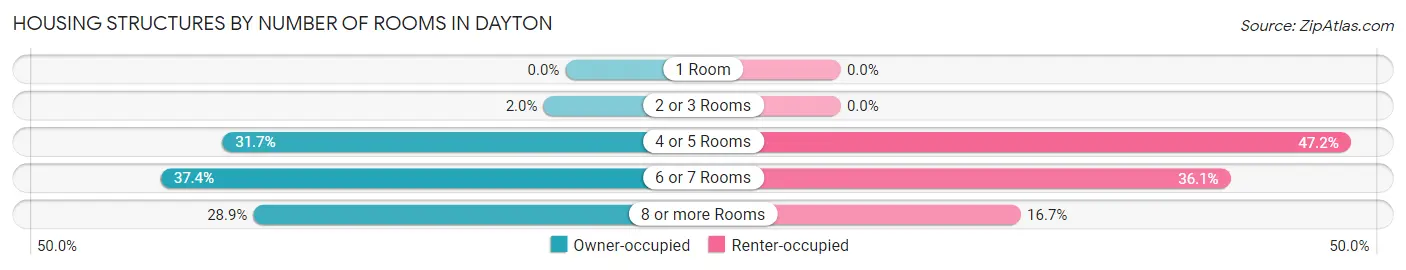
| Number of Rooms | Owner-occupied | Renter-occupied |
| 1 Room | 0 (0.0%) | 0 (0.0%) |
| 2 or 3 Rooms | 5 (2.0%) | 0 (0.0%) |
| 4 or 5 Rooms | 78 (31.7%) | 17 (47.2%) |
| 6 or 7 Rooms | 92 (37.4%) | 13 (36.1%) |
| 8 or more Rooms | 71 (28.9%) | 6 (16.7%) |
| Total | 246 (100.0%) | 36 (100.0%) |
Housing Structure by Heating Type in Dayton
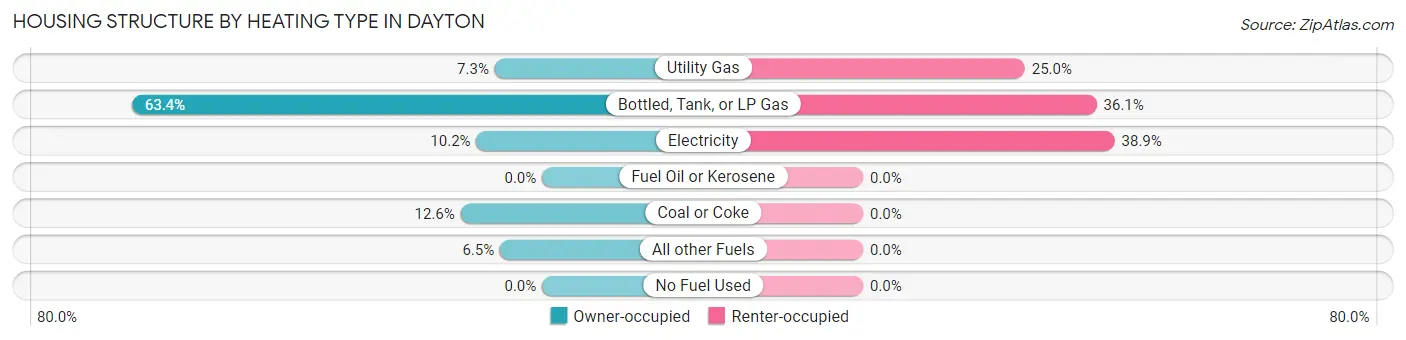
| Heating Type | Owner-occupied | Renter-occupied |
| Utility Gas | 18 (7.3%) | 9 (25.0%) |
| Bottled, Tank, or LP Gas | 156 (63.4%) | 13 (36.1%) |
| Electricity | 25 (10.2%) | 14 (38.9%) |
| Fuel Oil or Kerosene | 0 (0.0%) | 0 (0.0%) |
| Coal or Coke | 31 (12.6%) | 0 (0.0%) |
| All other Fuels | 16 (6.5%) | 0 (0.0%) |
| No Fuel Used | 0 (0.0%) | 0 (0.0%) |
| Total | 246 (100.0%) | 36 (100.0%) |
Household Vehicle Usage in Dayton
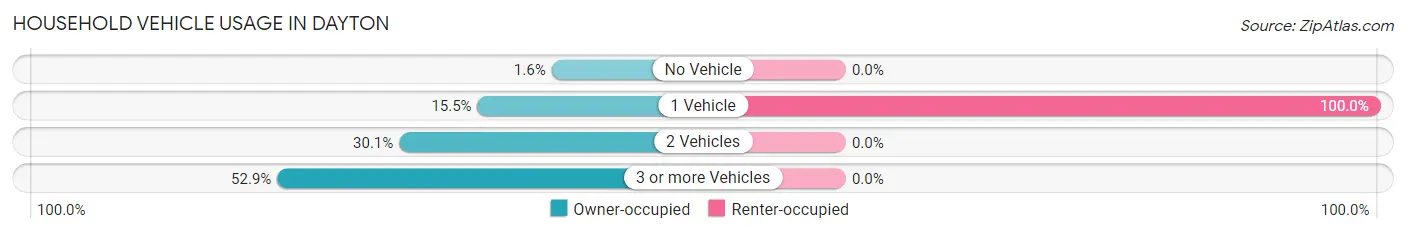
| Vehicles per Household | Owner-occupied | Renter-occupied |
| No Vehicle | 4 (1.6%) | 0 (0.0%) |
| 1 Vehicle | 38 (15.4%) | 36 (100.0%) |
| 2 Vehicles | 74 (30.1%) | 0 (0.0%) |
| 3 or more Vehicles | 130 (52.8%) | 0 (0.0%) |
| Total | 246 (100.0%) | 36 (100.0%) |
Real Estate & Mortgages in Dayton
Real Estate and Mortgage Overview in Dayton
| Characteristic | Without Mortgage | With Mortgage |
| Housing Units | 92 | 154 |
| Median Property Value | $246,400 | $284,100 |
| Median Household Income | - | - |
| Monthly Housing Costs | $574 | $13 |
| Real Estate Taxes | $1,331 | $0 |
Property Value by Mortgage Status in Dayton
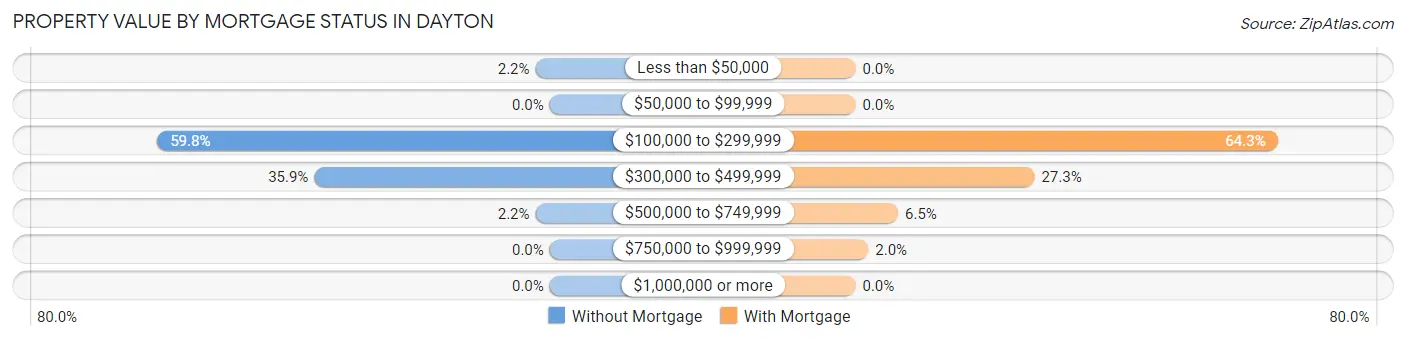
| Property Value | Without Mortgage | With Mortgage |
| Less than $50,000 | 2 (2.2%) | 0 (0.0%) |
| $50,000 to $99,999 | 0 (0.0%) | 0 (0.0%) |
| $100,000 to $299,999 | 55 (59.8%) | 99 (64.3%) |
| $300,000 to $499,999 | 33 (35.9%) | 42 (27.3%) |
| $500,000 to $749,999 | 2 (2.2%) | 10 (6.5%) |
| $750,000 to $999,999 | 0 (0.0%) | 3 (1.9%) |
| $1,000,000 or more | 0 (0.0%) | 0 (0.0%) |
| Total | 92 (100.0%) | 154 (100.0%) |
Household Income by Mortgage Status in Dayton
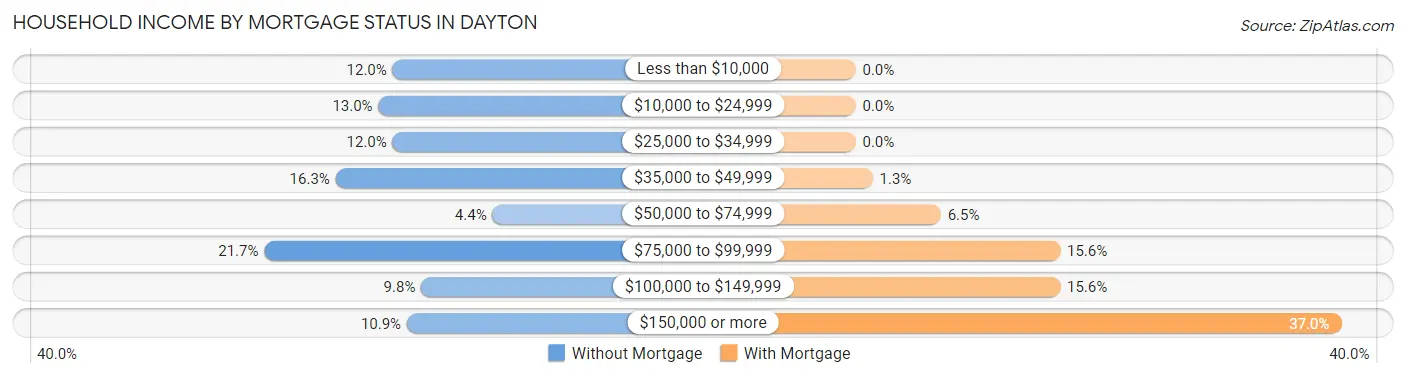
| Household Income | Without Mortgage | With Mortgage |
| Less than $10,000 | 11 (12.0%) | 0 (0.0%) |
| $10,000 to $24,999 | 12 (13.0%) | 0 (0.0%) |
| $25,000 to $34,999 | 11 (12.0%) | 0 (0.0%) |
| $35,000 to $49,999 | 15 (16.3%) | 2 (1.3%) |
| $50,000 to $74,999 | 4 (4.3%) | 10 (6.5%) |
| $75,000 to $99,999 | 20 (21.7%) | 24 (15.6%) |
| $100,000 to $149,999 | 9 (9.8%) | 24 (15.6%) |
| $150,000 or more | 10 (10.9%) | 57 (37.0%) |
| Total | 92 (100.0%) | 154 (100.0%) |
Property Value to Household Income Ratio in Dayton
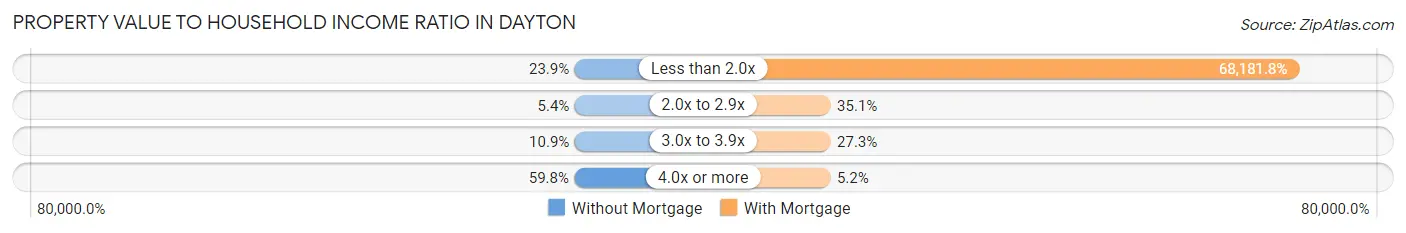
| Value-to-Income Ratio | Without Mortgage | With Mortgage |
| Less than 2.0x | 22 (23.9%) | 105,000 (68,181.8%) |
| 2.0x to 2.9x | 5 (5.4%) | 54 (35.1%) |
| 3.0x to 3.9x | 10 (10.9%) | 42 (27.3%) |
| 4.0x or more | 55 (59.8%) | 8 (5.2%) |
| Total | 92 (100.0%) | 154 (100.0%) |
Real Estate Taxes by Mortgage Status in Dayton
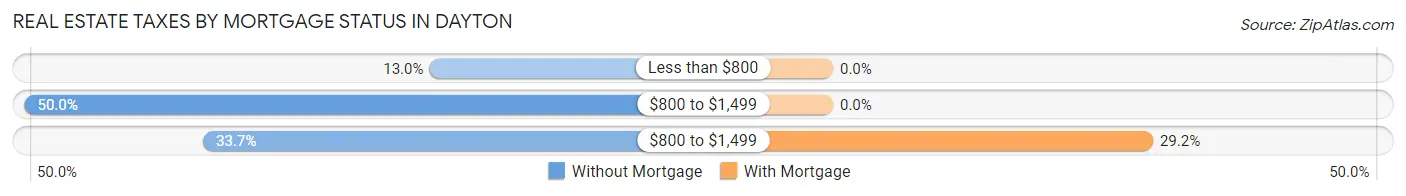
| Property Taxes | Without Mortgage | With Mortgage |
| Less than $800 | 12 (13.0%) | 0 (0.0%) |
| $800 to $1,499 | 46 (50.0%) | 0 (0.0%) |
| $800 to $1,499 | 31 (33.7%) | 45 (29.2%) |
| Total | 92 (100.0%) | 154 (100.0%) |
Health & Disability in Dayton
Health Insurance Coverage by Age in Dayton
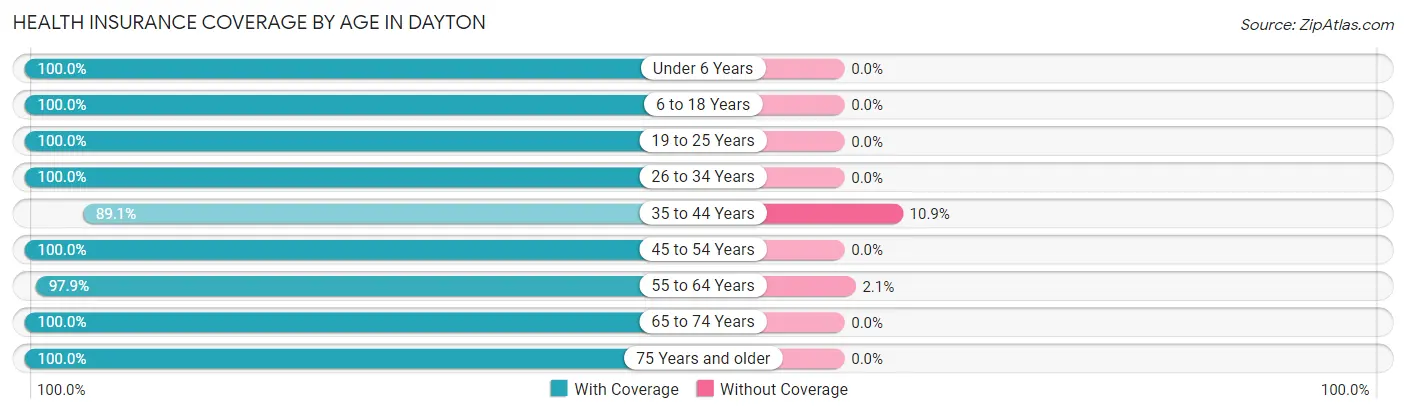
| Age Bracket | With Coverage | Without Coverage |
| Under 6 Years | 26 (100.0%) | 0 (0.0%) |
| 6 to 18 Years | 252 (100.0%) | 0 (0.0%) |
| 19 to 25 Years | 19 (100.0%) | 0 (0.0%) |
| 26 to 34 Years | 90 (100.0%) | 0 (0.0%) |
| 35 to 44 Years | 82 (89.1%) | 10 (10.9%) |
| 45 to 54 Years | 93 (100.0%) | 0 (0.0%) |
| 55 to 64 Years | 94 (97.9%) | 2 (2.1%) |
| 65 to 74 Years | 148 (100.0%) | 0 (0.0%) |
| 75 Years and older | 55 (100.0%) | 0 (0.0%) |
| Total | 859 (98.6%) | 12 (1.4%) |
Health Insurance Coverage by Citizenship Status in Dayton

| Citizenship Status | With Coverage | Without Coverage |
| Native Born | 26 (100.0%) | 0 (0.0%) |
| Foreign Born, Citizen | 252 (100.0%) | 0 (0.0%) |
| Foreign Born, not a Citizen | 19 (100.0%) | 0 (0.0%) |
Health Insurance Coverage by Household Income in Dayton
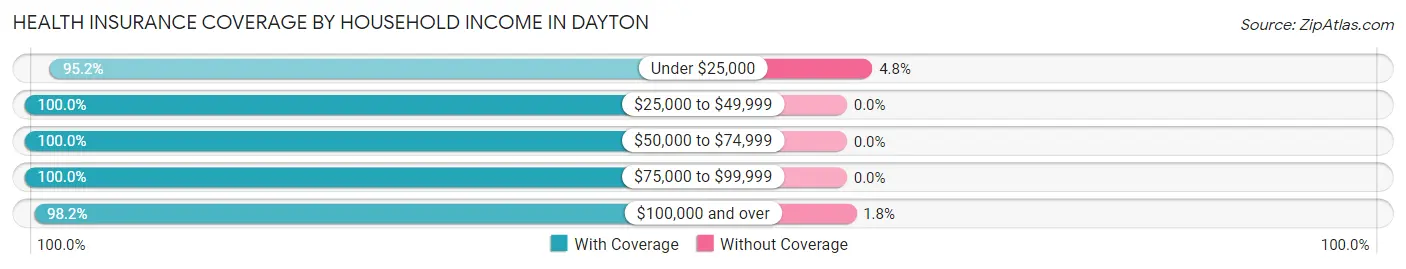
| Household Income | With Coverage | Without Coverage |
| Under $25,000 | 40 (95.2%) | 2 (4.8%) |
| $25,000 to $49,999 | 85 (100.0%) | 0 (0.0%) |
| $50,000 to $74,999 | 62 (100.0%) | 0 (0.0%) |
| $75,000 to $99,999 | 117 (100.0%) | 0 (0.0%) |
| $100,000 and over | 555 (98.2%) | 10 (1.8%) |
Public vs Private Health Insurance Coverage by Age in Dayton
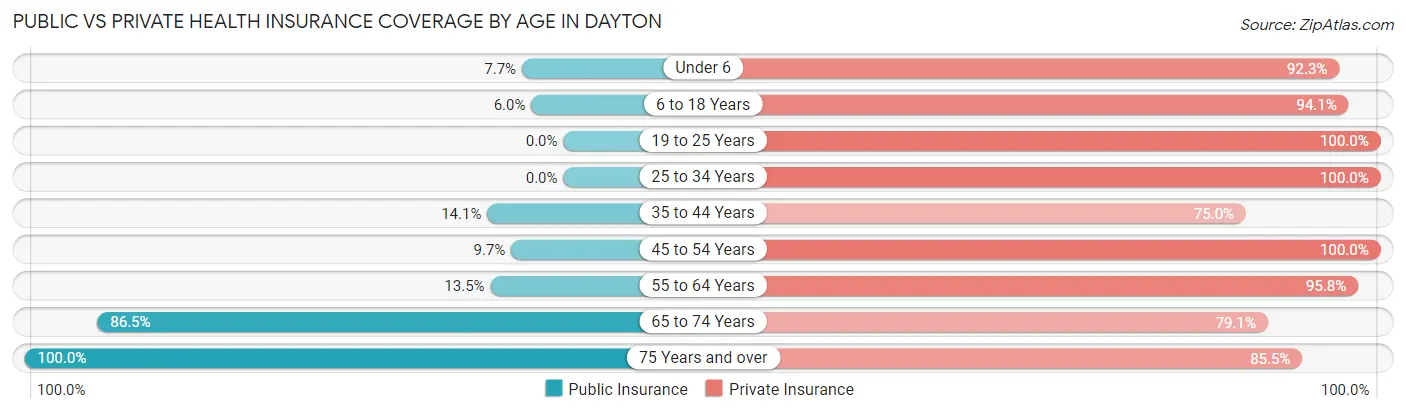
| Age Bracket | Public Insurance | Private Insurance |
| Under 6 | 2 (7.7%) | 24 (92.3%) |
| 6 to 18 Years | 15 (5.9%) | 237 (94.1%) |
| 19 to 25 Years | 0 (0.0%) | 19 (100.0%) |
| 25 to 34 Years | 0 (0.0%) | 90 (100.0%) |
| 35 to 44 Years | 13 (14.1%) | 69 (75.0%) |
| 45 to 54 Years | 9 (9.7%) | 93 (100.0%) |
| 55 to 64 Years | 13 (13.5%) | 92 (95.8%) |
| 65 to 74 Years | 128 (86.5%) | 117 (79.0%) |
| 75 Years and over | 55 (100.0%) | 47 (85.5%) |
| Total | 235 (27.0%) | 788 (90.5%) |
Disability Status by Sex by Age in Dayton
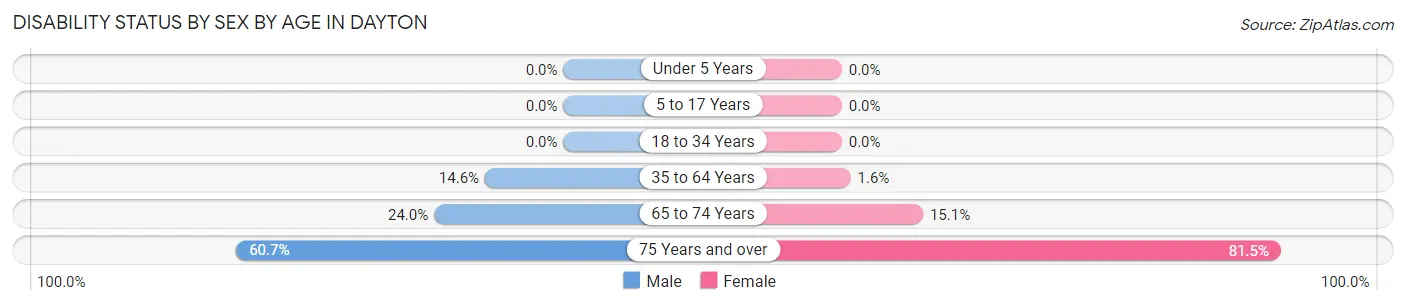
| Age Bracket | Male | Female |
| Under 5 Years | 0 (0.0%) | 0 (0.0%) |
| 5 to 17 Years | 0 (0.0%) | 0 (0.0%) |
| 18 to 34 Years | 0 (0.0%) | 0 (0.0%) |
| 35 to 64 Years | 23 (14.6%) | 2 (1.6%) |
| 65 to 74 Years | 18 (24.0%) | 11 (15.1%) |
| 75 Years and over | 17 (60.7%) | 22 (81.5%) |
Disability Class by Sex by Age in Dayton
Disability Class: Hearing Difficulty
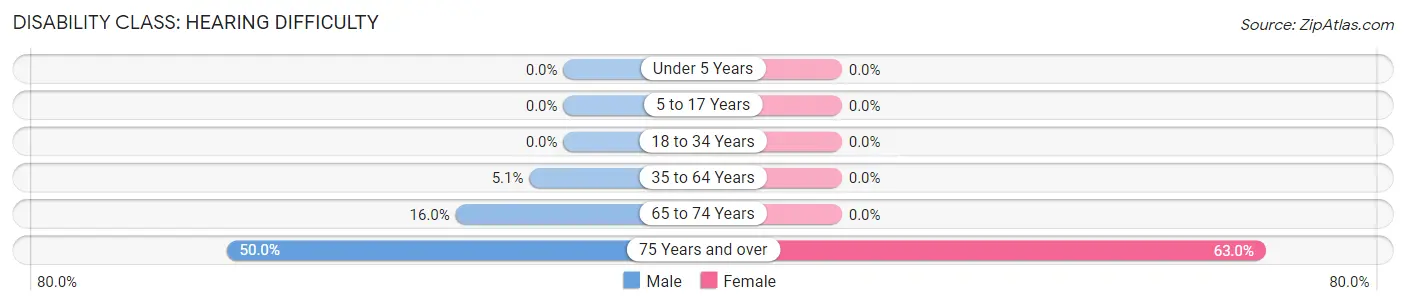
| Age Bracket | Male | Female |
| Under 5 Years | 0 (0.0%) | 0 (0.0%) |
| 5 to 17 Years | 0 (0.0%) | 0 (0.0%) |
| 18 to 34 Years | 0 (0.0%) | 0 (0.0%) |
| 35 to 64 Years | 8 (5.1%) | 0 (0.0%) |
| 65 to 74 Years | 12 (16.0%) | 0 (0.0%) |
| 75 Years and over | 14 (50.0%) | 17 (63.0%) |
Disability Class: Vision Difficulty
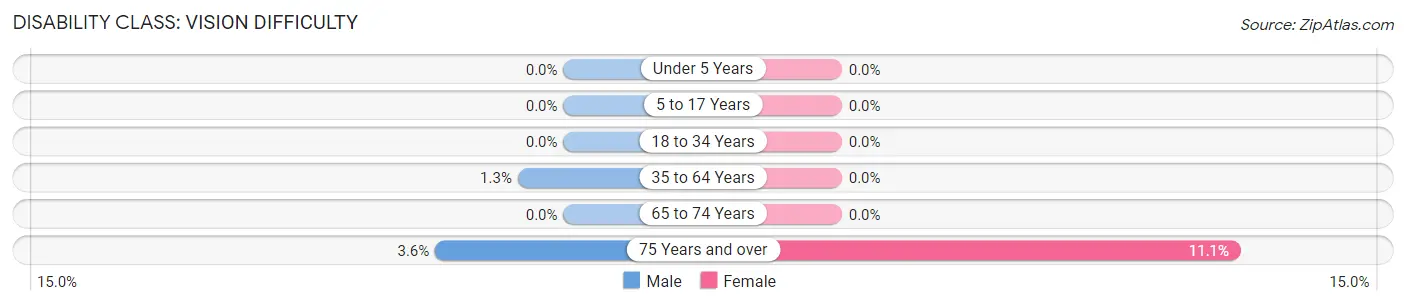
| Age Bracket | Male | Female |
| Under 5 Years | 0 (0.0%) | 0 (0.0%) |
| 5 to 17 Years | 0 (0.0%) | 0 (0.0%) |
| 18 to 34 Years | 0 (0.0%) | 0 (0.0%) |
| 35 to 64 Years | 2 (1.3%) | 0 (0.0%) |
| 65 to 74 Years | 0 (0.0%) | 0 (0.0%) |
| 75 Years and over | 1 (3.6%) | 3 (11.1%) |
Disability Class: Cognitive Difficulty
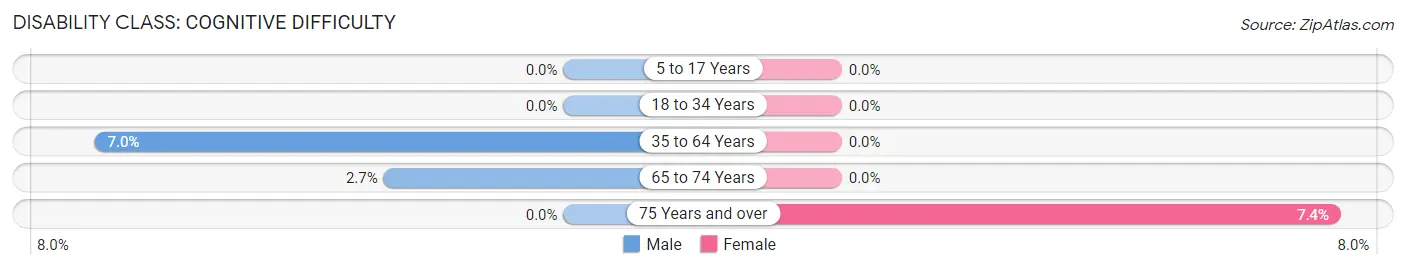
| Age Bracket | Male | Female |
| 5 to 17 Years | 0 (0.0%) | 0 (0.0%) |
| 18 to 34 Years | 0 (0.0%) | 0 (0.0%) |
| 35 to 64 Years | 11 (7.0%) | 0 (0.0%) |
| 65 to 74 Years | 2 (2.7%) | 0 (0.0%) |
| 75 Years and over | 0 (0.0%) | 2 (7.4%) |
Disability Class: Ambulatory Difficulty
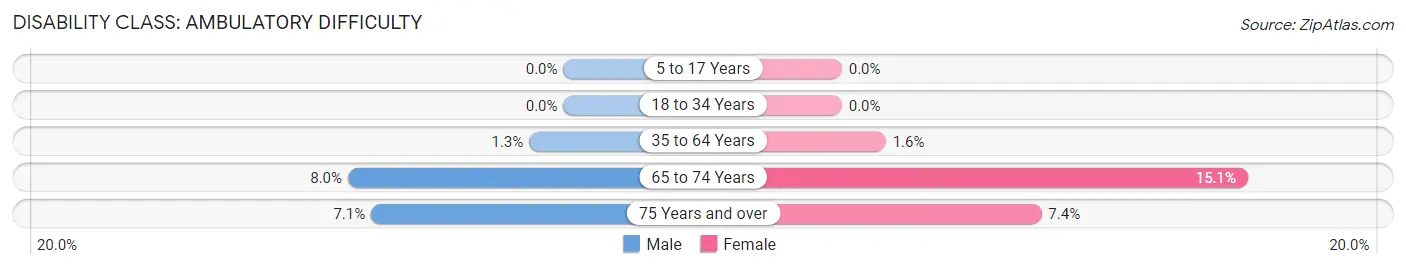
| Age Bracket | Male | Female |
| 5 to 17 Years | 0 (0.0%) | 0 (0.0%) |
| 18 to 34 Years | 0 (0.0%) | 0 (0.0%) |
| 35 to 64 Years | 2 (1.3%) | 2 (1.6%) |
| 65 to 74 Years | 6 (8.0%) | 11 (15.1%) |
| 75 Years and over | 2 (7.1%) | 2 (7.4%) |
Disability Class: Self-Care Difficulty
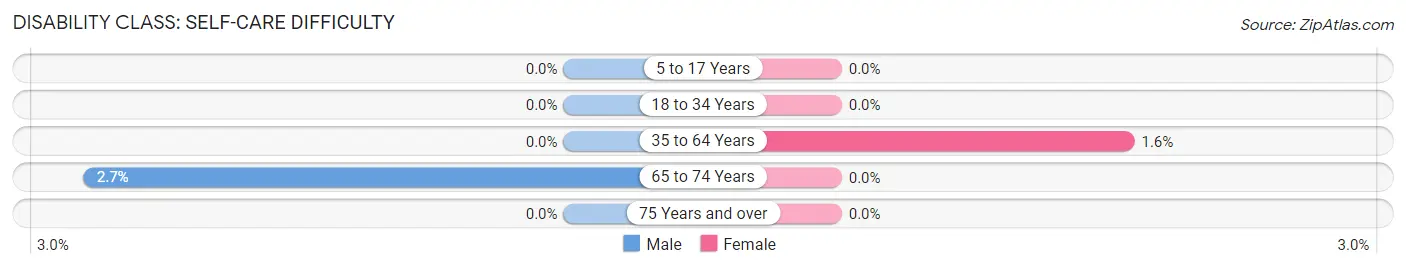
| Age Bracket | Male | Female |
| 5 to 17 Years | 0 (0.0%) | 0 (0.0%) |
| 18 to 34 Years | 0 (0.0%) | 0 (0.0%) |
| 35 to 64 Years | 0 (0.0%) | 2 (1.6%) |
| 65 to 74 Years | 2 (2.7%) | 0 (0.0%) |
| 75 Years and over | 0 (0.0%) | 0 (0.0%) |
Technology Access in Dayton
Computing Device Access in Dayton
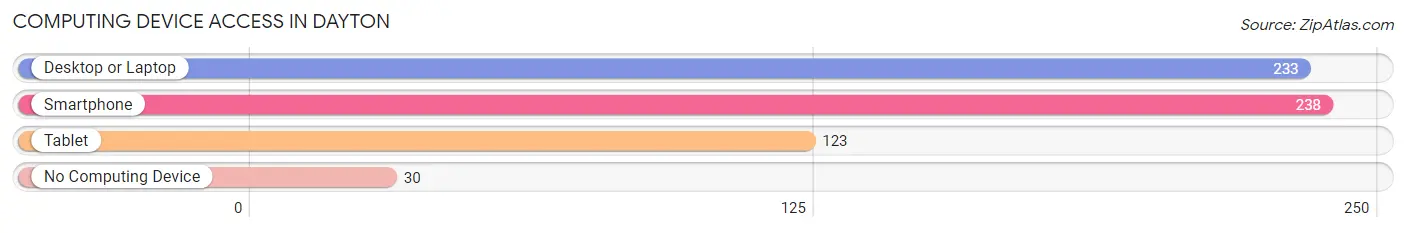
| Device Type | # Households | % Households |
| Desktop or Laptop | 233 | 82.6% |
| Smartphone | 238 | 84.4% |
| Tablet | 123 | 43.6% |
| No Computing Device | 30 | 10.6% |
| Total | 282 | 100.0% |
Internet Access in Dayton
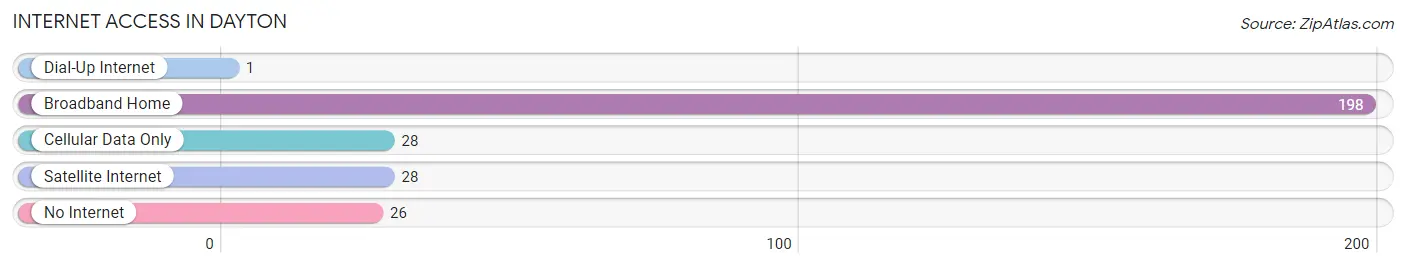
| Internet Type | # Households | % Households |
| Dial-Up Internet | 1 | 0.4% |
| Broadband Home | 198 | 70.2% |
| Cellular Data Only | 28 | 9.9% |
| Satellite Internet | 28 | 9.9% |
| No Internet | 26 | 9.2% |
| Total | 282 | 100.0% |
Dayton Summary
Dayton, Wyoming is a small town located in Sheridan County, in the northeastern corner of the state. It is situated at the base of the Big Horn Mountains, and is surrounded by rolling hills and prairies. The town was founded in 1882, and has a population of approximately 500 people.
Dayton is located in the heart of the Big Horn Basin, which is a large area of land that is surrounded by the Big Horn Mountains. The area is known for its rich agricultural land, and is home to many ranches and farms. The town is also located near the Tongue River, which is a major tributary of the Yellowstone River.
The economy of Dayton is largely based on agriculture and ranching. The town is home to several large ranches, and the surrounding area is known for its cattle and sheep production. The town also has a few small businesses, including a grocery store, a hardware store, and a few restaurants.
The geography of Dayton is characterized by rolling hills and prairies. The town is located at the base of the Big Horn Mountains, and is surrounded by the Tongue River and the Big Horn River. The area is known for its beautiful scenery, and is a popular destination for outdoor activities such as fishing, hunting, and camping.
The demographics of Dayton are largely rural. The town has a population of approximately 500 people, and the majority of the population is white. The median age of the population is 44 years old, and the median household income is $45,000. The town has a low unemployment rate, and the majority of the population is employed in the agricultural and ranching industries.
Dayton is a small town with a rich history and a strong sense of community. The town is known for its beautiful scenery and its friendly people, and is a great place to live and work. The town is also home to several small businesses, and is a great place to visit for outdoor activities.
Common Questions
What is Per Capita Income in Dayton?
Per Capita income in Dayton is $35,349.
What is the Median Family Income in Dayton?
Median Family Income in Dayton is $104,231.
What is the Median Household income in Dayton?
Median Household Income in Dayton is $86,786.
What is Income or Wage Gap in Dayton?
Income or Wage Gap in Dayton is 19.0%.
Women in Dayton earn 81.0 cents for every dollar earned by a man.
What is Inequality or Gini Index in Dayton?
Inequality or Gini Index in Dayton is 0.42.
What is the Total Population of Dayton?
Total Population of Dayton is 871.
What is the Total Male Population of Dayton?
Total Male Population of Dayton is 445.
What is the Total Female Population of Dayton?
Total Female Population of Dayton is 426.
What is the Ratio of Males per 100 Females in Dayton?
There are 104.46 Males per 100 Females in Dayton.
What is the Ratio of Females per 100 Males in Dayton?
There are 95.73 Females per 100 Males in Dayton.
What is the Median Population Age in Dayton?
Median Population Age in Dayton is 42.5 Years.
What is the Average Family Size in Dayton
Average Family Size in Dayton is 4.0 People.
What is the Average Household Size in Dayton
Average Household Size in Dayton is 3.1 People.
How Large is the Labor Force in Dayton?
There are 443 People in the Labor Forcein in Dayton.
What is the Percentage of People in the Labor Force in Dayton?
66.7% of People are in the Labor Force in Dayton.
What is the Unemployment Rate in Dayton?
Unemployment Rate in Dayton is 0.7%.