Story, WY Map & Demographics
Story Map
Story Overview
$51,065
PER CAPITA INCOME
$125,191
AVG FAMILY INCOME
$107,188
AVG HOUSEHOLD INCOME
0.24
INEQUALITY / GINI INDEX
983
TOTAL POPULATION
521
MALE POPULATION
462
FEMALE POPULATION
112.77
MALES / 100 FEMALES
88.68
FEMALES / 100 MALES
53.4
MEDIAN AGE
2.7
AVG FAMILY SIZE
2.2
AVG HOUSEHOLD SIZE
629
LABOR FORCE [ PEOPLE ]
74.3%
PERCENT IN LABOR FORCE
Story Zip Codes
Story Area Codes
Income in Story
Income Overview in Story
Per Capita Income in Story is $51,065, while median incomes of families and households are $125,191 and $107,188 respectively.
| Characteristic | Number | Measure |
| Per Capita Income | 983 | $51,065 |
| Median Family Income | 311 | $125,191 |
| Mean Family Income | 311 | $115,414 |
| Median Household Income | 448 | $107,188 |
| Mean Household Income | 448 | $111,516 |
| Income Deficit | 311 | $0 |
| Wage / Income Gap (%) | 983 | 0.00% |
| Wage / Income Gap ($) | 983 | 100.00¢ per $1 |
| Gini / Inequality Index | 983 | 0.24 |
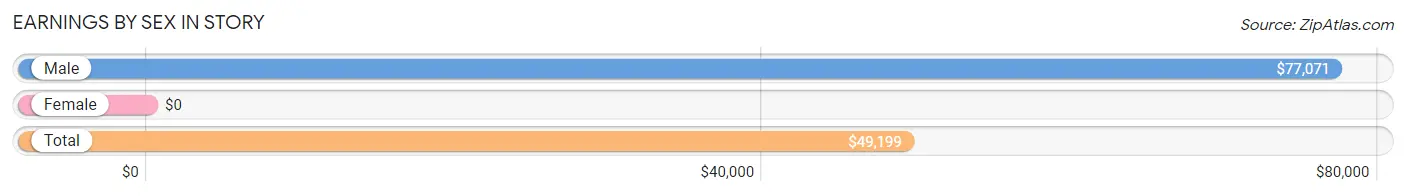
Earnings by Sex in Story
| Sex | Number | Average Earnings |
| Male | 343 (54.5%) | $77,071 |
| Female | 286 (45.5%) | $0 |
| Total | 629 (100.0%) | $49,199 |
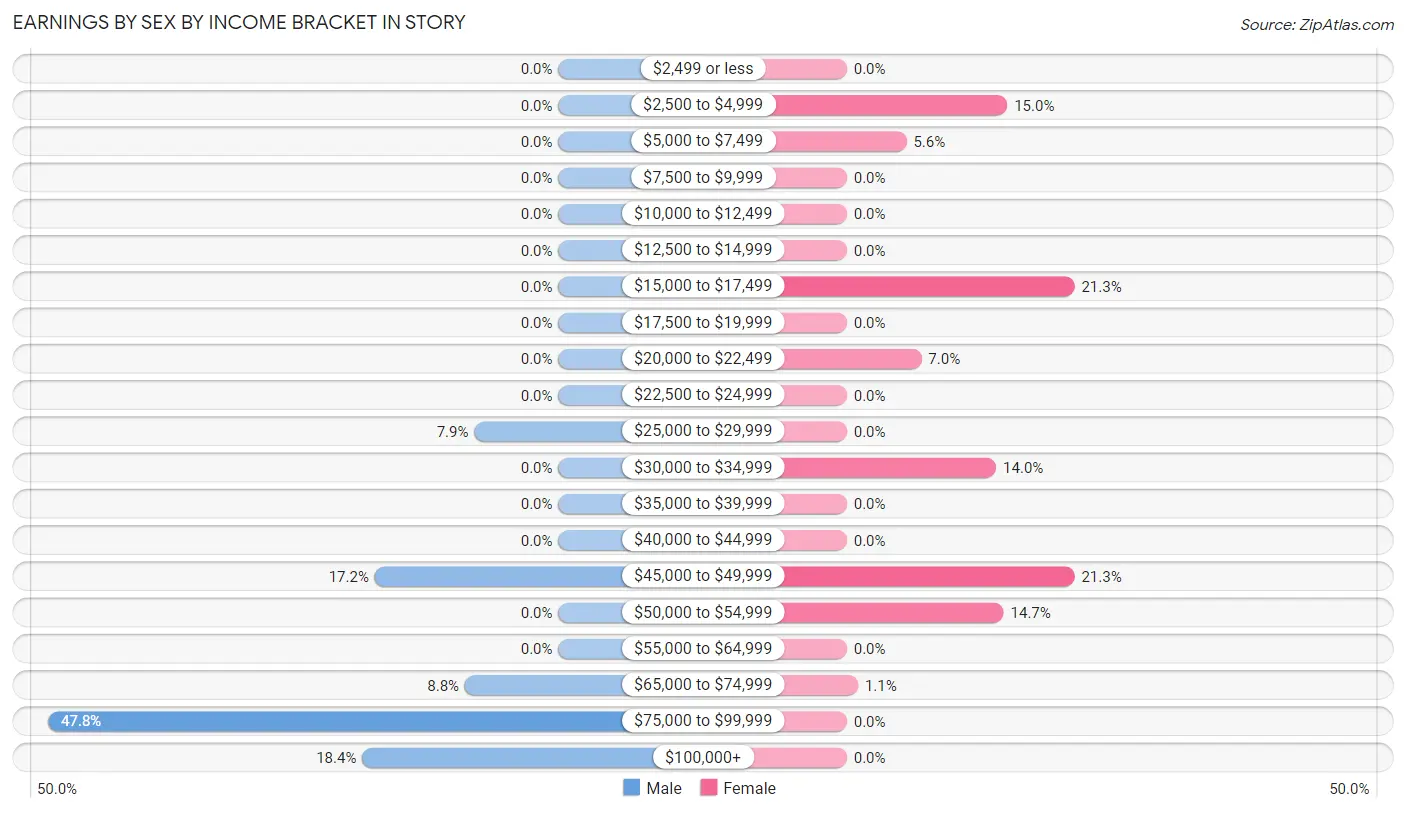
Earnings by Sex by Income Bracket in Story
The most common earnings brackets in Story are $75,000 to $99,999 for men (164 | 47.8%) and $15,000 to $17,499 for women (61 | 21.3%).
| Income | Male | Female |
| $2,499 or less | 0 (0.0%) | 0 (0.0%) |
| $2,500 to $4,999 | 0 (0.0%) | 43 (15.0%) |
| $5,000 to $7,499 | 0 (0.0%) | 16 (5.6%) |
| $7,500 to $9,999 | 0 (0.0%) | 0 (0.0%) |
| $10,000 to $12,499 | 0 (0.0%) | 0 (0.0%) |
| $12,500 to $14,999 | 0 (0.0%) | 0 (0.0%) |
| $15,000 to $17,499 | 0 (0.0%) | 61 (21.3%) |
| $17,500 to $19,999 | 0 (0.0%) | 0 (0.0%) |
| $20,000 to $22,499 | 0 (0.0%) | 20 (7.0%) |
| $22,500 to $24,999 | 0 (0.0%) | 0 (0.0%) |
| $25,000 to $29,999 | 27 (7.9%) | 0 (0.0%) |
| $30,000 to $34,999 | 0 (0.0%) | 40 (14.0%) |
| $35,000 to $39,999 | 0 (0.0%) | 0 (0.0%) |
| $40,000 to $44,999 | 0 (0.0%) | 0 (0.0%) |
| $45,000 to $49,999 | 59 (17.2%) | 61 (21.3%) |
| $50,000 to $54,999 | 0 (0.0%) | 42 (14.7%) |
| $55,000 to $64,999 | 0 (0.0%) | 0 (0.0%) |
| $65,000 to $74,999 | 30 (8.7%) | 3 (1.1%) |
| $75,000 to $99,999 | 164 (47.8%) | 0 (0.0%) |
| $100,000+ | 63 (18.4%) | 0 (0.0%) |
| Total | 343 (100.0%) | 286 (100.0%) |
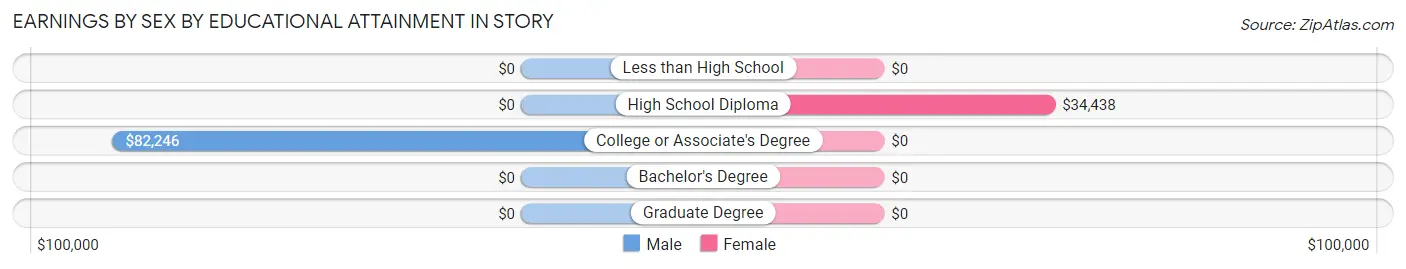
Earnings by Sex by Educational Attainment in Story
Average earnings in Story are $80,085 for men and $34,031 for women, a difference of 57.5%. Men with an educational attainment of college or associate's degree enjoy the highest average annual earnings of $82,246, while those with college or associate's degree education earn the least with $82,246. Women with an educational attainment of high school diploma earn the most with the average annual earnings of $34,438, while those with high school diploma education have the smallest earnings of $34,438.
| Educational Attainment | Male Income | Female Income |
| Less than High School | - | - |
| High School Diploma | - | - |
| College or Associate's Degree | $82,246 | $0 |
| Bachelor's Degree | - | - |
| Graduate Degree | - | - |
| Total | $80,085 | $34,031 |
Family Income in Story
Family Income Brackets in Story
According to the Story family income data, there are 99 families falling into the $100,000 to $149,999 income range, which is the most common income bracket and makes up 31.8% of all families.
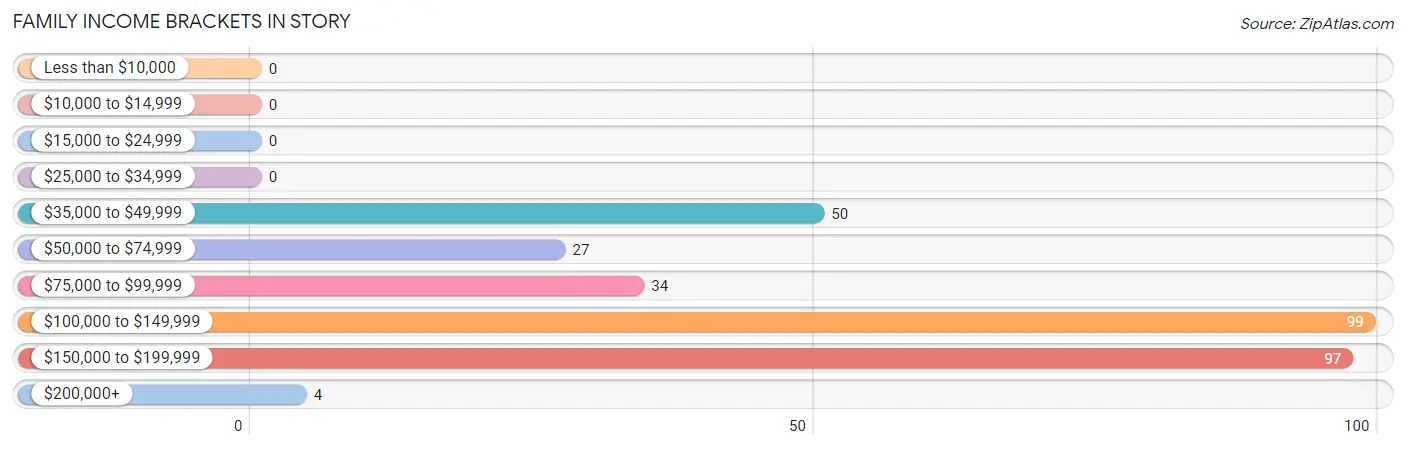
| Income Bracket | # Families | % Families |
| Less than $10,000 | 0 | 0.0% |
| $10,000 to $14,999 | 0 | 0.0% |
| $15,000 to $24,999 | 0 | 0.0% |
| $25,000 to $34,999 | 0 | 0.0% |
| $35,000 to $49,999 | 50 | 16.1% |
| $50,000 to $74,999 | 27 | 8.7% |
| $75,000 to $99,999 | 34 | 10.9% |
| $100,000 to $149,999 | 99 | 31.8% |
| $150,000 to $199,999 | 97 | 31.2% |
| $200,000+ | 4 | 1.3% |
Family Income by Famaliy Size in Story
2-person families (233 | 74.9%) account for the highest median family income in Story with $126,674 per family, while 2-person families (233 | 74.9%) have the highest median income of $63,337 per family member.
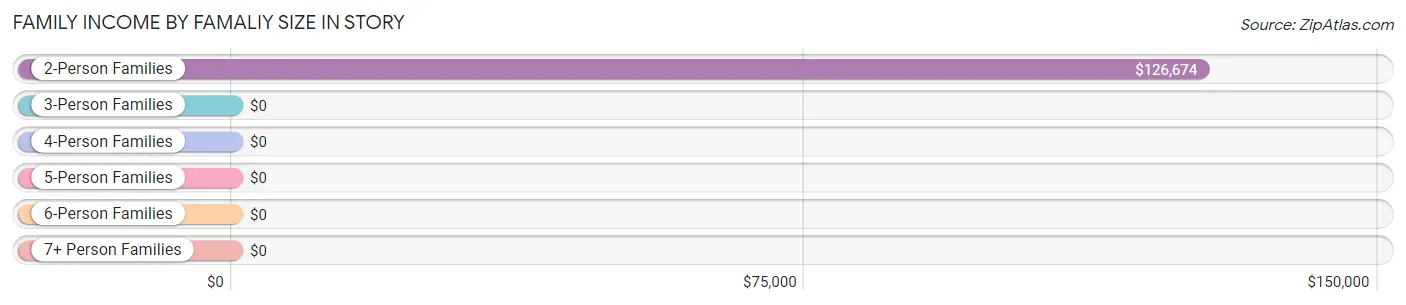
| Income Bracket | # Families | Median Income |
| 2-Person Families | 233 (74.9%) | $126,674 |
| 3-Person Families | 27 (8.7%) | $0 |
| 4-Person Families | 47 (15.1%) | $0 |
| 5-Person Families | 4 (1.3%) | $0 |
| 6-Person Families | 0 (0.0%) | $0 |
| 7+ Person Families | 0 (0.0%) | $0 |
| Total | 311 (100.0%) | $125,191 |
Family Income by Number of Earners in Story
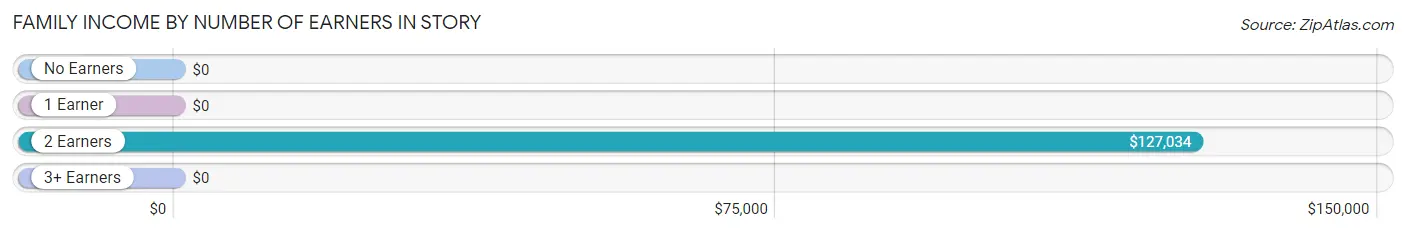
| Number of Earners | # Families | Median Income |
| No Earners | 70 (22.5%) | $0 |
| 1 Earner | 37 (11.9%) | $0 |
| 2 Earners | 164 (52.7%) | $127,034 |
| 3+ Earners | 40 (12.9%) | $0 |
| Total | 311 (100.0%) | $125,191 |
Household Income in Story
Household Income Brackets in Story
With 158 households falling in the category, the $100,000 to $149,999 income range is the most frequent in Story, accounting for 35.3% of all households.
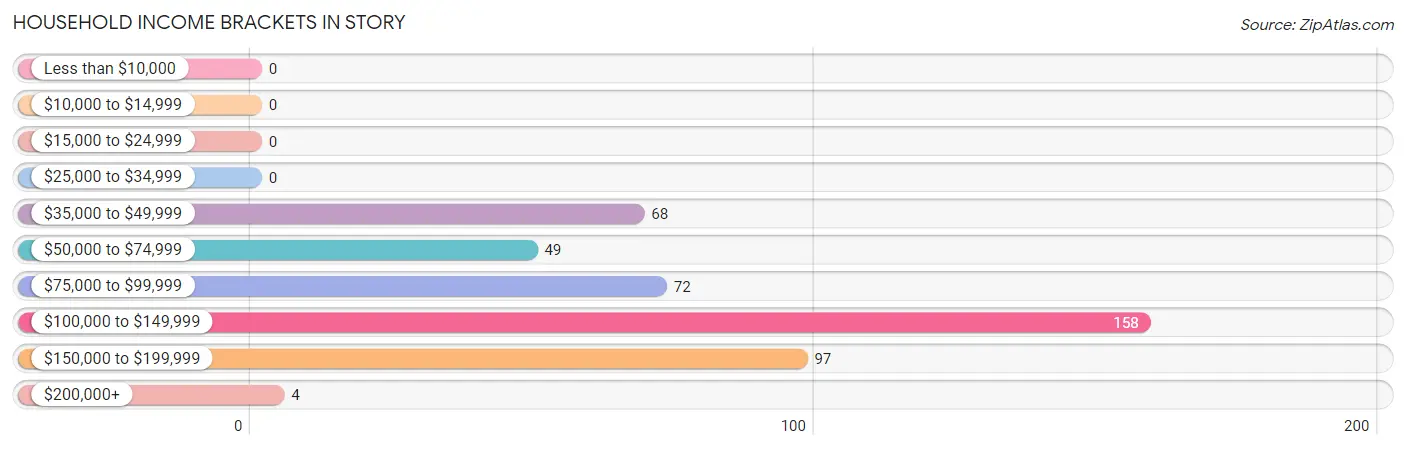
| Income Bracket | # Households | % Households |
| Less than $10,000 | 0 | 0.0% |
| $10,000 to $14,999 | 0 | 0.0% |
| $15,000 to $24,999 | 0 | 0.0% |
| $25,000 to $34,999 | 0 | 0.0% |
| $35,000 to $49,999 | 68 | 15.2% |
| $50,000 to $74,999 | 49 | 10.9% |
| $75,000 to $99,999 | 72 | 16.1% |
| $100,000 to $149,999 | 158 | 35.3% |
| $150,000 to $199,999 | 97 | 21.7% |
| $200,000+ | 4 | 0.9% |
Household Income by Householder Age in Story
The median household income in Story is $107,188, with the highest median household income of $127,225 found in the 45 to 64 years age bracket for the primary householder. A total of 181 households (40.4%) fall into this category.
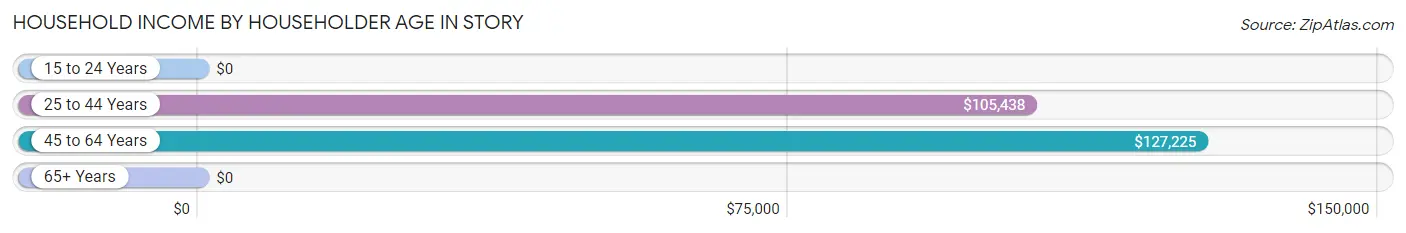
| Income Bracket | # Households | Median Income |
| 15 to 24 Years | 0 (0.0%) | $0 |
| 25 to 44 Years | 158 (35.3%) | $105,438 |
| 45 to 64 Years | 181 (40.4%) | $127,225 |
| 65+ Years | 109 (24.3%) | $0 |
| Total | 448 (100.0%) | $107,188 |
Poverty in Story
Income Below Poverty by Sex and Age in Story
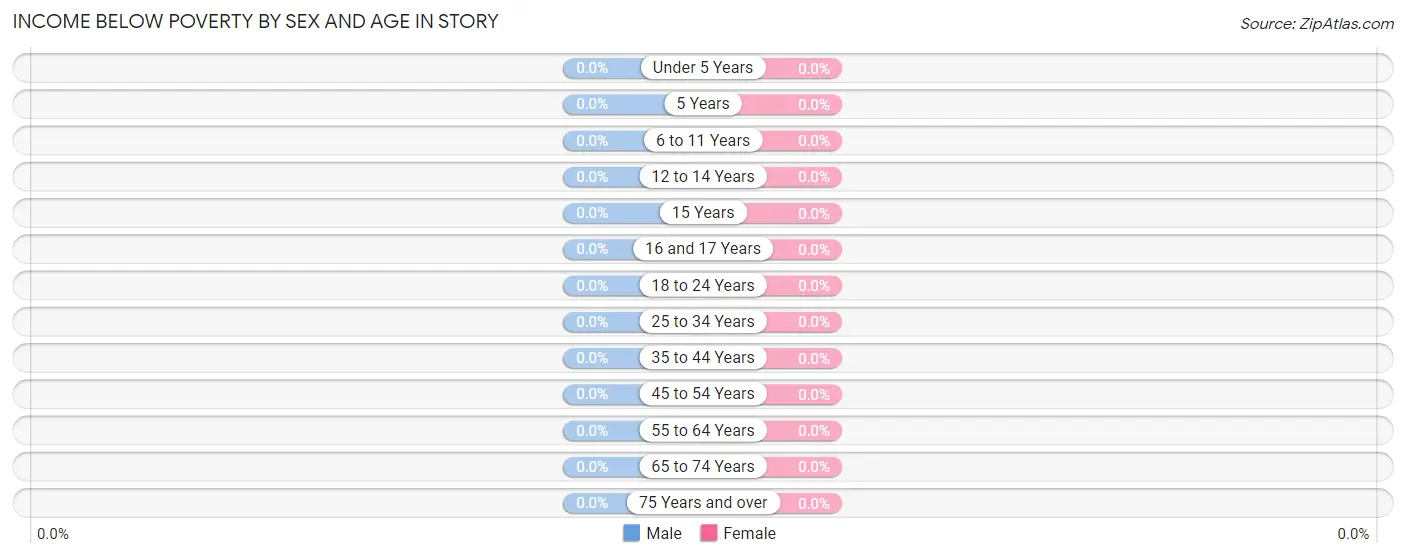
| Age Bracket | Male | Female |
| Under 5 Years | 0 (0.0%) | 0 (0.0%) |
| 5 Years | 0 (0.0%) | 0 (0.0%) |
| 6 to 11 Years | 0 (0.0%) | 0 (0.0%) |
| 12 to 14 Years | 0 (0.0%) | 0 (0.0%) |
| 15 Years | 0 (0.0%) | 0 (0.0%) |
| 16 and 17 Years | 0 (0.0%) | 0 (0.0%) |
| 18 to 24 Years | 0 (0.0%) | 0 (0.0%) |
| 25 to 34 Years | 0 (0.0%) | 0 (0.0%) |
| 35 to 44 Years | 0 (0.0%) | 0 (0.0%) |
| 45 to 54 Years | 0 (0.0%) | 0 (0.0%) |
| 55 to 64 Years | 0 (0.0%) | 0 (0.0%) |
| 65 to 74 Years | 0 (0.0%) | 0 (0.0%) |
| 75 Years and over | 0 (0.0%) | 0 (0.0%) |
| Total | 0 (0.0%) | 0 (0.0%) |
Income Above Poverty by Sex and Age in Story
According to the poverty statistics in Story, males aged under 5 years and females aged 6 to 11 years are the age groups that are most secure financially, with 100.0% of males and 100.0% of females in these age groups living above the poverty line.
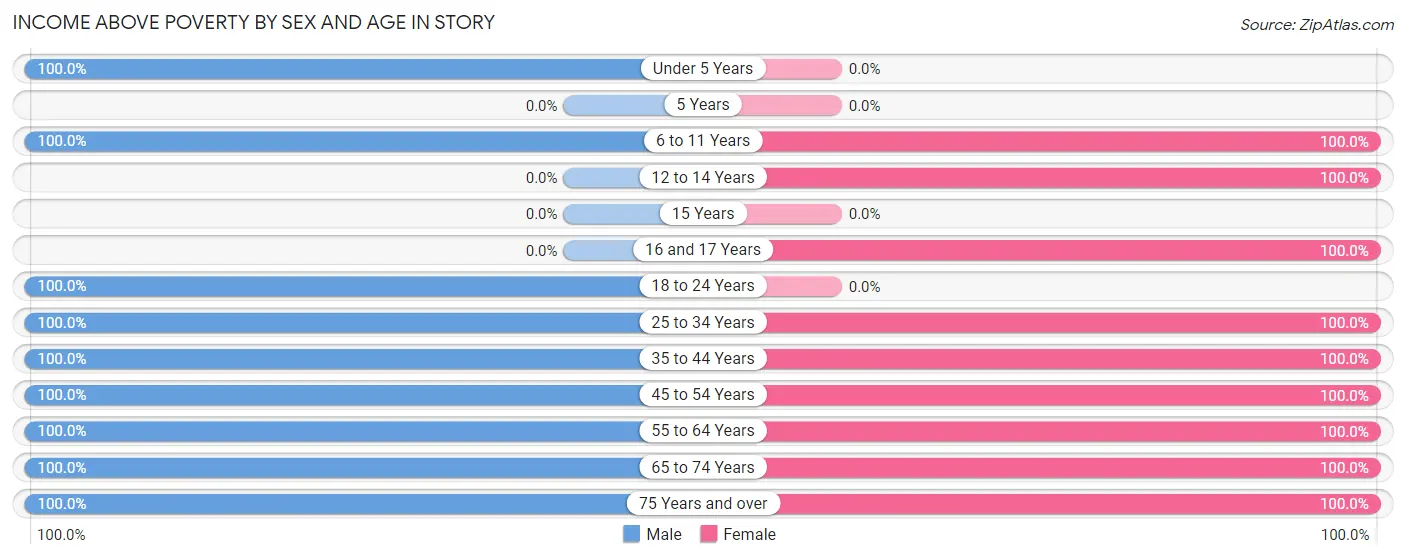
| Age Bracket | Male | Female |
| Under 5 Years | 7 (100.0%) | 0 (0.0%) |
| 5 Years | 0 (0.0%) | 0 (0.0%) |
| 6 to 11 Years | 19 (100.0%) | 103 (100.0%) |
| 12 to 14 Years | 0 (0.0%) | 7 (100.0%) |
| 15 Years | 0 (0.0%) | 0 (0.0%) |
| 16 and 17 Years | 0 (0.0%) | 43 (100.0%) |
| 18 to 24 Years | 27 (100.0%) | 0 (0.0%) |
| 25 to 34 Years | 73 (100.0%) | 42 (100.0%) |
| 35 to 44 Years | 78 (100.0%) | 50 (100.0%) |
| 45 to 54 Years | 35 (100.0%) | 20 (100.0%) |
| 55 to 64 Years | 130 (100.0%) | 131 (100.0%) |
| 65 to 74 Years | 107 (100.0%) | 48 (100.0%) |
| 75 Years and over | 45 (100.0%) | 18 (100.0%) |
| Total | 521 (100.0%) | 462 (100.0%) |
Income Below Poverty Among Married-Couple Families in Story
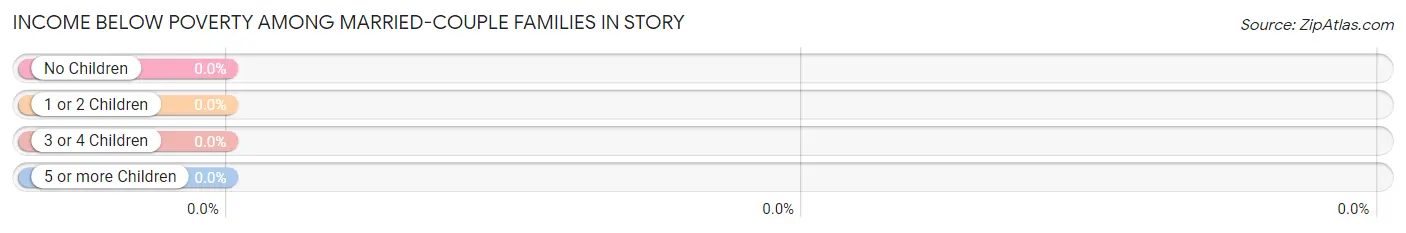
| Children | Above Poverty | Below Poverty |
| No Children | 203 (100.0%) | 0 (0.0%) |
| 1 or 2 Children | 74 (100.0%) | 0 (0.0%) |
| 3 or 4 Children | 4 (100.0%) | 0 (0.0%) |
| 5 or more Children | 0 (0.0%) | 0 (0.0%) |
| Total | 281 (100.0%) | 0 (0.0%) |
Income Below Poverty Among Single-Parent Households in Story
| Children | Single Father | Single Mother |
| No Children | 0 (0.0%) | 0 (0.0%) |
| 1 or 2 Children | 0 (0.0%) | 0 (0.0%) |
| 3 or 4 Children | 0 (0.0%) | 0 (0.0%) |
| 5 or more Children | 0 (0.0%) | 0 (0.0%) |
| Total | 0 (0.0%) | 0 (0.0%) |
Income Below Poverty Among Married-Couple vs Single-Parent Households in Story
| Children | Married-Couple Families | Single-Parent Households |
| No Children | 0 (0.0%) | 0 (0.0%) |
| 1 or 2 Children | 0 (0.0%) | 0 (0.0%) |
| 3 or 4 Children | 0 (0.0%) | 0 (0.0%) |
| 5 or more Children | 0 (0.0%) | 0 (0.0%) |
| Total | 0 (0.0%) | 0 (0.0%) |
Race in Story
The most populous races in Story are , and White / Caucasian (983 | 100.0%).
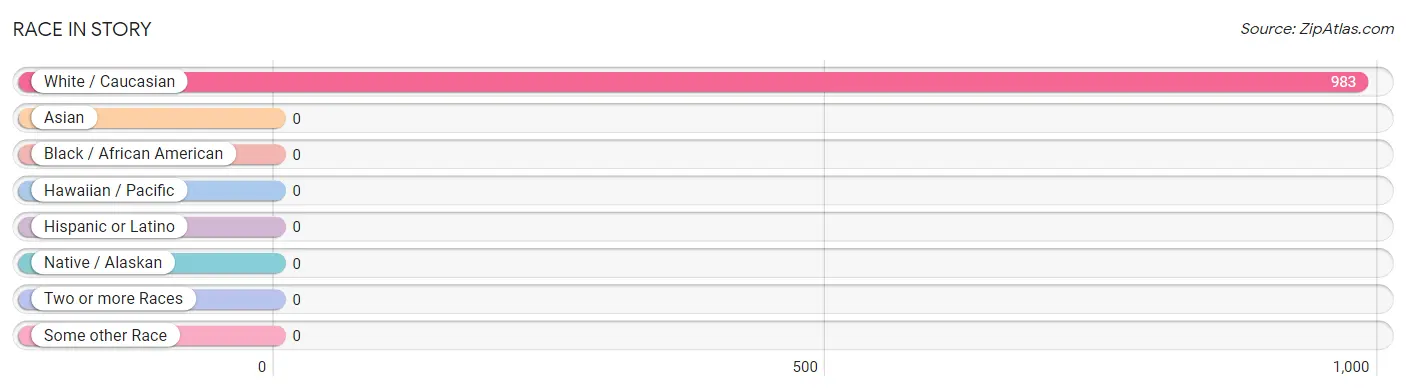
| Race | # Population | % Population |
| Asian | 0 | 0.0% |
| Black / African American | 0 | 0.0% |
| Hawaiian / Pacific | 0 | 0.0% |
| Hispanic or Latino | 0 | 0.0% |
| Native / Alaskan | 0 | 0.0% |
| White / Caucasian | 983 | 100.0% |
| Two or more Races | 0 | 0.0% |
| Some other Race | 0 | 0.0% |
| Total | 983 | 100.0% |
Ancestry in Story
The most populous ancestries reported in Story are German (55 | 5.6%), Northern European (48 | 4.9%), Welsh (27 | 2.8%), English (25 | 2.5%), and American (13 | 1.3%), together accounting for 17.1% of all Story residents.
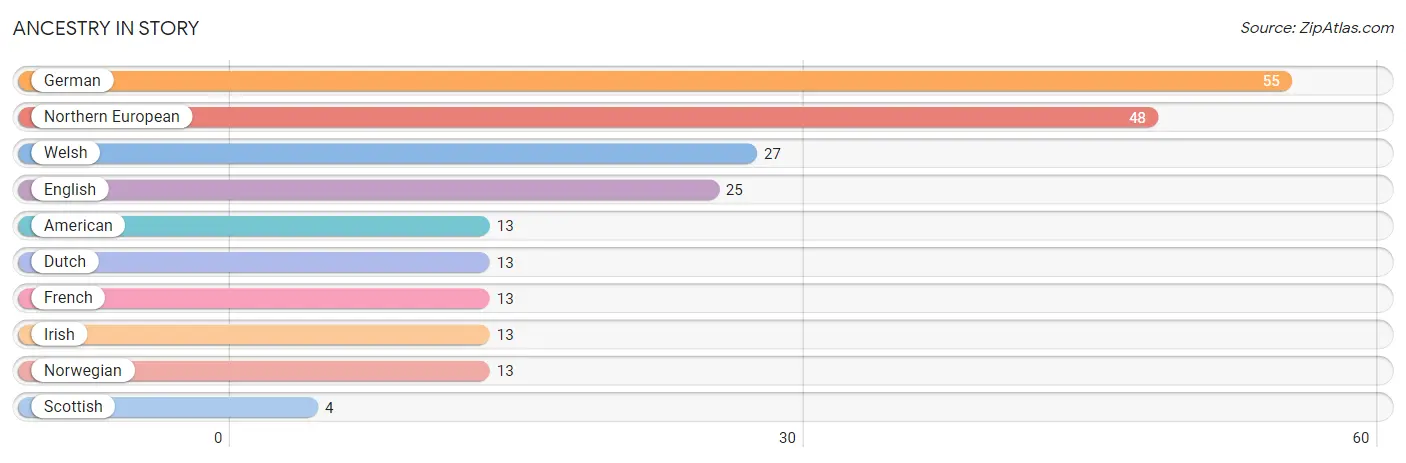
| Ancestry | # Population | % Population |
| American | 13 | 1.3% |
| Dutch | 13 | 1.3% |
| English | 25 | 2.5% |
| French | 13 | 1.3% |
| German | 55 | 5.6% |
| Irish | 13 | 1.3% |
| Northern European | 48 | 4.9% |
| Norwegian | 13 | 1.3% |
| Scottish | 4 | 0.4% |
| Welsh | 27 | 2.8% | View All 10 Rows |
Immigrants in Story

| Immigration Origin | # Population | % Population | View All 0 Rows |
Sex and Age in Story
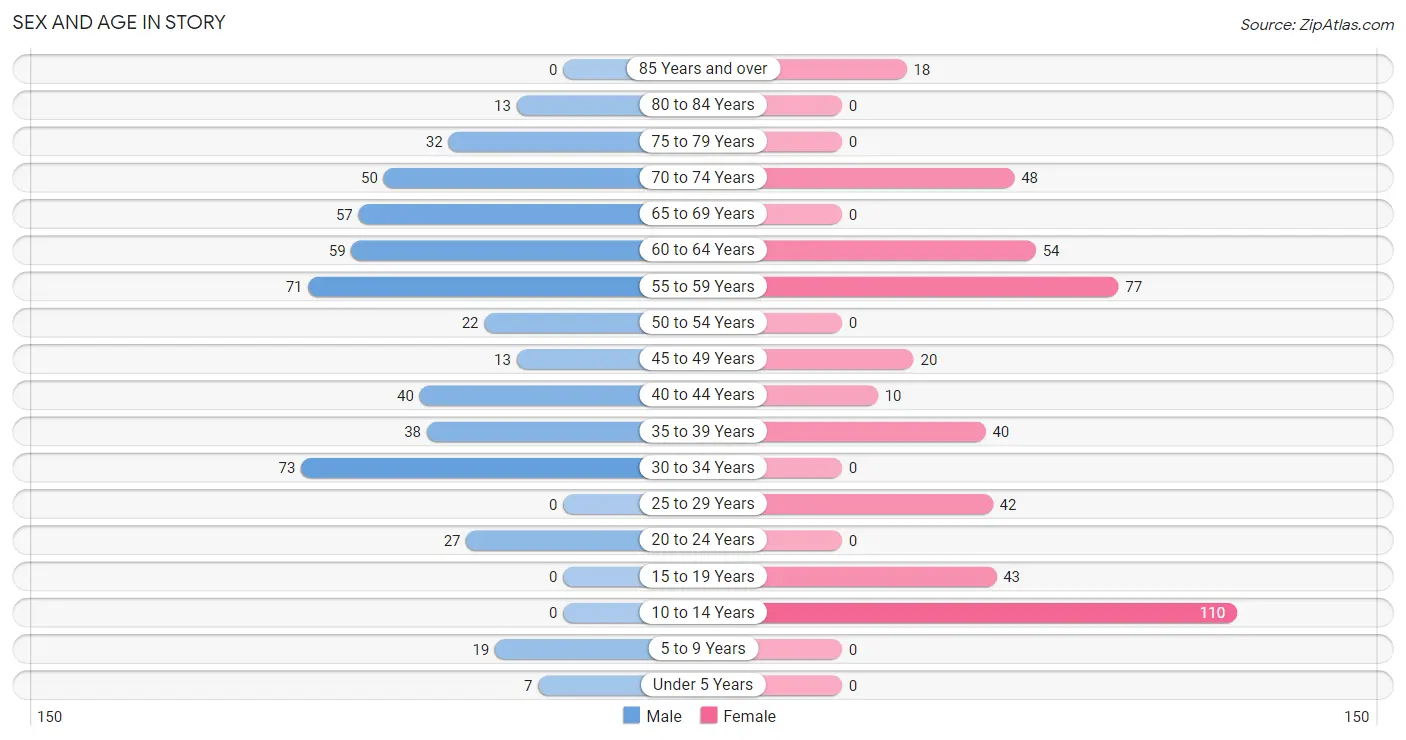
Sex and Age in Story
The most populous age groups in Story are 30 to 34 Years (73 | 14.0%) for men and 10 to 14 Years (110 | 23.8%) for women.
| Age Bracket | Male | Female |
| Under 5 Years | 7 (1.3%) | 0 (0.0%) |
| 5 to 9 Years | 19 (3.6%) | 0 (0.0%) |
| 10 to 14 Years | 0 (0.0%) | 110 (23.8%) |
| 15 to 19 Years | 0 (0.0%) | 43 (9.3%) |
| 20 to 24 Years | 27 (5.2%) | 0 (0.0%) |
| 25 to 29 Years | 0 (0.0%) | 42 (9.1%) |
| 30 to 34 Years | 73 (14.0%) | 0 (0.0%) |
| 35 to 39 Years | 38 (7.3%) | 40 (8.7%) |
| 40 to 44 Years | 40 (7.7%) | 10 (2.2%) |
| 45 to 49 Years | 13 (2.5%) | 20 (4.3%) |
| 50 to 54 Years | 22 (4.2%) | 0 (0.0%) |
| 55 to 59 Years | 71 (13.6%) | 77 (16.7%) |
| 60 to 64 Years | 59 (11.3%) | 54 (11.7%) |
| 65 to 69 Years | 57 (10.9%) | 0 (0.0%) |
| 70 to 74 Years | 50 (9.6%) | 48 (10.4%) |
| 75 to 79 Years | 32 (6.1%) | 0 (0.0%) |
| 80 to 84 Years | 13 (2.5%) | 0 (0.0%) |
| 85 Years and over | 0 (0.0%) | 18 (3.9%) |
| Total | 521 (100.0%) | 462 (100.0%) |
Families and Households in Story
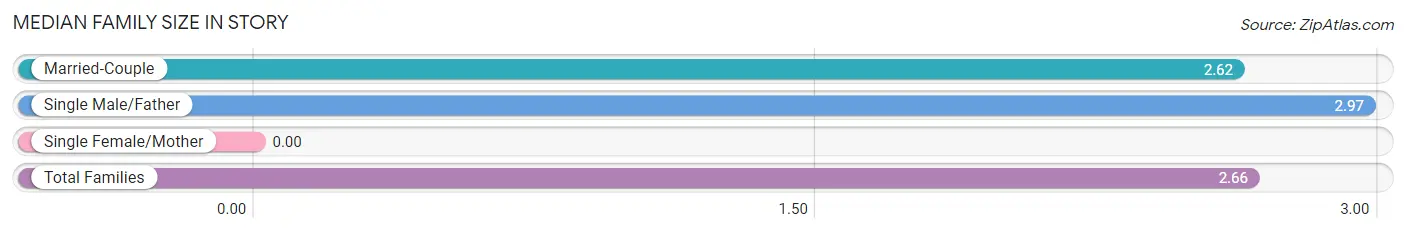
Median Family Size in Story
| Family Type | # Families | Family Size |
| Married-Couple | 281 (90.3%) | 2.62 |
| Single Male/Father | 30 (9.7%) | 2.97 |
| Single Female/Mother | 0 (0.0%) | - |
| Total Families | 311 (100.0%) | 2.66 |
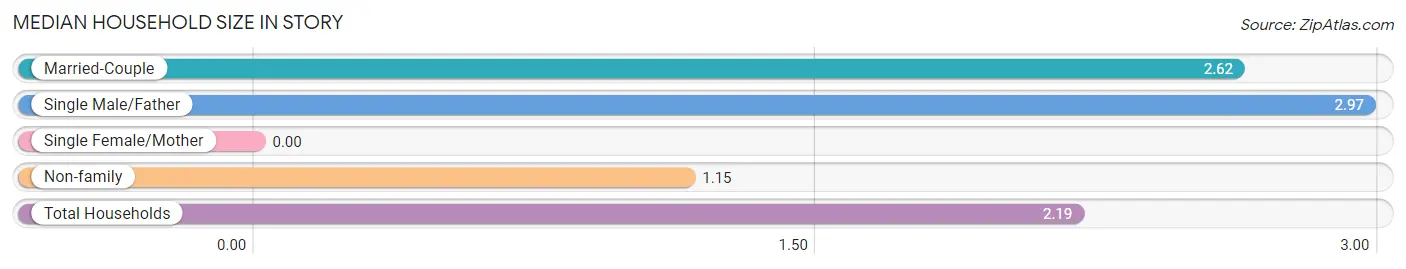
Median Household Size in Story
| Household Type | # Households | Household Size |
| Married-Couple | 281 (62.7%) | 2.62 |
| Single Male/Father | 30 (6.7%) | 2.97 |
| Single Female/Mother | 0 (0.0%) | - |
| Non-family | 137 (30.6%) | 1.15 |
| Total Households | 448 (100.0%) | 2.19 |
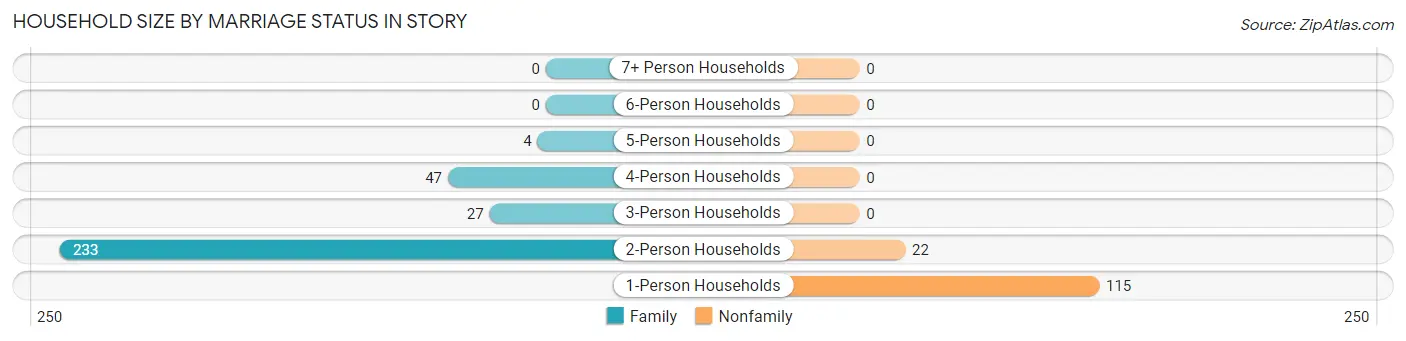
Household Size by Marriage Status in Story
Out of a total of 448 households in Story, 311 (69.4%) are family households, while 137 (30.6%) are nonfamily households. The most numerous type of family households are 2-person households, comprising 233, and the most common type of nonfamily households are 1-person households, comprising 115.
| Household Size | Family Households | Nonfamily Households |
| 1-Person Households | - | 115 (25.7%) |
| 2-Person Households | 233 (52.0%) | 22 (4.9%) |
| 3-Person Households | 27 (6.0%) | 0 (0.0%) |
| 4-Person Households | 47 (10.5%) | 0 (0.0%) |
| 5-Person Households | 4 (0.9%) | 0 (0.0%) |
| 6-Person Households | 0 (0.0%) | 0 (0.0%) |
| 7+ Person Households | 0 (0.0%) | 0 (0.0%) |
| Total | 311 (69.4%) | 137 (30.6%) |
Female Fertility in Story
Fertility by Age in Story
| Age Bracket | Women with Births | Births / 1,000 Women |
| 15 to 19 years | 0 (0.0%) | 0.0 |
| 20 to 34 years | 0 (0.0%) | 0.0 |
| 35 to 50 years | 0 (0.0%) | 0.0 |
| Total | 0 (0.0%) | 0.0 |
Fertility by Age by Marriage Status in Story
| Age Bracket | Married | Unmarried |
| 15 to 19 years | 0 (0.0%) | 0 (0.0%) |
| 20 to 34 years | 0 (0.0%) | 0 (0.0%) |
| 35 to 50 years | 0 (0.0%) | 0 (0.0%) |
| Total | 0 (0.0%) | 0 (0.0%) |
Fertility by Education in Story
| Educational Attainment | Women with Births | Births / 1,000 Women |
| Less than High School | 0 (0.0%) | 0.0 |
| High School Diploma | 0 (0.0%) | 0.0 |
| College or Associate's Degree | 0 (0.0%) | 0.0 |
| Bachelor's Degree | 0 (0.0%) | 0.0 |
| Graduate Degree | 0 (0.0%) | 0.0 |
| Total | 0 (0.0%) | 0.0 |
Fertility by Education by Marriage Status in Story
| Educational Attainment | Married | Unmarried |
| Less than High School | 0 (0.0%) | 0 (0.0%) |
| High School Diploma | 0 (0.0%) | 0 (0.0%) |
| College or Associate's Degree | 0 (0.0%) | 0 (0.0%) |
| Bachelor's Degree | 0 (0.0%) | 0 (0.0%) |
| Graduate Degree | 0 (0.0%) | 0 (0.0%) |
| Total | 0 (0.0%) | 0 (0.0%) |
Employment Characteristics in Story
Employment by Class of Employer in Story
Among the 629 employed individuals in Story, private company employees (292 | 46.4%), self-employed (incorporated) (163 | 25.9%), and state government employees (84 | 13.4%) make up the most common classes of employment.
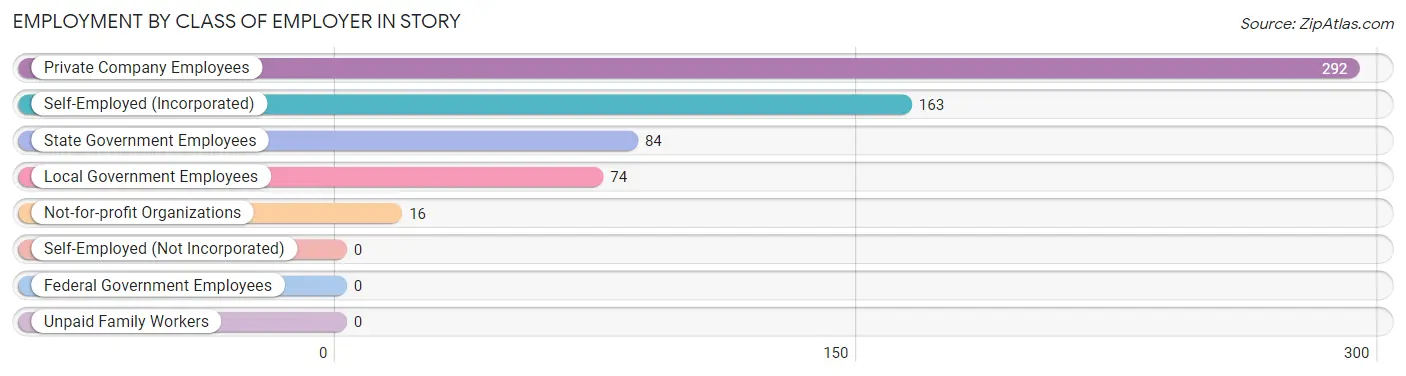
| Employer Class | # Employees | % Employees |
| Private Company Employees | 292 | 46.4% |
| Self-Employed (Incorporated) | 163 | 25.9% |
| Self-Employed (Not Incorporated) | 0 | 0.0% |
| Not-for-profit Organizations | 16 | 2.5% |
| Local Government Employees | 74 | 11.8% |
| State Government Employees | 84 | 13.4% |
| Federal Government Employees | 0 | 0.0% |
| Unpaid Family Workers | 0 | 0.0% |
| Total | 629 | 100.0% |
Employment Status by Age in Story
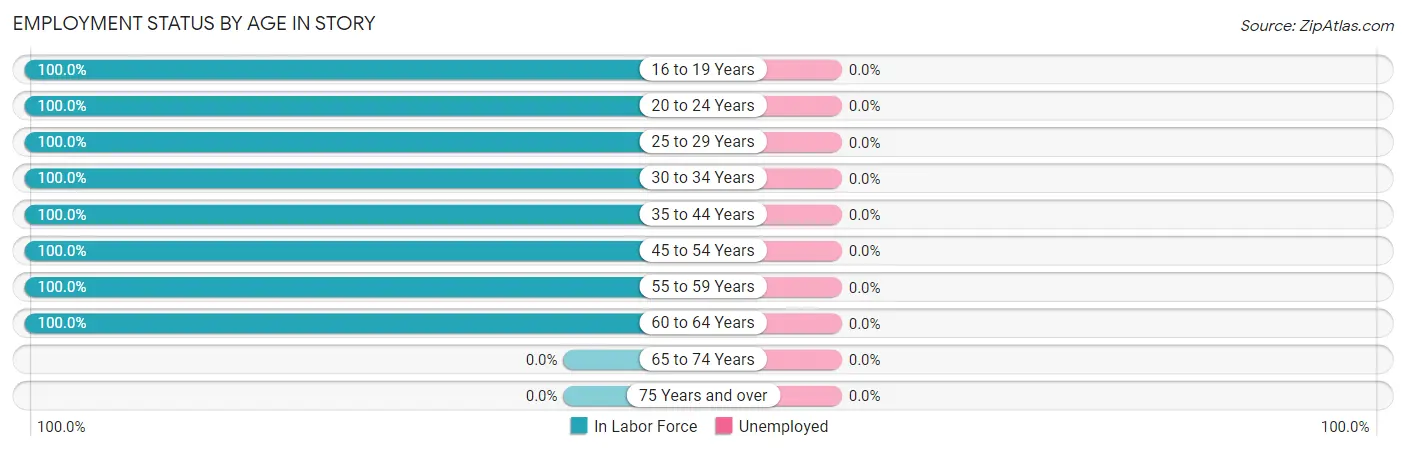
| Age Bracket | In Labor Force | Unemployed |
| 16 to 19 Years | 43 (100.0%) | 0 (0.0%) |
| 20 to 24 Years | 27 (100.0%) | 0 (0.0%) |
| 25 to 29 Years | 42 (100.0%) | 0 (0.0%) |
| 30 to 34 Years | 73 (100.0%) | 0 (0.0%) |
| 35 to 44 Years | 128 (100.0%) | 0 (0.0%) |
| 45 to 54 Years | 55 (100.0%) | 0 (0.0%) |
| 55 to 59 Years | 148 (100.0%) | 0 (0.0%) |
| 60 to 64 Years | 113 (100.0%) | 0 (0.0%) |
| 65 to 74 Years | 0 (0.0%) | 0 (0.0%) |
| 75 Years and over | 0 (0.0%) | 0 (0.0%) |
| Total | 629 (74.3%) | 0 (0.0%) |
Employment Status by Educational Attainment in Story
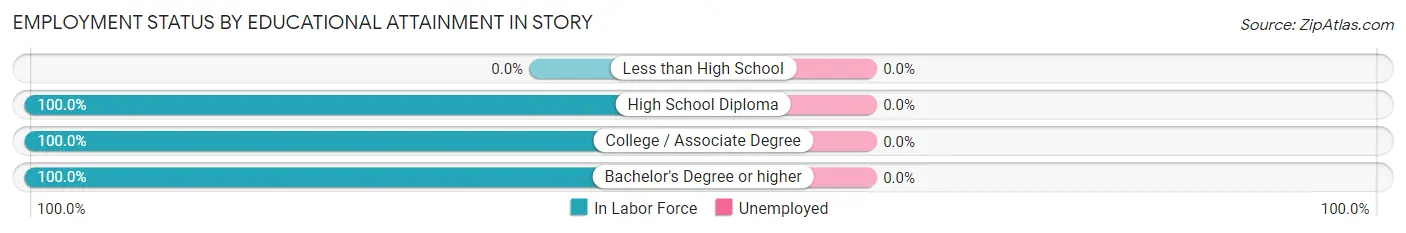
| Educational Attainment | In Labor Force | Unemployed |
| Less than High School | 0 (0.0%) | 0 (0.0%) |
| High School Diploma | 154 (100.0%) | 0 (0.0%) |
| College / Associate Degree | 295 (100.0%) | 0 (0.0%) |
| Bachelor's Degree or higher | 110 (100.0%) | 0 (0.0%) |
| Total | 559 (100.0%) | 0 (0.0%) |
Employment Occupations by Sex in Story
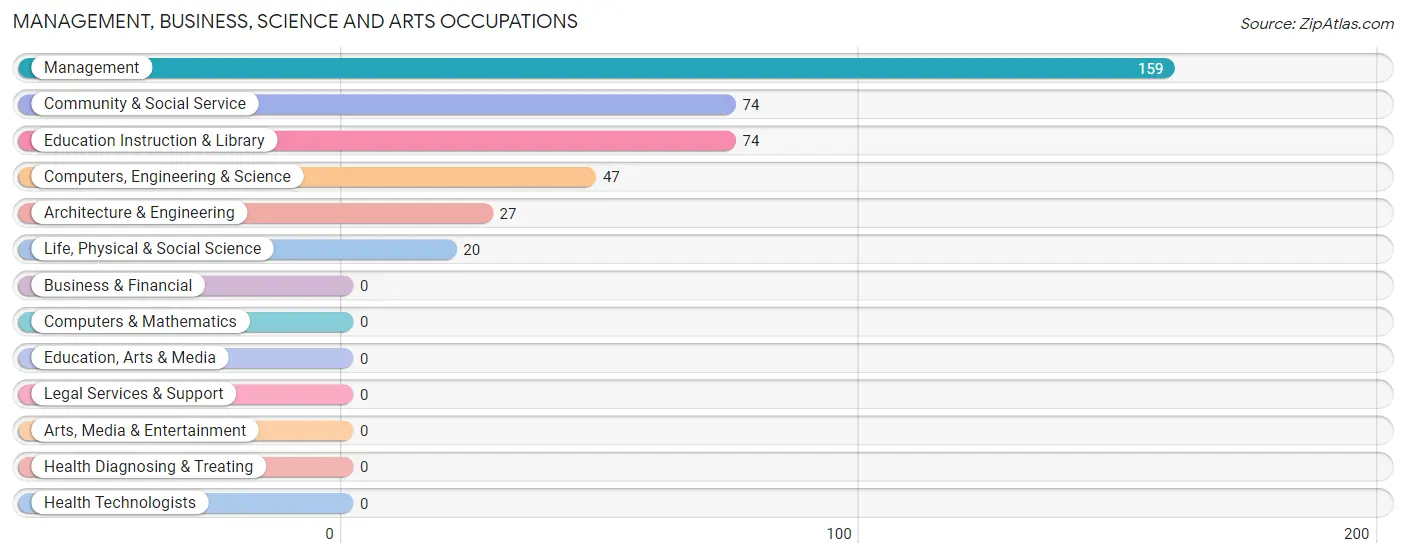
Management, Business, Science and Arts Occupations
The most common Management, Business, Science and Arts occupations in Story are Management (159 | 25.3%), Community & Social Service (74 | 11.8%), Education Instruction & Library (74 | 11.8%), Computers, Engineering & Science (47 | 7.5%), and Architecture & Engineering (27 | 4.3%).
Management, Business, Science and Arts Occupations by Sex
Within the Management, Business, Science and Arts occupations in Story, the most male-oriented occupations are Architecture & Engineering (100.0%), Computers, Engineering & Science (93.6%), and Community & Social Service (90.5%), while the most female-oriented occupations are Management (34.0%), Life, Physical & Social Science (15.0%), and Community & Social Service (9.5%).
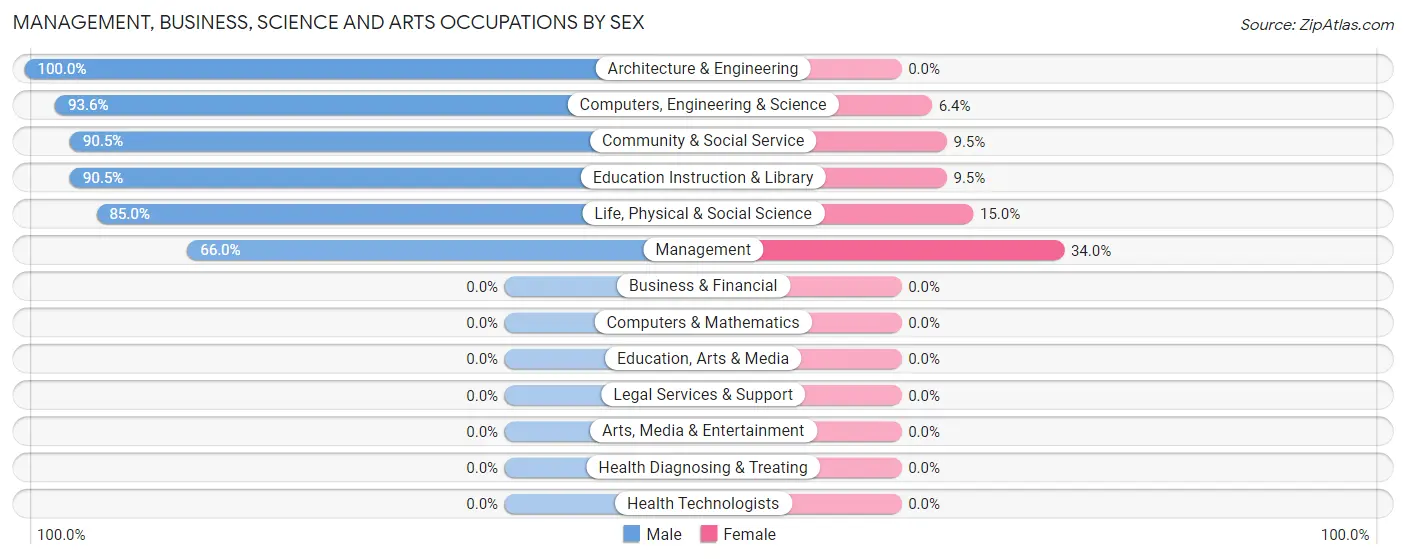
| Occupation | Male | Female |
| Management | 105 (66.0%) | 54 (34.0%) |
| Business & Financial | 0 (0.0%) | 0 (0.0%) |
| Computers, Engineering & Science | 44 (93.6%) | 3 (6.4%) |
| Computers & Mathematics | 0 (0.0%) | 0 (0.0%) |
| Architecture & Engineering | 27 (100.0%) | 0 (0.0%) |
| Life, Physical & Social Science | 17 (85.0%) | 3 (15.0%) |
| Community & Social Service | 67 (90.5%) | 7 (9.5%) |
| Education, Arts & Media | 0 (0.0%) | 0 (0.0%) |
| Legal Services & Support | 0 (0.0%) | 0 (0.0%) |
| Education Instruction & Library | 67 (90.5%) | 7 (9.5%) |
| Arts, Media & Entertainment | 0 (0.0%) | 0 (0.0%) |
| Health Diagnosing & Treating | 0 (0.0%) | 0 (0.0%) |
| Health Technologists | 0 (0.0%) | 0 (0.0%) |
| Total (Category) | 216 (77.1%) | 64 (22.9%) |
| Total (Overall) | 343 (54.5%) | 286 (45.5%) |
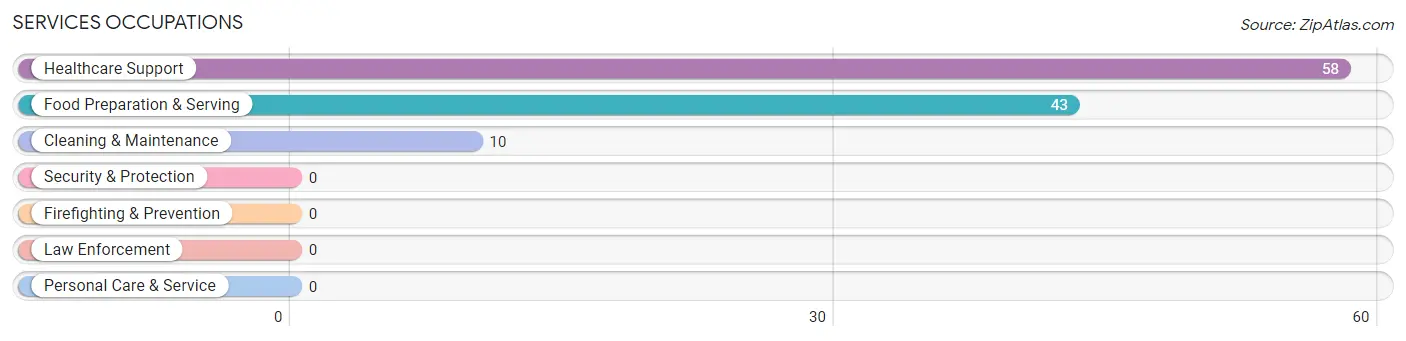
Services Occupations
The most common Services occupations in Story are Healthcare Support (58 | 9.2%), Food Preparation & Serving (43 | 6.8%), and Cleaning & Maintenance (10 | 1.6%).
Services Occupations by Sex
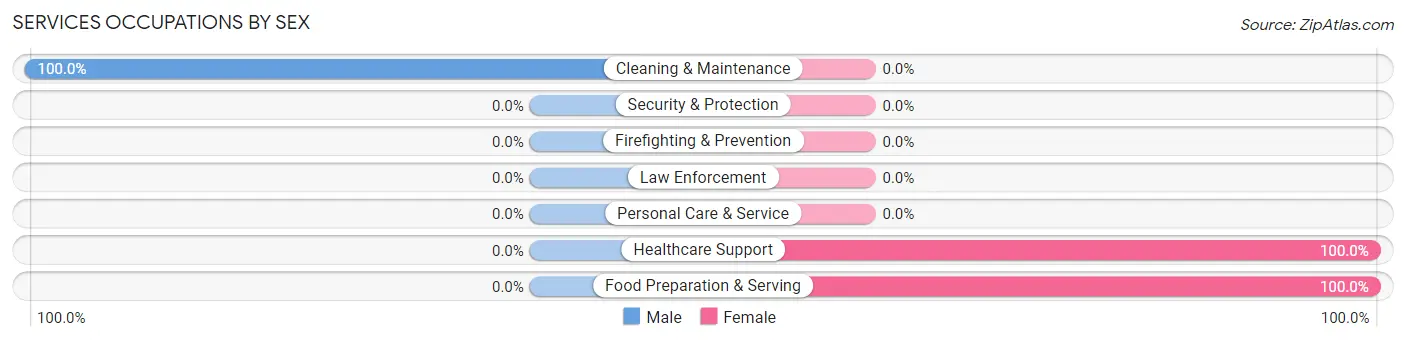
| Occupation | Male | Female |
| Healthcare Support | 0 (0.0%) | 58 (100.0%) |
| Security & Protection | 0 (0.0%) | 0 (0.0%) |
| Firefighting & Prevention | 0 (0.0%) | 0 (0.0%) |
| Law Enforcement | 0 (0.0%) | 0 (0.0%) |
| Food Preparation & Serving | 0 (0.0%) | 43 (100.0%) |
| Cleaning & Maintenance | 10 (100.0%) | 0 (0.0%) |
| Personal Care & Service | 0 (0.0%) | 0 (0.0%) |
| Total (Category) | 10 (9.0%) | 101 (91.0%) |
| Total (Overall) | 343 (54.5%) | 286 (45.5%) |
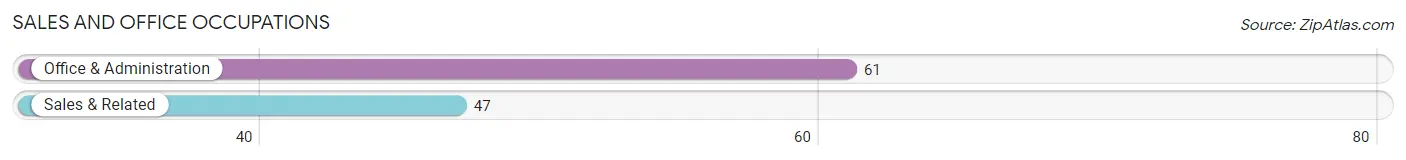
Sales and Office Occupations
The most common Sales and Office occupations in Story are Office & Administration (61 | 9.7%), and Sales & Related (47 | 7.5%).
Sales and Office Occupations by Sex
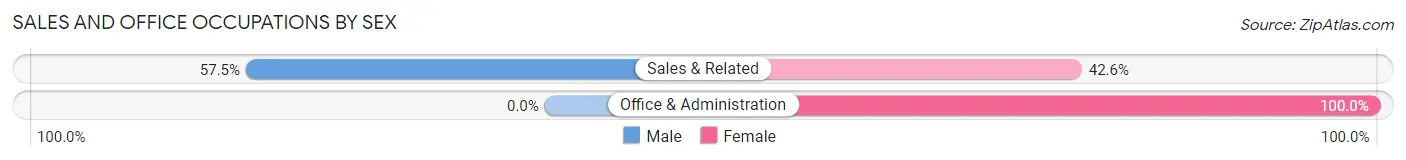
| Occupation | Male | Female |
| Sales & Related | 27 (57.5%) | 20 (42.5%) |
| Office & Administration | 0 (0.0%) | 61 (100.0%) |
| Total (Category) | 27 (25.0%) | 81 (75.0%) |
| Total (Overall) | 343 (54.5%) | 286 (45.5%) |
Natural Resources, Construction and Maintenance Occupations
The most common Natural Resources, Construction and Maintenance occupations in Story are , and Construction & Extraction (130 | 20.7%).
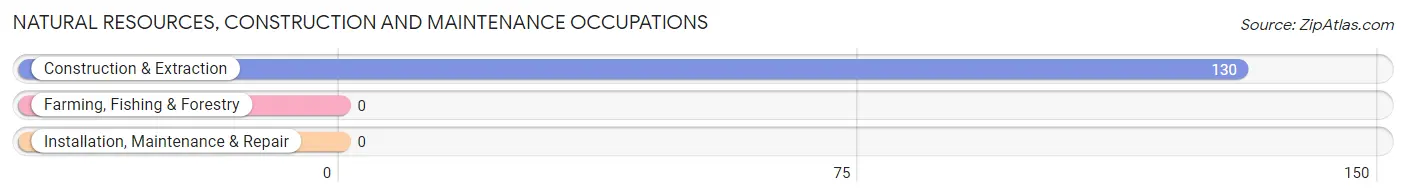
Natural Resources, Construction and Maintenance Occupations by Sex
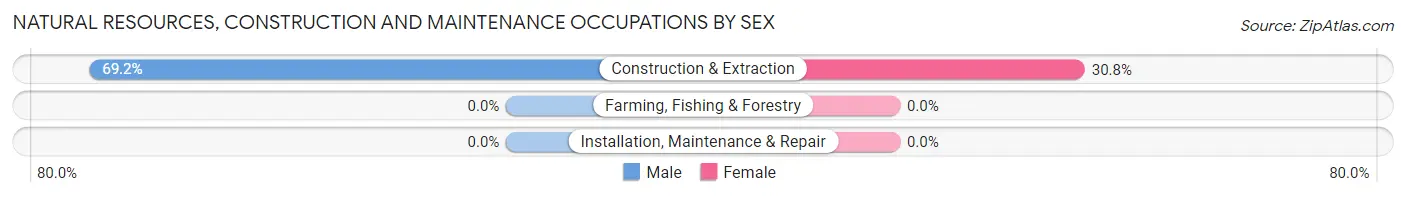
| Occupation | Male | Female |
| Farming, Fishing & Forestry | 0 (0.0%) | 0 (0.0%) |
| Construction & Extraction | 90 (69.2%) | 40 (30.8%) |
| Installation, Maintenance & Repair | 0 (0.0%) | 0 (0.0%) |
| Total (Category) | 90 (69.2%) | 40 (30.8%) |
| Total (Overall) | 343 (54.5%) | 286 (45.5%) |
Production, Transportation and Moving Occupations
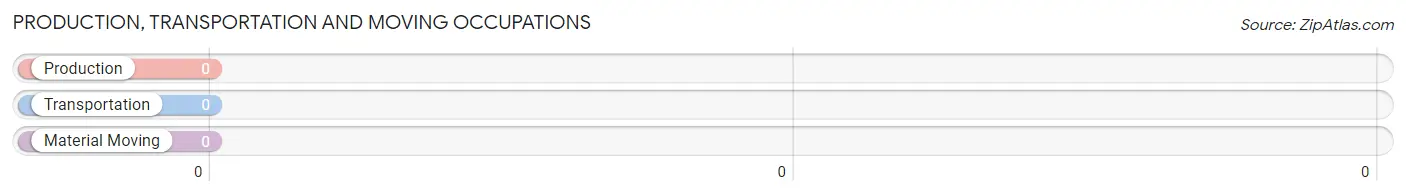
Production, Transportation and Moving Occupations by Sex
| Occupation | Male | Female |
| Production | 0 (0.0%) | 0 (0.0%) |
| Transportation | 0 (0.0%) | 0 (0.0%) |
| Material Moving | 0 (0.0%) | 0 (0.0%) |
| Total (Category) | 0 (0.0%) | 0 (0.0%) |
| Total (Overall) | 343 (54.5%) | 286 (45.5%) |
Employment Industries by Sex in Story
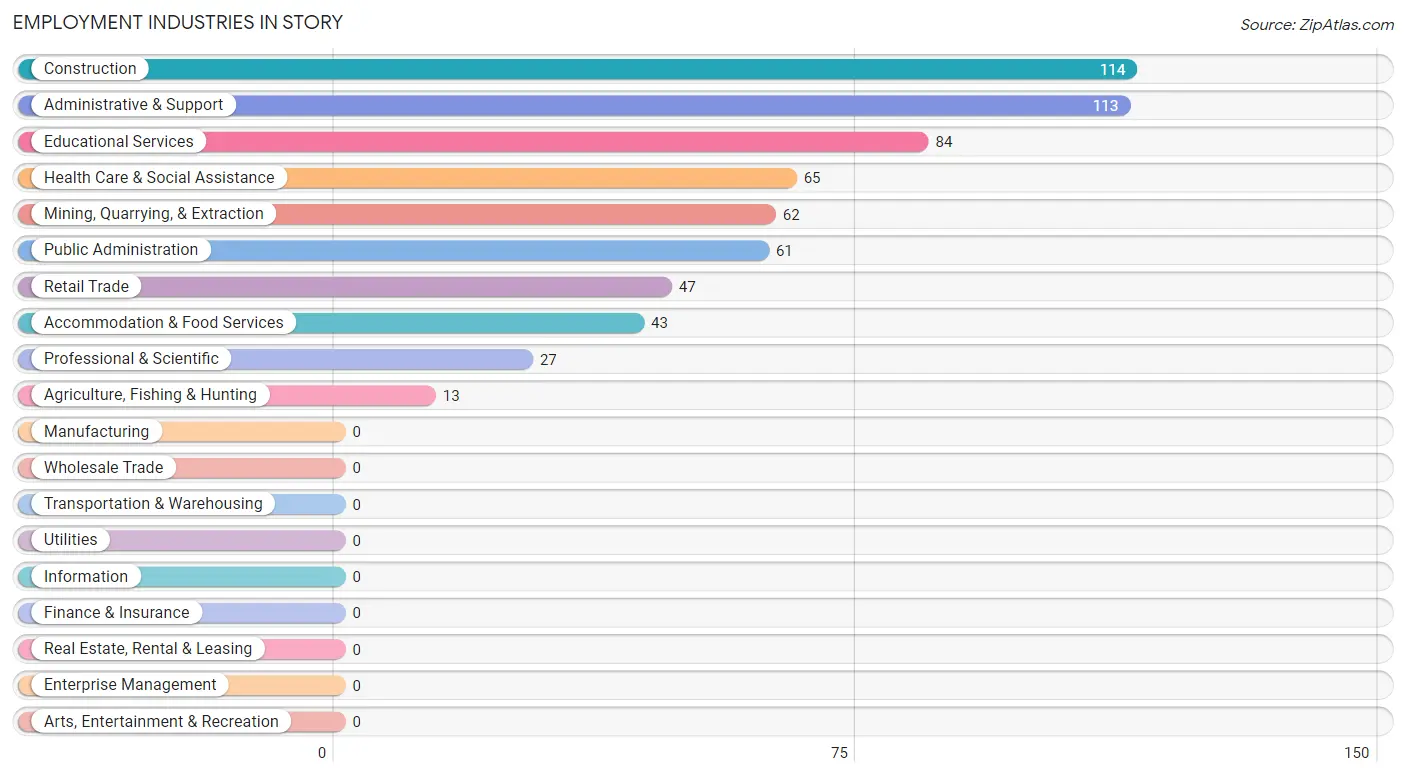
Employment Industries in Story
The major employment industries in Story include Construction (114 | 18.1%), Administrative & Support (113 | 18.0%), Educational Services (84 | 13.4%), Health Care & Social Assistance (65 | 10.3%), and Mining, Quarrying, & Extraction (62 | 9.9%).
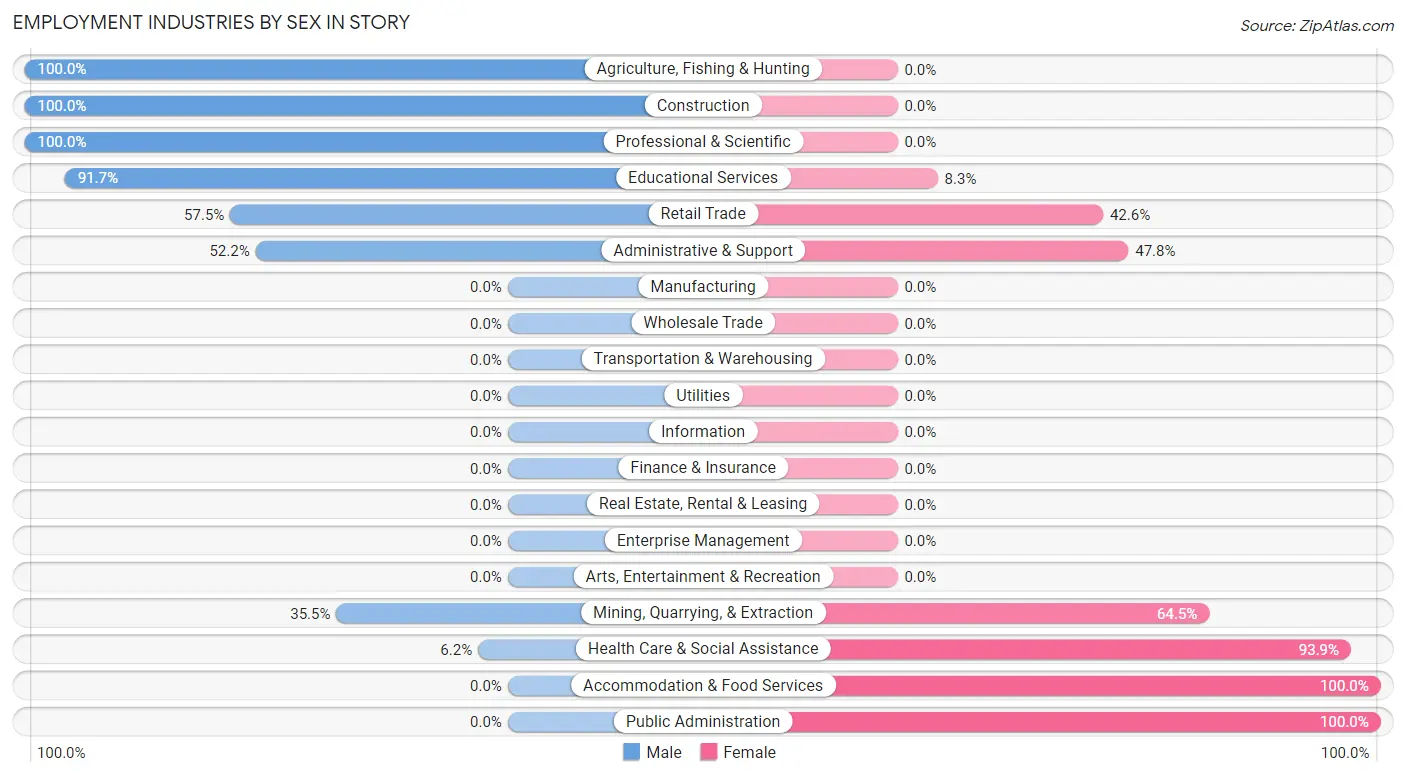
Employment Industries by Sex in Story
The Story industries that see more men than women are Agriculture, Fishing & Hunting (100.0%), Construction (100.0%), and Professional & Scientific (100.0%), whereas the industries that tend to have a higher number of women are Accommodation & Food Services (100.0%), Public Administration (100.0%), and Health Care & Social Assistance (93.9%).
| Industry | Male | Female |
| Agriculture, Fishing & Hunting | 13 (100.0%) | 0 (0.0%) |
| Mining, Quarrying, & Extraction | 22 (35.5%) | 40 (64.5%) |
| Construction | 114 (100.0%) | 0 (0.0%) |
| Manufacturing | 0 (0.0%) | 0 (0.0%) |
| Wholesale Trade | 0 (0.0%) | 0 (0.0%) |
| Retail Trade | 27 (57.5%) | 20 (42.5%) |
| Transportation & Warehousing | 0 (0.0%) | 0 (0.0%) |
| Utilities | 0 (0.0%) | 0 (0.0%) |
| Information | 0 (0.0%) | 0 (0.0%) |
| Finance & Insurance | 0 (0.0%) | 0 (0.0%) |
| Real Estate, Rental & Leasing | 0 (0.0%) | 0 (0.0%) |
| Professional & Scientific | 27 (100.0%) | 0 (0.0%) |
| Enterprise Management | 0 (0.0%) | 0 (0.0%) |
| Administrative & Support | 59 (52.2%) | 54 (47.8%) |
| Educational Services | 77 (91.7%) | 7 (8.3%) |
| Health Care & Social Assistance | 4 (6.1%) | 61 (93.9%) |
| Arts, Entertainment & Recreation | 0 (0.0%) | 0 (0.0%) |
| Accommodation & Food Services | 0 (0.0%) | 43 (100.0%) |
| Public Administration | 0 (0.0%) | 61 (100.0%) |
| Total | 343 (54.5%) | 286 (45.5%) |
Education in Story
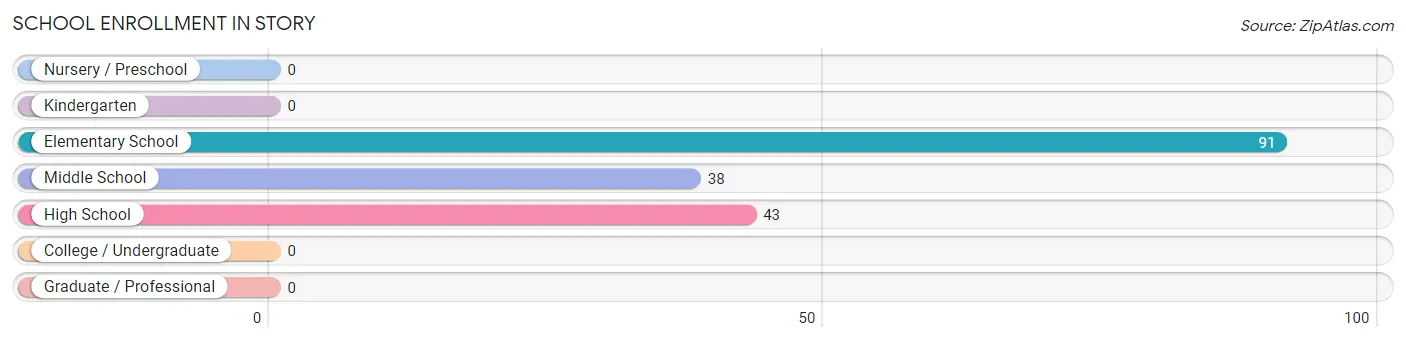
School Enrollment in Story
The most common levels of schooling among the 172 students in Story are elementary school (91 | 52.9%), high school (43 | 25.0%), and middle school (38 | 22.1%).
| School Level | # Students | % Students |
| Nursery / Preschool | 0 | 0.0% |
| Kindergarten | 0 | 0.0% |
| Elementary School | 91 | 52.9% |
| Middle School | 38 | 22.1% |
| High School | 43 | 25.0% |
| College / Undergraduate | 0 | 0.0% |
| Graduate / Professional | 0 | 0.0% |
| Total | 172 | 100.0% |
School Enrollment by Age by Funding Source in Story
Out of a total of 172 students who are enrolled in schools in Story, 7 (4.1%) attend a private institution, while the remaining 165 (95.9%) are enrolled in public schools. The age group of 10 to 14 year olds has the highest likelihood of being enrolled in private schools, with 7 (6.4% in the age bracket) enrolled. Conversely, the age group of 5 to 9 year old has the lowest likelihood of being enrolled in a private school, with 19 (100.0% in the age bracket) attending a public institution.
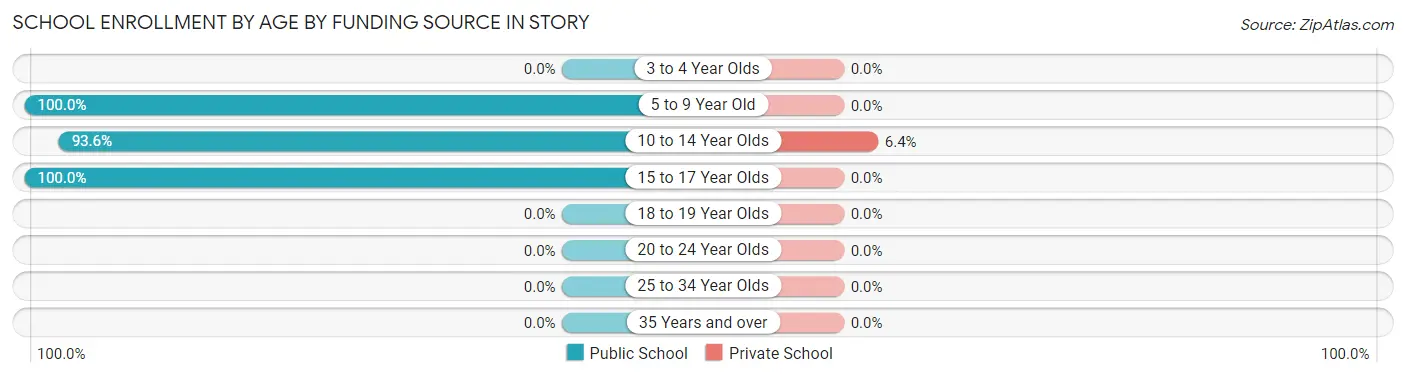
| Age Bracket | Public School | Private School |
| 3 to 4 Year Olds | 0 (0.0%) | 0 (0.0%) |
| 5 to 9 Year Old | 19 (100.0%) | 0 (0.0%) |
| 10 to 14 Year Olds | 103 (93.6%) | 7 (6.4%) |
| 15 to 17 Year Olds | 43 (100.0%) | 0 (0.0%) |
| 18 to 19 Year Olds | 0 (0.0%) | 0 (0.0%) |
| 20 to 24 Year Olds | 0 (0.0%) | 0 (0.0%) |
| 25 to 34 Year Olds | 0 (0.0%) | 0 (0.0%) |
| 35 Years and over | 0 (0.0%) | 0 (0.0%) |
| Total | 165 (95.9%) | 7 (4.1%) |
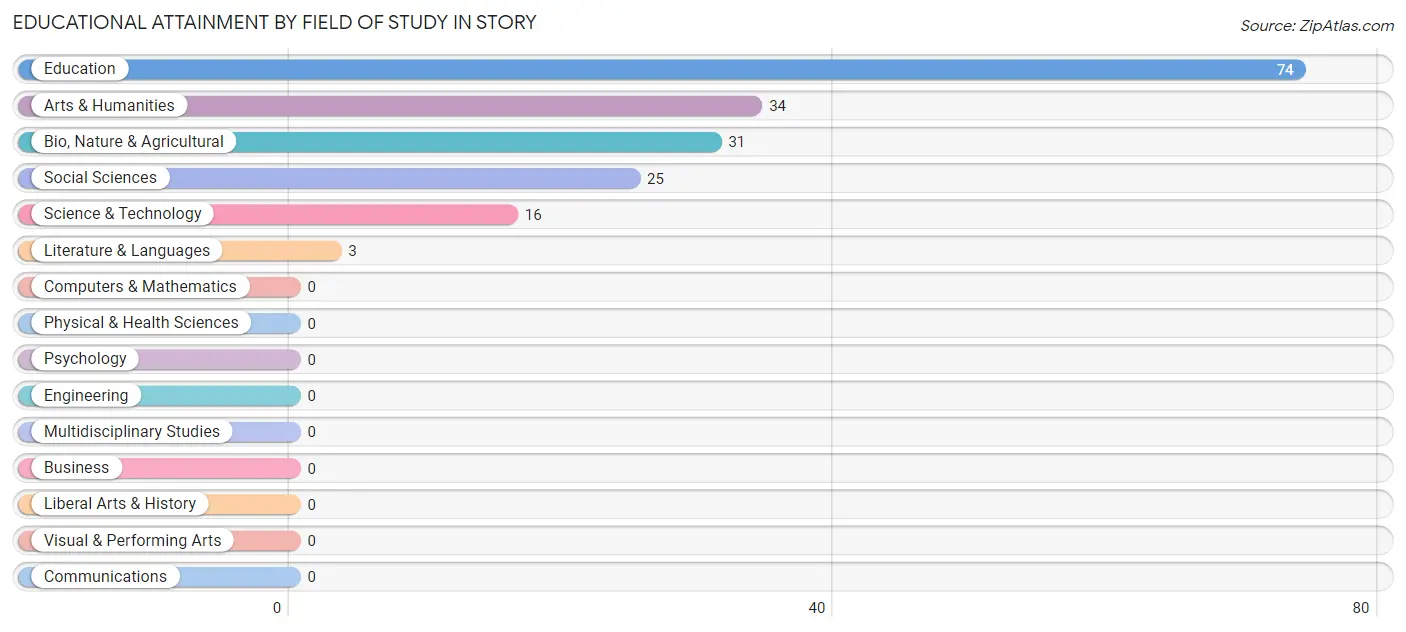
Educational Attainment by Field of Study in Story
Education (74 | 40.4%), arts & humanities (34 | 18.6%), bio, nature & agricultural (31 | 16.9%), social sciences (25 | 13.7%), and science & technology (16 | 8.7%) are the most common fields of study among 183 individuals in Story who have obtained a bachelor's degree or higher.
| Field of Study | # Graduates | % Graduates |
| Computers & Mathematics | 0 | 0.0% |
| Bio, Nature & Agricultural | 31 | 16.9% |
| Physical & Health Sciences | 0 | 0.0% |
| Psychology | 0 | 0.0% |
| Social Sciences | 25 | 13.7% |
| Engineering | 0 | 0.0% |
| Multidisciplinary Studies | 0 | 0.0% |
| Science & Technology | 16 | 8.7% |
| Business | 0 | 0.0% |
| Education | 74 | 40.4% |
| Literature & Languages | 3 | 1.6% |
| Liberal Arts & History | 0 | 0.0% |
| Visual & Performing Arts | 0 | 0.0% |
| Communications | 0 | 0.0% |
| Arts & Humanities | 34 | 18.6% |
| Total | 183 | 100.0% |
Transportation & Commute in Story
Vehicle Availability by Sex in Story
The most prevalent vehicle ownership categories in Story are males with 2 vehicles (121, accounting for 35.3%) and females with 2 vehicles (119, making up 42.3%).
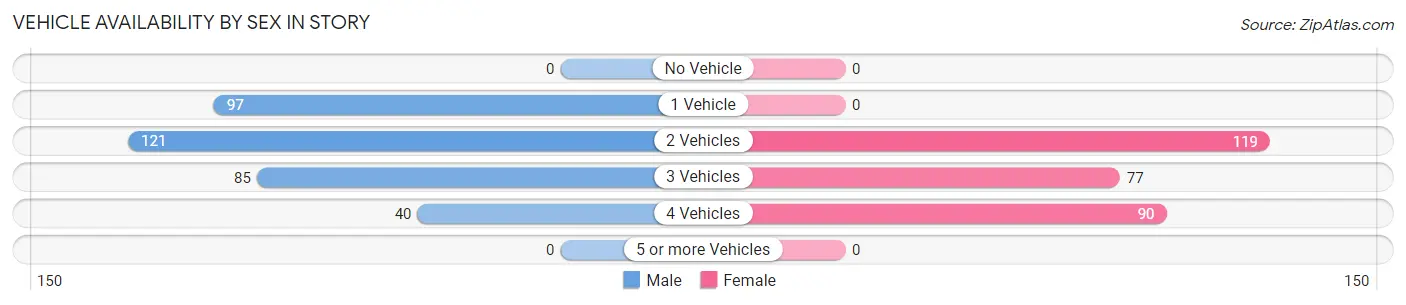
| Vehicles Available | Male | Female |
| No Vehicle | 0 (0.0%) | 0 (0.0%) |
| 1 Vehicle | 97 (28.3%) | 0 (0.0%) |
| 2 Vehicles | 121 (35.3%) | 119 (41.6%) |
| 3 Vehicles | 85 (24.8%) | 77 (26.9%) |
| 4 Vehicles | 40 (11.7%) | 90 (31.5%) |
| 5 or more Vehicles | 0 (0.0%) | 0 (0.0%) |
| Total | 343 (100.0%) | 286 (100.0%) |
Commute Time in Story
The most frequently occuring commute durations in Story are 5 to 9 minutes (133 commuters, 21.1%), 30 to 34 minutes (127 commuters, 20.2%), and less than 5 minutes (113 commuters, 18.0%).
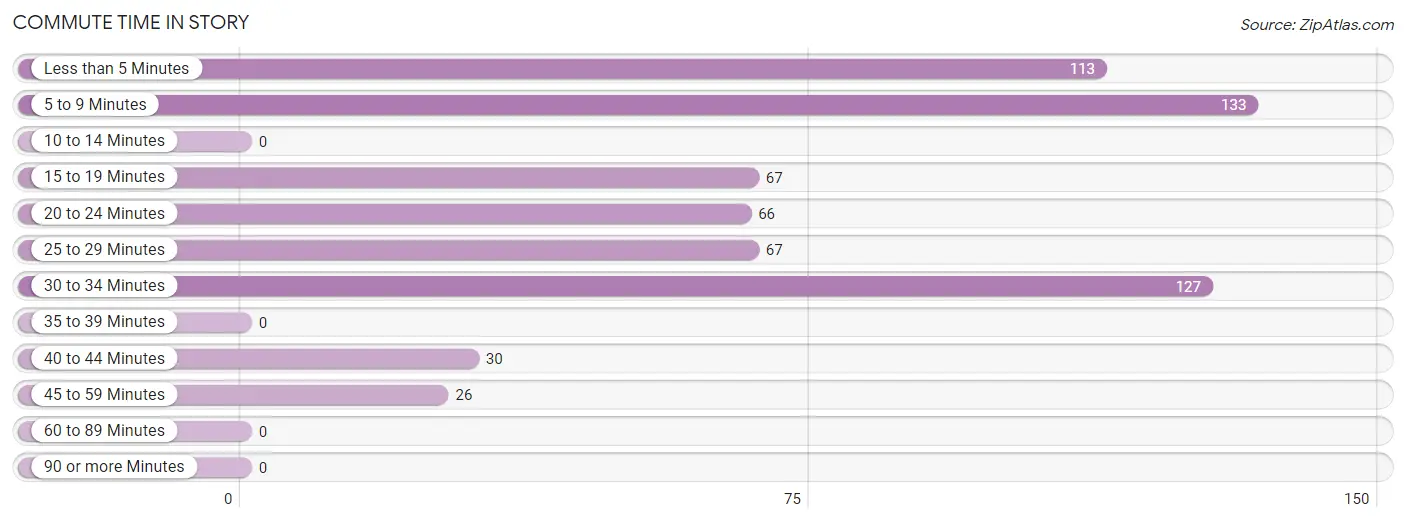
| Commute Time | # Commuters | % Commuters |
| Less than 5 Minutes | 113 | 18.0% |
| 5 to 9 Minutes | 133 | 21.1% |
| 10 to 14 Minutes | 0 | 0.0% |
| 15 to 19 Minutes | 67 | 10.6% |
| 20 to 24 Minutes | 66 | 10.5% |
| 25 to 29 Minutes | 67 | 10.6% |
| 30 to 34 Minutes | 127 | 20.2% |
| 35 to 39 Minutes | 0 | 0.0% |
| 40 to 44 Minutes | 30 | 4.8% |
| 45 to 59 Minutes | 26 | 4.1% |
| 60 to 89 Minutes | 0 | 0.0% |
| 90 or more Minutes | 0 | 0.0% |
Commute Time by Sex in Story
The most common commute times in Story are 15 to 19 minutes (67 commuters, 19.5%) for males and 5 to 9 minutes (120 commuters, 42.0%) for females.
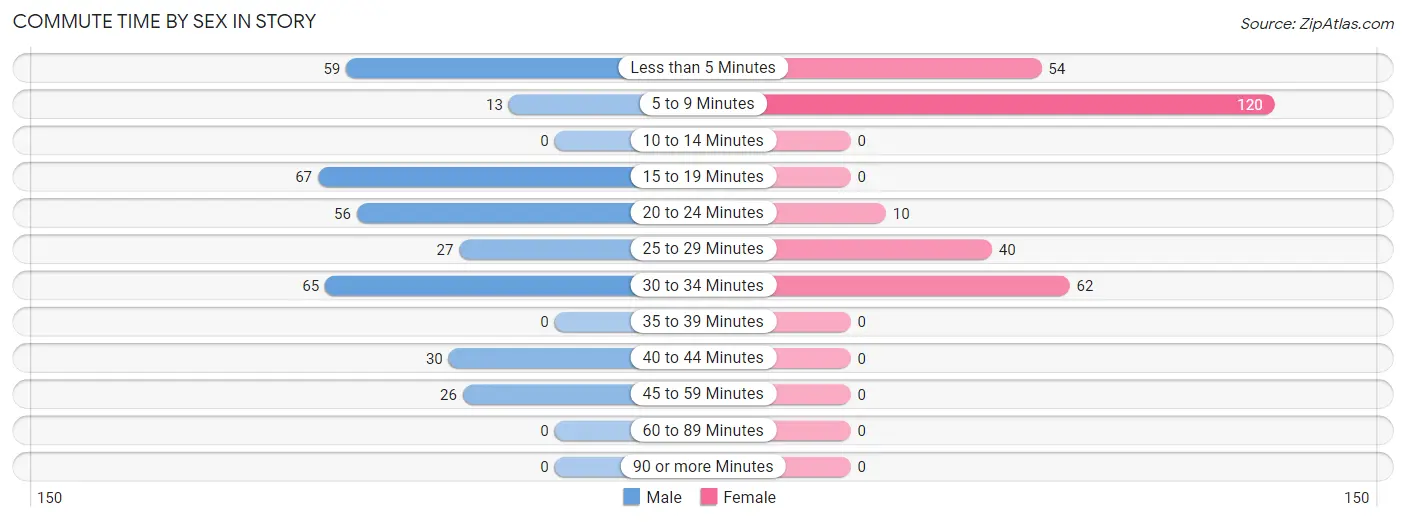
| Commute Time | Male | Female |
| Less than 5 Minutes | 59 (17.2%) | 54 (18.9%) |
| 5 to 9 Minutes | 13 (3.8%) | 120 (42.0%) |
| 10 to 14 Minutes | 0 (0.0%) | 0 (0.0%) |
| 15 to 19 Minutes | 67 (19.5%) | 0 (0.0%) |
| 20 to 24 Minutes | 56 (16.3%) | 10 (3.5%) |
| 25 to 29 Minutes | 27 (7.9%) | 40 (14.0%) |
| 30 to 34 Minutes | 65 (19.0%) | 62 (21.7%) |
| 35 to 39 Minutes | 0 (0.0%) | 0 (0.0%) |
| 40 to 44 Minutes | 30 (8.7%) | 0 (0.0%) |
| 45 to 59 Minutes | 26 (7.6%) | 0 (0.0%) |
| 60 to 89 Minutes | 0 (0.0%) | 0 (0.0%) |
| 90 or more Minutes | 0 (0.0%) | 0 (0.0%) |
Time of Departure to Work by Sex in Story
The most frequent times of departure to work in Story are 7:00 AM to 7:29 AM (126, 36.7%) for males and 6:00 AM to 6:29 AM (83, 29.0%) for females.
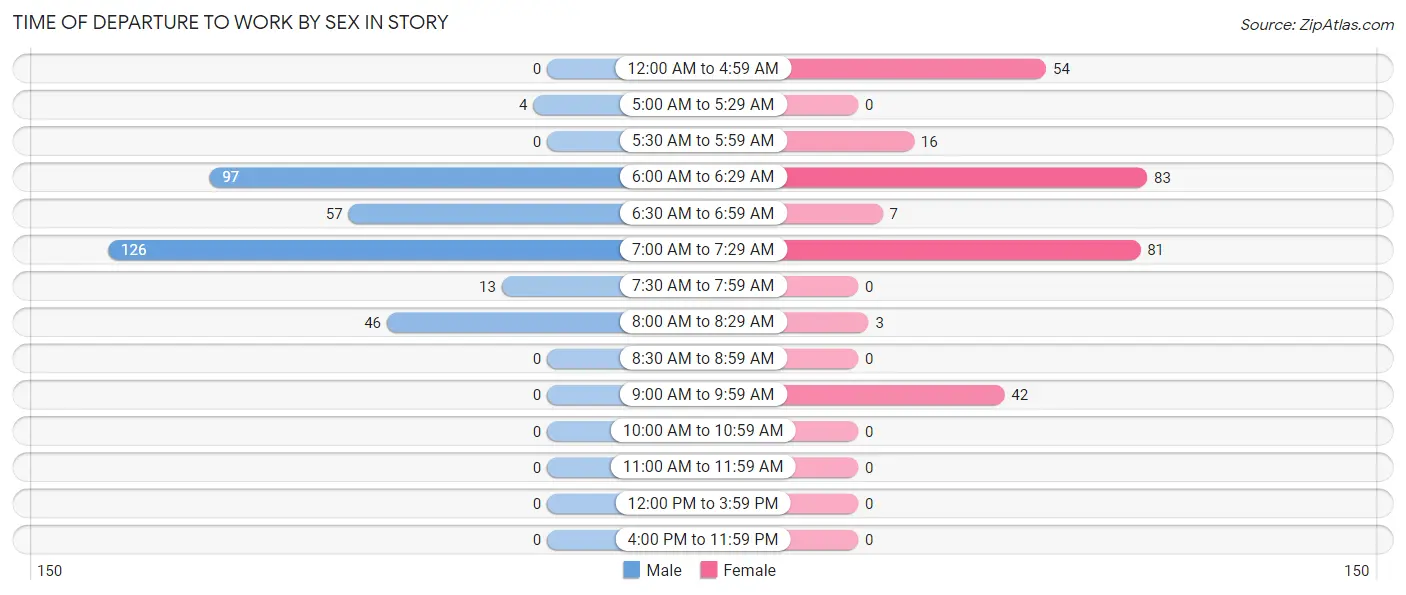
| Time of Departure | Male | Female |
| 12:00 AM to 4:59 AM | 0 (0.0%) | 54 (18.9%) |
| 5:00 AM to 5:29 AM | 4 (1.2%) | 0 (0.0%) |
| 5:30 AM to 5:59 AM | 0 (0.0%) | 16 (5.6%) |
| 6:00 AM to 6:29 AM | 97 (28.3%) | 83 (29.0%) |
| 6:30 AM to 6:59 AM | 57 (16.6%) | 7 (2.5%) |
| 7:00 AM to 7:29 AM | 126 (36.7%) | 81 (28.3%) |
| 7:30 AM to 7:59 AM | 13 (3.8%) | 0 (0.0%) |
| 8:00 AM to 8:29 AM | 46 (13.4%) | 3 (1.1%) |
| 8:30 AM to 8:59 AM | 0 (0.0%) | 0 (0.0%) |
| 9:00 AM to 9:59 AM | 0 (0.0%) | 42 (14.7%) |
| 10:00 AM to 10:59 AM | 0 (0.0%) | 0 (0.0%) |
| 11:00 AM to 11:59 AM | 0 (0.0%) | 0 (0.0%) |
| 12:00 PM to 3:59 PM | 0 (0.0%) | 0 (0.0%) |
| 4:00 PM to 11:59 PM | 0 (0.0%) | 0 (0.0%) |
| Total | 343 (100.0%) | 286 (100.0%) |
Housing Occupancy in Story
Occupancy by Ownership in Story
Of the total 448 dwellings in Story, owner-occupied units account for 330 (73.7%), while renter-occupied units make up 118 (26.3%).
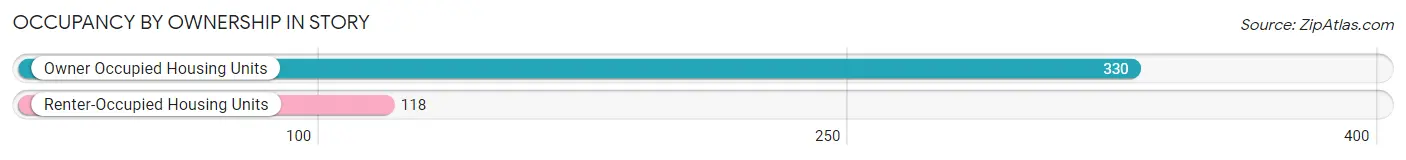
| Occupancy | # Housing Units | % Housing Units |
| Owner Occupied Housing Units | 330 | 73.7% |
| Renter-Occupied Housing Units | 118 | 26.3% |
| Total Occupied Housing Units | 448 | 100.0% |
Occupancy by Household Size in Story
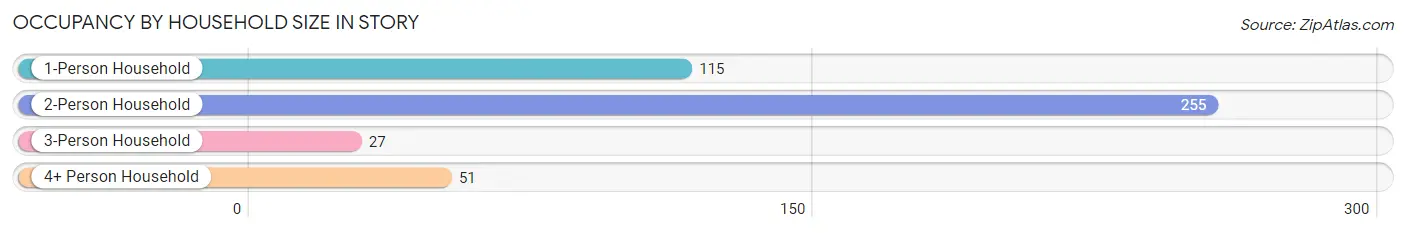
| Household Size | # Housing Units | % Housing Units |
| 1-Person Household | 115 | 25.7% |
| 2-Person Household | 255 | 56.9% |
| 3-Person Household | 27 | 6.0% |
| 4+ Person Household | 51 | 11.4% |
| Total Housing Units | 448 | 100.0% |
Occupancy by Ownership by Household Size in Story
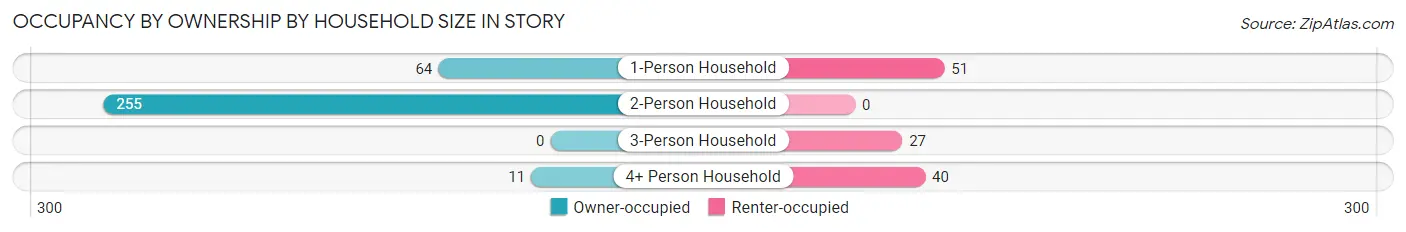
| Household Size | Owner-occupied | Renter-occupied |
| 1-Person Household | 64 (55.6%) | 51 (44.4%) |
| 2-Person Household | 255 (100.0%) | 0 (0.0%) |
| 3-Person Household | 0 (0.0%) | 27 (100.0%) |
| 4+ Person Household | 11 (21.6%) | 40 (78.4%) |
| Total Housing Units | 330 (73.7%) | 118 (26.3%) |
Occupancy by Educational Attainment in Story
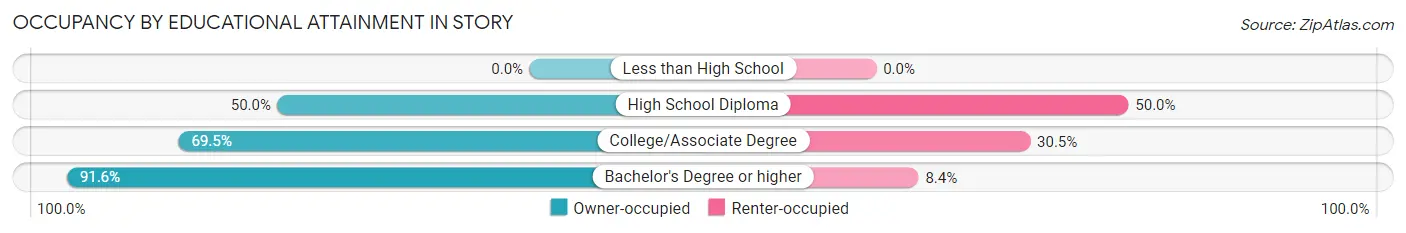
| Household Size | Owner-occupied | Renter-occupied |
| Less than High School | 0 (0.0%) | 0 (0.0%) |
| High School Diploma | 40 (50.0%) | 40 (50.0%) |
| College/Associate Degree | 148 (69.5%) | 65 (30.5%) |
| Bachelor's Degree or higher | 142 (91.6%) | 13 (8.4%) |
Occupancy by Age of Householder in Story
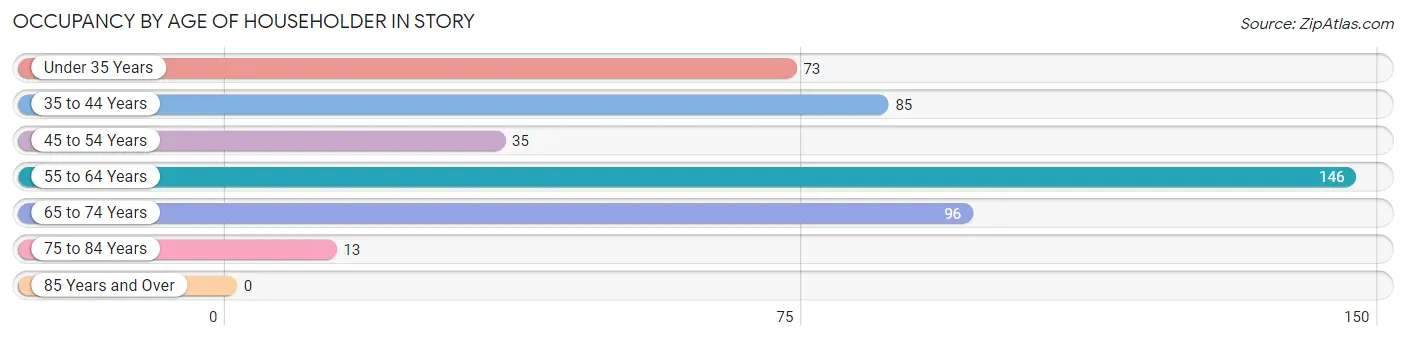
| Age Bracket | # Households | % Households |
| Under 35 Years | 73 | 16.3% |
| 35 to 44 Years | 85 | 19.0% |
| 45 to 54 Years | 35 | 7.8% |
| 55 to 64 Years | 146 | 32.6% |
| 65 to 74 Years | 96 | 21.4% |
| 75 to 84 Years | 13 | 2.9% |
| 85 Years and Over | 0 | 0.0% |
| Total | 448 | 100.0% |
Housing Finances in Story
Median Income by Occupancy in Story
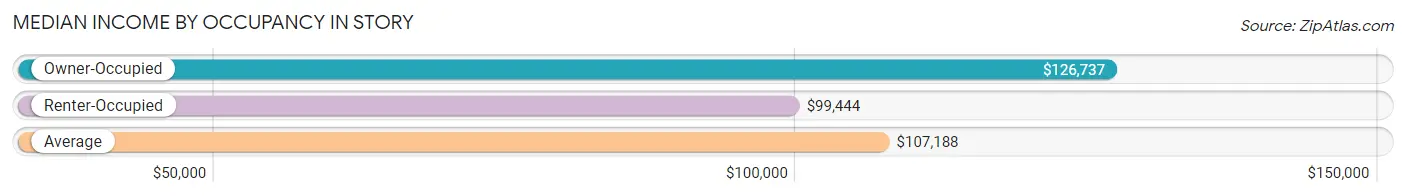
| Occupancy Type | # Households | Median Income |
| Owner-Occupied | 330 (73.7%) | $126,737 |
| Renter-Occupied | 118 (26.3%) | $99,444 |
| Average | 448 (100.0%) | $107,188 |
Occupancy by Householder Income Bracket in Story
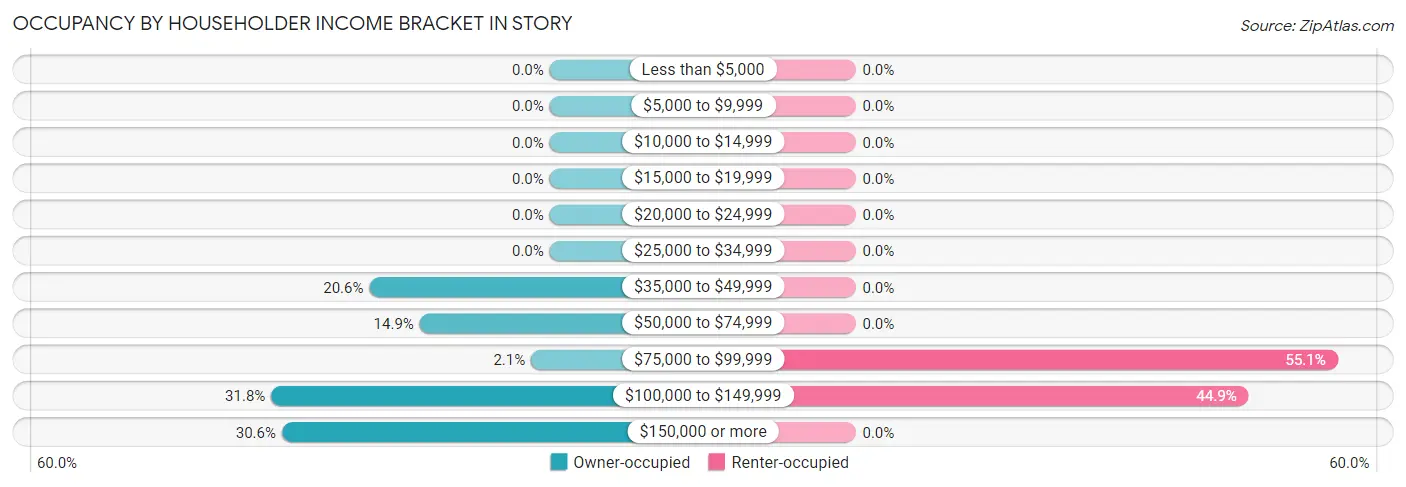
| Income Bracket | Owner-occupied | Renter-occupied |
| Less than $5,000 | 0 (0.0%) | 0 (0.0%) |
| $5,000 to $9,999 | 0 (0.0%) | 0 (0.0%) |
| $10,000 to $14,999 | 0 (0.0%) | 0 (0.0%) |
| $15,000 to $19,999 | 0 (0.0%) | 0 (0.0%) |
| $20,000 to $24,999 | 0 (0.0%) | 0 (0.0%) |
| $25,000 to $34,999 | 0 (0.0%) | 0 (0.0%) |
| $35,000 to $49,999 | 68 (20.6%) | 0 (0.0%) |
| $50,000 to $74,999 | 49 (14.8%) | 0 (0.0%) |
| $75,000 to $99,999 | 7 (2.1%) | 65 (55.1%) |
| $100,000 to $149,999 | 105 (31.8%) | 53 (44.9%) |
| $150,000 or more | 101 (30.6%) | 0 (0.0%) |
| Total | 330 (100.0%) | 118 (100.0%) |
Monthly Housing Cost Tiers in Story
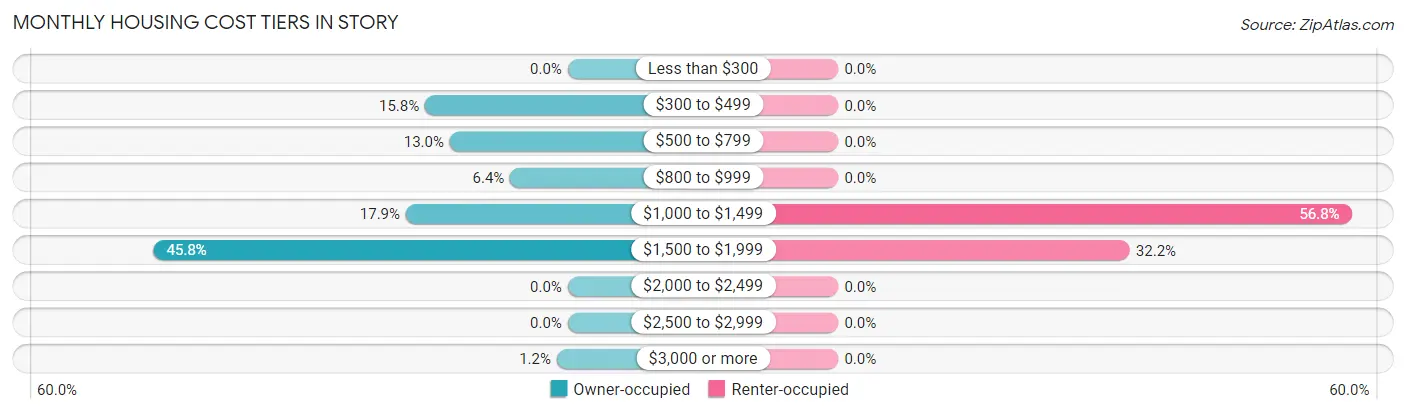
| Monthly Cost | Owner-occupied | Renter-occupied |
| Less than $300 | 0 (0.0%) | 0 (0.0%) |
| $300 to $499 | 52 (15.8%) | 0 (0.0%) |
| $500 to $799 | 43 (13.0%) | 0 (0.0%) |
| $800 to $999 | 21 (6.4%) | 0 (0.0%) |
| $1,000 to $1,499 | 59 (17.9%) | 67 (56.8%) |
| $1,500 to $1,999 | 151 (45.8%) | 38 (32.2%) |
| $2,000 to $2,499 | 0 (0.0%) | 0 (0.0%) |
| $2,500 to $2,999 | 0 (0.0%) | 0 (0.0%) |
| $3,000 or more | 4 (1.2%) | 0 (0.0%) |
| Total | 330 (100.0%) | 118 (100.0%) |
Physical Housing Characteristics in Story
Housing Structures in Story
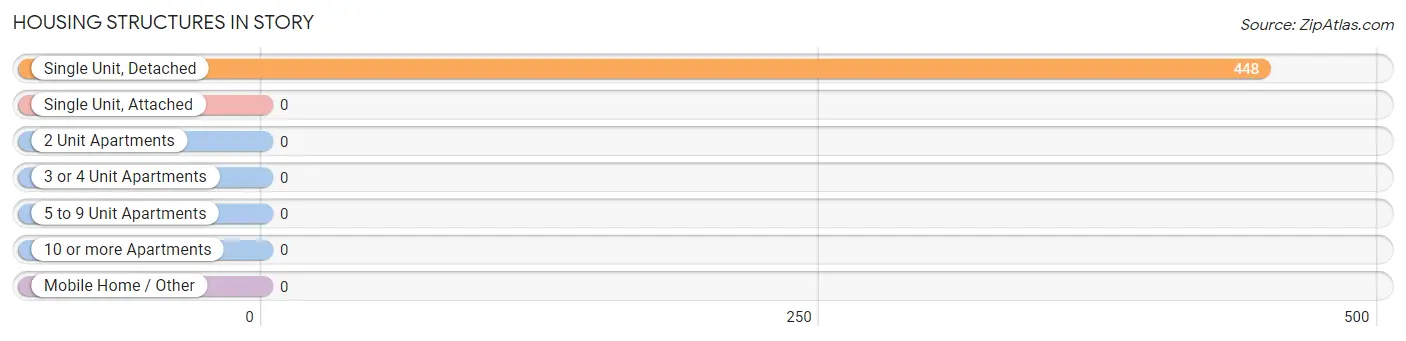
| Structure Type | # Housing Units | % Housing Units |
| Single Unit, Detached | 448 | 100.0% |
| Single Unit, Attached | 0 | 0.0% |
| 2 Unit Apartments | 0 | 0.0% |
| 3 or 4 Unit Apartments | 0 | 0.0% |
| 5 to 9 Unit Apartments | 0 | 0.0% |
| 10 or more Apartments | 0 | 0.0% |
| Mobile Home / Other | 0 | 0.0% |
| Total | 448 | 100.0% |
Housing Structures by Occupancy in Story
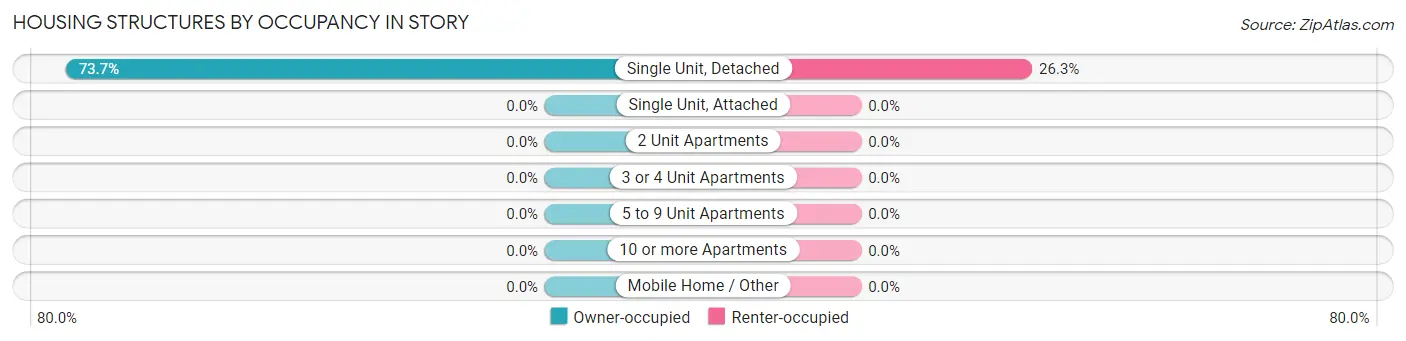
| Structure Type | Owner-occupied | Renter-occupied |
| Single Unit, Detached | 330 (73.7%) | 118 (26.3%) |
| Single Unit, Attached | 0 (0.0%) | 0 (0.0%) |
| 2 Unit Apartments | 0 (0.0%) | 0 (0.0%) |
| 3 or 4 Unit Apartments | 0 (0.0%) | 0 (0.0%) |
| 5 to 9 Unit Apartments | 0 (0.0%) | 0 (0.0%) |
| 10 or more Apartments | 0 (0.0%) | 0 (0.0%) |
| Mobile Home / Other | 0 (0.0%) | 0 (0.0%) |
| Total | 330 (73.7%) | 118 (26.3%) |
Housing Structures by Number of Rooms in Story
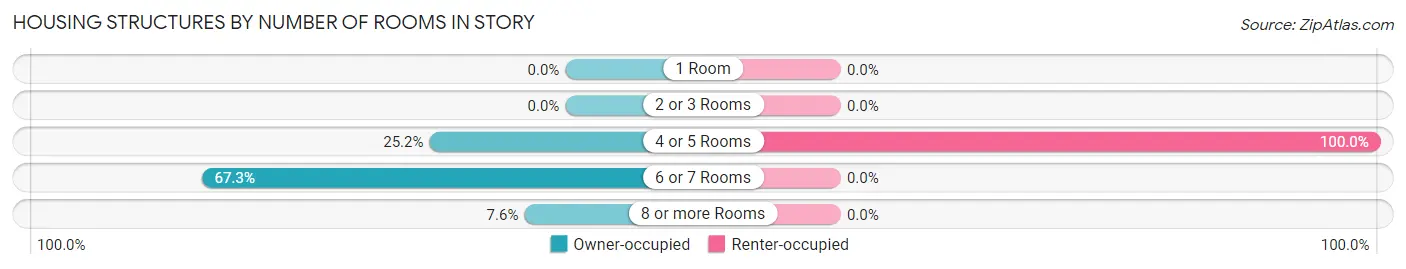
| Number of Rooms | Owner-occupied | Renter-occupied |
| 1 Room | 0 (0.0%) | 0 (0.0%) |
| 2 or 3 Rooms | 0 (0.0%) | 0 (0.0%) |
| 4 or 5 Rooms | 83 (25.2%) | 118 (100.0%) |
| 6 or 7 Rooms | 222 (67.3%) | 0 (0.0%) |
| 8 or more Rooms | 25 (7.6%) | 0 (0.0%) |
| Total | 330 (100.0%) | 118 (100.0%) |
Housing Structure by Heating Type in Story
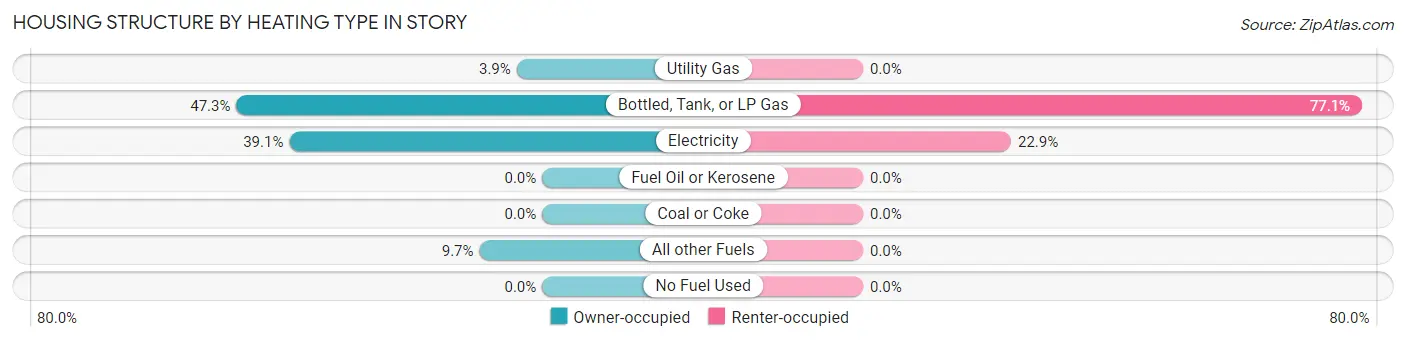
| Heating Type | Owner-occupied | Renter-occupied |
| Utility Gas | 13 (3.9%) | 0 (0.0%) |
| Bottled, Tank, or LP Gas | 156 (47.3%) | 91 (77.1%) |
| Electricity | 129 (39.1%) | 27 (22.9%) |
| Fuel Oil or Kerosene | 0 (0.0%) | 0 (0.0%) |
| Coal or Coke | 0 (0.0%) | 0 (0.0%) |
| All other Fuels | 32 (9.7%) | 0 (0.0%) |
| No Fuel Used | 0 (0.0%) | 0 (0.0%) |
| Total | 330 (100.0%) | 118 (100.0%) |
Household Vehicle Usage in Story
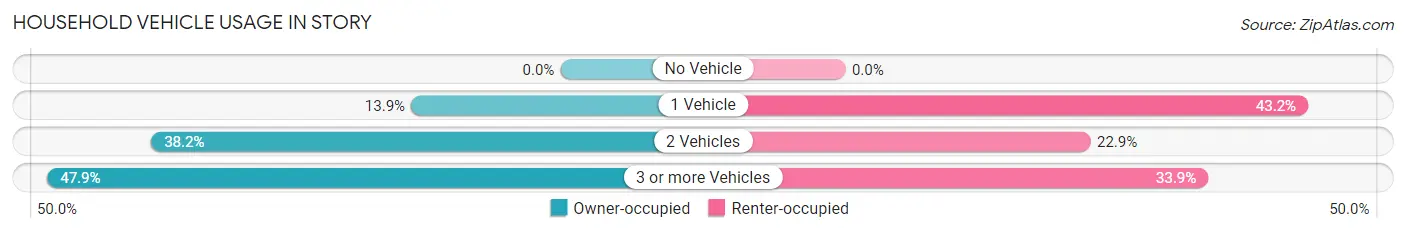
| Vehicles per Household | Owner-occupied | Renter-occupied |
| No Vehicle | 0 (0.0%) | 0 (0.0%) |
| 1 Vehicle | 46 (13.9%) | 51 (43.2%) |
| 2 Vehicles | 126 (38.2%) | 27 (22.9%) |
| 3 or more Vehicles | 158 (47.9%) | 40 (33.9%) |
| Total | 330 (100.0%) | 118 (100.0%) |
Real Estate & Mortgages in Story
Real Estate and Mortgage Overview in Story
| Characteristic | Without Mortgage | With Mortgage |
| Housing Units | 175 | 155 |
| Median Property Value | - | - |
| Median Household Income | - | - |
| Monthly Housing Costs | $683 | $4 |
| Real Estate Taxes | $2,583 | $0 |
Property Value by Mortgage Status in Story
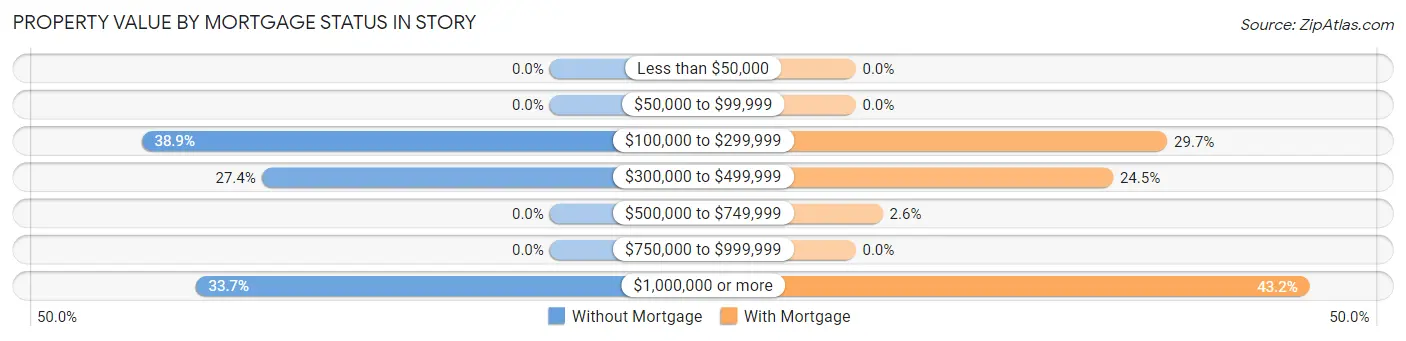
| Property Value | Without Mortgage | With Mortgage |
| Less than $50,000 | 0 (0.0%) | 0 (0.0%) |
| $50,000 to $99,999 | 0 (0.0%) | 0 (0.0%) |
| $100,000 to $299,999 | 68 (38.9%) | 46 (29.7%) |
| $300,000 to $499,999 | 48 (27.4%) | 38 (24.5%) |
| $500,000 to $749,999 | 0 (0.0%) | 4 (2.6%) |
| $750,000 to $999,999 | 0 (0.0%) | 0 (0.0%) |
| $1,000,000 or more | 59 (33.7%) | 67 (43.2%) |
| Total | 175 (100.0%) | 155 (100.0%) |
Household Income by Mortgage Status in Story
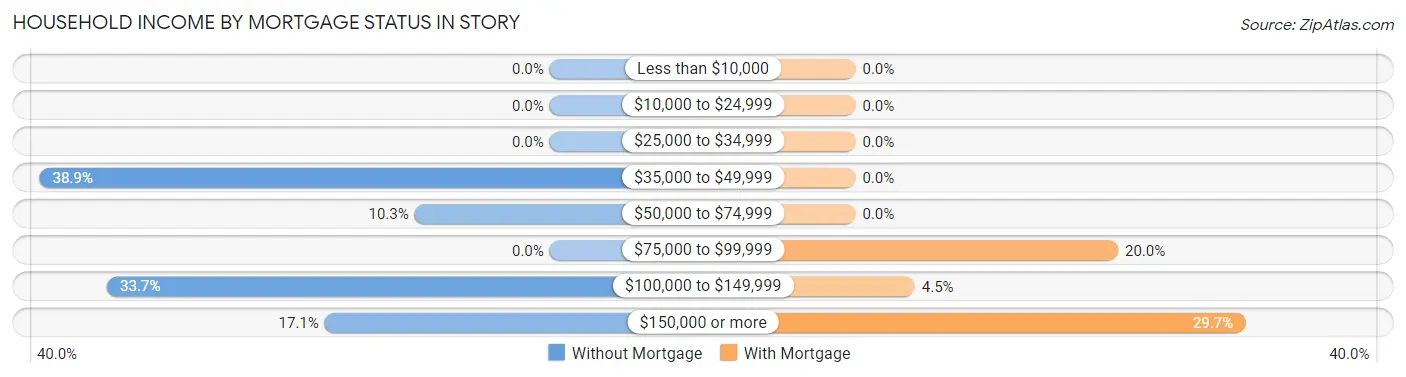
| Household Income | Without Mortgage | With Mortgage |
| Less than $10,000 | 0 (0.0%) | 0 (0.0%) |
| $10,000 to $24,999 | 0 (0.0%) | 0 (0.0%) |
| $25,000 to $34,999 | 0 (0.0%) | 0 (0.0%) |
| $35,000 to $49,999 | 68 (38.9%) | 0 (0.0%) |
| $50,000 to $74,999 | 18 (10.3%) | 0 (0.0%) |
| $75,000 to $99,999 | 0 (0.0%) | 31 (20.0%) |
| $100,000 to $149,999 | 59 (33.7%) | 7 (4.5%) |
| $150,000 or more | 30 (17.1%) | 46 (29.7%) |
| Total | 175 (100.0%) | 155 (100.0%) |
Property Value to Household Income Ratio in Story
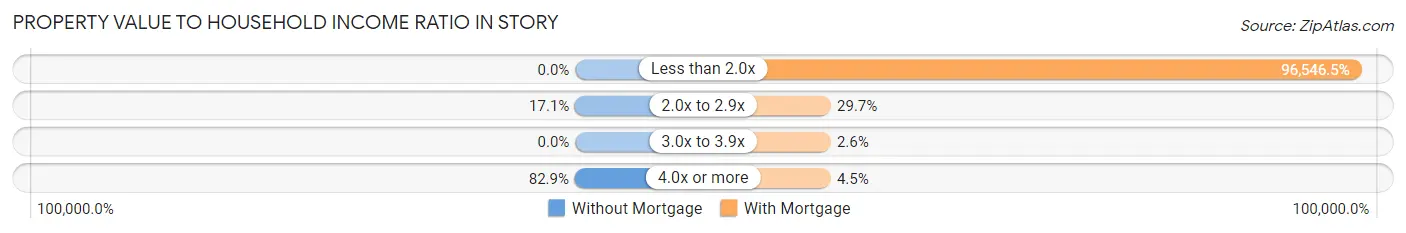
| Value-to-Income Ratio | Without Mortgage | With Mortgage |
| Less than 2.0x | 0 (0.0%) | 149,647 (96,546.5%) |
| 2.0x to 2.9x | 30 (17.1%) | 46 (29.7%) |
| 3.0x to 3.9x | 0 (0.0%) | 4 (2.6%) |
| 4.0x or more | 145 (82.9%) | 7 (4.5%) |
| Total | 175 (100.0%) | 155 (100.0%) |
Real Estate Taxes by Mortgage Status in Story
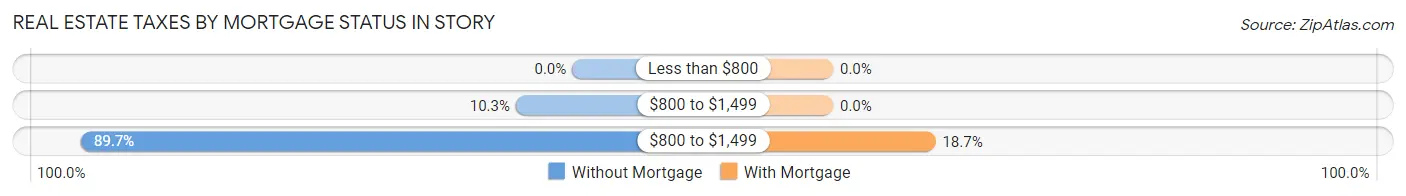
| Property Taxes | Without Mortgage | With Mortgage |
| Less than $800 | 0 (0.0%) | 0 (0.0%) |
| $800 to $1,499 | 18 (10.3%) | 0 (0.0%) |
| $800 to $1,499 | 157 (89.7%) | 29 (18.7%) |
| Total | 175 (100.0%) | 155 (100.0%) |
Health & Disability in Story
Health Insurance Coverage by Age in Story
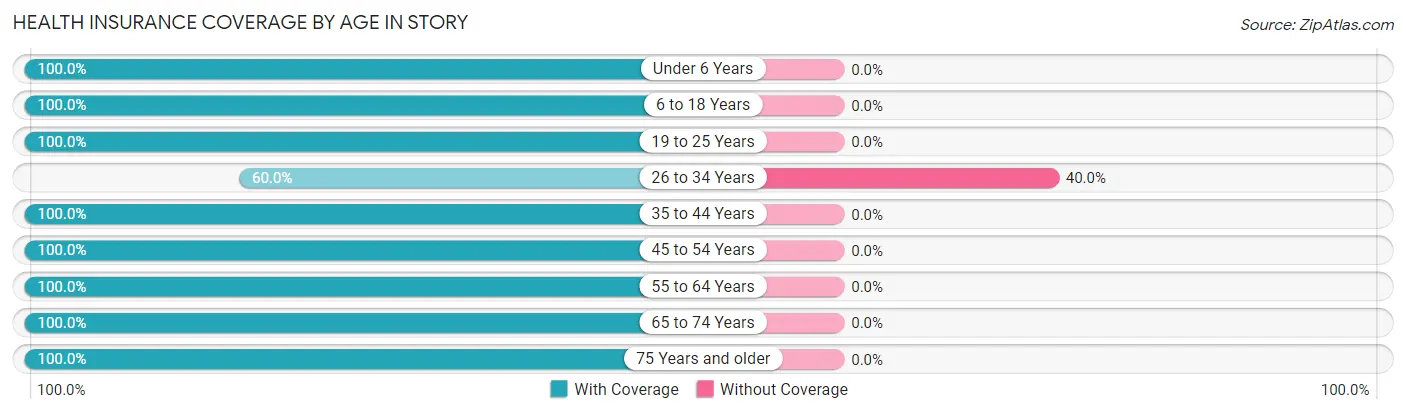
| Age Bracket | With Coverage | Without Coverage |
| Under 6 Years | 7 (100.0%) | 0 (0.0%) |
| 6 to 18 Years | 172 (100.0%) | 0 (0.0%) |
| 19 to 25 Years | 27 (100.0%) | 0 (0.0%) |
| 26 to 34 Years | 69 (60.0%) | 46 (40.0%) |
| 35 to 44 Years | 128 (100.0%) | 0 (0.0%) |
| 45 to 54 Years | 55 (100.0%) | 0 (0.0%) |
| 55 to 64 Years | 261 (100.0%) | 0 (0.0%) |
| 65 to 74 Years | 155 (100.0%) | 0 (0.0%) |
| 75 Years and older | 63 (100.0%) | 0 (0.0%) |
| Total | 937 (95.3%) | 46 (4.7%) |
Health Insurance Coverage by Citizenship Status in Story
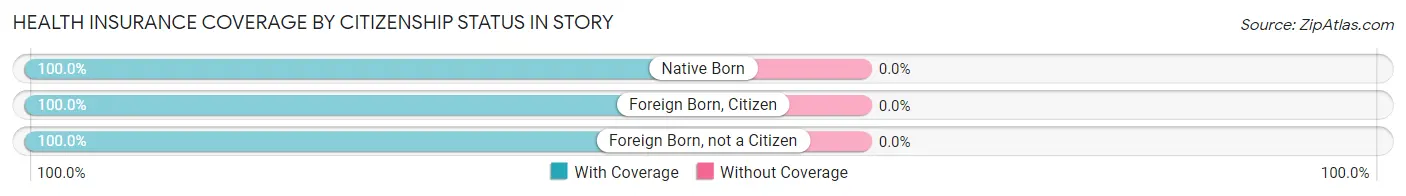
| Citizenship Status | With Coverage | Without Coverage |
| Native Born | 7 (100.0%) | 0 (0.0%) |
| Foreign Born, Citizen | 172 (100.0%) | 0 (0.0%) |
| Foreign Born, not a Citizen | 27 (100.0%) | 0 (0.0%) |
Health Insurance Coverage by Household Income in Story
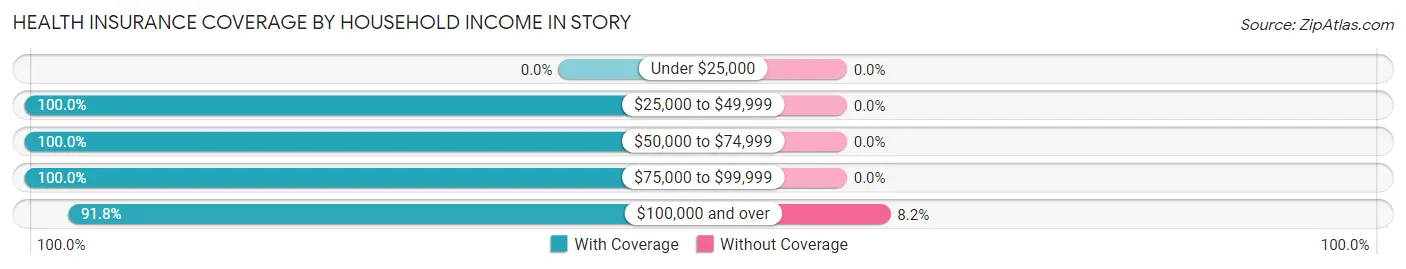
| Household Income | With Coverage | Without Coverage |
| Under $25,000 | 0 (0.0%) | 0 (0.0%) |
| $25,000 to $49,999 | 126 (100.0%) | 0 (0.0%) |
| $50,000 to $74,999 | 119 (100.0%) | 0 (0.0%) |
| $75,000 to $99,999 | 175 (100.0%) | 0 (0.0%) |
| $100,000 and over | 517 (91.8%) | 46 (8.2%) |
Public vs Private Health Insurance Coverage by Age in Story
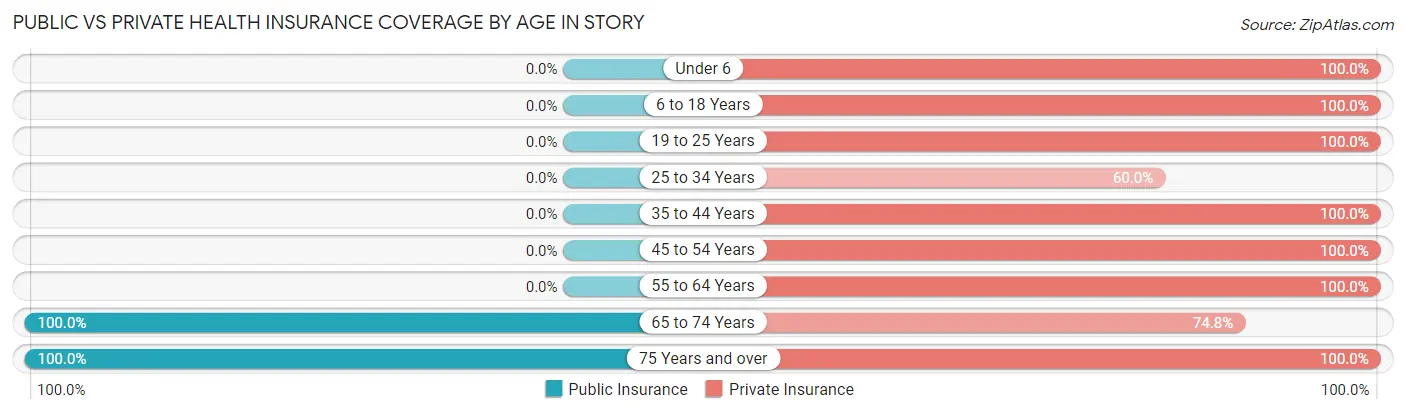
| Age Bracket | Public Insurance | Private Insurance |
| Under 6 | 0 (0.0%) | 7 (100.0%) |
| 6 to 18 Years | 0 (0.0%) | 172 (100.0%) |
| 19 to 25 Years | 0 (0.0%) | 27 (100.0%) |
| 25 to 34 Years | 0 (0.0%) | 69 (60.0%) |
| 35 to 44 Years | 0 (0.0%) | 128 (100.0%) |
| 45 to 54 Years | 0 (0.0%) | 55 (100.0%) |
| 55 to 64 Years | 0 (0.0%) | 261 (100.0%) |
| 65 to 74 Years | 155 (100.0%) | 116 (74.8%) |
| 75 Years and over | 63 (100.0%) | 63 (100.0%) |
| Total | 218 (22.2%) | 898 (91.3%) |
Disability Status by Sex by Age in Story

| Age Bracket | Male | Female |
| Under 5 Years | 0 (0.0%) | 0 (0.0%) |
| 5 to 17 Years | 0 (0.0%) | 0 (0.0%) |
| 18 to 34 Years | 0 (0.0%) | 0 (0.0%) |
| 35 to 64 Years | 0 (0.0%) | 0 (0.0%) |
| 65 to 74 Years | 21 (19.6%) | 0 (0.0%) |
| 75 Years and over | 13 (28.9%) | 18 (100.0%) |
Disability Class by Sex by Age in Story
Disability Class: Hearing Difficulty
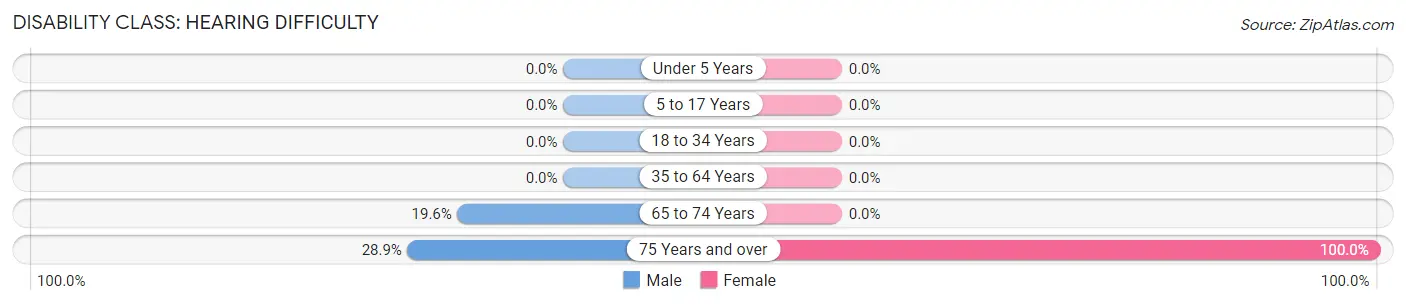
| Age Bracket | Male | Female |
| Under 5 Years | 0 (0.0%) | 0 (0.0%) |
| 5 to 17 Years | 0 (0.0%) | 0 (0.0%) |
| 18 to 34 Years | 0 (0.0%) | 0 (0.0%) |
| 35 to 64 Years | 0 (0.0%) | 0 (0.0%) |
| 65 to 74 Years | 21 (19.6%) | 0 (0.0%) |
| 75 Years and over | 13 (28.9%) | 18 (100.0%) |
Disability Class: Vision Difficulty
| Age Bracket | Male | Female |
| Under 5 Years | 0 (0.0%) | 0 (0.0%) |
| 5 to 17 Years | 0 (0.0%) | 0 (0.0%) |
| 18 to 34 Years | 0 (0.0%) | 0 (0.0%) |
| 35 to 64 Years | 0 (0.0%) | 0 (0.0%) |
| 65 to 74 Years | 0 (0.0%) | 0 (0.0%) |
| 75 Years and over | 0 (0.0%) | 0 (0.0%) |
Disability Class: Cognitive Difficulty
| Age Bracket | Male | Female |
| 5 to 17 Years | 0 (0.0%) | 0 (0.0%) |
| 18 to 34 Years | 0 (0.0%) | 0 (0.0%) |
| 35 to 64 Years | 0 (0.0%) | 0 (0.0%) |
| 65 to 74 Years | 0 (0.0%) | 0 (0.0%) |
| 75 Years and over | 0 (0.0%) | 18 (100.0%) |
Disability Class: Ambulatory Difficulty
| Age Bracket | Male | Female |
| 5 to 17 Years | 0 (0.0%) | 0 (0.0%) |
| 18 to 34 Years | 0 (0.0%) | 0 (0.0%) |
| 35 to 64 Years | 0 (0.0%) | 0 (0.0%) |
| 65 to 74 Years | 0 (0.0%) | 0 (0.0%) |
| 75 Years and over | 13 (28.9%) | 18 (100.0%) |
Disability Class: Self-Care Difficulty
| Age Bracket | Male | Female |
| 5 to 17 Years | 0 (0.0%) | 0 (0.0%) |
| 18 to 34 Years | 0 (0.0%) | 0 (0.0%) |
| 35 to 64 Years | 0 (0.0%) | 0 (0.0%) |
| 65 to 74 Years | 0 (0.0%) | 0 (0.0%) |
| 75 Years and over | 0 (0.0%) | 0 (0.0%) |
Technology Access in Story
Computing Device Access in Story
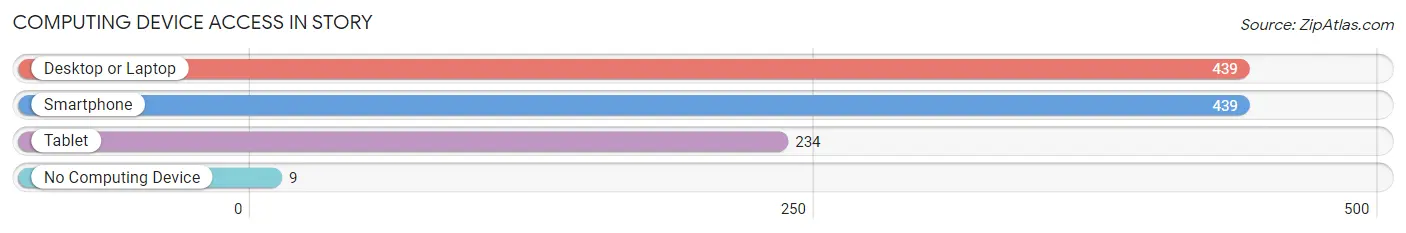
| Device Type | # Households | % Households |
| Desktop or Laptop | 439 | 98.0% |
| Smartphone | 439 | 98.0% |
| Tablet | 234 | 52.2% |
| No Computing Device | 9 | 2.0% |
| Total | 448 | 100.0% |
Internet Access in Story
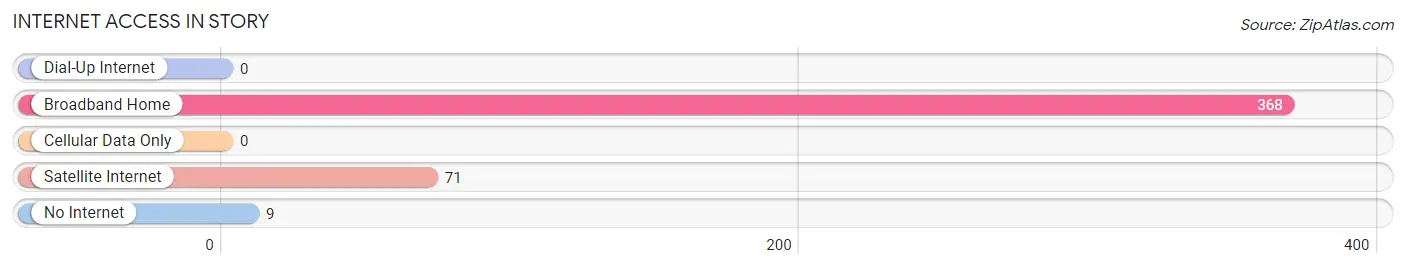
| Internet Type | # Households | % Households |
| Dial-Up Internet | 0 | 0.0% |
| Broadband Home | 368 | 82.1% |
| Cellular Data Only | 0 | 0.0% |
| Satellite Internet | 71 | 15.9% |
| No Internet | 9 | 2.0% |
| Total | 448 | 100.0% |
Story Summary
Wyoming is a state located in the western United States, bordered by Montana to the north, South Dakota and Nebraska to the east, Colorado to the south, and Utah to the west. It is the tenth largest state in the United States, with an area of 97,814 square miles, and the least populous state in the country, with a population of 582,658 in 2020. Wyoming is known for its wide open spaces, rugged terrain, and abundant wildlife.
Geography
Wyoming is located in the western United States, bordered by Montana to the north, South Dakota and Nebraska to the east, Colorado to the south, and Utah to the west. It is the tenth largest state in the United States, with an area of 97,814 square miles. Wyoming is divided into 23 counties, and is home to the Grand Teton National Park, Yellowstone National Park, and the Wind River Indian Reservation. The state is home to the Rocky Mountains, the Great Plains, and the High Plains. The highest point in Wyoming is Gannett Peak, at 13,809 feet, and the lowest point is the Belle Fourche River, at 3,099 feet.
History
Wyoming was first inhabited by Native American tribes, including the Arapaho, Cheyenne, Crow, Shoshone, and Ute. The first Europeans to explore the area were French fur trappers in the late 1700s. In 1803, the United States acquired the area as part of the Louisiana Purchase. In 1868, the Wyoming Territory was created, and in 1890, Wyoming became the 44th state in the Union.
During the late 1800s, Wyoming was a popular destination for settlers, and the state’s population grew rapidly. The Union Pacific Railroad was built through the state, and the discovery of gold and other minerals in the area led to a mining boom. In the early 1900s, the state’s economy shifted to agriculture, and the state’s population began to decline.
Economy
Wyoming’s economy is largely based on the extraction of natural resources, including oil, natural gas, coal, and uranium. The state is also a major producer of beef, and is home to several large cattle ranches. Tourism is also an important part of the state’s economy, with visitors coming to Wyoming to experience the state’s wide open spaces, rugged terrain, and abundant wildlife.
Demographics
As of 2020, Wyoming had a population of 582,658, making it the least populous state in the United States. The state’s population is largely concentrated in the cities of Cheyenne, Casper, and Laramie. The state’s population is predominantly white (90.2%), with smaller percentages of Native American (2.2%), Hispanic (2.7%), and African American (1.2%) populations. The median household income in Wyoming is $60,821, and the median age is 38.7 years.
Conclusion
Wyoming is a state located in the western United States, bordered by Montana to the north, South Dakota and Nebraska to the east, Colorado to the south, and Utah to the west. It is the tenth largest state in the United States, with an area of 97,814 square miles, and the least populous state in the country, with a population of 582,658 in 2020. Wyoming is known for its wide open spaces, rugged terrain, and abundant wildlife. The state’s economy is largely based on the extraction of natural resources, and tourism is also an important part of the state’s economy. The state’s population is predominantly white, with smaller percentages of Native American, Hispanic, and African American populations.
Common Questions
What is Per Capita Income in Story?
Per Capita income in Story is $51,065.
What is the Median Family Income in Story?
Median Family Income in Story is $125,191.
What is the Median Household income in Story?
Median Household Income in Story is $107,188.
What is Inequality or Gini Index in Story?
Inequality or Gini Index in Story is 0.24.
What is the Total Population of Story?
Total Population of Story is 983.
What is the Total Male Population of Story?
Total Male Population of Story is 521.
What is the Total Female Population of Story?
Total Female Population of Story is 462.
What is the Ratio of Males per 100 Females in Story?
There are 112.77 Males per 100 Females in Story.
What is the Ratio of Females per 100 Males in Story?
There are 88.68 Females per 100 Males in Story.
What is the Median Population Age in Story?
Median Population Age in Story is 53.4 Years.
What is the Average Family Size in Story
Average Family Size in Story is 2.7 People.
What is the Average Household Size in Story
Average Household Size in Story is 2.2 People.
How Large is the Labor Force in Story?
There are 629 People in the Labor Forcein in Story.
What is the Percentage of People in the Labor Force in Story?
74.3% of People are in the Labor Force in Story.