Hoback, WY Map & Demographics
Hoback Map
Hoback Overview
$82,791
PER CAPITA INCOME
$135,133
AVG FAMILY INCOME
$136,436
AVG HOUSEHOLD INCOME
8.3%
WAGE / INCOME GAP [ % ]
91.7¢/ $1
WAGE / INCOME GAP [ $ ]
0.53
INEQUALITY / GINI INDEX
1,874
TOTAL POPULATION
926
MALE POPULATION
948
FEMALE POPULATION
97.68
MALES / 100 FEMALES
102.38
FEMALES / 100 MALES
39.5
MEDIAN AGE
2.9
AVG FAMILY SIZE
2.8
AVG HOUSEHOLD SIZE
1,071
LABOR FORCE [ PEOPLE ]
85.1%
PERCENT IN LABOR FORCE
1.2%
UNEMPLOYMENT RATE
Income in Hoback
Income Overview in Hoback
Per Capita Income in Hoback is $82,791, while median incomes of families and households are $135,133 and $136,436 respectively.
| Characteristic | Number | Measure |
| Per Capita Income | 1,874 | $82,791 |
| Median Family Income | 583 | $135,133 |
| Mean Family Income | 583 | $241,840 |
| Median Household Income | 660 | $136,436 |
| Mean Household Income | 660 | $234,774 |
| Income Deficit | 583 | $0 |
| Wage / Income Gap (%) | 1,874 | 8.31% |
| Wage / Income Gap ($) | 1,874 | 91.69¢ per $1 |
| Gini / Inequality Index | 1,874 | 0.53 |
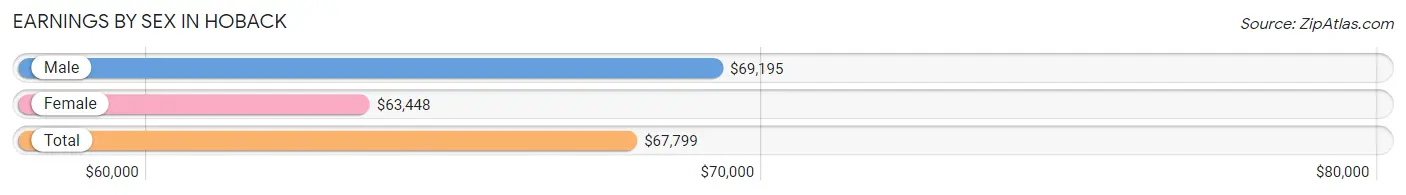
Earnings by Sex in Hoback
Average Earnings in Hoback are $67,799, $69,195 for men and $63,448 for women, a difference of 8.3%.
| Sex | Number | Average Earnings |
| Male | 611 (53.4%) | $69,195 |
| Female | 533 (46.6%) | $63,448 |
| Total | 1,144 (100.0%) | $67,799 |
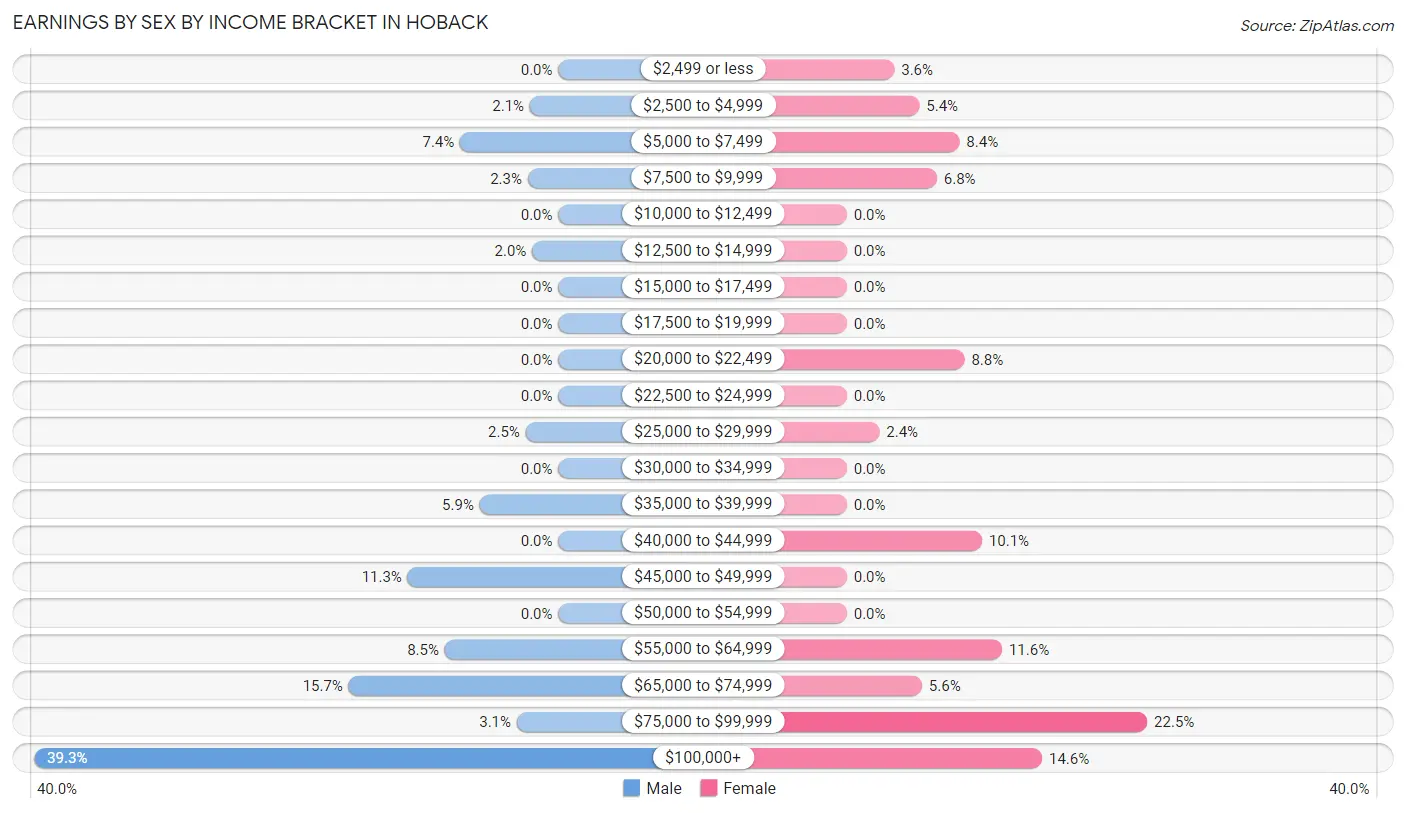
Earnings by Sex by Income Bracket in Hoback
The most common earnings brackets in Hoback are $100,000+ for men (240 | 39.3%) and $75,000 to $99,999 for women (120 | 22.5%).
| Income | Male | Female |
| $2,499 or less | 0 (0.0%) | 19 (3.6%) |
| $2,500 to $4,999 | 13 (2.1%) | 29 (5.4%) |
| $5,000 to $7,499 | 45 (7.4%) | 45 (8.4%) |
| $7,500 to $9,999 | 14 (2.3%) | 36 (6.8%) |
| $10,000 to $12,499 | 0 (0.0%) | 0 (0.0%) |
| $12,500 to $14,999 | 12 (2.0%) | 0 (0.0%) |
| $15,000 to $17,499 | 0 (0.0%) | 0 (0.0%) |
| $17,500 to $19,999 | 0 (0.0%) | 0 (0.0%) |
| $20,000 to $22,499 | 0 (0.0%) | 47 (8.8%) |
| $22,500 to $24,999 | 0 (0.0%) | 0 (0.0%) |
| $25,000 to $29,999 | 15 (2.5%) | 13 (2.4%) |
| $30,000 to $34,999 | 0 (0.0%) | 0 (0.0%) |
| $35,000 to $39,999 | 36 (5.9%) | 0 (0.0%) |
| $40,000 to $44,999 | 0 (0.0%) | 54 (10.1%) |
| $45,000 to $49,999 | 69 (11.3%) | 0 (0.0%) |
| $50,000 to $54,999 | 0 (0.0%) | 0 (0.0%) |
| $55,000 to $64,999 | 52 (8.5%) | 62 (11.6%) |
| $65,000 to $74,999 | 96 (15.7%) | 30 (5.6%) |
| $75,000 to $99,999 | 19 (3.1%) | 120 (22.5%) |
| $100,000+ | 240 (39.3%) | 78 (14.6%) |
| Total | 611 (100.0%) | 533 (100.0%) |
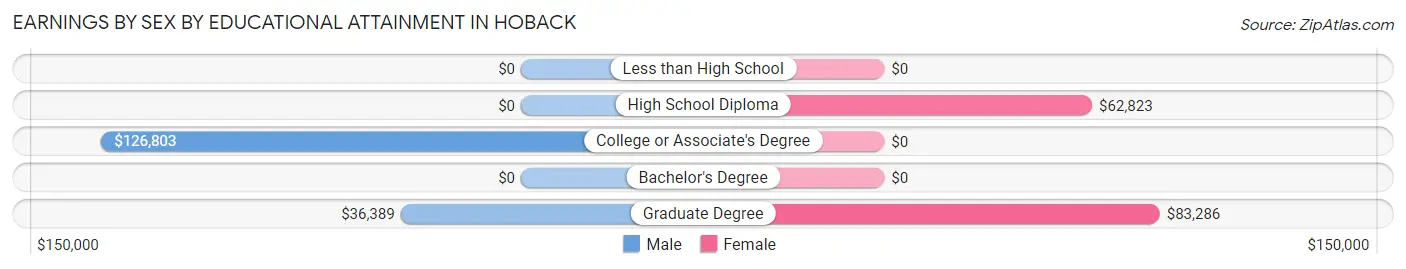
Earnings by Sex by Educational Attainment in Hoback
| Educational Attainment | Male Income | Female Income |
| Less than High School | - | - |
| High School Diploma | - | - |
| College or Associate's Degree | $126,803 | $0 |
| Bachelor's Degree | - | - |
| Graduate Degree | $36,389 | $83,286 |
| Total | - | - |
Family Income in Hoback
Family Income Brackets in Hoback
According to the Hoback family income data, there are 244 families falling into the $100,000 to $149,999 income range, which is the most common income bracket and makes up 41.8% of all families.
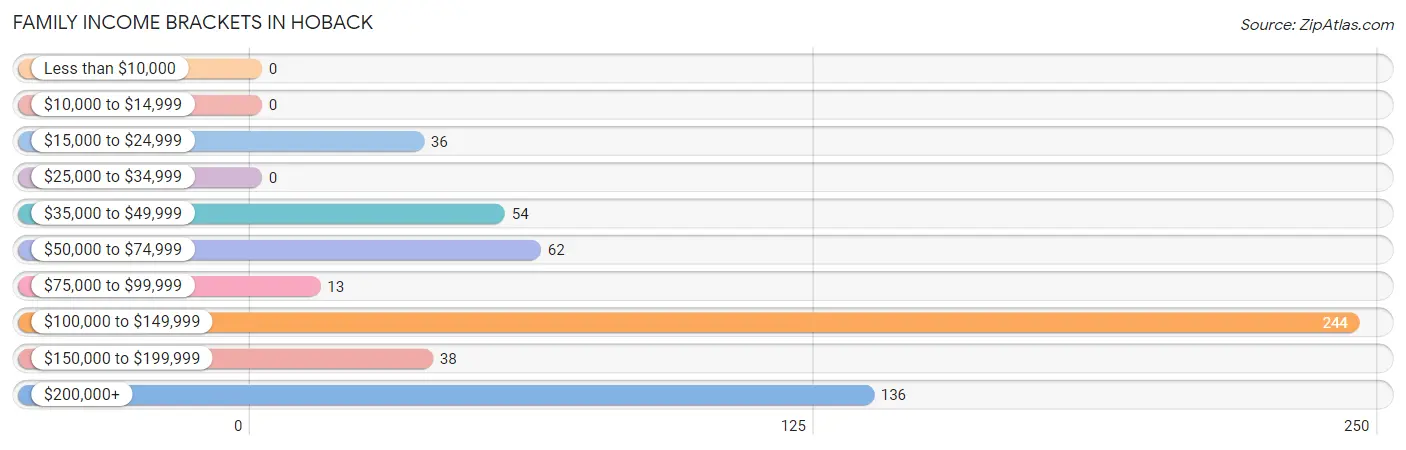
| Income Bracket | # Families | % Families |
| Less than $10,000 | 0 | 0.0% |
| $10,000 to $14,999 | 0 | 0.0% |
| $15,000 to $24,999 | 36 | 6.2% |
| $25,000 to $34,999 | 0 | 0.0% |
| $35,000 to $49,999 | 54 | 9.3% |
| $50,000 to $74,999 | 62 | 10.6% |
| $75,000 to $99,999 | 13 | 2.2% |
| $100,000 to $149,999 | 244 | 41.9% |
| $150,000 to $199,999 | 38 | 6.5% |
| $200,000+ | 136 | 23.3% |
Family Income by Famaliy Size in Hoback
2-person families (174 | 29.8%) account for the highest median family income in Hoback with $135,106 per family, while 2-person families (174 | 29.8%) have the highest median income of $67,553 per family member.
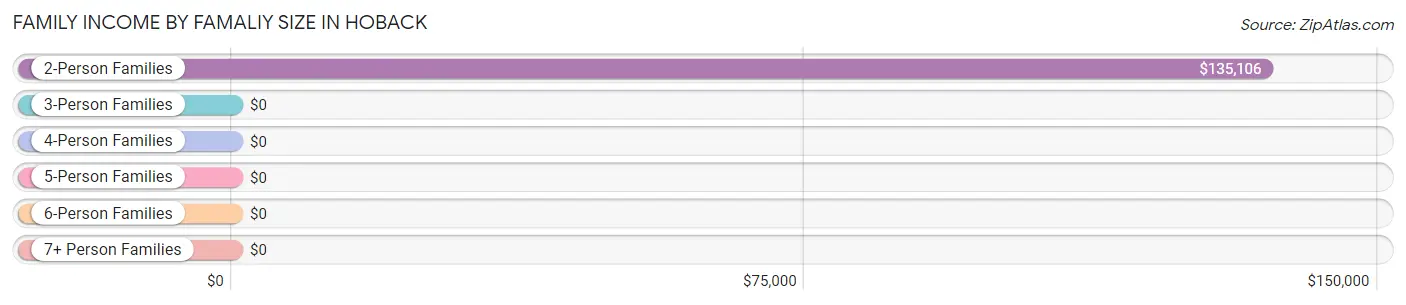
| Income Bracket | # Families | Median Income |
| 2-Person Families | 174 (29.8%) | $135,106 |
| 3-Person Families | 267 (45.8%) | $0 |
| 4-Person Families | 54 (9.3%) | $0 |
| 5-Person Families | 52 (8.9%) | $0 |
| 6-Person Families | 36 (6.2%) | $0 |
| 7+ Person Families | 0 (0.0%) | $0 |
| Total | 583 (100.0%) | $135,133 |
Family Income by Number of Earners in Hoback
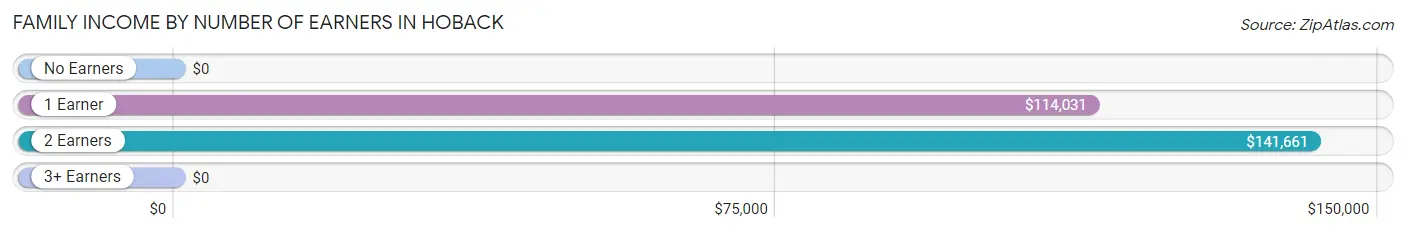
| Number of Earners | # Families | Median Income |
| No Earners | 0 (0.0%) | $0 |
| 1 Earner | 196 (33.6%) | $114,031 |
| 2 Earners | 351 (60.2%) | $141,661 |
| 3+ Earners | 36 (6.2%) | $0 |
| Total | 583 (100.0%) | $135,133 |
Household Income in Hoback
Household Income Brackets in Hoback
With 258 households falling in the category, the $100,000 to $149,999 income range is the most frequent in Hoback, accounting for 39.1% of all households.
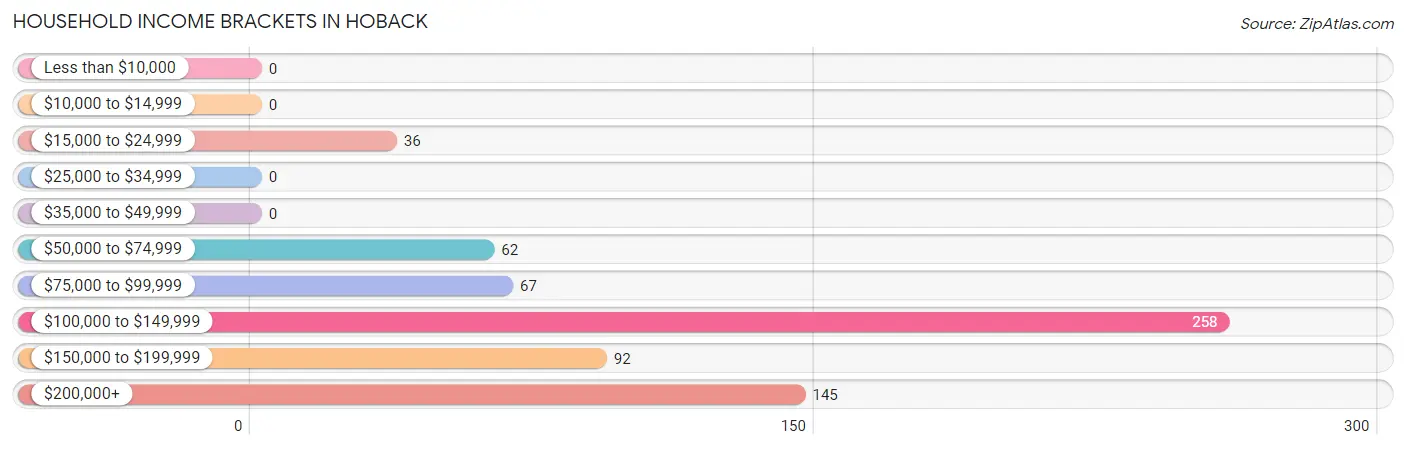
| Income Bracket | # Households | % Households |
| Less than $10,000 | 0 | 0.0% |
| $10,000 to $14,999 | 0 | 0.0% |
| $15,000 to $24,999 | 36 | 5.5% |
| $25,000 to $34,999 | 0 | 0.0% |
| $35,000 to $49,999 | 0 | 0.0% |
| $50,000 to $74,999 | 62 | 9.4% |
| $75,000 to $99,999 | 67 | 10.2% |
| $100,000 to $149,999 | 258 | 39.1% |
| $150,000 to $199,999 | 92 | 13.9% |
| $200,000+ | 145 | 22.0% |
Household Income by Householder Age in Hoback
The median household income in Hoback is $136,436, with the highest median household income of $152,130 found in the 45 to 64 years age bracket for the primary householder. A total of 118 households (17.9%) fall into this category.
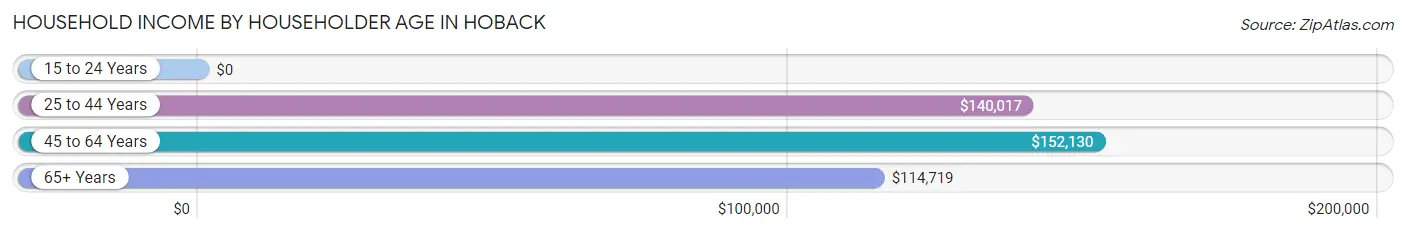
| Income Bracket | # Households | Median Income |
| 15 to 24 Years | 0 (0.0%) | $0 |
| 25 to 44 Years | 409 (62.0%) | $140,017 |
| 45 to 64 Years | 118 (17.9%) | $152,130 |
| 65+ Years | 133 (20.2%) | $114,719 |
| Total | 660 (100.0%) | $136,436 |
Poverty in Hoback
Income Below Poverty by Sex and Age in Hoback
With 3.8% poverty level for males and 18.7% for females among the residents of Hoback, 12 to 14 year old males and 16 and 17 year old females are the most vulnerable to poverty, with 23 males (23.5%) and 45 females (100.0%) in their respective age groups living below the poverty level.
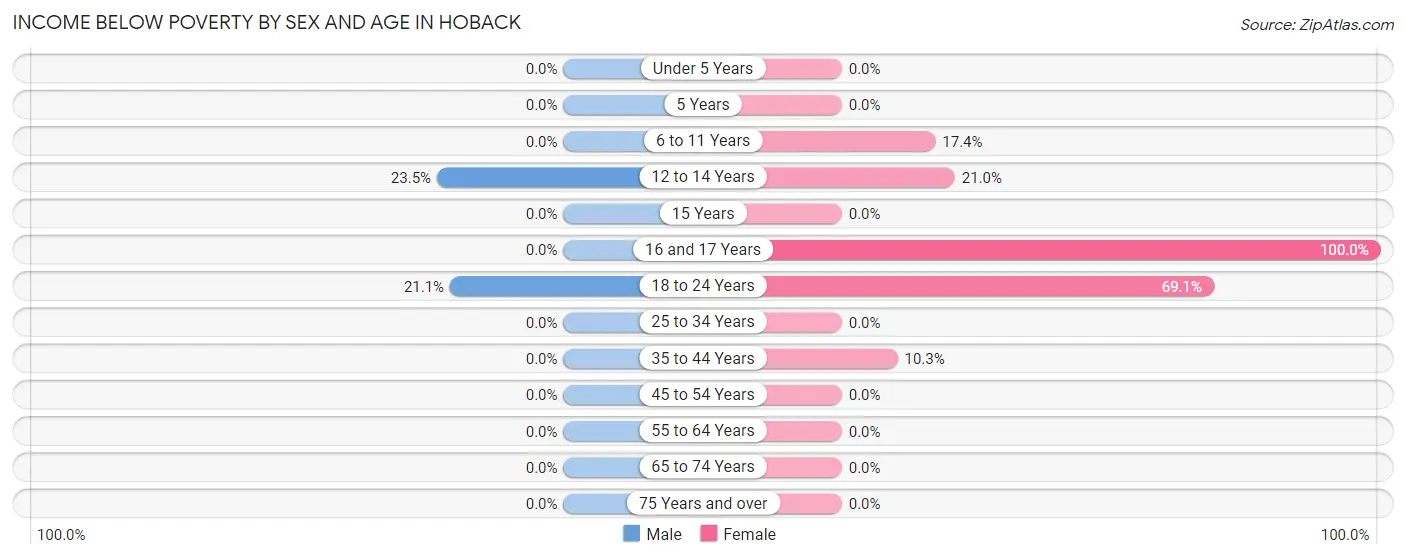
| Age Bracket | Male | Female |
| Under 5 Years | 0 (0.0%) | 0 (0.0%) |
| 5 Years | 0 (0.0%) | 0 (0.0%) |
| 6 to 11 Years | 0 (0.0%) | 33 (17.4%) |
| 12 to 14 Years | 23 (23.5%) | 34 (21.0%) |
| 15 Years | 0 (0.0%) | 0 (0.0%) |
| 16 and 17 Years | 0 (0.0%) | 45 (100.0%) |
| 18 to 24 Years | 12 (21.0%) | 29 (69.1%) |
| 25 to 34 Years | 0 (0.0%) | 0 (0.0%) |
| 35 to 44 Years | 0 (0.0%) | 36 (10.3%) |
| 45 to 54 Years | 0 (0.0%) | 0 (0.0%) |
| 55 to 64 Years | 0 (0.0%) | 0 (0.0%) |
| 65 to 74 Years | 0 (0.0%) | 0 (0.0%) |
| 75 Years and over | 0 (0.0%) | 0 (0.0%) |
| Total | 35 (3.8%) | 177 (18.7%) |
Income Above Poverty by Sex and Age in Hoback
According to the poverty statistics in Hoback, males aged under 5 years and females aged 25 to 34 years are the age groups that are most secure financially, with 100.0% of males and 100.0% of females in these age groups living above the poverty line.
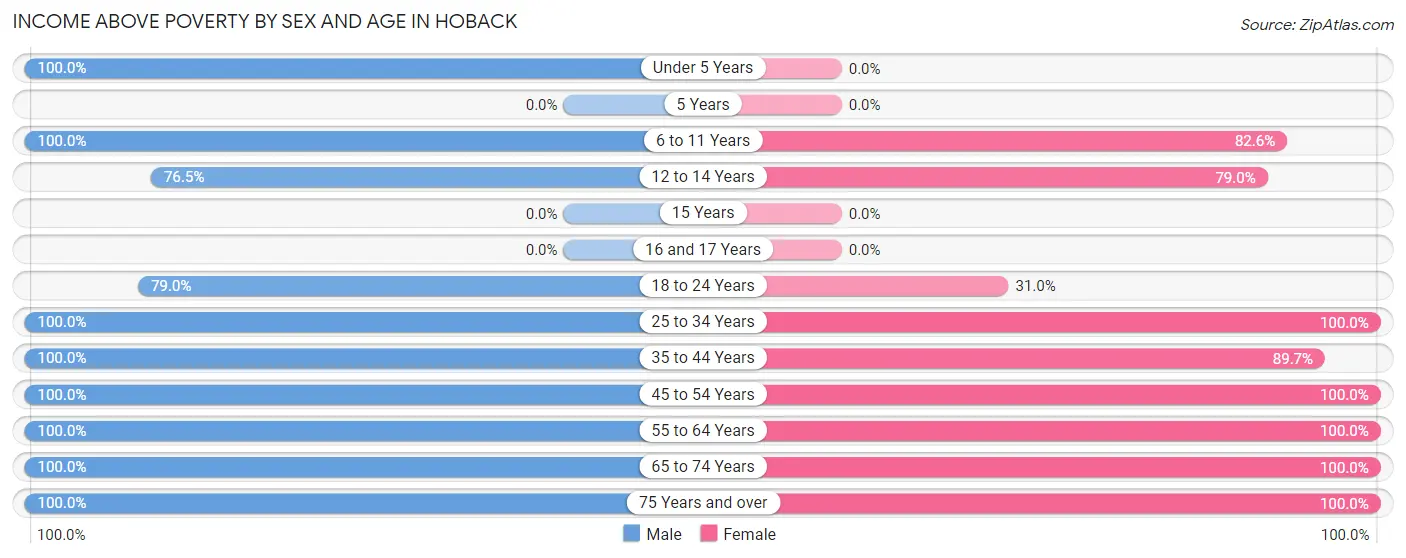
| Age Bracket | Male | Female |
| Under 5 Years | 74 (100.0%) | 0 (0.0%) |
| 5 Years | 0 (0.0%) | 0 (0.0%) |
| 6 to 11 Years | 91 (100.0%) | 157 (82.6%) |
| 12 to 14 Years | 75 (76.5%) | 128 (79.0%) |
| 15 Years | 0 (0.0%) | 0 (0.0%) |
| 16 and 17 Years | 0 (0.0%) | 0 (0.0%) |
| 18 to 24 Years | 45 (78.9%) | 13 (30.9%) |
| 25 to 34 Years | 52 (100.0%) | 30 (100.0%) |
| 35 to 44 Years | 221 (100.0%) | 312 (89.7%) |
| 45 to 54 Years | 180 (100.0%) | 10 (100.0%) |
| 55 to 64 Years | 64 (100.0%) | 14 (100.0%) |
| 65 to 74 Years | 61 (100.0%) | 93 (100.0%) |
| 75 Years and over | 28 (100.0%) | 14 (100.0%) |
| Total | 891 (96.2%) | 771 (81.3%) |
Income Below Poverty Among Married-Couple Families in Hoback
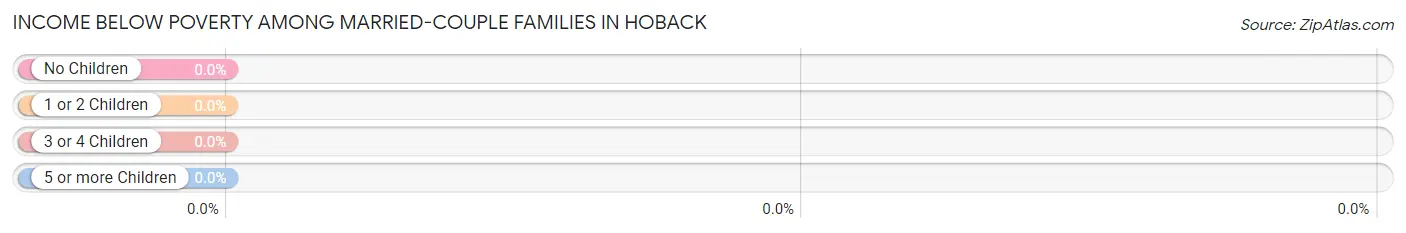
| Children | Above Poverty | Below Poverty |
| No Children | 142 (100.0%) | 0 (0.0%) |
| 1 or 2 Children | 205 (100.0%) | 0 (0.0%) |
| 3 or 4 Children | 0 (0.0%) | 0 (0.0%) |
| 5 or more Children | 0 (0.0%) | 0 (0.0%) |
| Total | 347 (100.0%) | 0 (0.0%) |
Income Below Poverty Among Single-Parent Households in Hoback
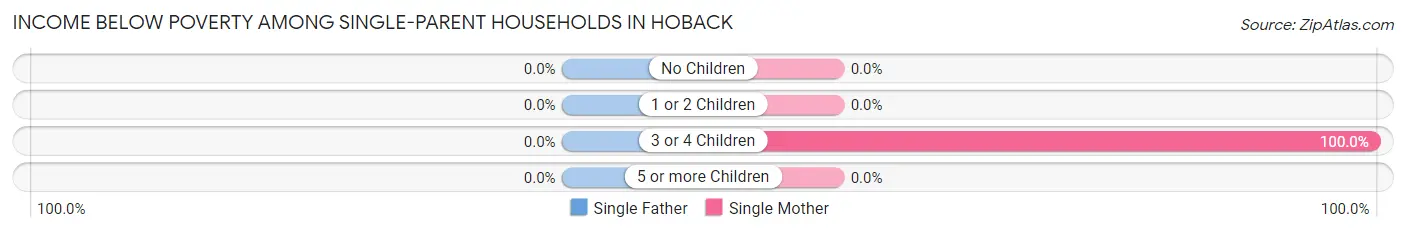
| Children | Single Father | Single Mother |
| No Children | 0 (0.0%) | 0 (0.0%) |
| 1 or 2 Children | 0 (0.0%) | 0 (0.0%) |
| 3 or 4 Children | 0 (0.0%) | 36 (100.0%) |
| 5 or more Children | 0 (0.0%) | 0 (0.0%) |
| Total | 0 (0.0%) | 36 (23.7%) |
Income Below Poverty Among Married-Couple vs Single-Parent Households in Hoback
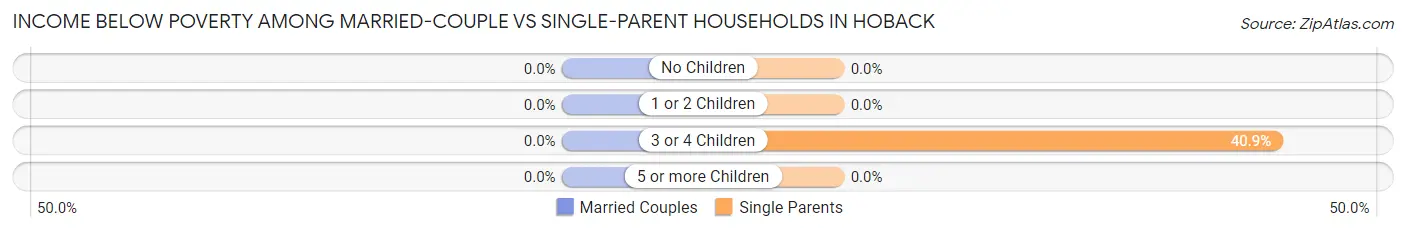
| Children | Married-Couple Families | Single-Parent Households |
| No Children | 0 (0.0%) | 0 (0.0%) |
| 1 or 2 Children | 0 (0.0%) | 0 (0.0%) |
| 3 or 4 Children | 0 (0.0%) | 36 (40.9%) |
| 5 or more Children | 0 (0.0%) | 0 (0.0%) |
| Total | 0 (0.0%) | 36 (15.2%) |
Race in Hoback
The most populous races in Hoback are White / Caucasian (1,500 | 80.0%), Hispanic or Latino (554 | 29.6%), and Some other Race (325 | 17.3%).
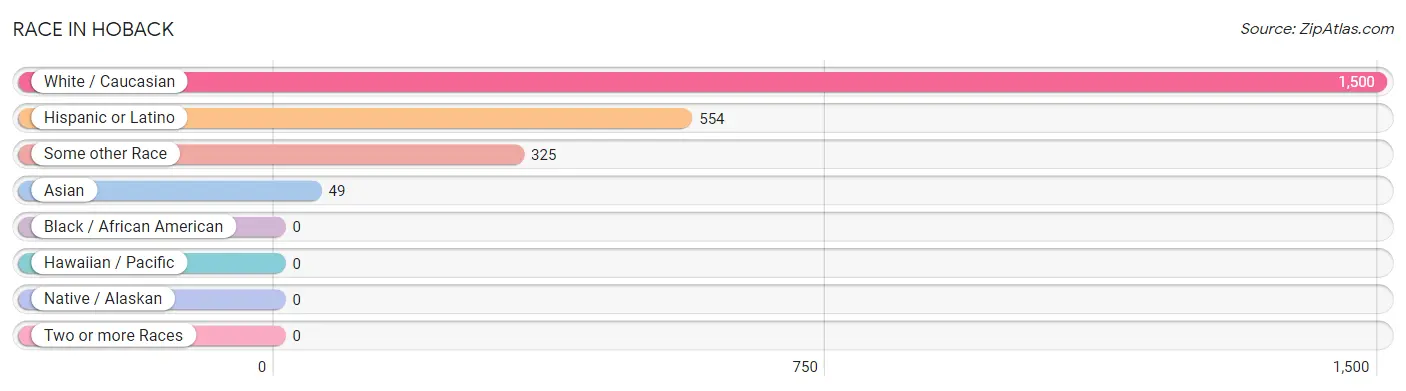
| Race | # Population | % Population |
| Asian | 49 | 2.6% |
| Black / African American | 0 | 0.0% |
| Hawaiian / Pacific | 0 | 0.0% |
| Hispanic or Latino | 554 | 29.6% |
| Native / Alaskan | 0 | 0.0% |
| White / Caucasian | 1,500 | 80.0% |
| Two or more Races | 0 | 0.0% |
| Some other Race | 325 | 17.3% |
| Total | 1,874 | 100.0% |
Ancestry in Hoback
The most populous ancestries reported in Hoback are Mexican (380 | 20.3%), Irish (371 | 19.8%), Polish (203 | 10.8%), Scandinavian (141 | 7.5%), and American (90 | 4.8%), together accounting for 63.2% of all Hoback residents.
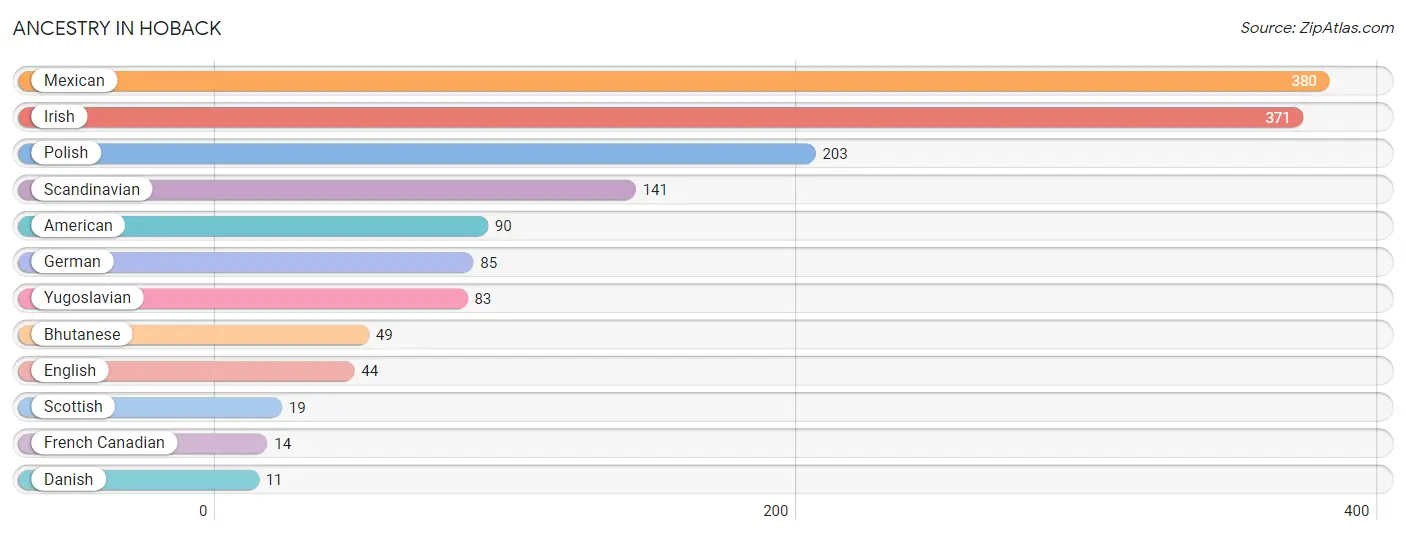
| Ancestry | # Population | % Population |
| American | 90 | 4.8% |
| Bhutanese | 49 | 2.6% |
| Danish | 11 | 0.6% |
| English | 44 | 2.4% |
| French Canadian | 14 | 0.7% |
| German | 85 | 4.5% |
| Irish | 371 | 19.8% |
| Mexican | 380 | 20.3% |
| Polish | 203 | 10.8% |
| Scandinavian | 141 | 7.5% |
| Scottish | 19 | 1.0% |
| Yugoslavian | 83 | 4.4% | View All 12 Rows |
Immigrants in Hoback
The most numerous immigrant groups reported in Hoback came from Central America (256 | 13.7%), Latin America (256 | 13.7%), Mexico (185 | 9.9%), El Salvador (71 | 3.8%), and Canada (14 | 0.7%), together accounting for 41.7% of all Hoback residents.
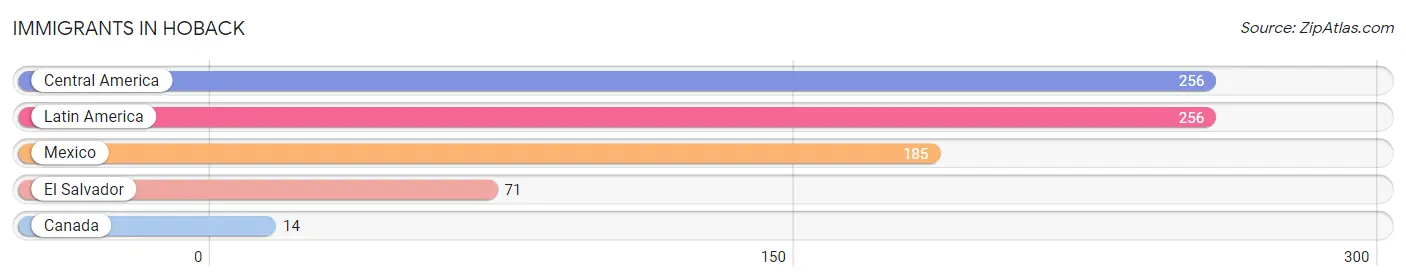
| Immigration Origin | # Population | % Population |
| Canada | 14 | 0.7% |
| Central America | 256 | 13.7% |
| El Salvador | 71 | 3.8% |
| Latin America | 256 | 13.7% |
| Mexico | 185 | 9.9% | View All 5 Rows |
Sex and Age in Hoback
Sex and Age in Hoback
The most populous age groups in Hoback are 40 to 44 Years (221 | 23.9%) for men and 10 to 14 Years (303 | 32.0%) for women.
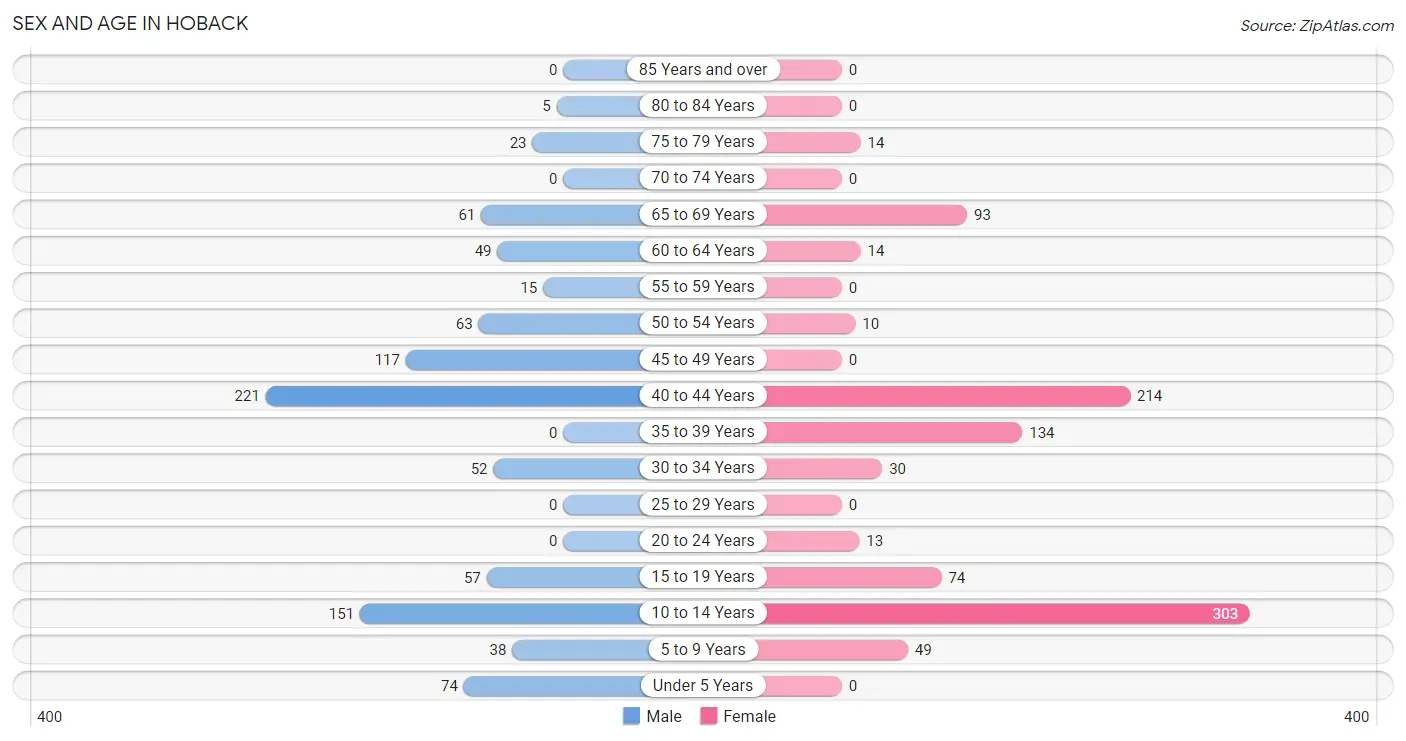
| Age Bracket | Male | Female |
| Under 5 Years | 74 (8.0%) | 0 (0.0%) |
| 5 to 9 Years | 38 (4.1%) | 49 (5.2%) |
| 10 to 14 Years | 151 (16.3%) | 303 (32.0%) |
| 15 to 19 Years | 57 (6.2%) | 74 (7.8%) |
| 20 to 24 Years | 0 (0.0%) | 13 (1.4%) |
| 25 to 29 Years | 0 (0.0%) | 0 (0.0%) |
| 30 to 34 Years | 52 (5.6%) | 30 (3.2%) |
| 35 to 39 Years | 0 (0.0%) | 134 (14.1%) |
| 40 to 44 Years | 221 (23.9%) | 214 (22.6%) |
| 45 to 49 Years | 117 (12.6%) | 0 (0.0%) |
| 50 to 54 Years | 63 (6.8%) | 10 (1.1%) |
| 55 to 59 Years | 15 (1.6%) | 0 (0.0%) |
| 60 to 64 Years | 49 (5.3%) | 14 (1.5%) |
| 65 to 69 Years | 61 (6.6%) | 93 (9.8%) |
| 70 to 74 Years | 0 (0.0%) | 0 (0.0%) |
| 75 to 79 Years | 23 (2.5%) | 14 (1.5%) |
| 80 to 84 Years | 5 (0.5%) | 0 (0.0%) |
| 85 Years and over | 0 (0.0%) | 0 (0.0%) |
| Total | 926 (100.0%) | 948 (100.0%) |
Families and Households in Hoback
Median Family Size in Hoback
The median family size in Hoback is 2.86 persons per family, with single female/mother families (152 | 26.1%) accounting for the largest median family size of 3.36 persons per family. On the other hand, married-couple families (347 | 59.5%) represent the smallest median family size with 2.67 persons per family.
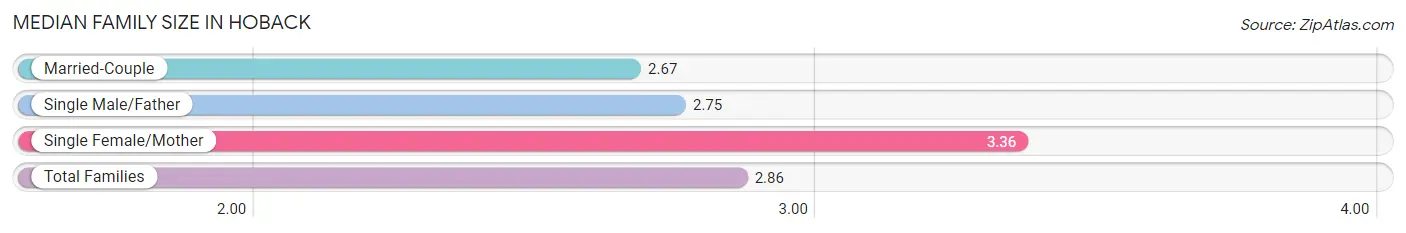
| Family Type | # Families | Family Size |
| Married-Couple | 347 (59.5%) | 2.67 |
| Single Male/Father | 84 (14.4%) | 2.75 |
| Single Female/Mother | 152 (26.1%) | 3.36 |
| Total Families | 583 (100.0%) | 2.86 |
Median Household Size in Hoback
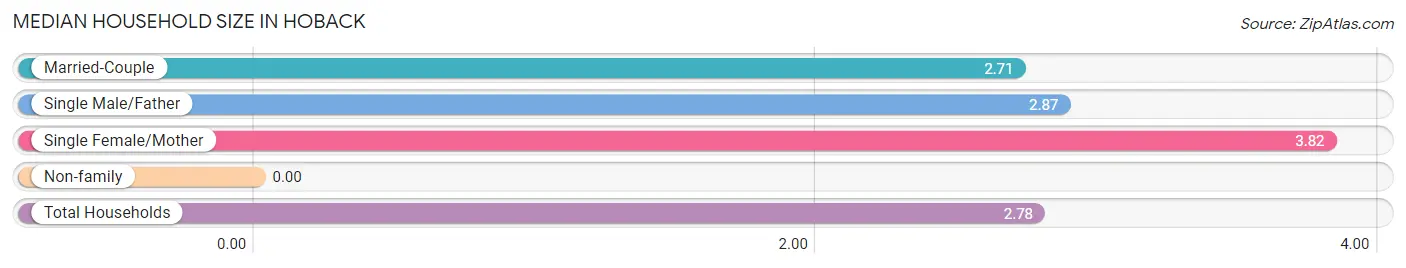
| Household Type | # Households | Household Size |
| Married-Couple | 347 (52.6%) | 2.71 |
| Single Male/Father | 84 (12.7%) | 2.87 |
| Single Female/Mother | 152 (23.0%) | 3.82 |
| Non-family | 77 (11.7%) | - |
| Total Households | 660 (100.0%) | 2.78 |
Household Size by Marriage Status in Hoback
Out of a total of 660 households in Hoback, 583 (88.3%) are family households, while 77 (11.7%) are nonfamily households. The most numerous type of family households are 3-person households, comprising 236, and the most common type of nonfamily households are 1-person households, comprising 77.
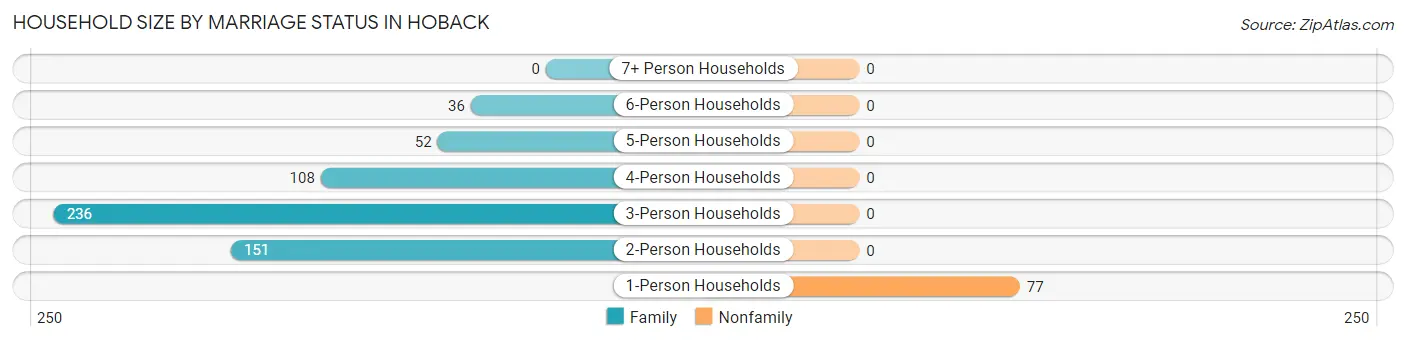
| Household Size | Family Households | Nonfamily Households |
| 1-Person Households | - | 77 (11.7%) |
| 2-Person Households | 151 (22.9%) | 0 (0.0%) |
| 3-Person Households | 236 (35.8%) | 0 (0.0%) |
| 4-Person Households | 108 (16.4%) | 0 (0.0%) |
| 5-Person Households | 52 (7.9%) | 0 (0.0%) |
| 6-Person Households | 36 (5.4%) | 0 (0.0%) |
| 7+ Person Households | 0 (0.0%) | 0 (0.0%) |
| Total | 583 (88.3%) | 77 (11.7%) |
Female Fertility in Hoback
Fertility by Age in Hoback
| Age Bracket | Women with Births | Births / 1,000 Women |
| 15 to 19 years | 0 (0.0%) | 0.0 |
| 20 to 34 years | 0 (0.0%) | 0.0 |
| 35 to 50 years | 0 (0.0%) | 0.0 |
| Total | 0 (0.0%) | 0.0 |
Fertility by Age by Marriage Status in Hoback
| Age Bracket | Married | Unmarried |
| 15 to 19 years | 0 (0.0%) | 0 (0.0%) |
| 20 to 34 years | 0 (0.0%) | 0 (0.0%) |
| 35 to 50 years | 0 (0.0%) | 0 (0.0%) |
| Total | 0 (0.0%) | 0 (0.0%) |
Fertility by Education in Hoback
| Educational Attainment | Women with Births | Births / 1,000 Women |
| Less than High School | 0 (0.0%) | 0.0 |
| High School Diploma | 0 (0.0%) | 0.0 |
| College or Associate's Degree | 0 (0.0%) | 0.0 |
| Bachelor's Degree | 0 (0.0%) | 0.0 |
| Graduate Degree | 0 (0.0%) | 0.0 |
| Total | 0 (0.0%) | 0.0 |
Fertility by Education by Marriage Status in Hoback
| Educational Attainment | Married | Unmarried |
| Less than High School | 0 (0.0%) | 0 (0.0%) |
| High School Diploma | 0 (0.0%) | 0 (0.0%) |
| College or Associate's Degree | 0 (0.0%) | 0 (0.0%) |
| Bachelor's Degree | 0 (0.0%) | 0 (0.0%) |
| Graduate Degree | 0 (0.0%) | 0 (0.0%) |
| Total | 0 (0.0%) | 0 (0.0%) |
Employment Characteristics in Hoback
Employment by Class of Employer in Hoback
Among the 1,058 employed individuals in Hoback, private company employees (693 | 65.5%), self-employed (not incorporated) (120 | 11.3%), and federal government employees (73 | 6.9%) make up the most common classes of employment.
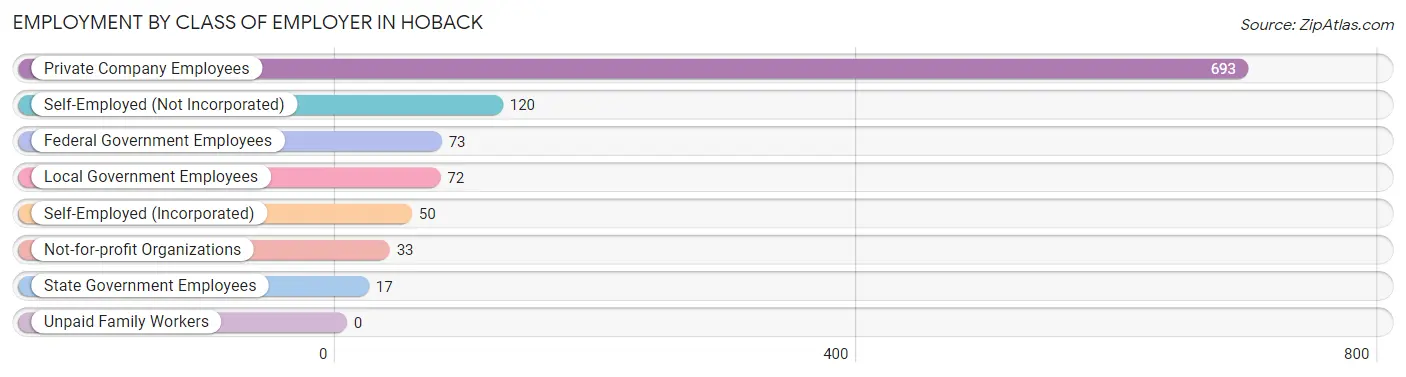
| Employer Class | # Employees | % Employees |
| Private Company Employees | 693 | 65.5% |
| Self-Employed (Incorporated) | 50 | 4.7% |
| Self-Employed (Not Incorporated) | 120 | 11.3% |
| Not-for-profit Organizations | 33 | 3.1% |
| Local Government Employees | 72 | 6.8% |
| State Government Employees | 17 | 1.6% |
| Federal Government Employees | 73 | 6.9% |
| Unpaid Family Workers | 0 | 0.0% |
| Total | 1,058 | 100.0% |
Employment Status by Age in Hoback
According to the labor force statistics for Hoback, out of the total population over 16 years of age (1,259), 85.1% or 1,071 individuals are in the labor force, with 1.2% or 13 of them unemployed. The age group with the highest labor force participation rate is 20 to 24 years, with 100.0% or 13 individuals in the labor force. Within the labor force, the 60 to 64 years age range has the highest percentage of unemployed individuals, with 20.6% or 13 of them being unemployed.
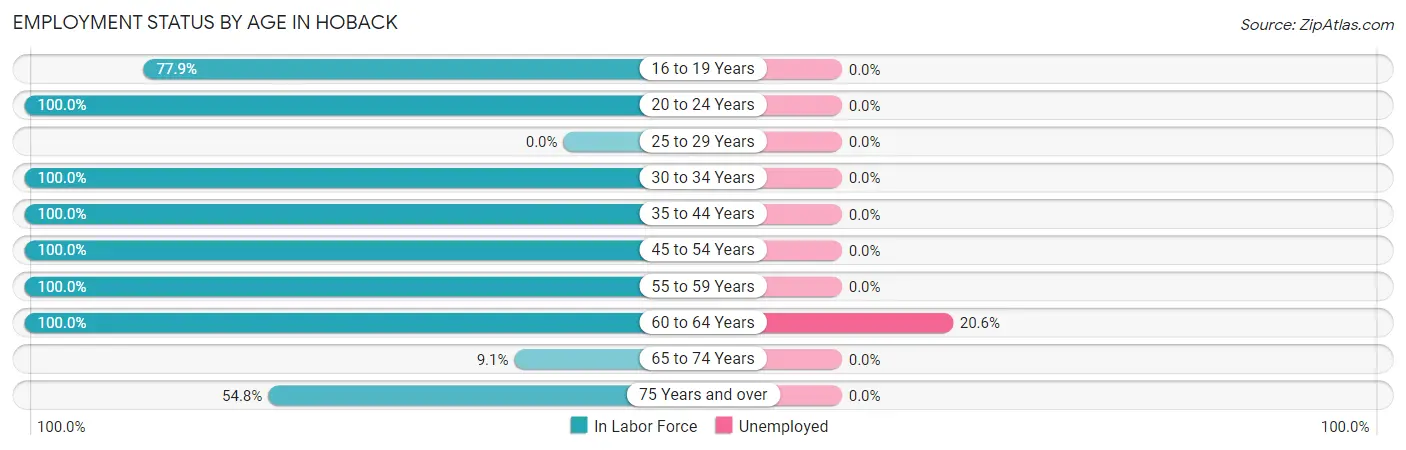
| Age Bracket | In Labor Force | Unemployed |
| 16 to 19 Years | 102 (77.9%) | 0 (0.0%) |
| 20 to 24 Years | 13 (100.0%) | 0 (0.0%) |
| 25 to 29 Years | 0 (0.0%) | 0 (0.0%) |
| 30 to 34 Years | 82 (100.0%) | 0 (0.0%) |
| 35 to 44 Years | 569 (100.0%) | 0 (0.0%) |
| 45 to 54 Years | 190 (100.0%) | 0 (0.0%) |
| 55 to 59 Years | 15 (100.0%) | 0 (0.0%) |
| 60 to 64 Years | 63 (100.0%) | 13 (20.6%) |
| 65 to 74 Years | 14 (9.1%) | 0 (0.0%) |
| 75 Years and over | 23 (54.8%) | 0 (0.0%) |
| Total | 1,071 (85.1%) | 13 (1.2%) |
Employment Status by Educational Attainment in Hoback
According to labor force statistics for Hoback, 100.0% of individuals (919) out of the total population between 25 and 64 years of age (919) are in the labor force, with 1.4% or 13 of them being unemployed. The group with the highest labor force participation rate are those with the educational attainment of less than high school, with 100.0% or 23 individuals in the labor force. Within the labor force, individuals with bachelor's degree or higher education have the highest percentage of unemployment, with 3.3% or 13 of them being unemployed.
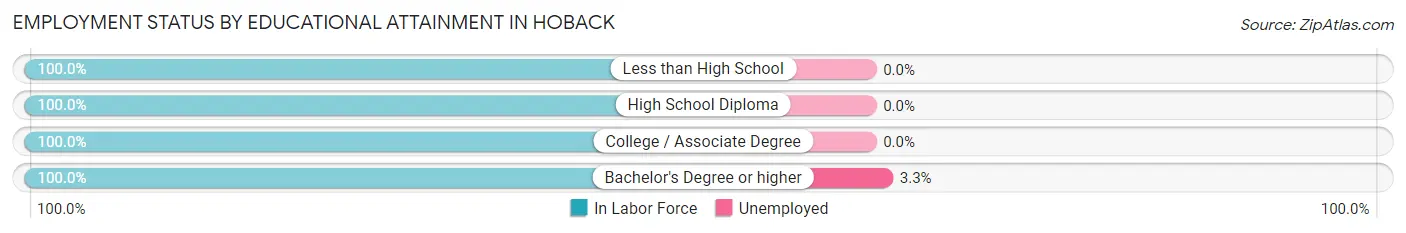
| Educational Attainment | In Labor Force | Unemployed |
| Less than High School | 23 (100.0%) | 0 (0.0%) |
| High School Diploma | 221 (100.0%) | 0 (0.0%) |
| College / Associate Degree | 276 (100.0%) | 0 (0.0%) |
| Bachelor's Degree or higher | 399 (100.0%) | 13 (3.3%) |
| Total | 919 (100.0%) | 13 (1.4%) |
Employment Occupations by Sex in Hoback
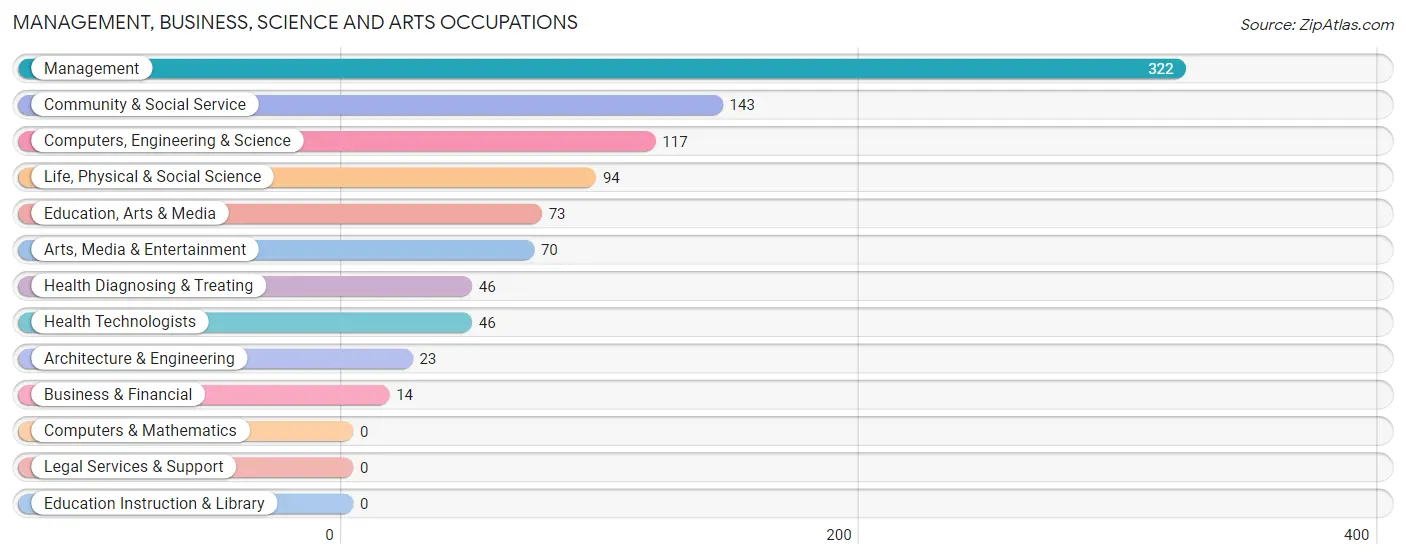
Management, Business, Science and Arts Occupations
The most common Management, Business, Science and Arts occupations in Hoback are Management (322 | 30.4%), Community & Social Service (143 | 13.5%), Computers, Engineering & Science (117 | 11.1%), Life, Physical & Social Science (94 | 8.9%), and Education, Arts & Media (73 | 6.9%).
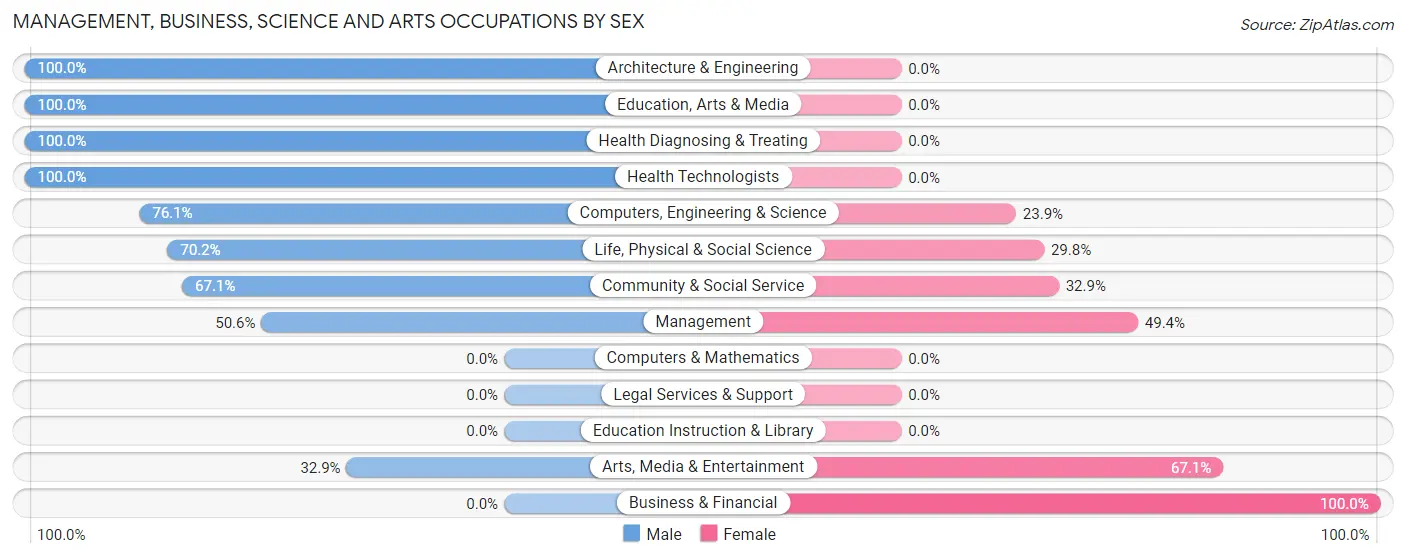
Management, Business, Science and Arts Occupations by Sex
Within the Management, Business, Science and Arts occupations in Hoback, the most male-oriented occupations are Architecture & Engineering (100.0%), Education, Arts & Media (100.0%), and Health Diagnosing & Treating (100.0%), while the most female-oriented occupations are Business & Financial (100.0%), Arts, Media & Entertainment (67.1%), and Management (49.4%).
| Occupation | Male | Female |
| Management | 163 (50.6%) | 159 (49.4%) |
| Business & Financial | 0 (0.0%) | 14 (100.0%) |
| Computers, Engineering & Science | 89 (76.1%) | 28 (23.9%) |
| Computers & Mathematics | 0 (0.0%) | 0 (0.0%) |
| Architecture & Engineering | 23 (100.0%) | 0 (0.0%) |
| Life, Physical & Social Science | 66 (70.2%) | 28 (29.8%) |
| Community & Social Service | 96 (67.1%) | 47 (32.9%) |
| Education, Arts & Media | 73 (100.0%) | 0 (0.0%) |
| Legal Services & Support | 0 (0.0%) | 0 (0.0%) |
| Education Instruction & Library | 0 (0.0%) | 0 (0.0%) |
| Arts, Media & Entertainment | 23 (32.9%) | 47 (67.1%) |
| Health Diagnosing & Treating | 46 (100.0%) | 0 (0.0%) |
| Health Technologists | 46 (100.0%) | 0 (0.0%) |
| Total (Category) | 394 (61.4%) | 248 (38.6%) |
| Total (Overall) | 598 (56.5%) | 460 (43.5%) |
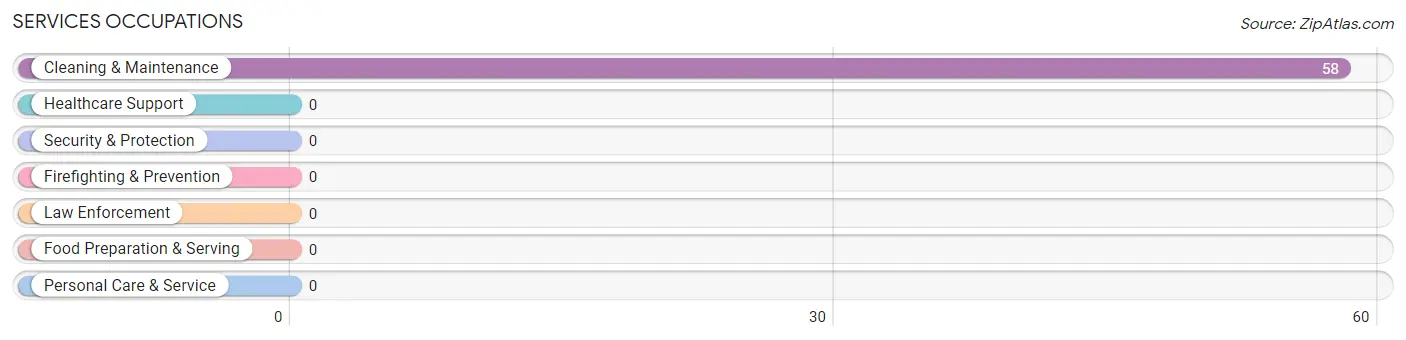
Services Occupations
The most common Services occupations in Hoback are , and Cleaning & Maintenance (58 | 5.5%).
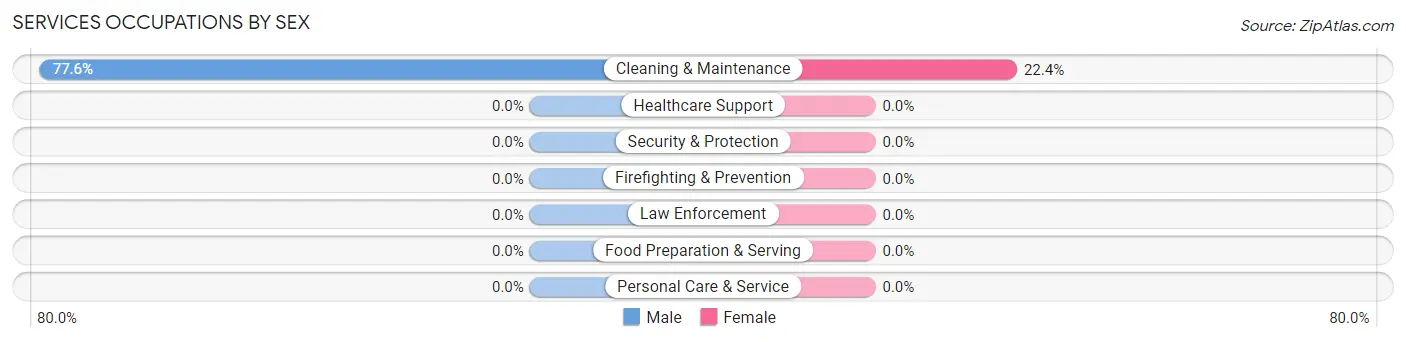
Services Occupations by Sex
| Occupation | Male | Female |
| Healthcare Support | 0 (0.0%) | 0 (0.0%) |
| Security & Protection | 0 (0.0%) | 0 (0.0%) |
| Firefighting & Prevention | 0 (0.0%) | 0 (0.0%) |
| Law Enforcement | 0 (0.0%) | 0 (0.0%) |
| Food Preparation & Serving | 0 (0.0%) | 0 (0.0%) |
| Cleaning & Maintenance | 45 (77.6%) | 13 (22.4%) |
| Personal Care & Service | 0 (0.0%) | 0 (0.0%) |
| Total (Category) | 45 (77.6%) | 13 (22.4%) |
| Total (Overall) | 598 (56.5%) | 460 (43.5%) |
Sales and Office Occupations
The most common Sales and Office occupations in Hoback are Office & Administration (165 | 15.6%), and Sales & Related (81 | 7.7%).
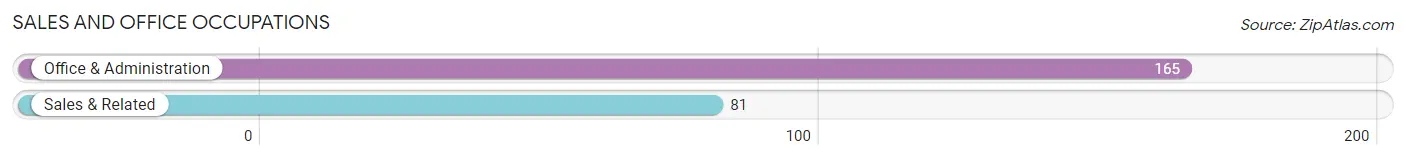
Sales and Office Occupations by Sex
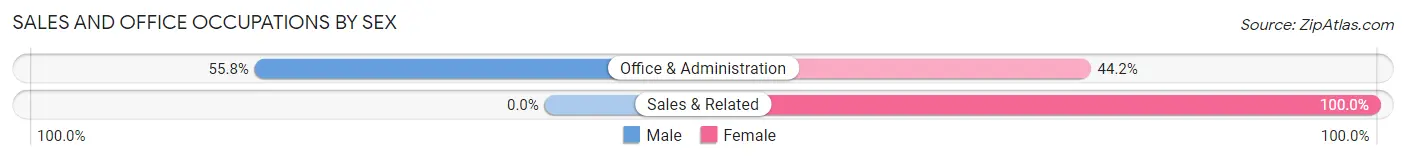
| Occupation | Male | Female |
| Sales & Related | 0 (0.0%) | 81 (100.0%) |
| Office & Administration | 92 (55.8%) | 73 (44.2%) |
| Total (Category) | 92 (37.4%) | 154 (62.6%) |
| Total (Overall) | 598 (56.5%) | 460 (43.5%) |
Natural Resources, Construction and Maintenance Occupations
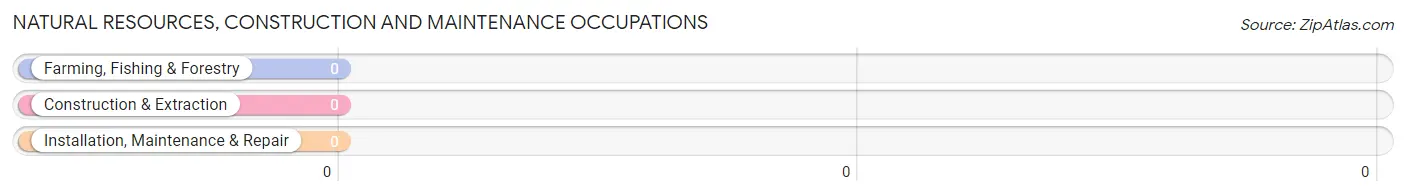
Natural Resources, Construction and Maintenance Occupations by Sex
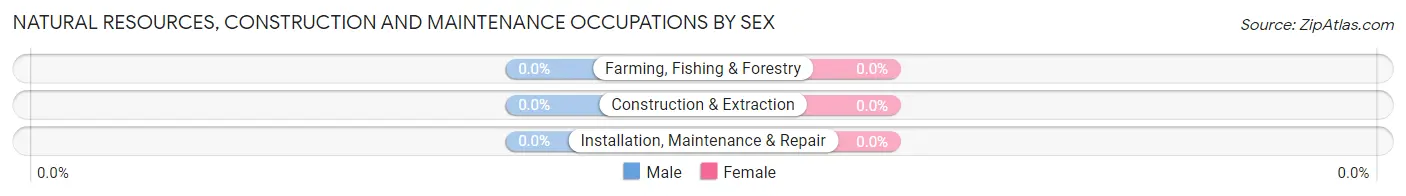
| Occupation | Male | Female |
| Farming, Fishing & Forestry | 0 (0.0%) | 0 (0.0%) |
| Construction & Extraction | 0 (0.0%) | 0 (0.0%) |
| Installation, Maintenance & Repair | 0 (0.0%) | 0 (0.0%) |
| Total (Category) | 0 (0.0%) | 0 (0.0%) |
| Total (Overall) | 598 (56.5%) | 460 (43.5%) |
Production, Transportation and Moving Occupations
The most common Production, Transportation and Moving occupations in Hoback are Material Moving (97 | 9.2%), and Transportation (15 | 1.4%).
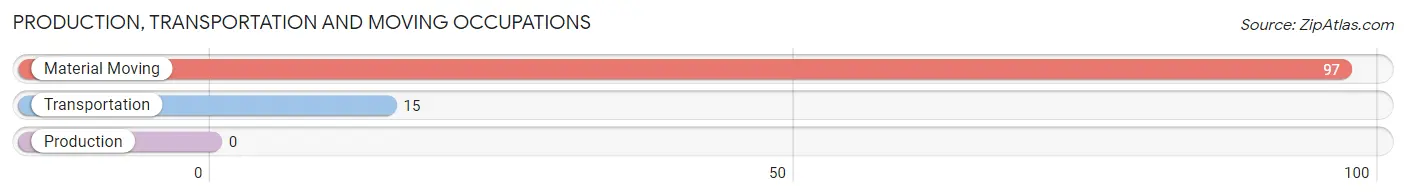
Production, Transportation and Moving Occupations by Sex
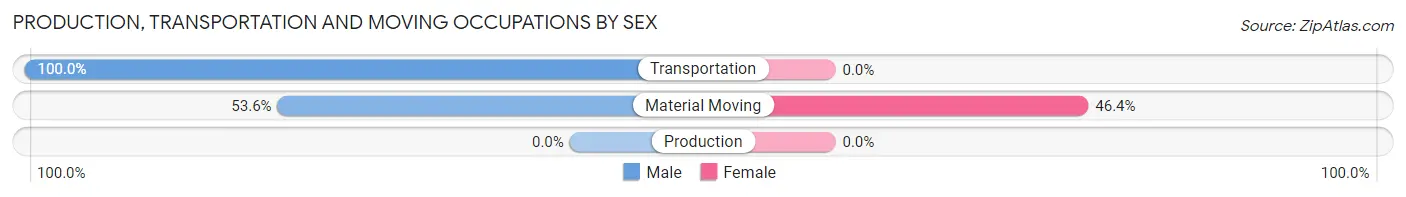
| Occupation | Male | Female |
| Production | 0 (0.0%) | 0 (0.0%) |
| Transportation | 15 (100.0%) | 0 (0.0%) |
| Material Moving | 52 (53.6%) | 45 (46.4%) |
| Total (Category) | 67 (59.8%) | 45 (40.2%) |
| Total (Overall) | 598 (56.5%) | 460 (43.5%) |
Employment Industries by Sex in Hoback
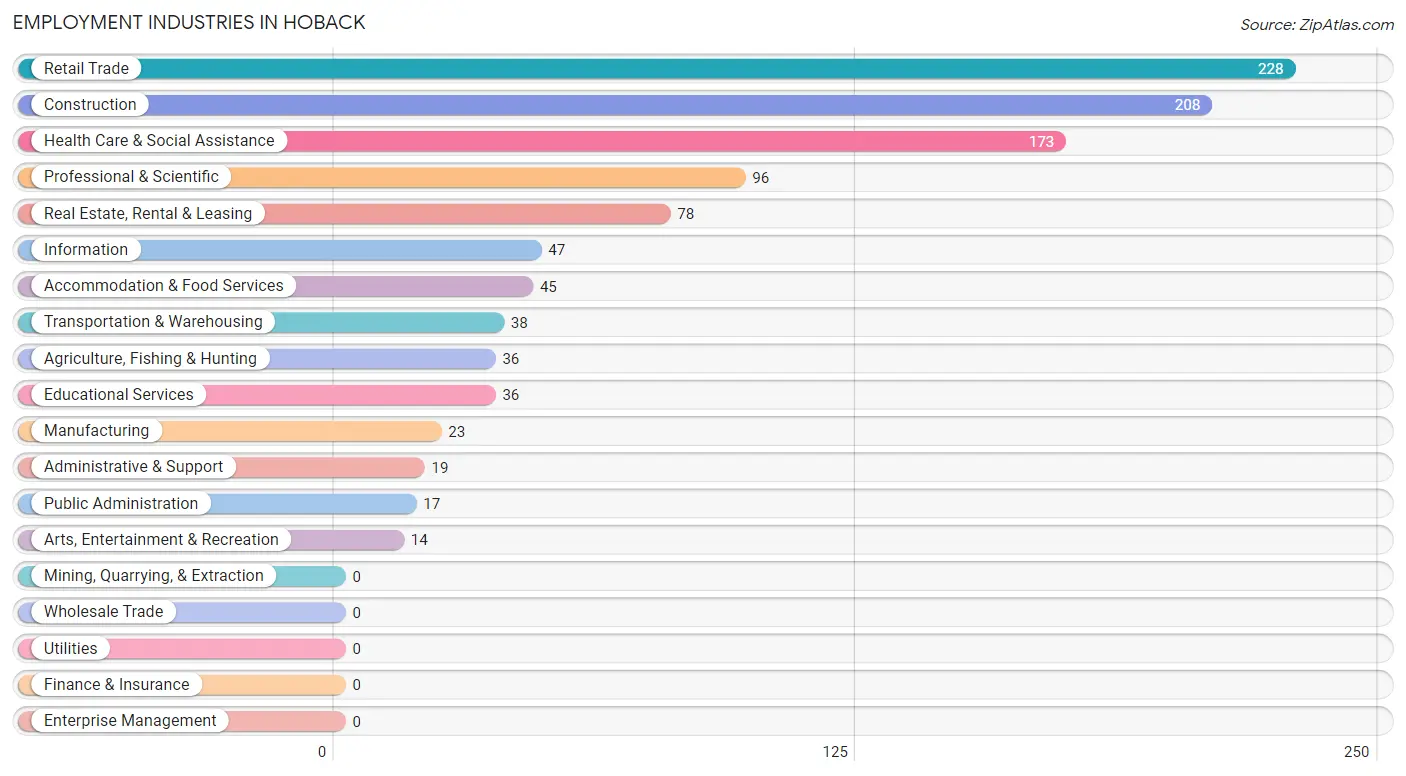
Employment Industries in Hoback
The major employment industries in Hoback include Retail Trade (228 | 21.5%), Construction (208 | 19.7%), Health Care & Social Assistance (173 | 16.4%), Professional & Scientific (96 | 9.1%), and Real Estate, Rental & Leasing (78 | 7.4%).
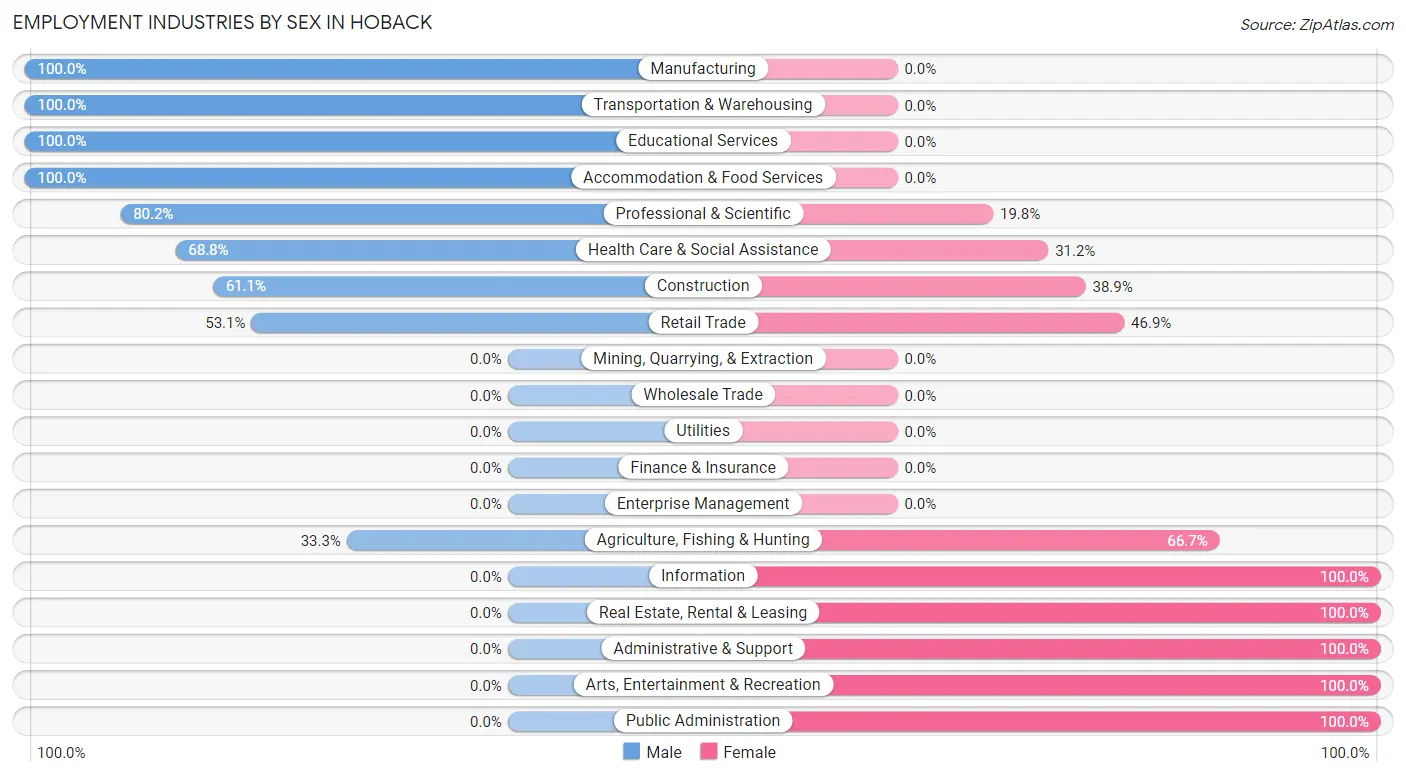
Employment Industries by Sex in Hoback
The Hoback industries that see more men than women are Manufacturing (100.0%), Transportation & Warehousing (100.0%), and Educational Services (100.0%), whereas the industries that tend to have a higher number of women are Information (100.0%), Real Estate, Rental & Leasing (100.0%), and Administrative & Support (100.0%).
| Industry | Male | Female |
| Agriculture, Fishing & Hunting | 12 (33.3%) | 24 (66.7%) |
| Mining, Quarrying, & Extraction | 0 (0.0%) | 0 (0.0%) |
| Construction | 127 (61.1%) | 81 (38.9%) |
| Manufacturing | 23 (100.0%) | 0 (0.0%) |
| Wholesale Trade | 0 (0.0%) | 0 (0.0%) |
| Retail Trade | 121 (53.1%) | 107 (46.9%) |
| Transportation & Warehousing | 38 (100.0%) | 0 (0.0%) |
| Utilities | 0 (0.0%) | 0 (0.0%) |
| Information | 0 (0.0%) | 47 (100.0%) |
| Finance & Insurance | 0 (0.0%) | 0 (0.0%) |
| Real Estate, Rental & Leasing | 0 (0.0%) | 78 (100.0%) |
| Professional & Scientific | 77 (80.2%) | 19 (19.8%) |
| Enterprise Management | 0 (0.0%) | 0 (0.0%) |
| Administrative & Support | 0 (0.0%) | 19 (100.0%) |
| Educational Services | 36 (100.0%) | 0 (0.0%) |
| Health Care & Social Assistance | 119 (68.8%) | 54 (31.2%) |
| Arts, Entertainment & Recreation | 0 (0.0%) | 14 (100.0%) |
| Accommodation & Food Services | 45 (100.0%) | 0 (0.0%) |
| Public Administration | 0 (0.0%) | 17 (100.0%) |
| Total | 598 (56.5%) | 460 (43.5%) |
Education in Hoback
School Enrollment in Hoback
The most common levels of schooling among the 610 students in Hoback are middle school (276 | 45.3%), elementary school (137 | 22.5%), and high school (119 | 19.5%).
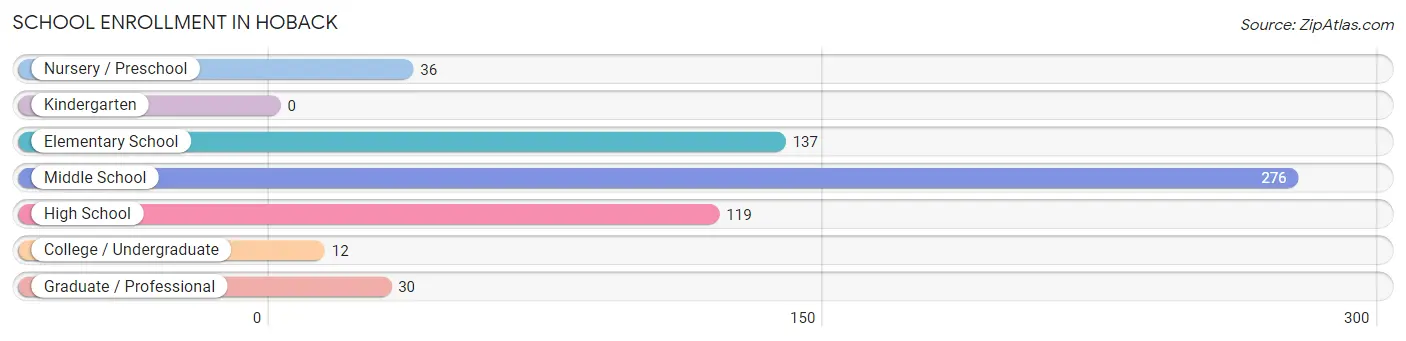
| School Level | # Students | % Students |
| Nursery / Preschool | 36 | 5.9% |
| Kindergarten | 0 | 0.0% |
| Elementary School | 137 | 22.5% |
| Middle School | 276 | 45.3% |
| High School | 119 | 19.5% |
| College / Undergraduate | 12 | 2.0% |
| Graduate / Professional | 30 | 4.9% |
| Total | 610 | 100.0% |
School Enrollment by Age by Funding Source in Hoback
Out of a total of 610 students who are enrolled in schools in Hoback, 181 (29.7%) attend a private institution, while the remaining 429 (70.3%) are enrolled in public schools. The age group of 15 to 17 year olds has the highest likelihood of being enrolled in private schools, with 45 (100.0% in the age bracket) enrolled. Conversely, the age group of 3 to 4 year olds has the lowest likelihood of being enrolled in a private school, with 36 (100.0% in the age bracket) attending a public institution.
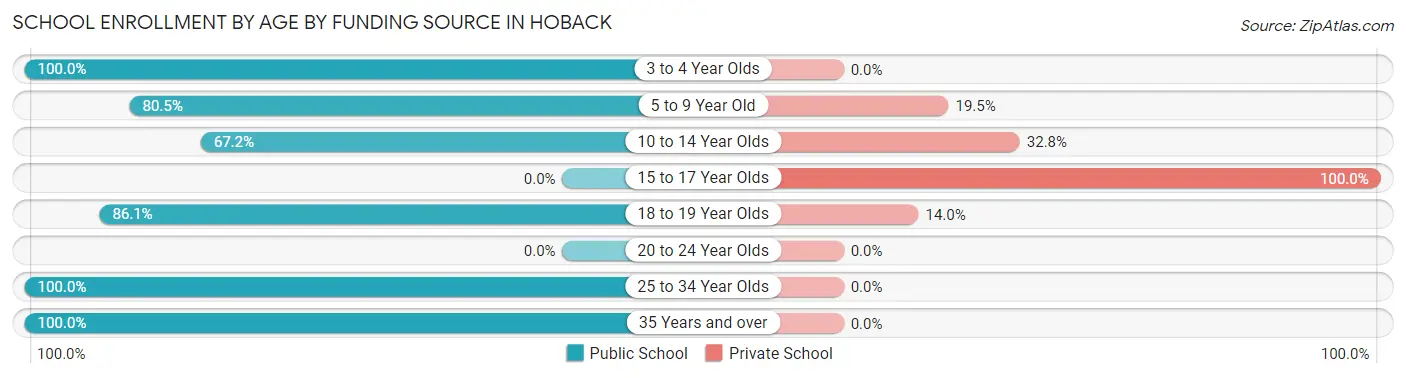
| Age Bracket | Public School | Private School |
| 3 to 4 Year Olds | 36 (100.0%) | 0 (0.0%) |
| 5 to 9 Year Old | 70 (80.5%) | 17 (19.5%) |
| 10 to 14 Year Olds | 219 (67.2%) | 107 (32.8%) |
| 15 to 17 Year Olds | 0 (0.0%) | 45 (100.0%) |
| 18 to 19 Year Olds | 74 (86.1%) | 12 (14.0%) |
| 20 to 24 Year Olds | 0 (0.0%) | 0 (0.0%) |
| 25 to 34 Year Olds | 11 (100.0%) | 0 (0.0%) |
| 35 Years and over | 19 (100.0%) | 0 (0.0%) |
| Total | 429 (70.3%) | 181 (29.7%) |
Educational Attainment by Field of Study in Hoback
Education (108 | 21.4%), bio, nature & agricultural (82 | 16.2%), social sciences (64 | 12.7%), business (62 | 12.3%), and liberal arts & history (49 | 9.7%) are the most common fields of study among 505 individuals in Hoback who have obtained a bachelor's degree or higher.
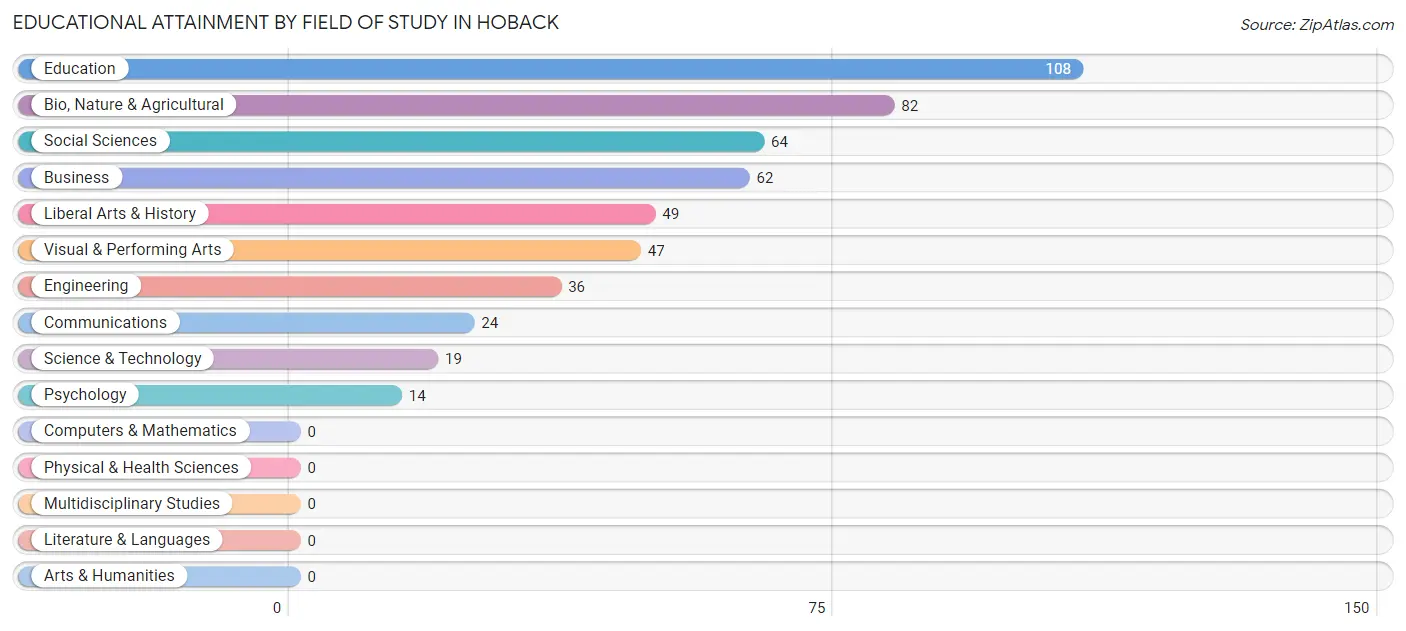
| Field of Study | # Graduates | % Graduates |
| Computers & Mathematics | 0 | 0.0% |
| Bio, Nature & Agricultural | 82 | 16.2% |
| Physical & Health Sciences | 0 | 0.0% |
| Psychology | 14 | 2.8% |
| Social Sciences | 64 | 12.7% |
| Engineering | 36 | 7.1% |
| Multidisciplinary Studies | 0 | 0.0% |
| Science & Technology | 19 | 3.8% |
| Business | 62 | 12.3% |
| Education | 108 | 21.4% |
| Literature & Languages | 0 | 0.0% |
| Liberal Arts & History | 49 | 9.7% |
| Visual & Performing Arts | 47 | 9.3% |
| Communications | 24 | 4.8% |
| Arts & Humanities | 0 | 0.0% |
| Total | 505 | 100.0% |
Transportation & Commute in Hoback
Vehicle Availability by Sex in Hoback
The most prevalent vehicle ownership categories in Hoback are males with 2 vehicles (318, accounting for 54.3%) and females with 2 vehicles (250, making up 72.9%).
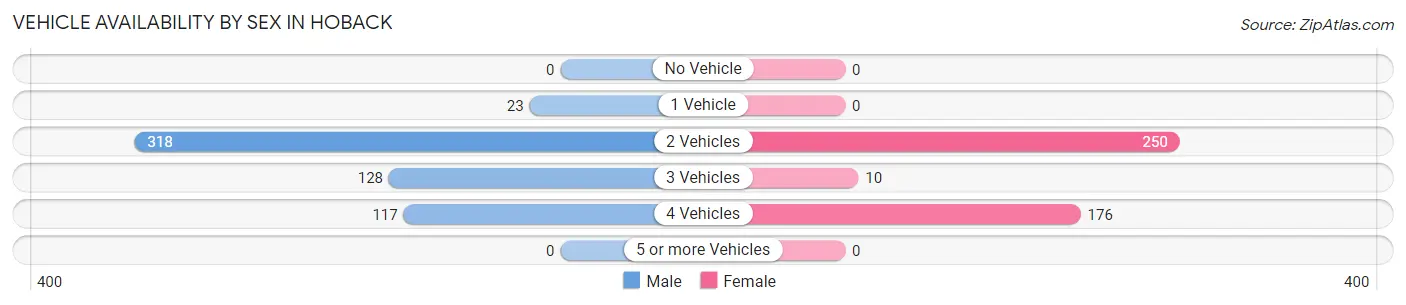
| Vehicles Available | Male | Female |
| No Vehicle | 0 (0.0%) | 0 (0.0%) |
| 1 Vehicle | 23 (3.9%) | 0 (0.0%) |
| 2 Vehicles | 318 (54.3%) | 250 (57.3%) |
| 3 Vehicles | 128 (21.8%) | 10 (2.3%) |
| 4 Vehicles | 117 (20.0%) | 176 (40.4%) |
| 5 or more Vehicles | 0 (0.0%) | 0 (0.0%) |
| Total | 586 (100.0%) | 436 (100.0%) |
Commute Time in Hoback
The most frequently occuring commute durations in Hoback are 20 to 24 minutes (356 commuters, 33.7%), 15 to 19 minutes (267 commuters, 25.2%), and 10 to 14 minutes (184 commuters, 17.4%).
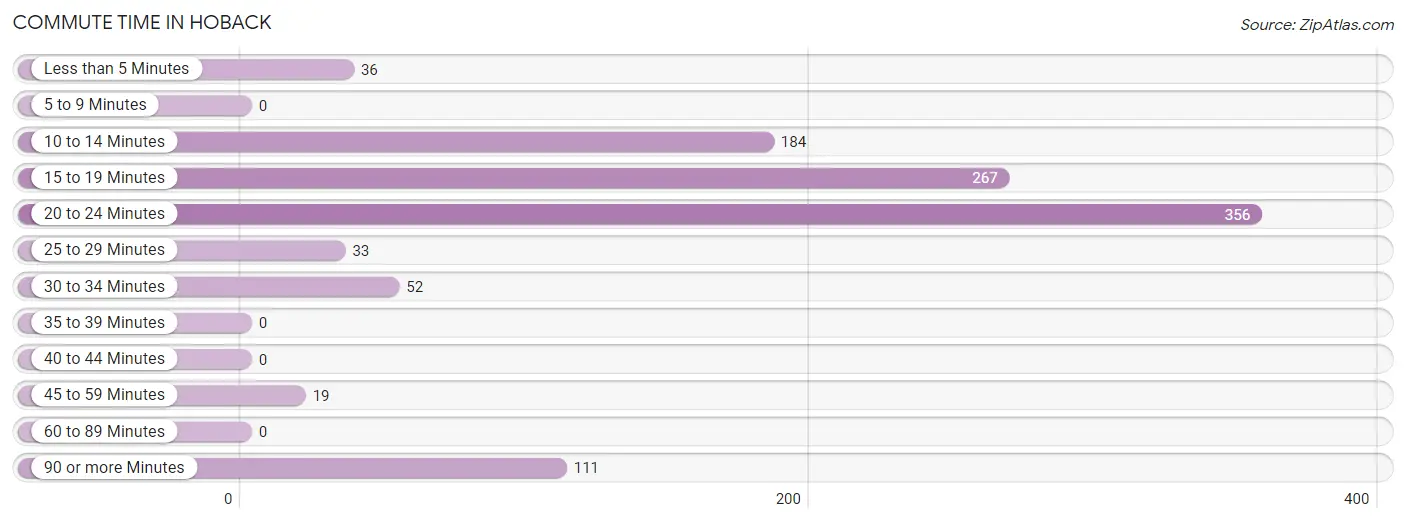
| Commute Time | # Commuters | % Commuters |
| Less than 5 Minutes | 36 | 3.4% |
| 5 to 9 Minutes | 0 | 0.0% |
| 10 to 14 Minutes | 184 | 17.4% |
| 15 to 19 Minutes | 267 | 25.2% |
| 20 to 24 Minutes | 356 | 33.7% |
| 25 to 29 Minutes | 33 | 3.1% |
| 30 to 34 Minutes | 52 | 4.9% |
| 35 to 39 Minutes | 0 | 0.0% |
| 40 to 44 Minutes | 0 | 0.0% |
| 45 to 59 Minutes | 19 | 1.8% |
| 60 to 89 Minutes | 0 | 0.0% |
| 90 or more Minutes | 111 | 10.5% |
Commute Time by Sex in Hoback
The most common commute times in Hoback are 20 to 24 minutes (238 commuters, 39.8%) for males and 15 to 19 minutes (159 commuters, 34.6%) for females.
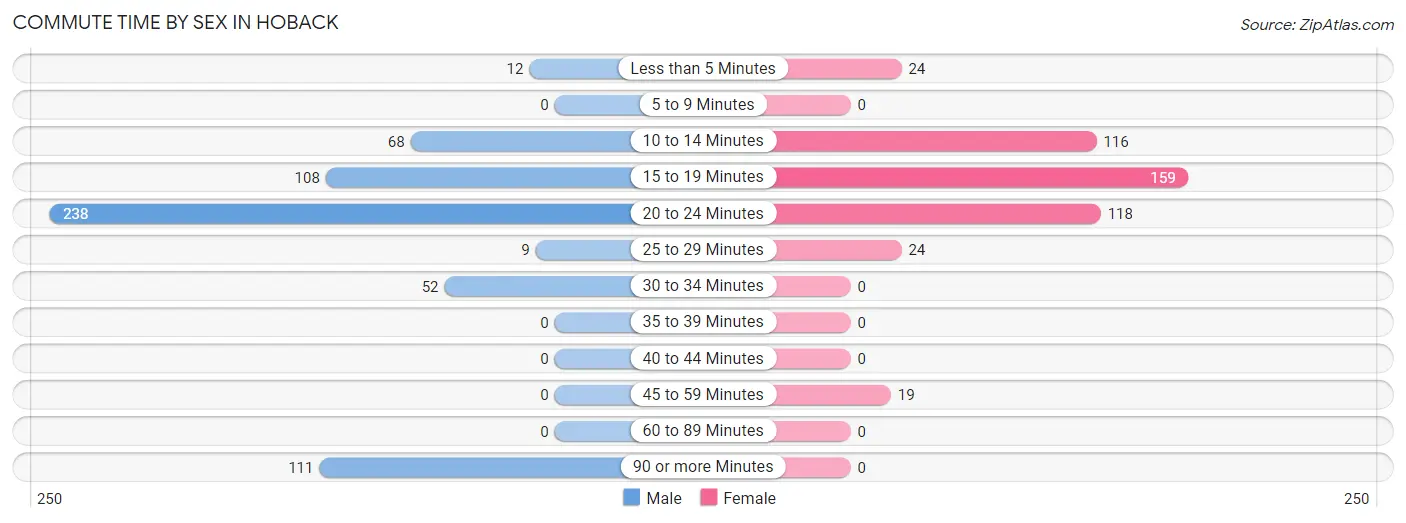
| Commute Time | Male | Female |
| Less than 5 Minutes | 12 (2.0%) | 24 (5.2%) |
| 5 to 9 Minutes | 0 (0.0%) | 0 (0.0%) |
| 10 to 14 Minutes | 68 (11.4%) | 116 (25.2%) |
| 15 to 19 Minutes | 108 (18.1%) | 159 (34.6%) |
| 20 to 24 Minutes | 238 (39.8%) | 118 (25.7%) |
| 25 to 29 Minutes | 9 (1.5%) | 24 (5.2%) |
| 30 to 34 Minutes | 52 (8.7%) | 0 (0.0%) |
| 35 to 39 Minutes | 0 (0.0%) | 0 (0.0%) |
| 40 to 44 Minutes | 0 (0.0%) | 0 (0.0%) |
| 45 to 59 Minutes | 0 (0.0%) | 19 (4.1%) |
| 60 to 89 Minutes | 0 (0.0%) | 0 (0.0%) |
| 90 or more Minutes | 111 (18.6%) | 0 (0.0%) |
Time of Departure to Work by Sex in Hoback
The most frequent times of departure to work in Hoback are 6:30 AM to 6:59 AM (221, 37.0%) for males and 7:30 AM to 7:59 AM (108, 23.5%) for females.
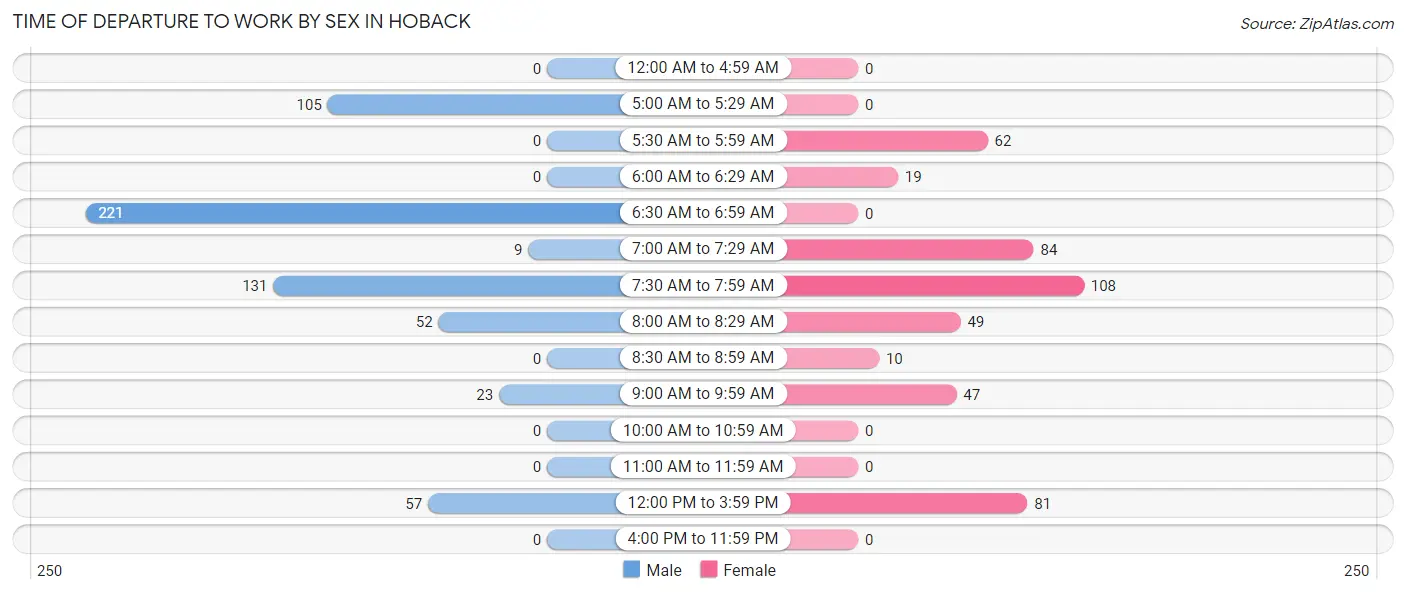
| Time of Departure | Male | Female |
| 12:00 AM to 4:59 AM | 0 (0.0%) | 0 (0.0%) |
| 5:00 AM to 5:29 AM | 105 (17.6%) | 0 (0.0%) |
| 5:30 AM to 5:59 AM | 0 (0.0%) | 62 (13.5%) |
| 6:00 AM to 6:29 AM | 0 (0.0%) | 19 (4.1%) |
| 6:30 AM to 6:59 AM | 221 (37.0%) | 0 (0.0%) |
| 7:00 AM to 7:29 AM | 9 (1.5%) | 84 (18.3%) |
| 7:30 AM to 7:59 AM | 131 (21.9%) | 108 (23.5%) |
| 8:00 AM to 8:29 AM | 52 (8.7%) | 49 (10.6%) |
| 8:30 AM to 8:59 AM | 0 (0.0%) | 10 (2.2%) |
| 9:00 AM to 9:59 AM | 23 (3.8%) | 47 (10.2%) |
| 10:00 AM to 10:59 AM | 0 (0.0%) | 0 (0.0%) |
| 11:00 AM to 11:59 AM | 0 (0.0%) | 0 (0.0%) |
| 12:00 PM to 3:59 PM | 57 (9.5%) | 81 (17.6%) |
| 4:00 PM to 11:59 PM | 0 (0.0%) | 0 (0.0%) |
| Total | 598 (100.0%) | 460 (100.0%) |
Housing Occupancy in Hoback
Occupancy by Ownership in Hoback
Of the total 660 dwellings in Hoback, owner-occupied units account for 476 (72.1%), while renter-occupied units make up 184 (27.9%).
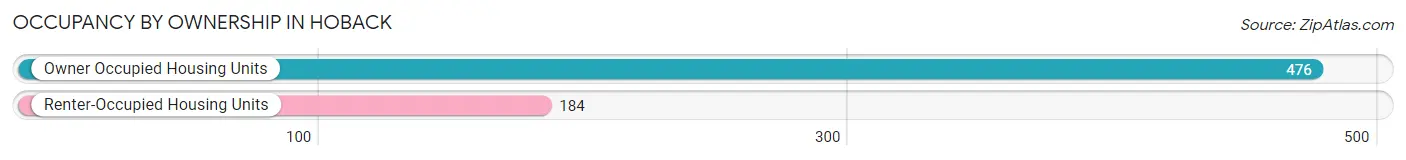
| Occupancy | # Housing Units | % Housing Units |
| Owner Occupied Housing Units | 476 | 72.1% |
| Renter-Occupied Housing Units | 184 | 27.9% |
| Total Occupied Housing Units | 660 | 100.0% |
Occupancy by Household Size in Hoback
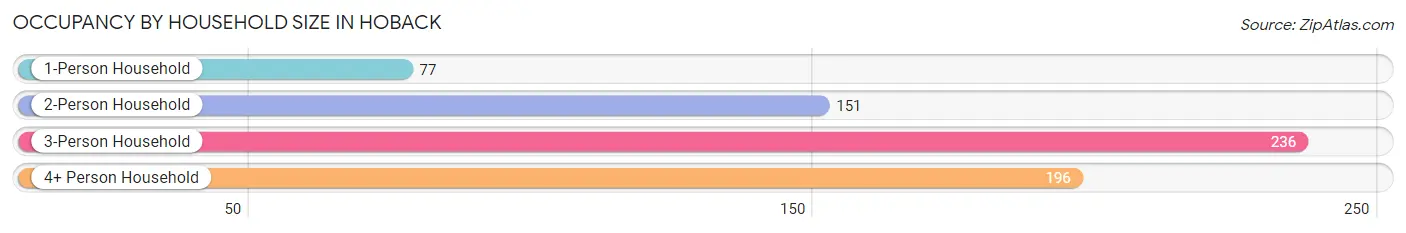
| Household Size | # Housing Units | % Housing Units |
| 1-Person Household | 77 | 11.7% |
| 2-Person Household | 151 | 22.9% |
| 3-Person Household | 236 | 35.8% |
| 4+ Person Household | 196 | 29.7% |
| Total Housing Units | 660 | 100.0% |
Occupancy by Ownership by Household Size in Hoback
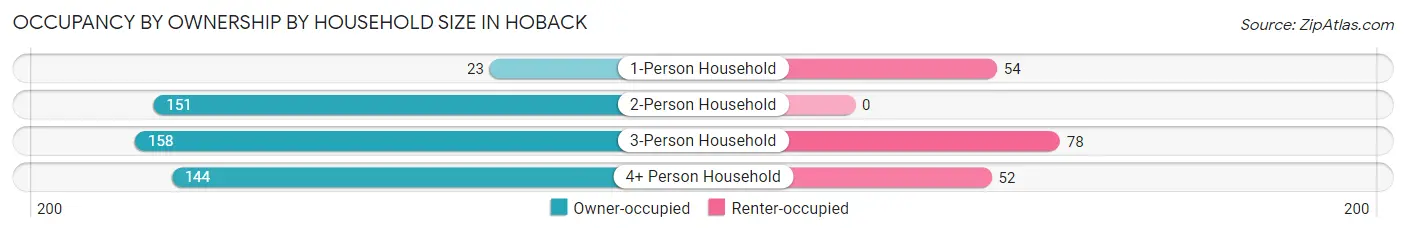
| Household Size | Owner-occupied | Renter-occupied |
| 1-Person Household | 23 (29.9%) | 54 (70.1%) |
| 2-Person Household | 151 (100.0%) | 0 (0.0%) |
| 3-Person Household | 158 (66.9%) | 78 (33.1%) |
| 4+ Person Household | 144 (73.5%) | 52 (26.5%) |
| Total Housing Units | 476 (72.1%) | 184 (27.9%) |
Occupancy by Educational Attainment in Hoback
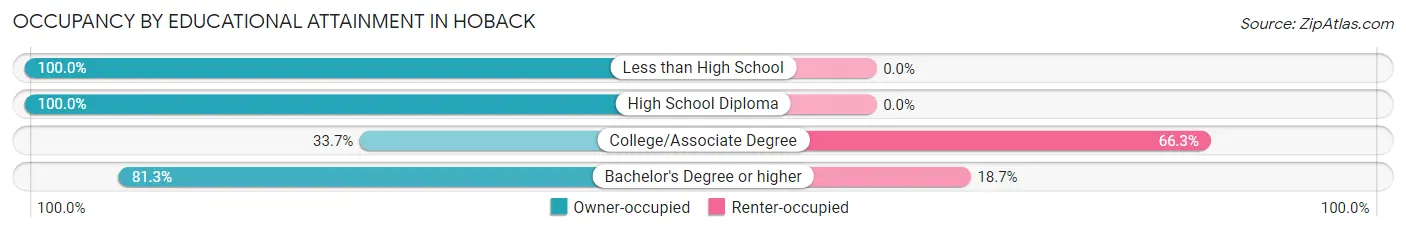
| Household Size | Owner-occupied | Renter-occupied |
| Less than High School | 23 (100.0%) | 0 (0.0%) |
| High School Diploma | 152 (100.0%) | 0 (0.0%) |
| College/Associate Degree | 66 (33.7%) | 130 (66.3%) |
| Bachelor's Degree or higher | 235 (81.3%) | 54 (18.7%) |
Occupancy by Age of Householder in Hoback
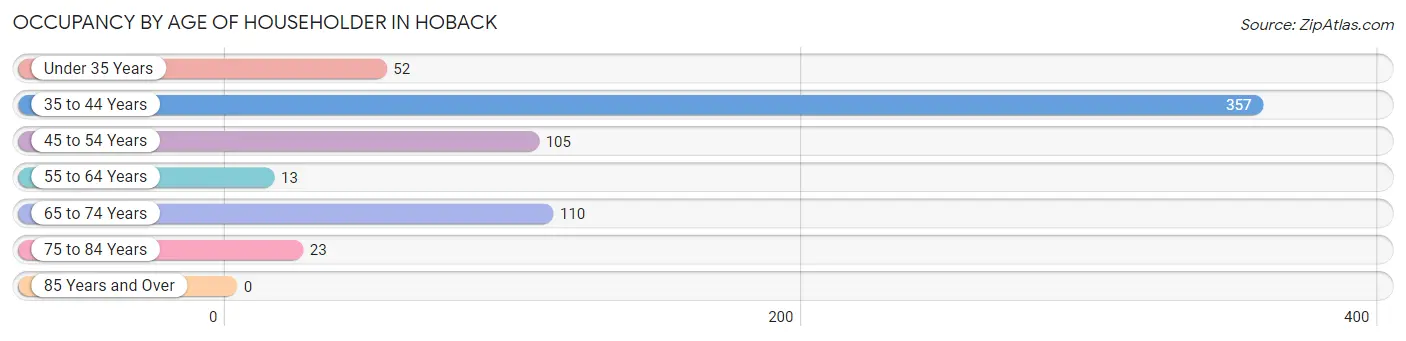
| Age Bracket | # Households | % Households |
| Under 35 Years | 52 | 7.9% |
| 35 to 44 Years | 357 | 54.1% |
| 45 to 54 Years | 105 | 15.9% |
| 55 to 64 Years | 13 | 2.0% |
| 65 to 74 Years | 110 | 16.7% |
| 75 to 84 Years | 23 | 3.5% |
| 85 Years and Over | 0 | 0.0% |
| Total | 660 | 100.0% |
Housing Finances in Hoback
Median Income by Occupancy in Hoback
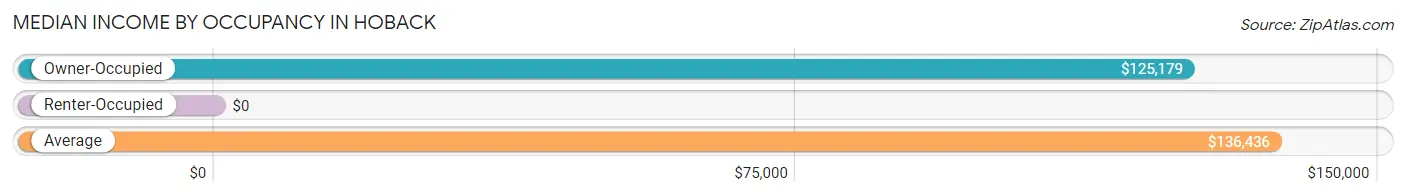
| Occupancy Type | # Households | Median Income |
| Owner-Occupied | 476 (72.1%) | $125,179 |
| Renter-Occupied | 184 (27.9%) | $0 |
| Average | 660 (100.0%) | $136,436 |
Occupancy by Householder Income Bracket in Hoback
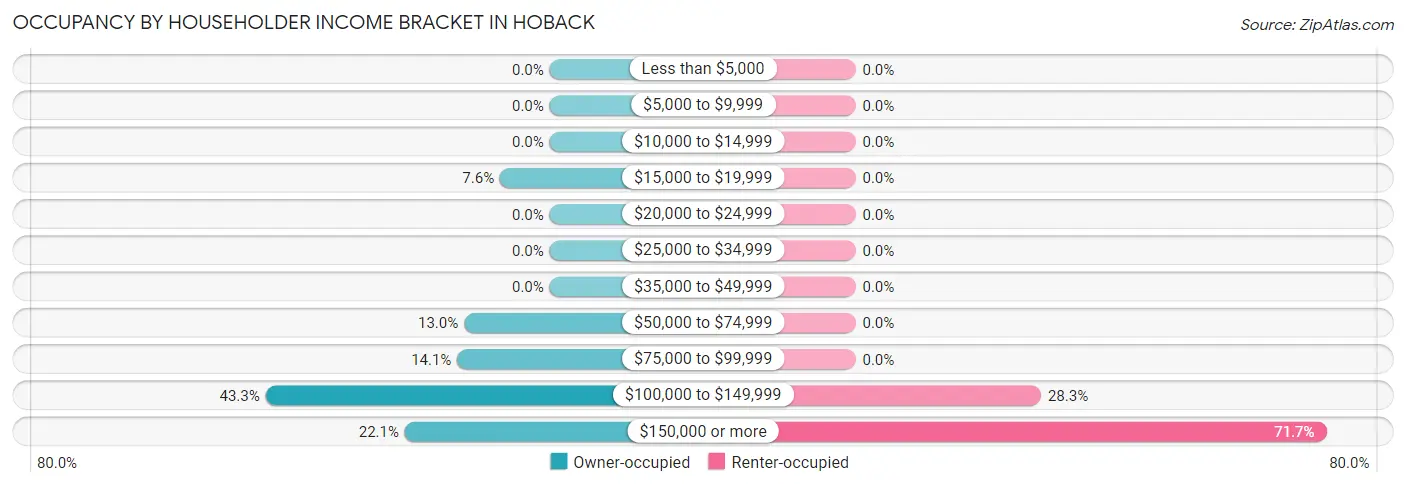
| Income Bracket | Owner-occupied | Renter-occupied |
| Less than $5,000 | 0 (0.0%) | 0 (0.0%) |
| $5,000 to $9,999 | 0 (0.0%) | 0 (0.0%) |
| $10,000 to $14,999 | 0 (0.0%) | 0 (0.0%) |
| $15,000 to $19,999 | 36 (7.6%) | 0 (0.0%) |
| $20,000 to $24,999 | 0 (0.0%) | 0 (0.0%) |
| $25,000 to $34,999 | 0 (0.0%) | 0 (0.0%) |
| $35,000 to $49,999 | 0 (0.0%) | 0 (0.0%) |
| $50,000 to $74,999 | 62 (13.0%) | 0 (0.0%) |
| $75,000 to $99,999 | 67 (14.1%) | 0 (0.0%) |
| $100,000 to $149,999 | 206 (43.3%) | 52 (28.3%) |
| $150,000 or more | 105 (22.1%) | 132 (71.7%) |
| Total | 476 (100.0%) | 184 (100.0%) |
Monthly Housing Cost Tiers in Hoback
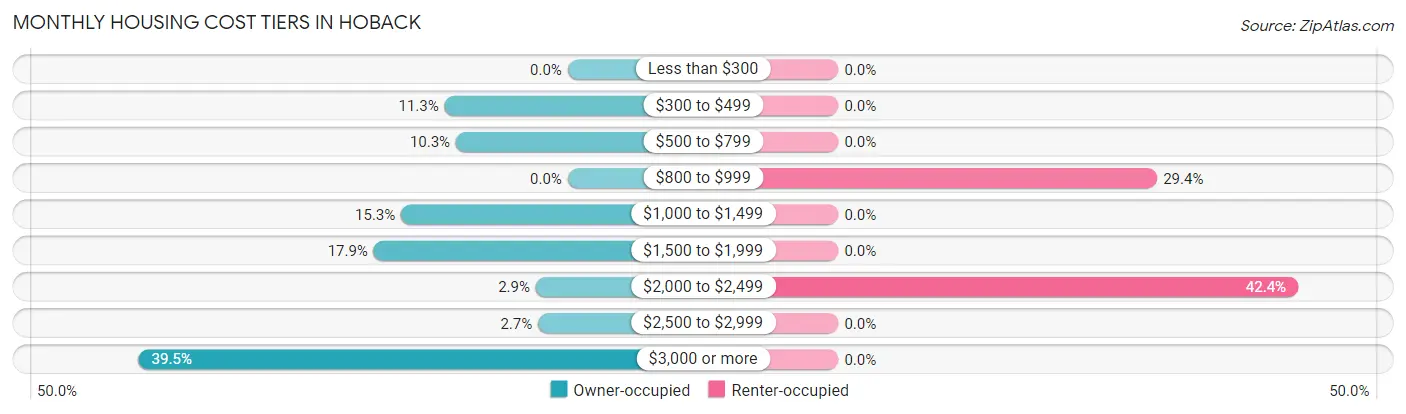
| Monthly Cost | Owner-occupied | Renter-occupied |
| Less than $300 | 0 (0.0%) | 0 (0.0%) |
| $300 to $499 | 54 (11.3%) | 0 (0.0%) |
| $500 to $799 | 49 (10.3%) | 0 (0.0%) |
| $800 to $999 | 0 (0.0%) | 54 (29.3%) |
| $1,000 to $1,499 | 73 (15.3%) | 0 (0.0%) |
| $1,500 to $1,999 | 85 (17.9%) | 0 (0.0%) |
| $2,000 to $2,499 | 14 (2.9%) | 78 (42.4%) |
| $2,500 to $2,999 | 13 (2.7%) | 0 (0.0%) |
| $3,000 or more | 188 (39.5%) | 0 (0.0%) |
| Total | 476 (100.0%) | 184 (100.0%) |
Physical Housing Characteristics in Hoback
Housing Structures in Hoback
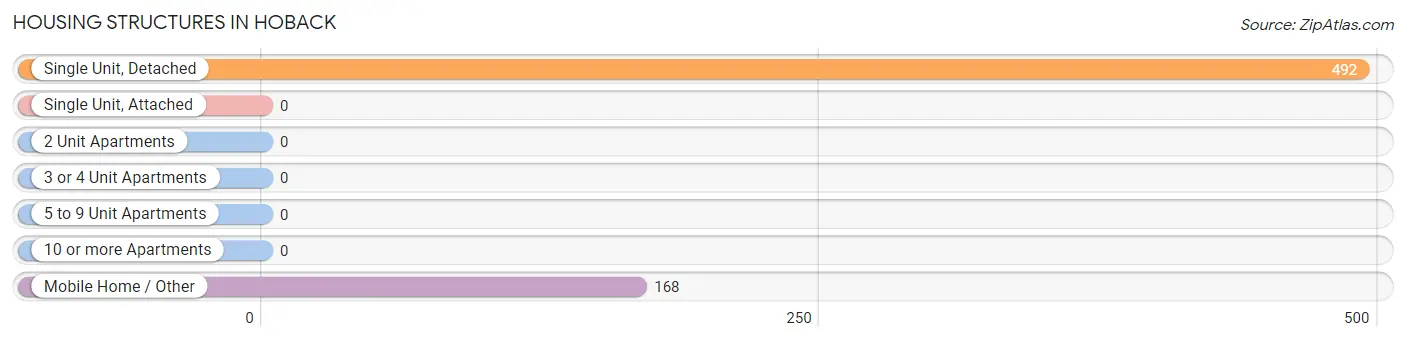
| Structure Type | # Housing Units | % Housing Units |
| Single Unit, Detached | 492 | 74.6% |
| Single Unit, Attached | 0 | 0.0% |
| 2 Unit Apartments | 0 | 0.0% |
| 3 or 4 Unit Apartments | 0 | 0.0% |
| 5 to 9 Unit Apartments | 0 | 0.0% |
| 10 or more Apartments | 0 | 0.0% |
| Mobile Home / Other | 168 | 25.5% |
| Total | 660 | 100.0% |
Housing Structures by Occupancy in Hoback
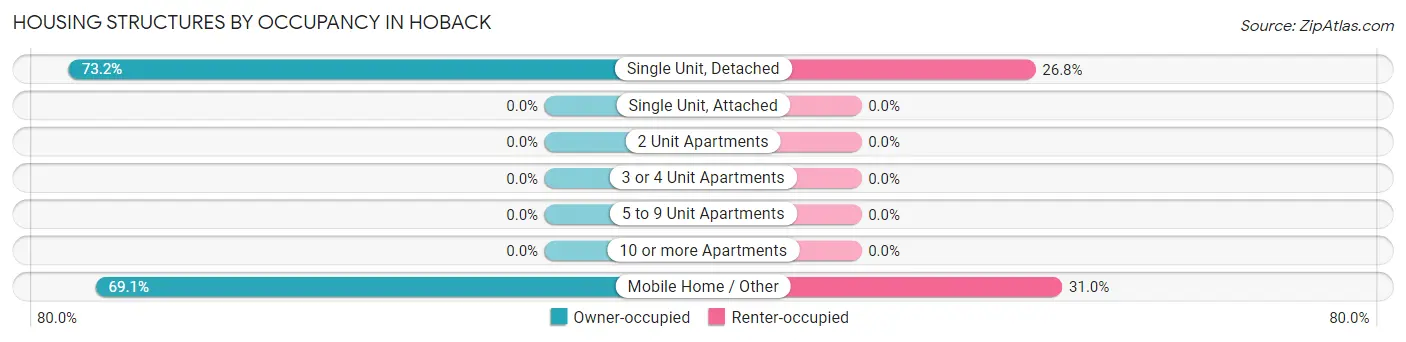
| Structure Type | Owner-occupied | Renter-occupied |
| Single Unit, Detached | 360 (73.2%) | 132 (26.8%) |
| Single Unit, Attached | 0 (0.0%) | 0 (0.0%) |
| 2 Unit Apartments | 0 (0.0%) | 0 (0.0%) |
| 3 or 4 Unit Apartments | 0 (0.0%) | 0 (0.0%) |
| 5 to 9 Unit Apartments | 0 (0.0%) | 0 (0.0%) |
| 10 or more Apartments | 0 (0.0%) | 0 (0.0%) |
| Mobile Home / Other | 116 (69.1%) | 52 (30.9%) |
| Total | 476 (72.1%) | 184 (27.9%) |
Housing Structures by Number of Rooms in Hoback
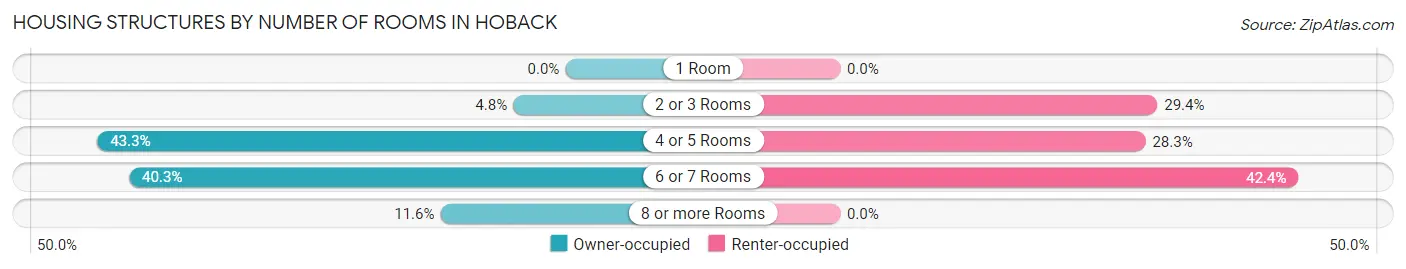
| Number of Rooms | Owner-occupied | Renter-occupied |
| 1 Room | 0 (0.0%) | 0 (0.0%) |
| 2 or 3 Rooms | 23 (4.8%) | 54 (29.3%) |
| 4 or 5 Rooms | 206 (43.3%) | 52 (28.3%) |
| 6 or 7 Rooms | 192 (40.3%) | 78 (42.4%) |
| 8 or more Rooms | 55 (11.6%) | 0 (0.0%) |
| Total | 476 (100.0%) | 184 (100.0%) |
Housing Structure by Heating Type in Hoback
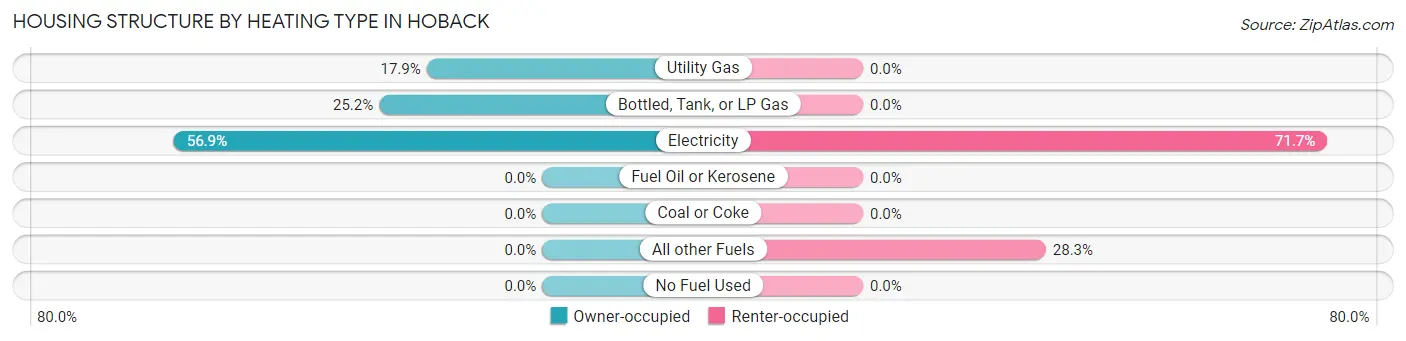
| Heating Type | Owner-occupied | Renter-occupied |
| Utility Gas | 85 (17.9%) | 0 (0.0%) |
| Bottled, Tank, or LP Gas | 120 (25.2%) | 0 (0.0%) |
| Electricity | 271 (56.9%) | 132 (71.7%) |
| Fuel Oil or Kerosene | 0 (0.0%) | 0 (0.0%) |
| Coal or Coke | 0 (0.0%) | 0 (0.0%) |
| All other Fuels | 0 (0.0%) | 52 (28.3%) |
| No Fuel Used | 0 (0.0%) | 0 (0.0%) |
| Total | 476 (100.0%) | 184 (100.0%) |
Household Vehicle Usage in Hoback
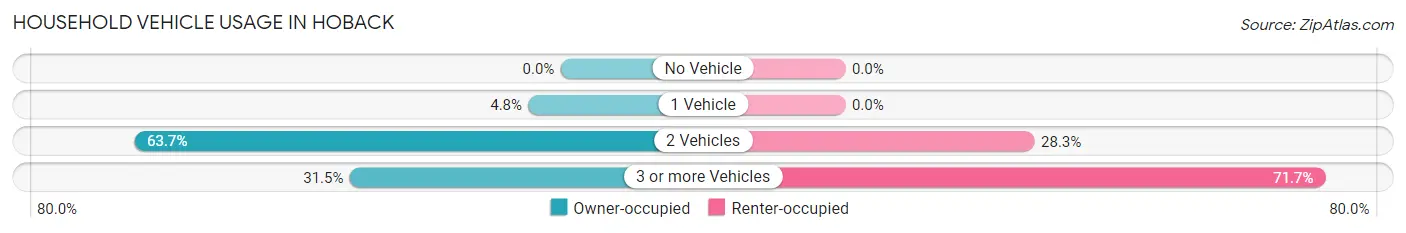
| Vehicles per Household | Owner-occupied | Renter-occupied |
| No Vehicle | 0 (0.0%) | 0 (0.0%) |
| 1 Vehicle | 23 (4.8%) | 0 (0.0%) |
| 2 Vehicles | 303 (63.7%) | 52 (28.3%) |
| 3 or more Vehicles | 150 (31.5%) | 132 (71.7%) |
| Total | 476 (100.0%) | 184 (100.0%) |
Real Estate & Mortgages in Hoback
Real Estate and Mortgage Overview in Hoback
| Characteristic | Without Mortgage | With Mortgage |
| Housing Units | 145 | 331 |
| Median Property Value | $1,251,700 | $1,074,200 |
| Median Household Income | $140,805 | $82 |
| Monthly Housing Costs | $1,032 | $188 |
| Real Estate Taxes | $4,594 | $0 |
Property Value by Mortgage Status in Hoback
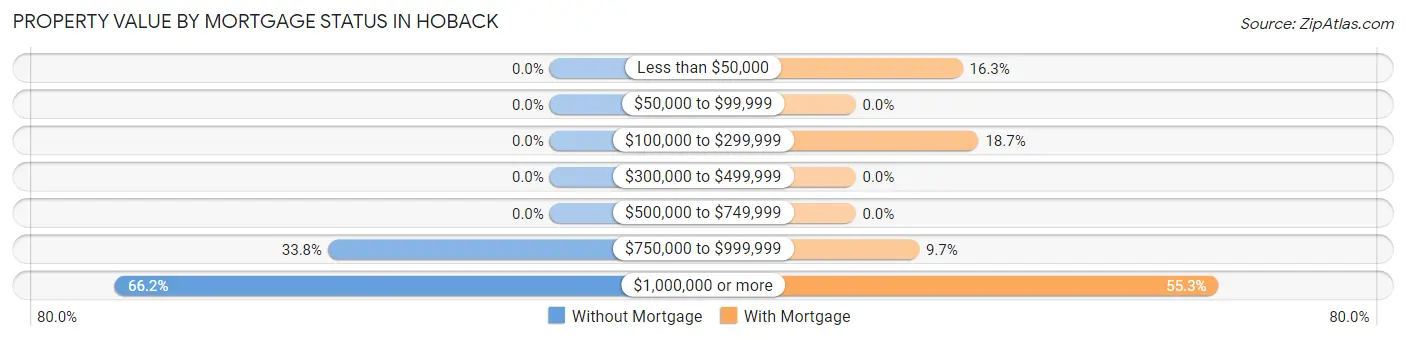
| Property Value | Without Mortgage | With Mortgage |
| Less than $50,000 | 0 (0.0%) | 54 (16.3%) |
| $50,000 to $99,999 | 0 (0.0%) | 0 (0.0%) |
| $100,000 to $299,999 | 0 (0.0%) | 62 (18.7%) |
| $300,000 to $499,999 | 0 (0.0%) | 0 (0.0%) |
| $500,000 to $749,999 | 0 (0.0%) | 0 (0.0%) |
| $750,000 to $999,999 | 49 (33.8%) | 32 (9.7%) |
| $1,000,000 or more | 96 (66.2%) | 183 (55.3%) |
| Total | 145 (100.0%) | 331 (100.0%) |
Household Income by Mortgage Status in Hoback
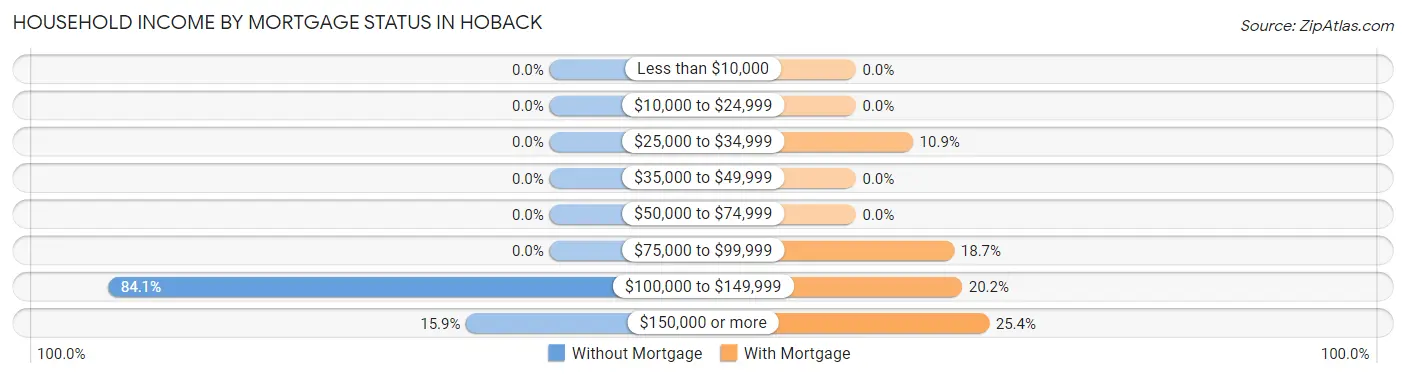
| Household Income | Without Mortgage | With Mortgage |
| Less than $10,000 | 0 (0.0%) | 0 (0.0%) |
| $10,000 to $24,999 | 0 (0.0%) | 0 (0.0%) |
| $25,000 to $34,999 | 0 (0.0%) | 36 (10.9%) |
| $35,000 to $49,999 | 0 (0.0%) | 0 (0.0%) |
| $50,000 to $74,999 | 0 (0.0%) | 0 (0.0%) |
| $75,000 to $99,999 | 0 (0.0%) | 62 (18.7%) |
| $100,000 to $149,999 | 122 (84.1%) | 67 (20.2%) |
| $150,000 or more | 23 (15.9%) | 84 (25.4%) |
| Total | 145 (100.0%) | 331 (100.0%) |
Property Value to Household Income Ratio in Hoback
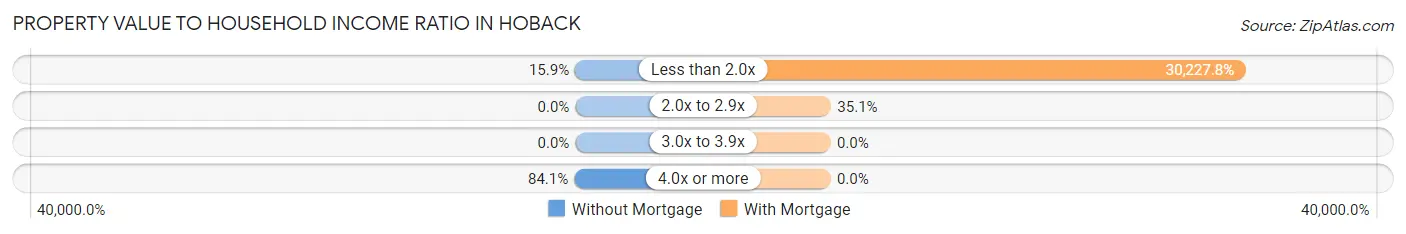
| Value-to-Income Ratio | Without Mortgage | With Mortgage |
| Less than 2.0x | 23 (15.9%) | 100,054 (30,227.8%) |
| 2.0x to 2.9x | 0 (0.0%) | 116 (35.0%) |
| 3.0x to 3.9x | 0 (0.0%) | 0 (0.0%) |
| 4.0x or more | 122 (84.1%) | 0 (0.0%) |
| Total | 145 (100.0%) | 331 (100.0%) |
Real Estate Taxes by Mortgage Status in Hoback
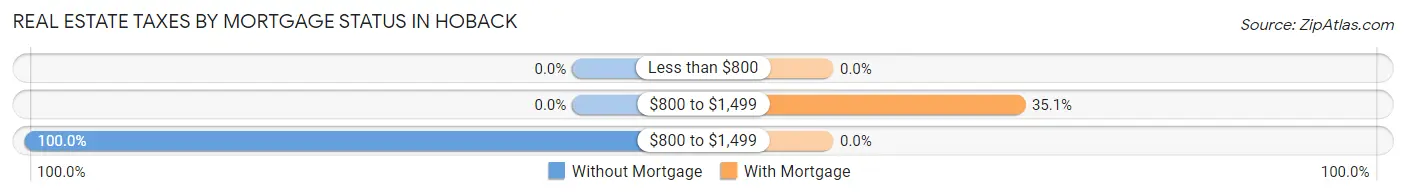
| Property Taxes | Without Mortgage | With Mortgage |
| Less than $800 | 0 (0.0%) | 0 (0.0%) |
| $800 to $1,499 | 0 (0.0%) | 116 (35.0%) |
| $800 to $1,499 | 145 (100.0%) | 0 (0.0%) |
| Total | 145 (100.0%) | 331 (100.0%) |
Health & Disability in Hoback
Health Insurance Coverage by Age in Hoback
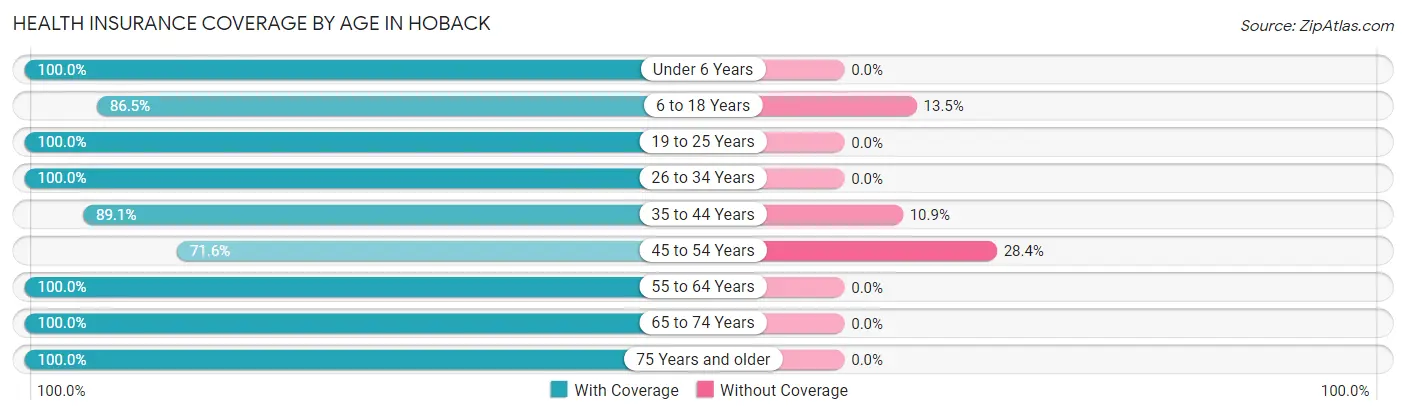
| Age Bracket | With Coverage | Without Coverage |
| Under 6 Years | 74 (100.0%) | 0 (0.0%) |
| 6 to 18 Years | 571 (86.5%) | 89 (13.5%) |
| 19 to 25 Years | 25 (100.0%) | 0 (0.0%) |
| 26 to 34 Years | 82 (100.0%) | 0 (0.0%) |
| 35 to 44 Years | 507 (89.1%) | 62 (10.9%) |
| 45 to 54 Years | 136 (71.6%) | 54 (28.4%) |
| 55 to 64 Years | 78 (100.0%) | 0 (0.0%) |
| 65 to 74 Years | 154 (100.0%) | 0 (0.0%) |
| 75 Years and older | 42 (100.0%) | 0 (0.0%) |
| Total | 1,669 (89.1%) | 205 (10.9%) |
Health Insurance Coverage by Citizenship Status in Hoback
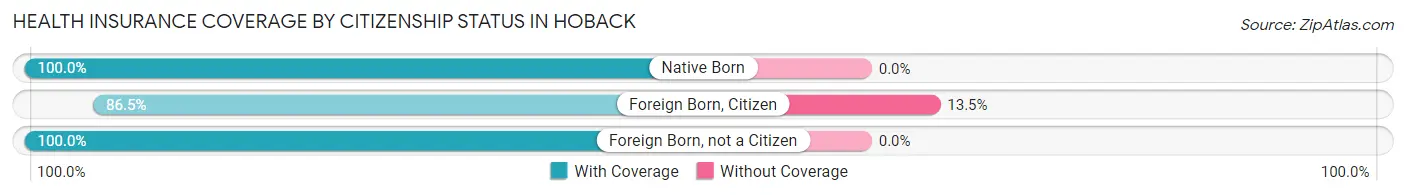
| Citizenship Status | With Coverage | Without Coverage |
| Native Born | 74 (100.0%) | 0 (0.0%) |
| Foreign Born, Citizen | 571 (86.5%) | 89 (13.5%) |
| Foreign Born, not a Citizen | 25 (100.0%) | 0 (0.0%) |
Health Insurance Coverage by Household Income in Hoback
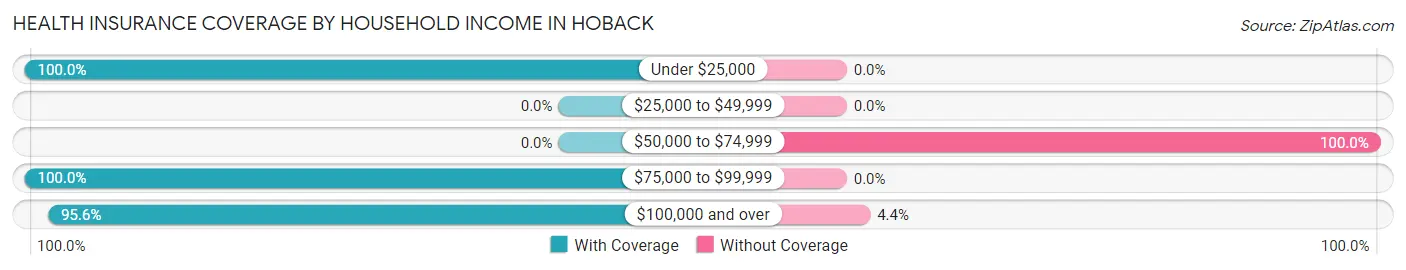
| Household Income | With Coverage | Without Coverage |
| Under $25,000 | 200 (100.0%) | 0 (0.0%) |
| $25,000 to $49,999 | 0 (0.0%) | 0 (0.0%) |
| $50,000 to $74,999 | 0 (0.0%) | 151 (100.0%) |
| $75,000 to $99,999 | 256 (100.0%) | 0 (0.0%) |
| $100,000 and over | 1,177 (95.6%) | 54 (4.4%) |
Public vs Private Health Insurance Coverage by Age in Hoback
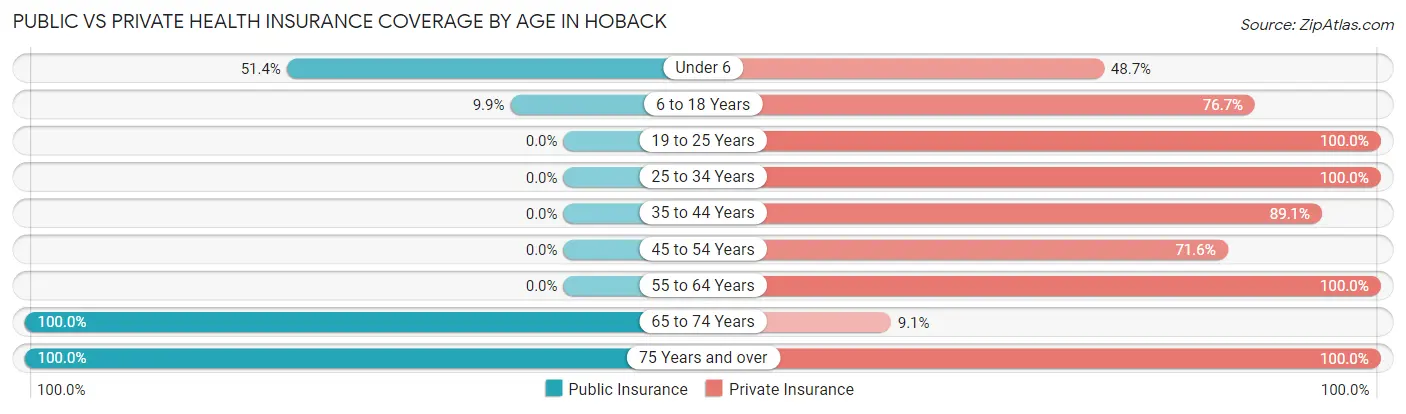
| Age Bracket | Public Insurance | Private Insurance |
| Under 6 | 38 (51.3%) | 36 (48.6%) |
| 6 to 18 Years | 65 (9.9%) | 506 (76.7%) |
| 19 to 25 Years | 0 (0.0%) | 25 (100.0%) |
| 25 to 34 Years | 0 (0.0%) | 82 (100.0%) |
| 35 to 44 Years | 0 (0.0%) | 507 (89.1%) |
| 45 to 54 Years | 0 (0.0%) | 136 (71.6%) |
| 55 to 64 Years | 0 (0.0%) | 78 (100.0%) |
| 65 to 74 Years | 154 (100.0%) | 14 (9.1%) |
| 75 Years and over | 42 (100.0%) | 42 (100.0%) |
| Total | 299 (16.0%) | 1,426 (76.1%) |
Disability Status by Sex by Age in Hoback
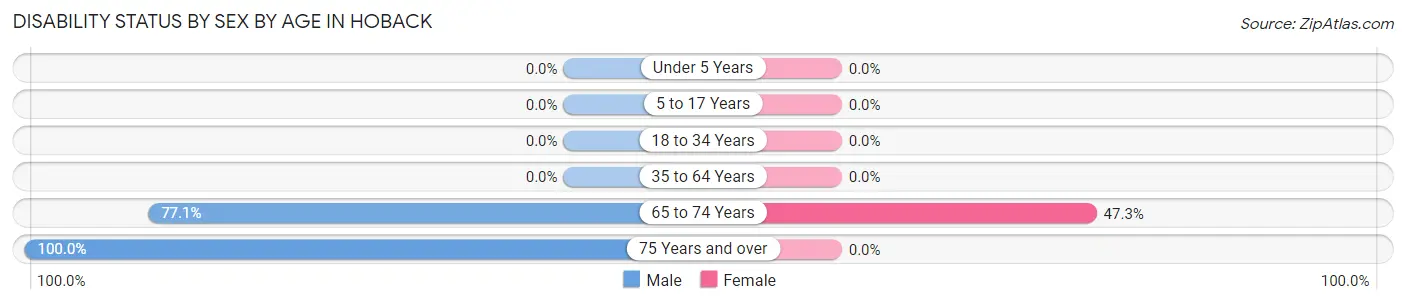
| Age Bracket | Male | Female |
| Under 5 Years | 0 (0.0%) | 0 (0.0%) |
| 5 to 17 Years | 0 (0.0%) | 0 (0.0%) |
| 18 to 34 Years | 0 (0.0%) | 0 (0.0%) |
| 35 to 64 Years | 0 (0.0%) | 0 (0.0%) |
| 65 to 74 Years | 47 (77.0%) | 44 (47.3%) |
| 75 Years and over | 28 (100.0%) | 0 (0.0%) |
Disability Class by Sex by Age in Hoback
Disability Class: Hearing Difficulty
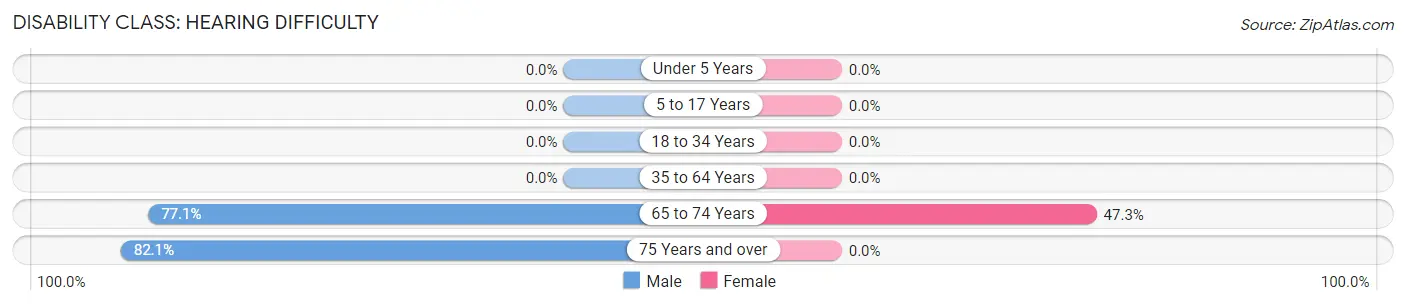
| Age Bracket | Male | Female |
| Under 5 Years | 0 (0.0%) | 0 (0.0%) |
| 5 to 17 Years | 0 (0.0%) | 0 (0.0%) |
| 18 to 34 Years | 0 (0.0%) | 0 (0.0%) |
| 35 to 64 Years | 0 (0.0%) | 0 (0.0%) |
| 65 to 74 Years | 47 (77.0%) | 44 (47.3%) |
| 75 Years and over | 23 (82.1%) | 0 (0.0%) |
Disability Class: Vision Difficulty
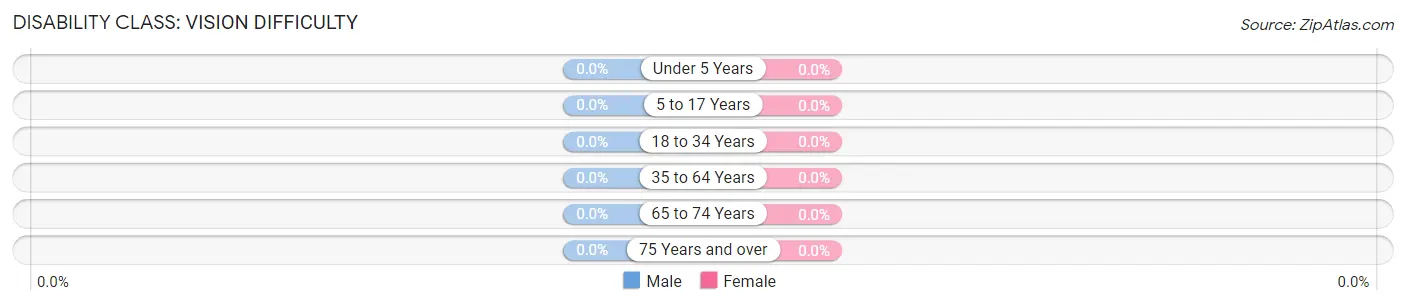
| Age Bracket | Male | Female |
| Under 5 Years | 0 (0.0%) | 0 (0.0%) |
| 5 to 17 Years | 0 (0.0%) | 0 (0.0%) |
| 18 to 34 Years | 0 (0.0%) | 0 (0.0%) |
| 35 to 64 Years | 0 (0.0%) | 0 (0.0%) |
| 65 to 74 Years | 0 (0.0%) | 0 (0.0%) |
| 75 Years and over | 0 (0.0%) | 0 (0.0%) |
Disability Class: Cognitive Difficulty
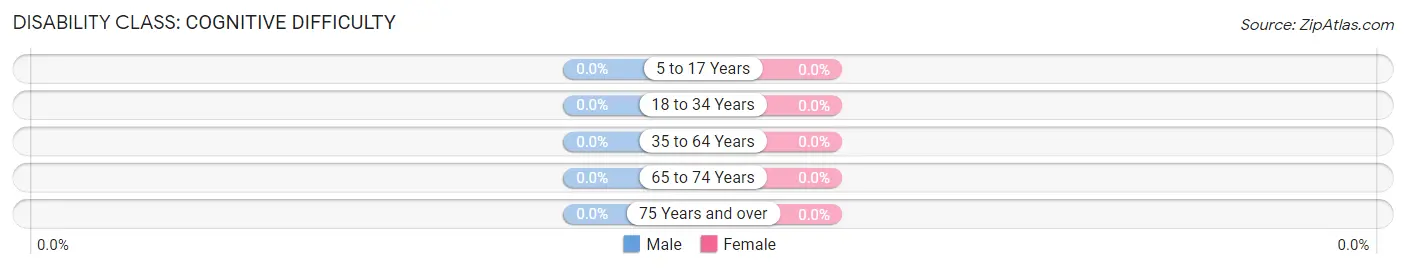
| Age Bracket | Male | Female |
| 5 to 17 Years | 0 (0.0%) | 0 (0.0%) |
| 18 to 34 Years | 0 (0.0%) | 0 (0.0%) |
| 35 to 64 Years | 0 (0.0%) | 0 (0.0%) |
| 65 to 74 Years | 0 (0.0%) | 0 (0.0%) |
| 75 Years and over | 0 (0.0%) | 0 (0.0%) |
Disability Class: Ambulatory Difficulty
| Age Bracket | Male | Female |
| 5 to 17 Years | 0 (0.0%) | 0 (0.0%) |
| 18 to 34 Years | 0 (0.0%) | 0 (0.0%) |
| 35 to 64 Years | 0 (0.0%) | 0 (0.0%) |
| 65 to 74 Years | 0 (0.0%) | 0 (0.0%) |
| 75 Years and over | 0 (0.0%) | 0 (0.0%) |
Disability Class: Self-Care Difficulty
| Age Bracket | Male | Female |
| 5 to 17 Years | 0 (0.0%) | 0 (0.0%) |
| 18 to 34 Years | 0 (0.0%) | 0 (0.0%) |
| 35 to 64 Years | 0 (0.0%) | 0 (0.0%) |
| 65 to 74 Years | 0 (0.0%) | 0 (0.0%) |
| 75 Years and over | 0 (0.0%) | 0 (0.0%) |
Technology Access in Hoback
Computing Device Access in Hoback
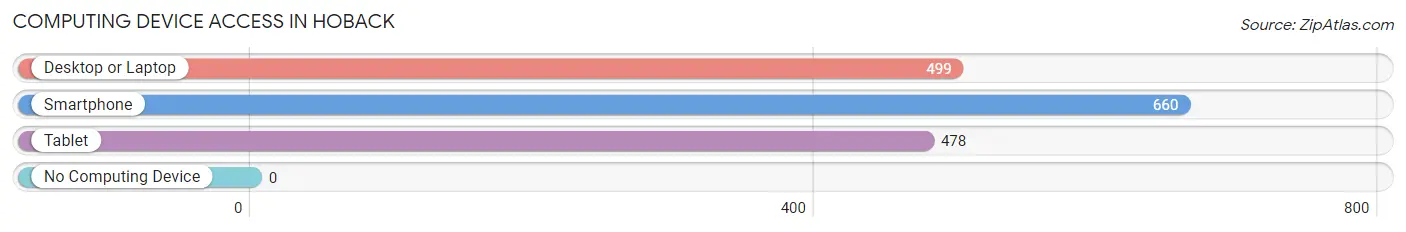
| Device Type | # Households | % Households |
| Desktop or Laptop | 499 | 75.6% |
| Smartphone | 660 | 100.0% |
| Tablet | 478 | 72.4% |
| No Computing Device | 0 | 0.0% |
| Total | 660 | 100.0% |
Internet Access in Hoback
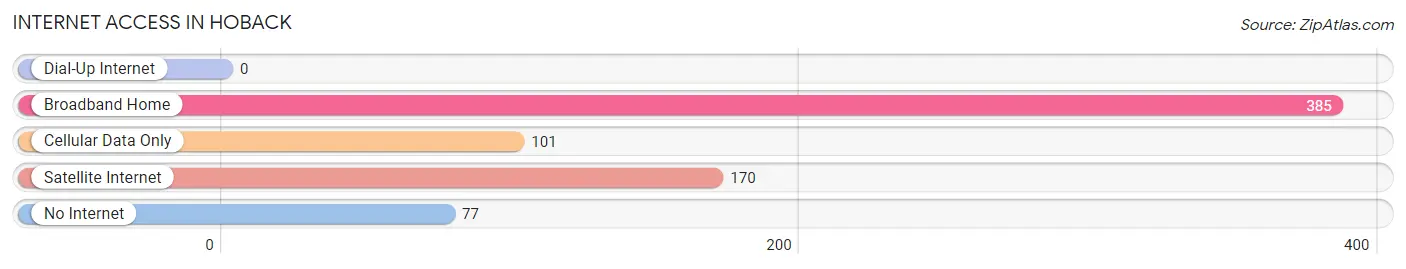
| Internet Type | # Households | % Households |
| Dial-Up Internet | 0 | 0.0% |
| Broadband Home | 385 | 58.3% |
| Cellular Data Only | 101 | 15.3% |
| Satellite Internet | 170 | 25.8% |
| No Internet | 77 | 11.7% |
| Total | 660 | 100.0% |
Hoback Summary
Hoback, Wyoming is a small unincorporated community located in the western part of the state, in Sublette County. It is situated along the Hoback River, which is a tributary of the Snake River. The town is located at the intersection of U.S. Routes 189 and 191, and is approximately 20 miles south of Jackson, Wyoming. The population of Hoback was estimated to be around 200 people in 2020.
History
Hoback was first settled in the late 1800s by ranchers and homesteaders. The town was named after the Hoback River, which was named after a trapper named John Hoback who was killed by Native Americans in 1832. The town was officially established in 1892, and the first post office was established in 1895.
In the early 1900s, the town was a popular stop for travelers on the Oregon Trail. The town also served as a supply center for the nearby mining towns of South Pass City and Atlantic City.
In the 1950s, the town began to decline as the mining industry in the area declined. The town was nearly abandoned by the 1970s, but has since seen a resurgence in population due to its proximity to Jackson and the nearby ski resorts.
Geography
Hoback is located in western Wyoming, in Sublette County. It is situated along the Hoback River, which is a tributary of the Snake River. The town is located at the intersection of U.S. Routes 189 and 191, and is approximately 20 miles south of Jackson, Wyoming.
The town is located in a mountainous region, with the Hoback Mountains to the east and the Wyoming Range to the west. The town is located at an elevation of 6,400 feet above sea level.
Economy
The economy of Hoback is largely based on tourism and recreation. The town is located near several ski resorts, including Jackson Hole Mountain Resort, Grand Targhee Resort, and Snow King Mountain Resort. The town is also a popular destination for hikers, campers, and other outdoor enthusiasts.
In addition to tourism, the town is also home to several small businesses, including restaurants, lodging, and retail stores. The town is also home to a small sawmill, which provides lumber for the local construction industry.
Demographics
The population of Hoback was estimated to be around 200 people in 2020. The town is predominantly white, with a small Hispanic population. The median household income in the town is $50,000, and the median home value is $250,000. The town has a low unemployment rate, and the majority of the population is employed in the tourism and recreation industry.
Common Questions
What is Per Capita Income in Hoback?
Per Capita income in Hoback is $82,791.
What is the Median Family Income in Hoback?
Median Family Income in Hoback is $135,133.
What is the Median Household income in Hoback?
Median Household Income in Hoback is $136,436.
What is Income or Wage Gap in Hoback?
Income or Wage Gap in Hoback is 8.3%.
Women in Hoback earn 91.7 cents for every dollar earned by a man.
What is Inequality or Gini Index in Hoback?
Inequality or Gini Index in Hoback is 0.53.
What is the Total Population of Hoback?
Total Population of Hoback is 1,874.
What is the Total Male Population of Hoback?
Total Male Population of Hoback is 926.
What is the Total Female Population of Hoback?
Total Female Population of Hoback is 948.
What is the Ratio of Males per 100 Females in Hoback?
There are 97.68 Males per 100 Females in Hoback.
What is the Ratio of Females per 100 Males in Hoback?
There are 102.38 Females per 100 Males in Hoback.
What is the Median Population Age in Hoback?
Median Population Age in Hoback is 39.5 Years.
What is the Average Family Size in Hoback
Average Family Size in Hoback is 2.9 People.
What is the Average Household Size in Hoback
Average Household Size in Hoback is 2.8 People.
How Large is the Labor Force in Hoback?
There are 1,071 People in the Labor Forcein in Hoback.
What is the Percentage of People in the Labor Force in Hoback?
85.1% of People are in the Labor Force in Hoback.
What is the Unemployment Rate in Hoback?
Unemployment Rate in Hoback is 1.2%.