Brookhurst, WY Map & Demographics
Brookhurst Map
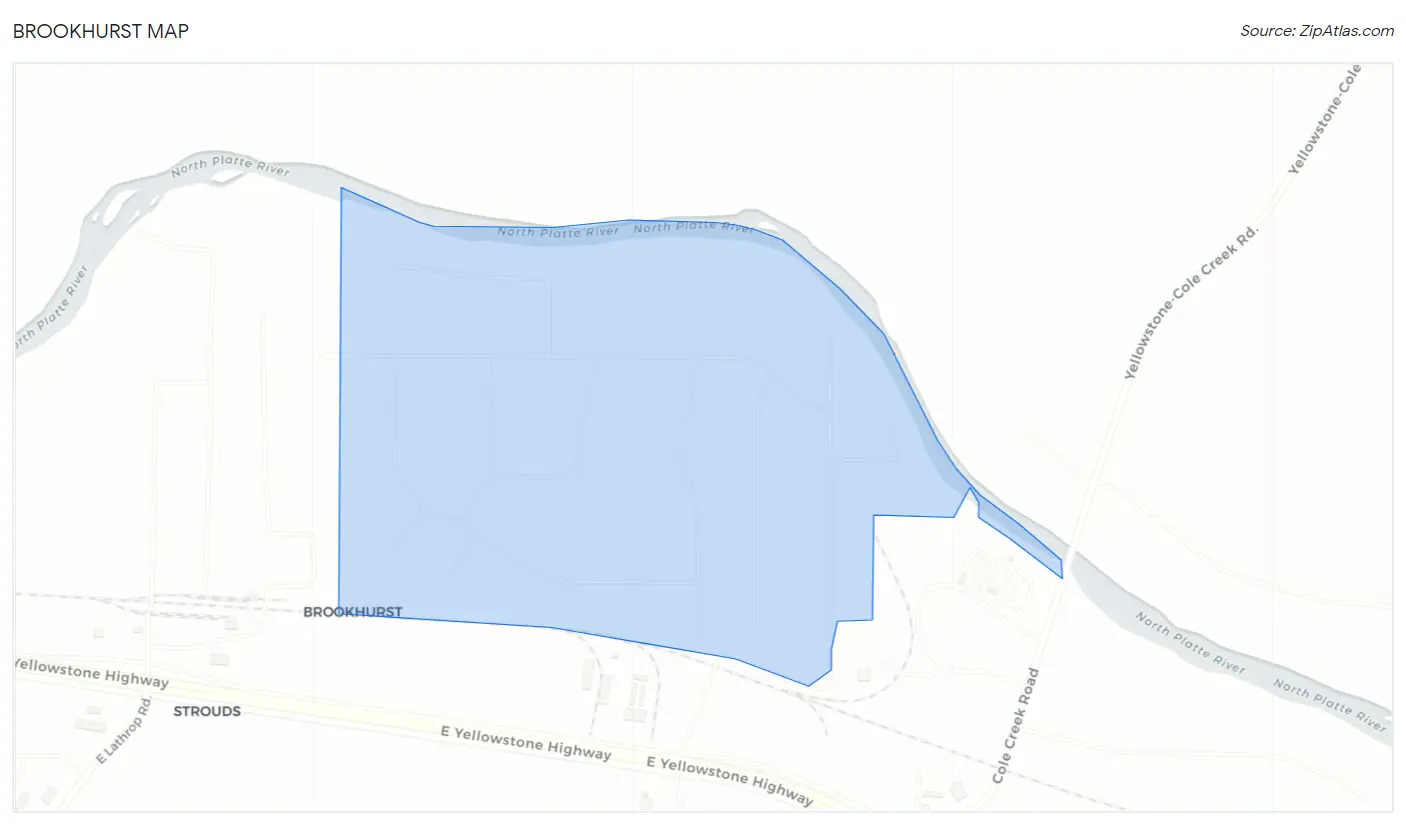
Brookhurst Overview
$39,930
PER CAPITA INCOME
$71,000
AVG HOUSEHOLD INCOME
0.27
INEQUALITY / GINI INDEX
91
TOTAL POPULATION
65
MALE POPULATION
26
FEMALE POPULATION
250.00
MALES / 100 FEMALES
40.00
FEMALES / 100 MALES
62.2
MEDIAN AGE
2.0
AVG FAMILY SIZE
1.7
AVG HOUSEHOLD SIZE
41
LABOR FORCE [ PEOPLE ]
45.1%
PERCENT IN LABOR FORCE
Income in Brookhurst
Income Overview in Brookhurst
| Characteristic | Number | Measure |
| Per Capita Income | 91 | $39,930 |
| Median Family Income | 25 | $0 |
| Mean Family Income | 25 | $0 |
| Median Household Income | 54 | $71,000 |
| Mean Household Income | 54 | $64,883 |
| Income Deficit | 25 | $0 |
| Wage / Income Gap (%) | 91 | 0.00% |
| Wage / Income Gap ($) | 91 | 100.00¢ per $1 |
| Gini / Inequality Index | 91 | 0.27 |
Earnings by Sex in Brookhurst
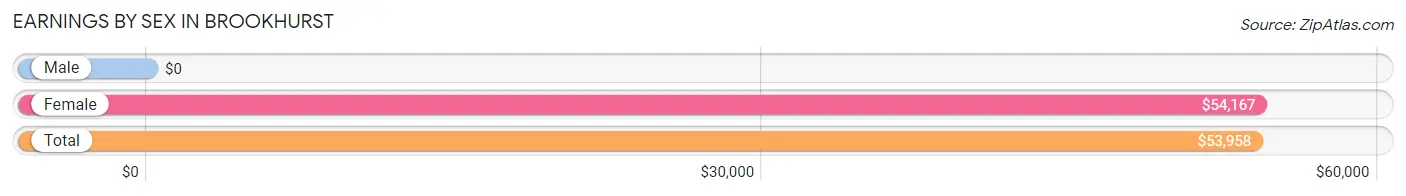
| Sex | Number | Average Earnings |
| Male | 24 (48.0%) | $0 |
| Female | 26 (52.0%) | $54,167 |
| Total | 50 (100.0%) | $53,958 |
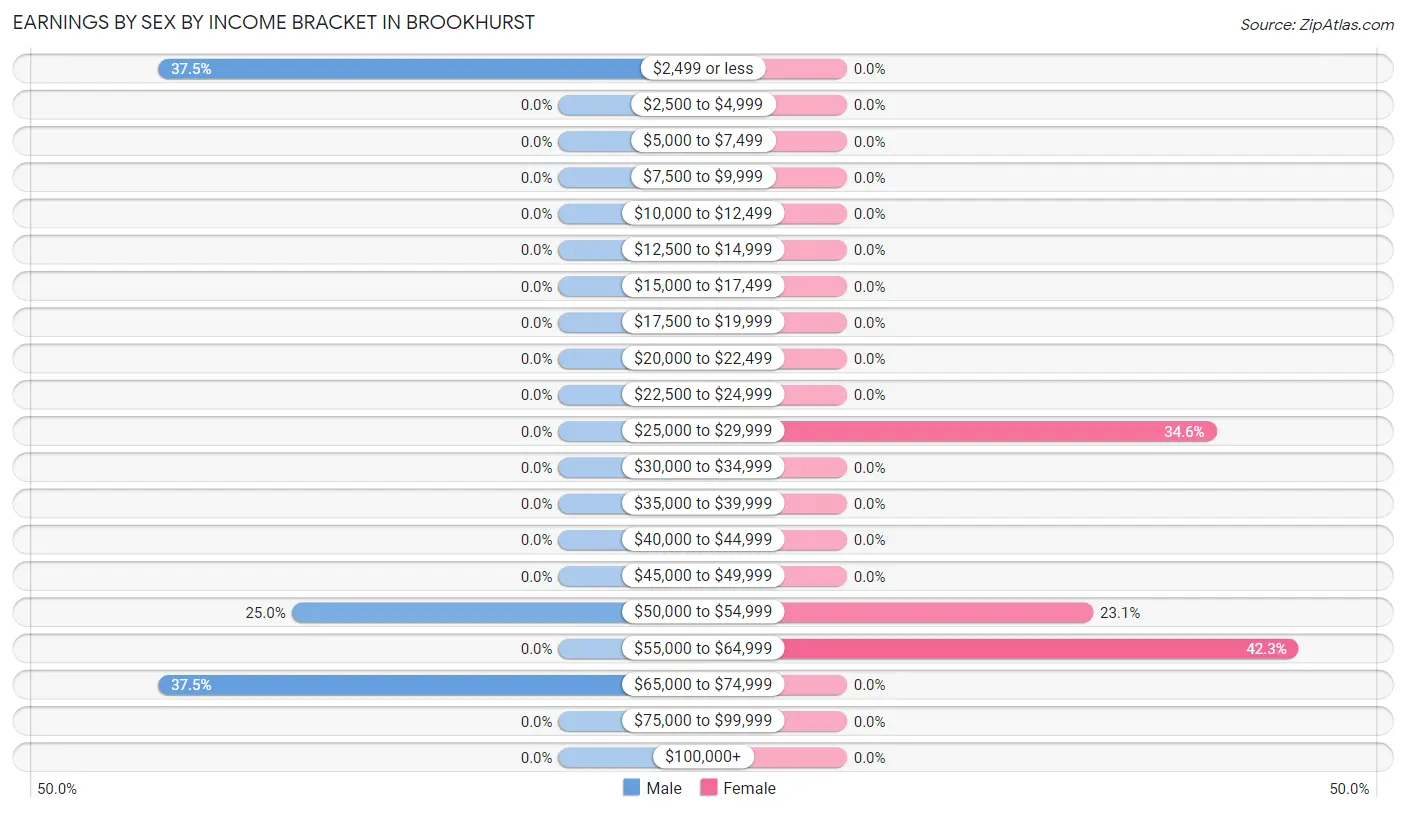
Earnings by Sex by Income Bracket in Brookhurst
The most common earnings brackets in Brookhurst are $2,499 or less for men (9 | 37.5%) and $55,000 to $64,999 for women (11 | 42.3%).
| Income | Male | Female |
| $2,499 or less | 9 (37.5%) | 0 (0.0%) |
| $2,500 to $4,999 | 0 (0.0%) | 0 (0.0%) |
| $5,000 to $7,499 | 0 (0.0%) | 0 (0.0%) |
| $7,500 to $9,999 | 0 (0.0%) | 0 (0.0%) |
| $10,000 to $12,499 | 0 (0.0%) | 0 (0.0%) |
| $12,500 to $14,999 | 0 (0.0%) | 0 (0.0%) |
| $15,000 to $17,499 | 0 (0.0%) | 0 (0.0%) |
| $17,500 to $19,999 | 0 (0.0%) | 0 (0.0%) |
| $20,000 to $22,499 | 0 (0.0%) | 0 (0.0%) |
| $22,500 to $24,999 | 0 (0.0%) | 0 (0.0%) |
| $25,000 to $29,999 | 0 (0.0%) | 9 (34.6%) |
| $30,000 to $34,999 | 0 (0.0%) | 0 (0.0%) |
| $35,000 to $39,999 | 0 (0.0%) | 0 (0.0%) |
| $40,000 to $44,999 | 0 (0.0%) | 0 (0.0%) |
| $45,000 to $49,999 | 0 (0.0%) | 0 (0.0%) |
| $50,000 to $54,999 | 6 (25.0%) | 6 (23.1%) |
| $55,000 to $64,999 | 0 (0.0%) | 11 (42.3%) |
| $65,000 to $74,999 | 9 (37.5%) | 0 (0.0%) |
| $75,000 to $99,999 | 0 (0.0%) | 0 (0.0%) |
| $100,000+ | 0 (0.0%) | 0 (0.0%) |
| Total | 24 (100.0%) | 26 (100.0%) |
Earnings by Sex by Educational Attainment in Brookhurst
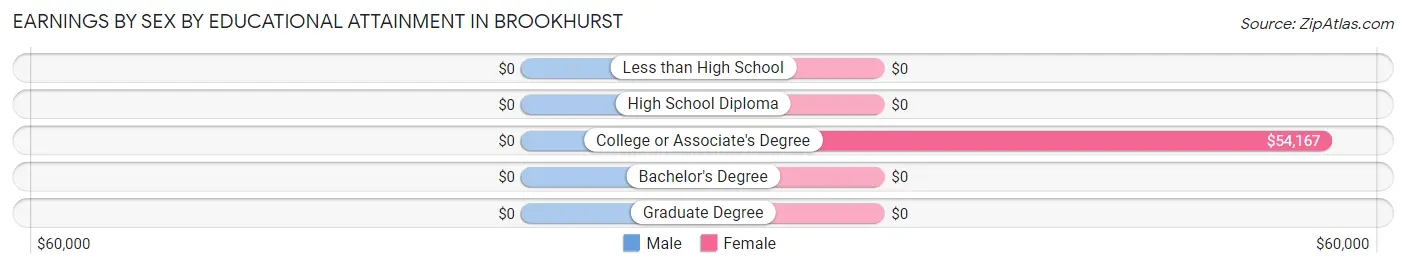
| Educational Attainment | Male Income | Female Income |
| Less than High School | - | - |
| High School Diploma | - | - |
| College or Associate's Degree | - | - |
| Bachelor's Degree | - | - |
| Graduate Degree | - | - |
| Total | - | - |
Family Income in Brookhurst
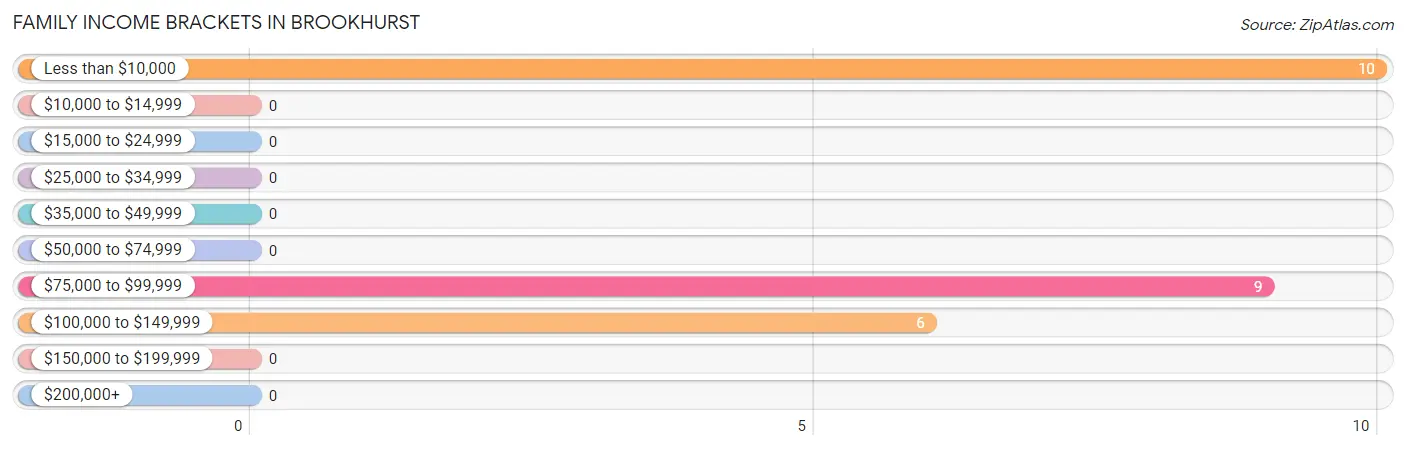
Family Income Brackets in Brookhurst
According to the Brookhurst family income data, there are 10 families falling into the less than $10,000 income range, which is the most common income bracket and makes up 40.0% of all families.
| Income Bracket | # Families | % Families |
| Less than $10,000 | 10 | 40.0% |
| $10,000 to $14,999 | 0 | 0.0% |
| $15,000 to $24,999 | 0 | 0.0% |
| $25,000 to $34,999 | 0 | 0.0% |
| $35,000 to $49,999 | 0 | 0.0% |
| $50,000 to $74,999 | 0 | 0.0% |
| $75,000 to $99,999 | 9 | 36.0% |
| $100,000 to $149,999 | 6 | 24.0% |
| $150,000 to $199,999 | 0 | 0.0% |
| $200,000+ | 0 | 0.0% |
Family Income by Famaliy Size in Brookhurst
| Income Bracket | # Families | Median Income |
| 2-Person Families | 25 (100.0%) | $0 |
| 3-Person Families | 0 (0.0%) | $0 |
| 4-Person Families | 0 (0.0%) | $0 |
| 5-Person Families | 0 (0.0%) | $0 |
| 6-Person Families | 0 (0.0%) | $0 |
| 7+ Person Families | 0 (0.0%) | $0 |
| Total | 25 (100.0%) | $0 |
Family Income by Number of Earners in Brookhurst
| Number of Earners | # Families | Median Income |
| No Earners | 10 (40.0%) | $0 |
| 1 Earner | 0 (0.0%) | $0 |
| 2 Earners | 15 (60.0%) | $0 |
| 3+ Earners | 0 (0.0%) | $0 |
| Total | 25 (100.0%) | $0 |
Household Income in Brookhurst
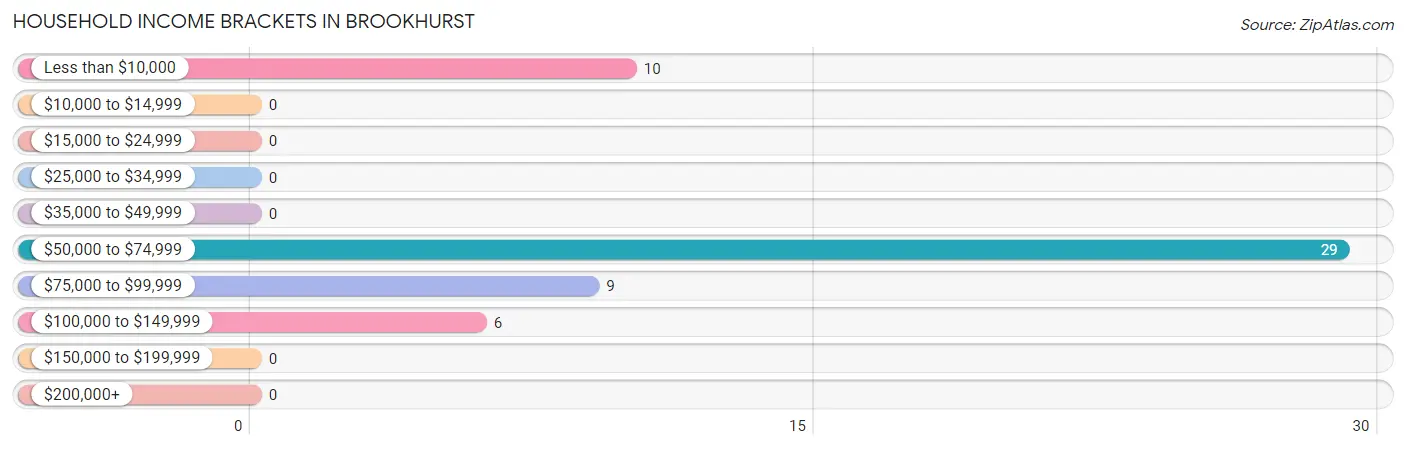
Household Income Brackets in Brookhurst
With 29 households falling in the category, the $50,000 to $74,999 income range is the most frequent in Brookhurst, accounting for 53.7% of all households.
| Income Bracket | # Households | % Households |
| Less than $10,000 | 10 | 18.5% |
| $10,000 to $14,999 | 0 | 0.0% |
| $15,000 to $24,999 | 0 | 0.0% |
| $25,000 to $34,999 | 0 | 0.0% |
| $35,000 to $49,999 | 0 | 0.0% |
| $50,000 to $74,999 | 29 | 53.7% |
| $75,000 to $99,999 | 9 | 16.7% |
| $100,000 to $149,999 | 6 | 11.1% |
| $150,000 to $199,999 | 0 | 0.0% |
| $200,000+ | 0 | 0.0% |
Household Income by Householder Age in Brookhurst
| Income Bracket | # Households | Median Income |
| 15 to 24 Years | 0 (0.0%) | $0 |
| 25 to 44 Years | 9 (16.7%) | $0 |
| 45 to 64 Years | 25 (46.3%) | $0 |
| 65+ Years | 20 (37.0%) | $0 |
| Total | 54 (100.0%) | $71,000 |
Poverty in Brookhurst
Income Below Poverty by Sex and Age in Brookhurst
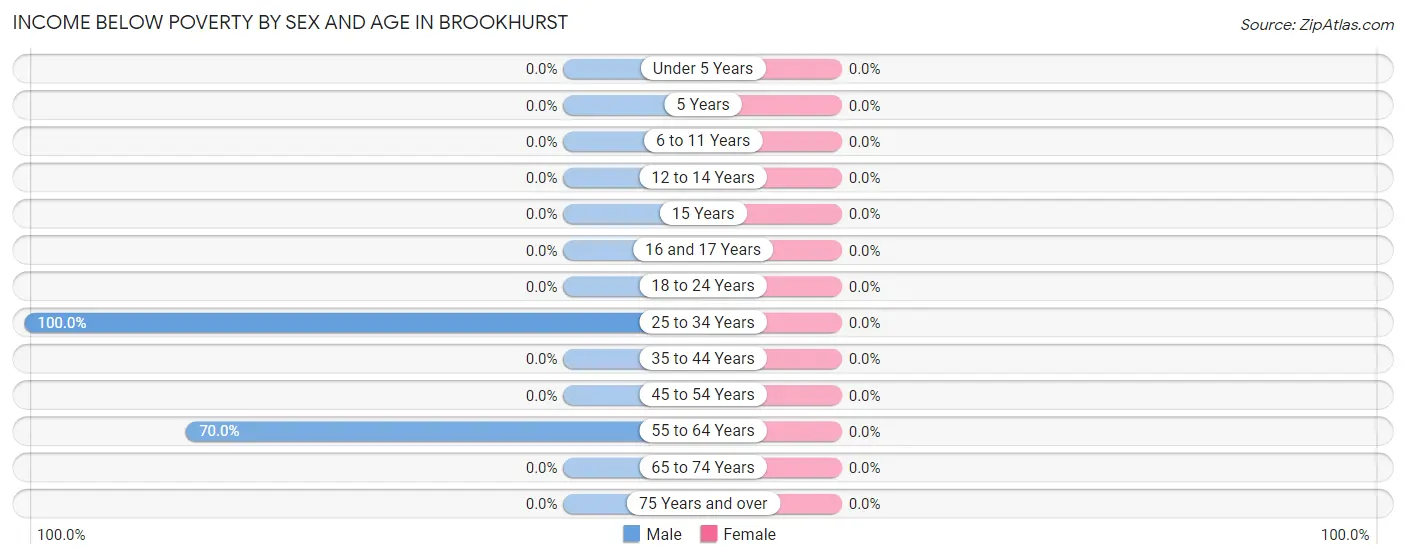
| Age Bracket | Male | Female |
| Under 5 Years | 0 (0.0%) | 0 (0.0%) |
| 5 Years | 0 (0.0%) | 0 (0.0%) |
| 6 to 11 Years | 0 (0.0%) | 0 (0.0%) |
| 12 to 14 Years | 0 (0.0%) | 0 (0.0%) |
| 15 Years | 0 (0.0%) | 0 (0.0%) |
| 16 and 17 Years | 0 (0.0%) | 0 (0.0%) |
| 18 to 24 Years | 0 (0.0%) | 0 (0.0%) |
| 25 to 34 Years | 9 (100.0%) | 0 (0.0%) |
| 35 to 44 Years | 0 (0.0%) | 0 (0.0%) |
| 45 to 54 Years | 0 (0.0%) | 0 (0.0%) |
| 55 to 64 Years | 21 (70.0%) | 0 (0.0%) |
| 65 to 74 Years | 0 (0.0%) | 0 (0.0%) |
| 75 Years and over | 0 (0.0%) | 0 (0.0%) |
| Total | 30 (46.2%) | 0 (0.0%) |
Income Above Poverty by Sex and Age in Brookhurst
According to the poverty statistics in Brookhurst, males aged 45 to 54 years and females aged 25 to 34 years are the age groups that are most secure financially, with 100.0% of males and 100.0% of females in these age groups living above the poverty line.
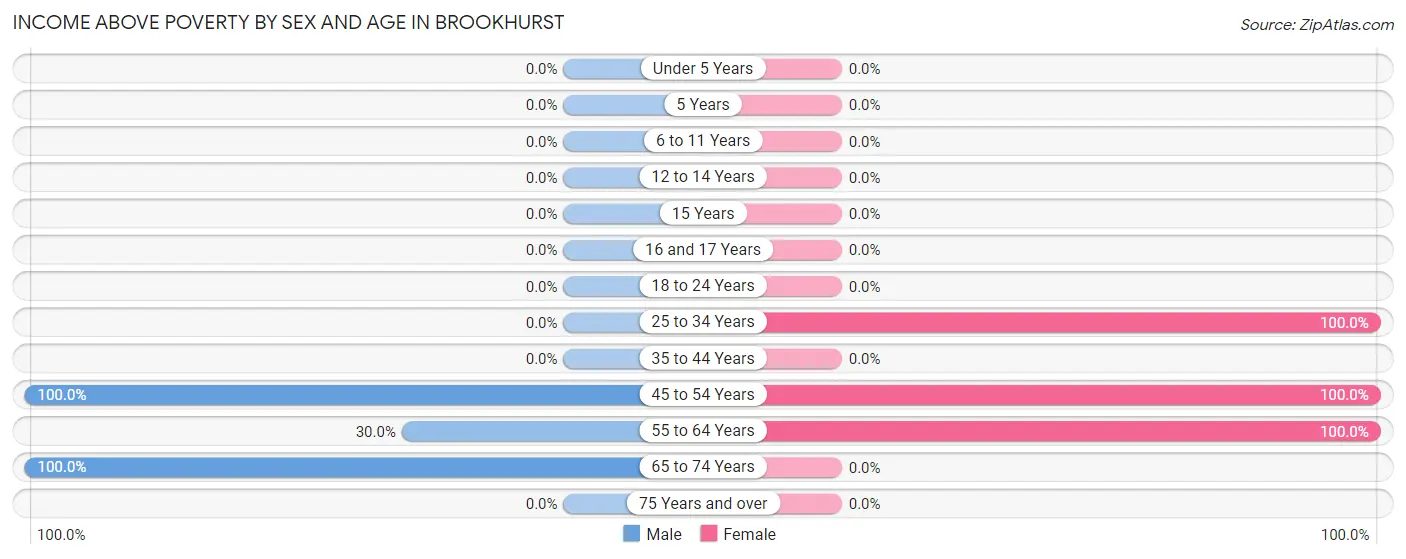
| Age Bracket | Male | Female |
| Under 5 Years | 0 (0.0%) | 0 (0.0%) |
| 5 Years | 0 (0.0%) | 0 (0.0%) |
| 6 to 11 Years | 0 (0.0%) | 0 (0.0%) |
| 12 to 14 Years | 0 (0.0%) | 0 (0.0%) |
| 15 Years | 0 (0.0%) | 0 (0.0%) |
| 16 and 17 Years | 0 (0.0%) | 0 (0.0%) |
| 18 to 24 Years | 0 (0.0%) | 0 (0.0%) |
| 25 to 34 Years | 0 (0.0%) | 11 (100.0%) |
| 35 to 44 Years | 0 (0.0%) | 0 (0.0%) |
| 45 to 54 Years | 6 (100.0%) | 6 (100.0%) |
| 55 to 64 Years | 9 (30.0%) | 9 (100.0%) |
| 65 to 74 Years | 20 (100.0%) | 0 (0.0%) |
| 75 Years and over | 0 (0.0%) | 0 (0.0%) |
| Total | 35 (53.8%) | 26 (100.0%) |
Income Below Poverty Among Married-Couple Families in Brookhurst
| Children | Above Poverty | Below Poverty |
| No Children | 15 (100.0%) | 0 (0.0%) |
| 1 or 2 Children | 0 (0.0%) | 0 (0.0%) |
| 3 or 4 Children | 0 (0.0%) | 0 (0.0%) |
| 5 or more Children | 0 (0.0%) | 0 (0.0%) |
| Total | 15 (100.0%) | 0 (0.0%) |
Income Below Poverty Among Single-Parent Households in Brookhurst
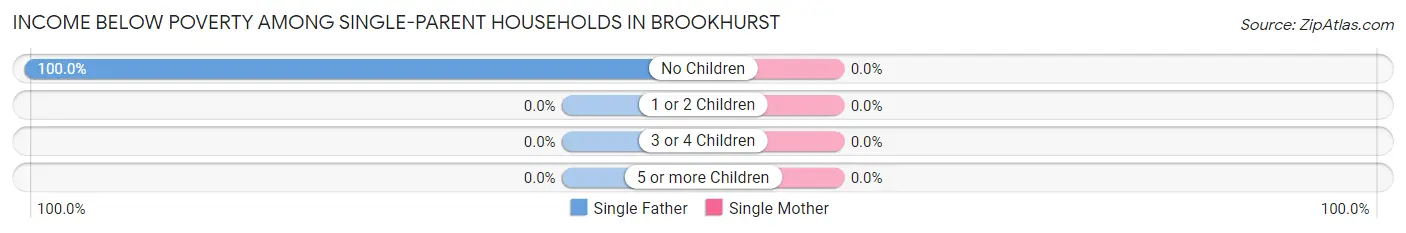
| Children | Single Father | Single Mother |
| No Children | 10 (100.0%) | 0 (0.0%) |
| 1 or 2 Children | 0 (0.0%) | 0 (0.0%) |
| 3 or 4 Children | 0 (0.0%) | 0 (0.0%) |
| 5 or more Children | 0 (0.0%) | 0 (0.0%) |
| Total | 10 (100.0%) | 0 (0.0%) |
Income Below Poverty Among Married-Couple vs Single-Parent Households in Brookhurst
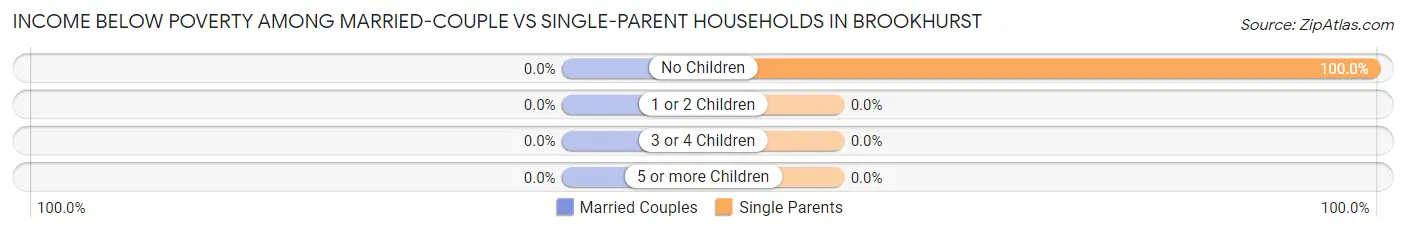
| Children | Married-Couple Families | Single-Parent Households |
| No Children | 0 (0.0%) | 10 (100.0%) |
| 1 or 2 Children | 0 (0.0%) | 0 (0.0%) |
| 3 or 4 Children | 0 (0.0%) | 0 (0.0%) |
| 5 or more Children | 0 (0.0%) | 0 (0.0%) |
| Total | 0 (0.0%) | 10 (100.0%) |
Race in Brookhurst
The most populous races in Brookhurst are , and White / Caucasian (91 | 100.0%).
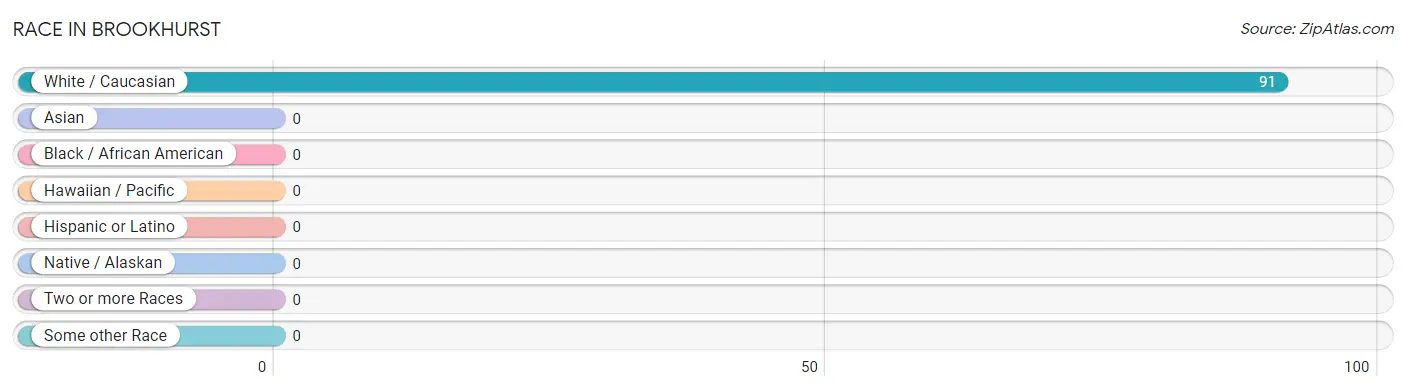
| Race | # Population | % Population |
| Asian | 0 | 0.0% |
| Black / African American | 0 | 0.0% |
| Hawaiian / Pacific | 0 | 0.0% |
| Hispanic or Latino | 0 | 0.0% |
| Native / Alaskan | 0 | 0.0% |
| White / Caucasian | 91 | 100.0% |
| Two or more Races | 0 | 0.0% |
| Some other Race | 0 | 0.0% |
| Total | 91 | 100.0% |
Ancestry in Brookhurst
The most populous ancestries reported in Brookhurst are German (38 | 41.8%), Norwegian (21 | 23.1%), Swedish (20 | 22.0%), British (11 | 12.1%), and Slavic (9 | 9.9%), together accounting for 108.8% of all Brookhurst residents.
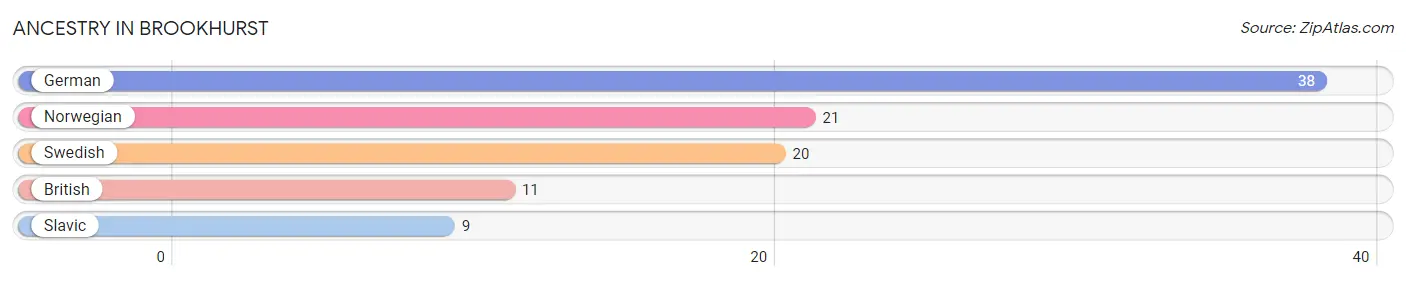
| Ancestry | # Population | % Population |
| British | 11 | 12.1% |
| German | 38 | 41.8% |
| Norwegian | 21 | 23.1% |
| Slavic | 9 | 9.9% |
| Swedish | 20 | 22.0% | View All 5 Rows |
Immigrants in Brookhurst

| Immigration Origin | # Population | % Population | View All 0 Rows |
Sex and Age in Brookhurst
Sex and Age in Brookhurst
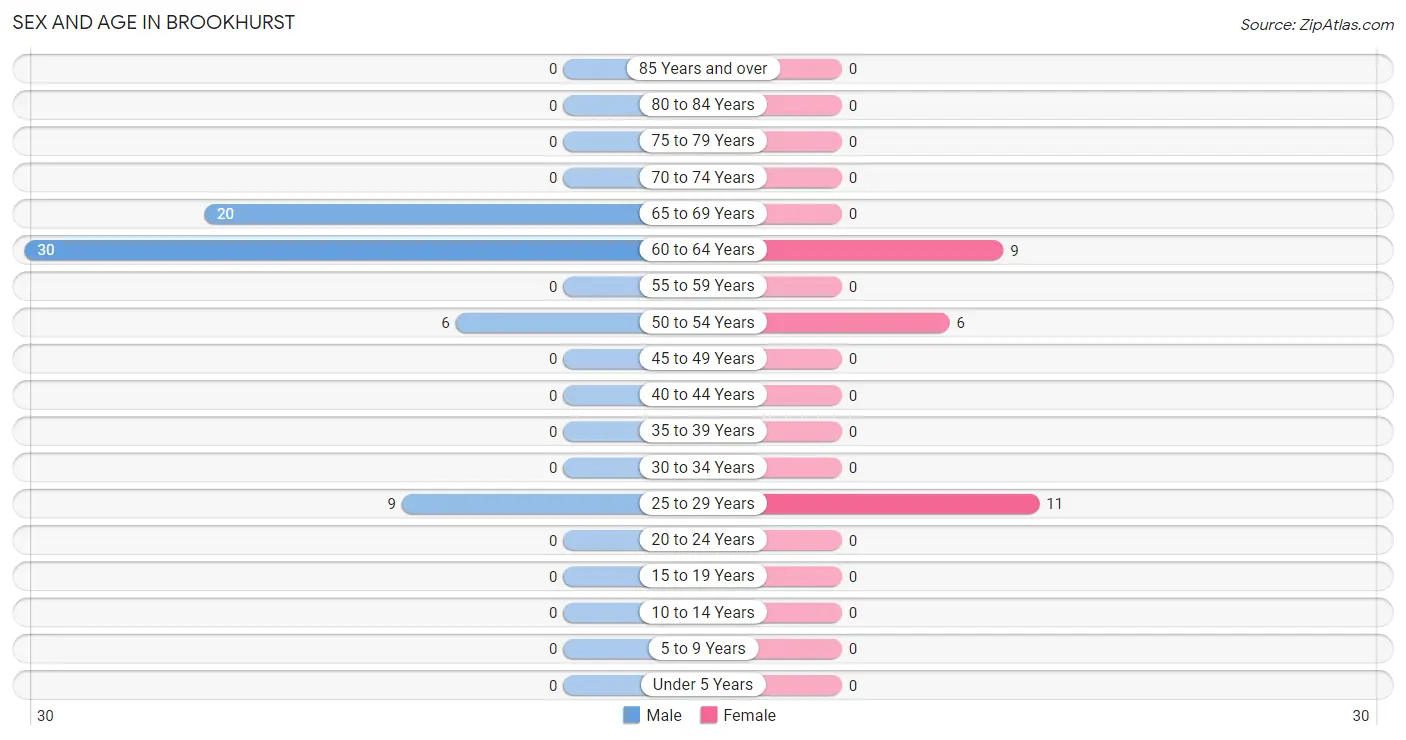
The most populous age groups in Brookhurst are 60 to 64 Years (30 | 46.2%) for men and 25 to 29 Years (11 | 42.3%) for women.
| Age Bracket | Male | Female |
| Under 5 Years | 0 (0.0%) | 0 (0.0%) |
| 5 to 9 Years | 0 (0.0%) | 0 (0.0%) |
| 10 to 14 Years | 0 (0.0%) | 0 (0.0%) |
| 15 to 19 Years | 0 (0.0%) | 0 (0.0%) |
| 20 to 24 Years | 0 (0.0%) | 0 (0.0%) |
| 25 to 29 Years | 9 (13.9%) | 11 (42.3%) |
| 30 to 34 Years | 0 (0.0%) | 0 (0.0%) |
| 35 to 39 Years | 0 (0.0%) | 0 (0.0%) |
| 40 to 44 Years | 0 (0.0%) | 0 (0.0%) |
| 45 to 49 Years | 0 (0.0%) | 0 (0.0%) |
| 50 to 54 Years | 6 (9.2%) | 6 (23.1%) |
| 55 to 59 Years | 0 (0.0%) | 0 (0.0%) |
| 60 to 64 Years | 30 (46.2%) | 9 (34.6%) |
| 65 to 69 Years | 20 (30.8%) | 0 (0.0%) |
| 70 to 74 Years | 0 (0.0%) | 0 (0.0%) |
| 75 to 79 Years | 0 (0.0%) | 0 (0.0%) |
| 80 to 84 Years | 0 (0.0%) | 0 (0.0%) |
| 85 Years and over | 0 (0.0%) | 0 (0.0%) |
| Total | 65 (100.0%) | 26 (100.0%) |
Families and Households in Brookhurst
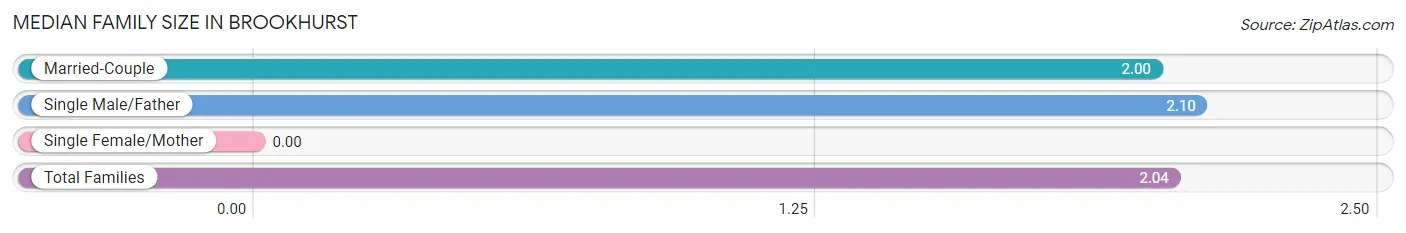
Median Family Size in Brookhurst
| Family Type | # Families | Family Size |
| Married-Couple | 15 (60.0%) | 2.00 |
| Single Male/Father | 10 (40.0%) | 2.10 |
| Single Female/Mother | 0 (0.0%) | - |
| Total Families | 25 (100.0%) | 2.04 |
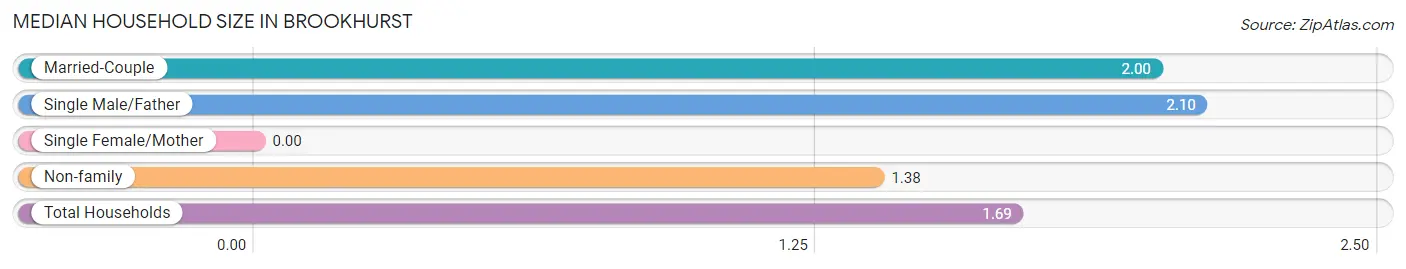
Median Household Size in Brookhurst
| Household Type | # Households | Household Size |
| Married-Couple | 15 (27.8%) | 2.00 |
| Single Male/Father | 10 (18.5%) | 2.10 |
| Single Female/Mother | 0 (0.0%) | - |
| Non-family | 29 (53.7%) | 1.38 |
| Total Households | 54 (100.0%) | 1.69 |
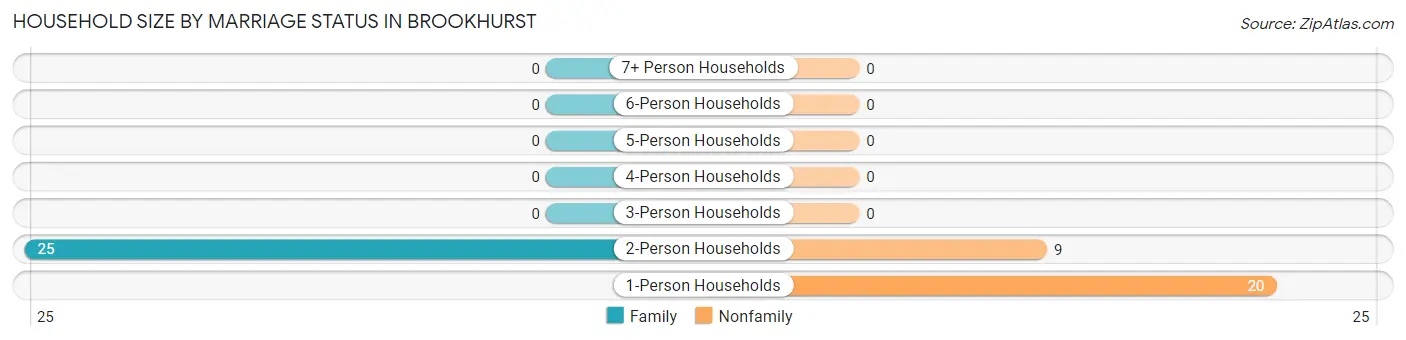
Household Size by Marriage Status in Brookhurst
Out of a total of 54 households in Brookhurst, 25 (46.3%) are family households, while 29 (53.7%) are nonfamily households. The most numerous type of family households are 2-person households, comprising 25, and the most common type of nonfamily households are 1-person households, comprising 20.
| Household Size | Family Households | Nonfamily Households |
| 1-Person Households | - | 20 (37.0%) |
| 2-Person Households | 25 (46.3%) | 9 (16.7%) |
| 3-Person Households | 0 (0.0%) | 0 (0.0%) |
| 4-Person Households | 0 (0.0%) | 0 (0.0%) |
| 5-Person Households | 0 (0.0%) | 0 (0.0%) |
| 6-Person Households | 0 (0.0%) | 0 (0.0%) |
| 7+ Person Households | 0 (0.0%) | 0 (0.0%) |
| Total | 25 (46.3%) | 29 (53.7%) |
Female Fertility in Brookhurst
Fertility by Age in Brookhurst
| Age Bracket | Women with Births | Births / 1,000 Women |
| 15 to 19 years | 0 (0.0%) | 0.0 |
| 20 to 34 years | 0 (0.0%) | 0.0 |
| 35 to 50 years | 0 (0.0%) | 0.0 |
| Total | 0 (0.0%) | 0.0 |
Fertility by Age by Marriage Status in Brookhurst
| Age Bracket | Married | Unmarried |
| 15 to 19 years | 0 (0.0%) | 0 (0.0%) |
| 20 to 34 years | 0 (0.0%) | 0 (0.0%) |
| 35 to 50 years | 0 (0.0%) | 0 (0.0%) |
| Total | 0 (0.0%) | 0 (0.0%) |
Fertility by Education in Brookhurst
| Educational Attainment | Women with Births | Births / 1,000 Women |
| Less than High School | 0 (0.0%) | 0.0 |
| High School Diploma | 0 (0.0%) | 0.0 |
| College or Associate's Degree | 0 (0.0%) | 0.0 |
| Bachelor's Degree | 0 (0.0%) | 0.0 |
| Graduate Degree | 0 (0.0%) | 0.0 |
| Total | 0 (0.0%) | 0.0 |
Fertility by Education by Marriage Status in Brookhurst
| Educational Attainment | Married | Unmarried |
| Less than High School | 0 (0.0%) | 0 (0.0%) |
| High School Diploma | 0 (0.0%) | 0 (0.0%) |
| College or Associate's Degree | 0 (0.0%) | 0 (0.0%) |
| Bachelor's Degree | 0 (0.0%) | 0 (0.0%) |
| Graduate Degree | 0 (0.0%) | 0 (0.0%) |
| Total | 0 (0.0%) | 0 (0.0%) |
Employment Characteristics in Brookhurst
Employment by Class of Employer in Brookhurst
Among the 41 employed individuals in Brookhurst, private company employees (11 | 26.8%), self-employed (not incorporated) (9 | 22.0%), and not-for-profit organizations (9 | 22.0%) make up the most common classes of employment.
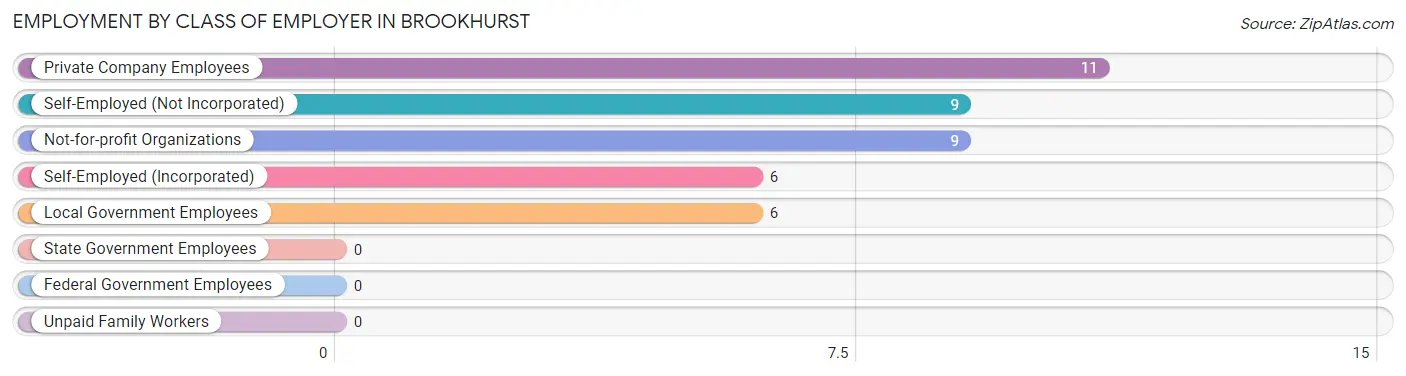
| Employer Class | # Employees | % Employees |
| Private Company Employees | 11 | 26.8% |
| Self-Employed (Incorporated) | 6 | 14.6% |
| Self-Employed (Not Incorporated) | 9 | 22.0% |
| Not-for-profit Organizations | 9 | 22.0% |
| Local Government Employees | 6 | 14.6% |
| State Government Employees | 0 | 0.0% |
| Federal Government Employees | 0 | 0.0% |
| Unpaid Family Workers | 0 | 0.0% |
| Total | 41 | 100.0% |
Employment Status by Age in Brookhurst
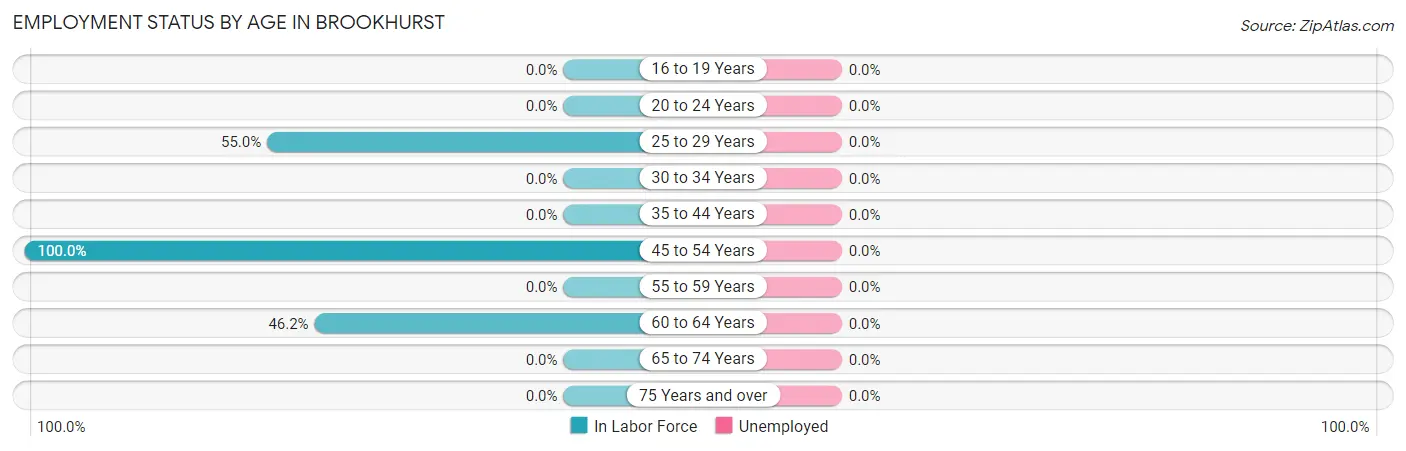
| Age Bracket | In Labor Force | Unemployed |
| 16 to 19 Years | 0 (0.0%) | 0 (0.0%) |
| 20 to 24 Years | 0 (0.0%) | 0 (0.0%) |
| 25 to 29 Years | 11 (55.0%) | 0 (0.0%) |
| 30 to 34 Years | 0 (0.0%) | 0 (0.0%) |
| 35 to 44 Years | 0 (0.0%) | 0 (0.0%) |
| 45 to 54 Years | 12 (100.0%) | 0 (0.0%) |
| 55 to 59 Years | 0 (0.0%) | 0 (0.0%) |
| 60 to 64 Years | 18 (46.2%) | 0 (0.0%) |
| 65 to 74 Years | 0 (0.0%) | 0 (0.0%) |
| 75 Years and over | 0 (0.0%) | 0 (0.0%) |
| Total | 41 (45.1%) | 0 (0.0%) |
Employment Status by Educational Attainment in Brookhurst
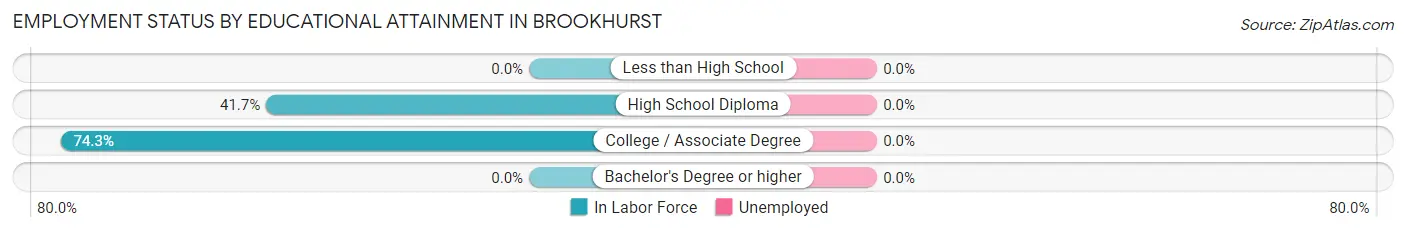
| Educational Attainment | In Labor Force | Unemployed |
| Less than High School | 0 (0.0%) | 0 (0.0%) |
| High School Diploma | 15 (41.7%) | 0 (0.0%) |
| College / Associate Degree | 26 (74.3%) | 0 (0.0%) |
| Bachelor's Degree or higher | 0 (0.0%) | 0 (0.0%) |
| Total | 41 (57.7%) | 0 (0.0%) |
Employment Occupations by Sex in Brookhurst
Management, Business, Science and Arts Occupations
The most common Management, Business, Science and Arts occupations in Brookhurst are Health Diagnosing & Treating (11 | 26.8%), Management (9 | 22.0%), Computers, Engineering & Science (6 | 14.6%), and Life, Physical & Social Science (6 | 14.6%).
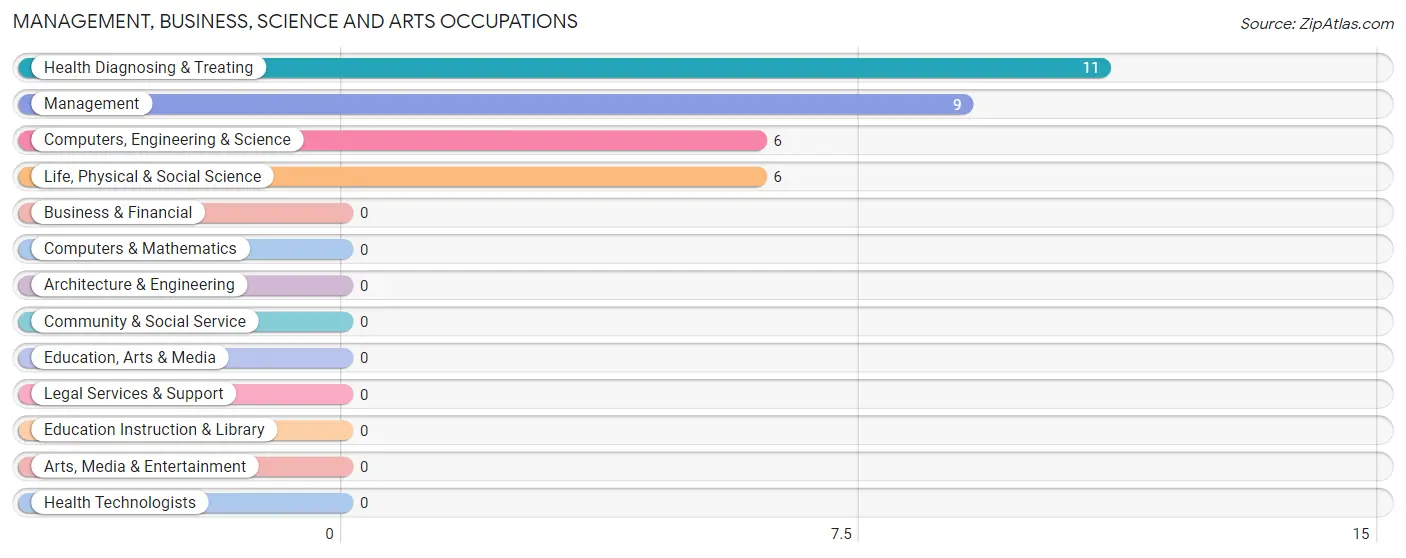
Management, Business, Science and Arts Occupations by Sex
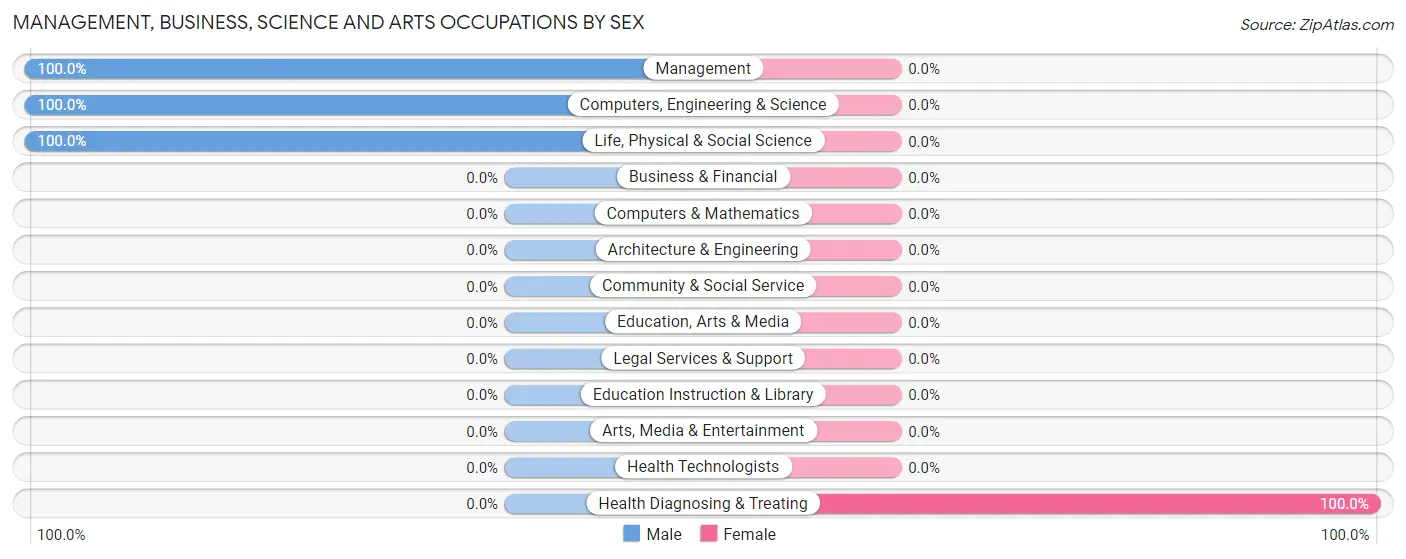
| Occupation | Male | Female |
| Management | 9 (100.0%) | 0 (0.0%) |
| Business & Financial | 0 (0.0%) | 0 (0.0%) |
| Computers, Engineering & Science | 6 (100.0%) | 0 (0.0%) |
| Computers & Mathematics | 0 (0.0%) | 0 (0.0%) |
| Architecture & Engineering | 0 (0.0%) | 0 (0.0%) |
| Life, Physical & Social Science | 6 (100.0%) | 0 (0.0%) |
| Community & Social Service | 0 (0.0%) | 0 (0.0%) |
| Education, Arts & Media | 0 (0.0%) | 0 (0.0%) |
| Legal Services & Support | 0 (0.0%) | 0 (0.0%) |
| Education Instruction & Library | 0 (0.0%) | 0 (0.0%) |
| Arts, Media & Entertainment | 0 (0.0%) | 0 (0.0%) |
| Health Diagnosing & Treating | 0 (0.0%) | 11 (100.0%) |
| Health Technologists | 0 (0.0%) | 0 (0.0%) |
| Total (Category) | 15 (57.7%) | 11 (42.3%) |
| Total (Overall) | 15 (36.6%) | 26 (63.4%) |
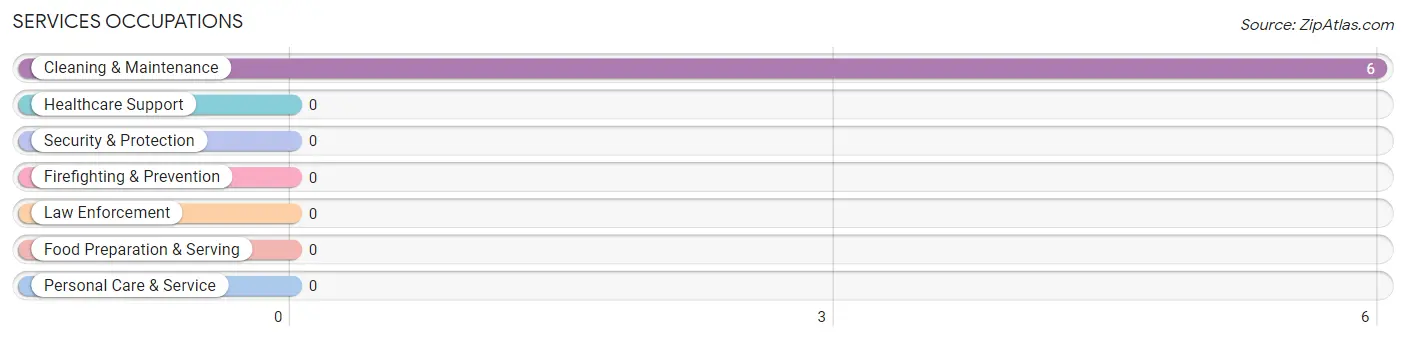
Services Occupations
The most common Services occupations in Brookhurst are , and Cleaning & Maintenance (6 | 14.6%).
Services Occupations by Sex
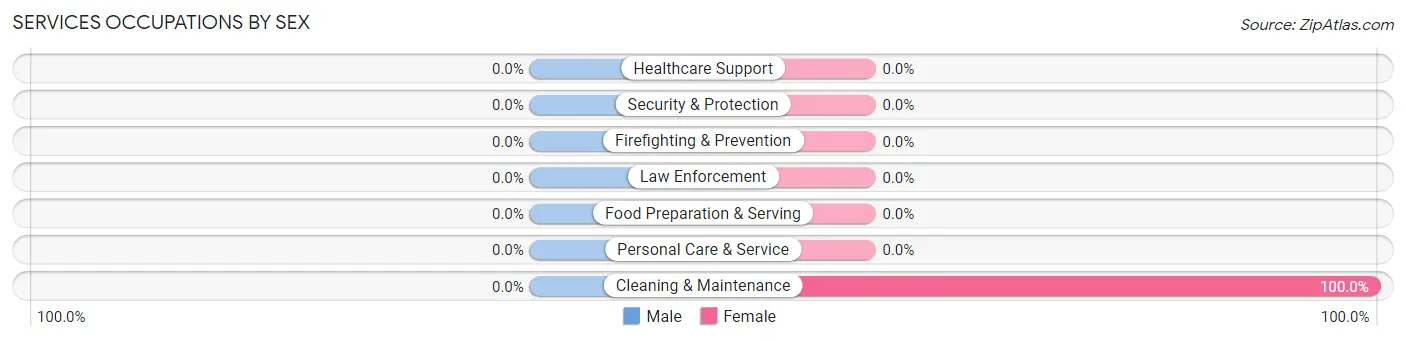
| Occupation | Male | Female |
| Healthcare Support | 0 (0.0%) | 0 (0.0%) |
| Security & Protection | 0 (0.0%) | 0 (0.0%) |
| Firefighting & Prevention | 0 (0.0%) | 0 (0.0%) |
| Law Enforcement | 0 (0.0%) | 0 (0.0%) |
| Food Preparation & Serving | 0 (0.0%) | 0 (0.0%) |
| Cleaning & Maintenance | 0 (0.0%) | 6 (100.0%) |
| Personal Care & Service | 0 (0.0%) | 0 (0.0%) |
| Total (Category) | 0 (0.0%) | 6 (100.0%) |
| Total (Overall) | 15 (36.6%) | 26 (63.4%) |
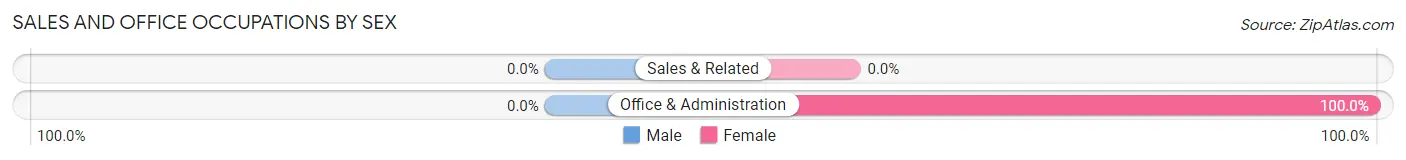
Sales and Office Occupations
The most common Sales and Office occupations in Brookhurst are , and Office & Administration (9 | 22.0%).
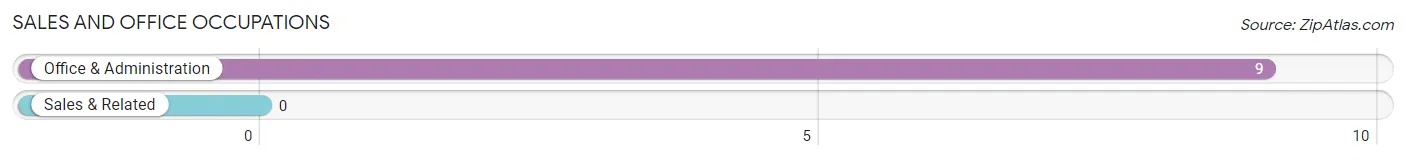
Sales and Office Occupations by Sex
| Occupation | Male | Female |
| Sales & Related | 0 (0.0%) | 0 (0.0%) |
| Office & Administration | 0 (0.0%) | 9 (100.0%) |
| Total (Category) | 0 (0.0%) | 9 (100.0%) |
| Total (Overall) | 15 (36.6%) | 26 (63.4%) |
Natural Resources, Construction and Maintenance Occupations
Natural Resources, Construction and Maintenance Occupations by Sex
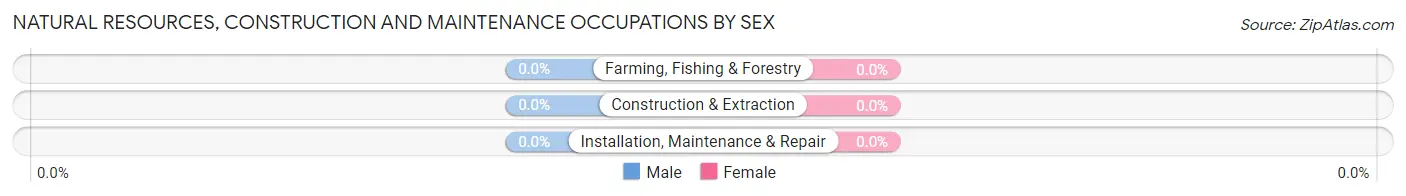
| Occupation | Male | Female |
| Farming, Fishing & Forestry | 0 (0.0%) | 0 (0.0%) |
| Construction & Extraction | 0 (0.0%) | 0 (0.0%) |
| Installation, Maintenance & Repair | 0 (0.0%) | 0 (0.0%) |
| Total (Category) | 0 (0.0%) | 0 (0.0%) |
| Total (Overall) | 15 (36.6%) | 26 (63.4%) |
Production, Transportation and Moving Occupations
Production, Transportation and Moving Occupations by Sex
| Occupation | Male | Female |
| Production | 0 (0.0%) | 0 (0.0%) |
| Transportation | 0 (0.0%) | 0 (0.0%) |
| Material Moving | 0 (0.0%) | 0 (0.0%) |
| Total (Category) | 0 (0.0%) | 0 (0.0%) |
| Total (Overall) | 15 (36.6%) | 26 (63.4%) |
Employment Industries by Sex in Brookhurst
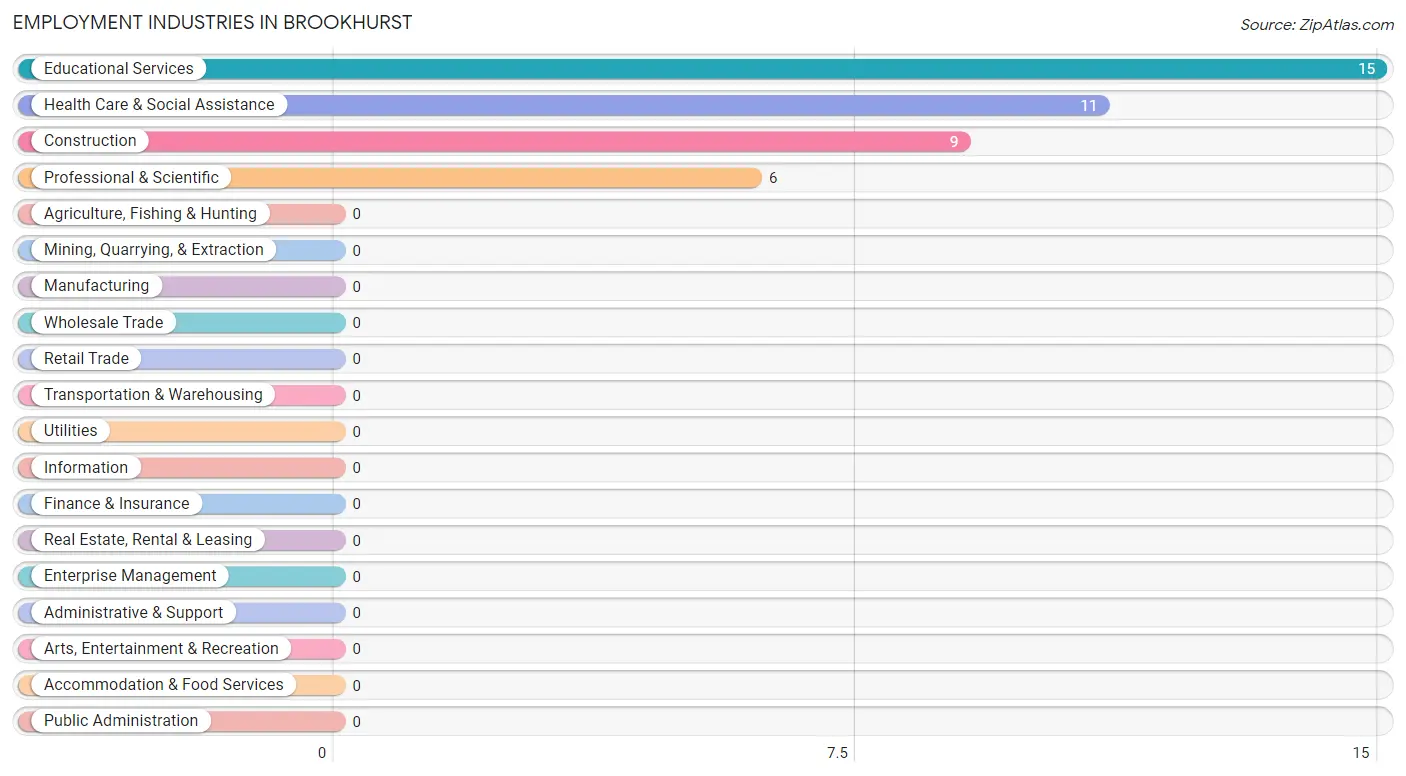
Employment Industries in Brookhurst
The major employment industries in Brookhurst include Educational Services (15 | 36.6%), Health Care & Social Assistance (11 | 26.8%), Construction (9 | 22.0%), and Professional & Scientific (6 | 14.6%).
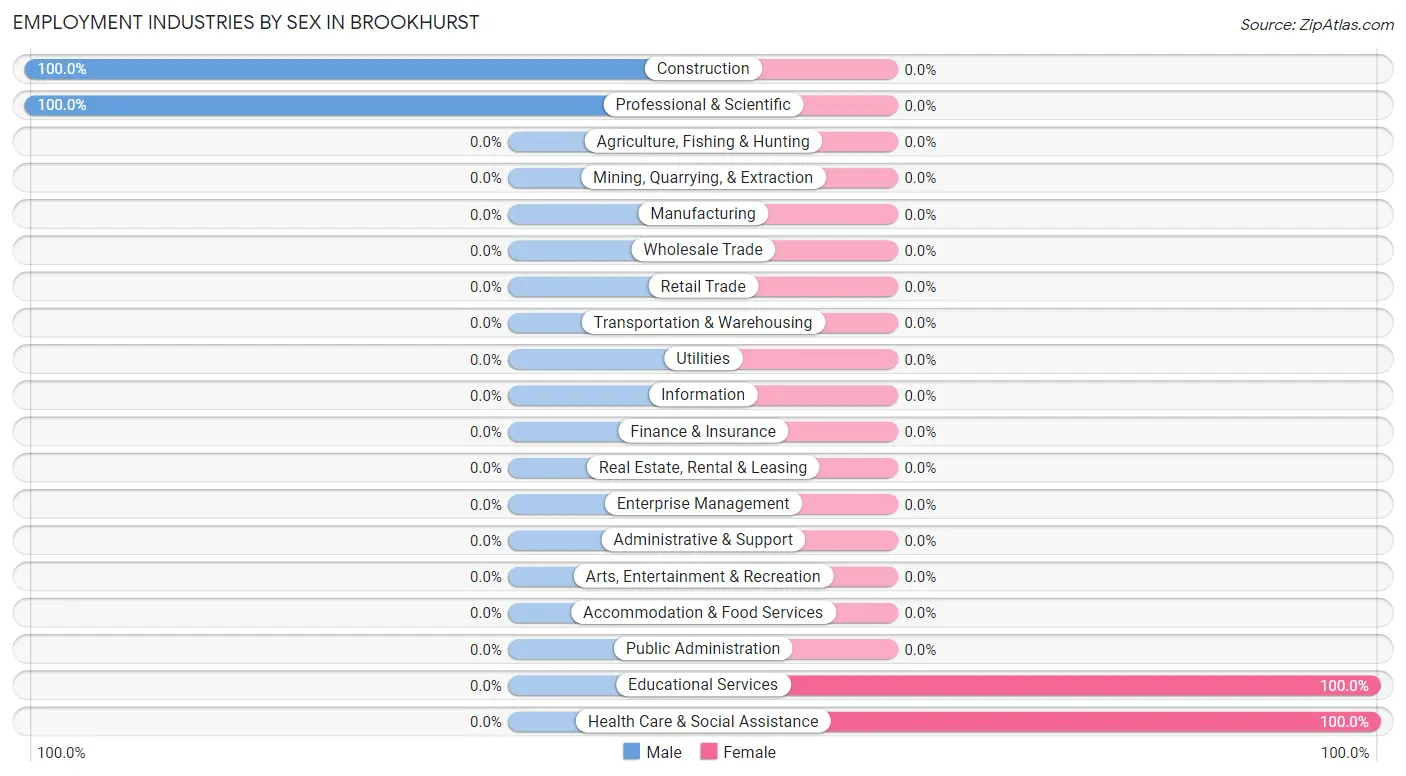
Employment Industries by Sex in Brookhurst
The Brookhurst industries that see more men than women are Construction (100.0%), and Professional & Scientific (100.0%), whereas the industries that tend to have a higher number of women are Educational Services (100.0%), and Health Care & Social Assistance (100.0%).
| Industry | Male | Female |
| Agriculture, Fishing & Hunting | 0 (0.0%) | 0 (0.0%) |
| Mining, Quarrying, & Extraction | 0 (0.0%) | 0 (0.0%) |
| Construction | 9 (100.0%) | 0 (0.0%) |
| Manufacturing | 0 (0.0%) | 0 (0.0%) |
| Wholesale Trade | 0 (0.0%) | 0 (0.0%) |
| Retail Trade | 0 (0.0%) | 0 (0.0%) |
| Transportation & Warehousing | 0 (0.0%) | 0 (0.0%) |
| Utilities | 0 (0.0%) | 0 (0.0%) |
| Information | 0 (0.0%) | 0 (0.0%) |
| Finance & Insurance | 0 (0.0%) | 0 (0.0%) |
| Real Estate, Rental & Leasing | 0 (0.0%) | 0 (0.0%) |
| Professional & Scientific | 6 (100.0%) | 0 (0.0%) |
| Enterprise Management | 0 (0.0%) | 0 (0.0%) |
| Administrative & Support | 0 (0.0%) | 0 (0.0%) |
| Educational Services | 0 (0.0%) | 15 (100.0%) |
| Health Care & Social Assistance | 0 (0.0%) | 11 (100.0%) |
| Arts, Entertainment & Recreation | 0 (0.0%) | 0 (0.0%) |
| Accommodation & Food Services | 0 (0.0%) | 0 (0.0%) |
| Public Administration | 0 (0.0%) | 0 (0.0%) |
| Total | 15 (36.6%) | 26 (63.4%) |
Education in Brookhurst
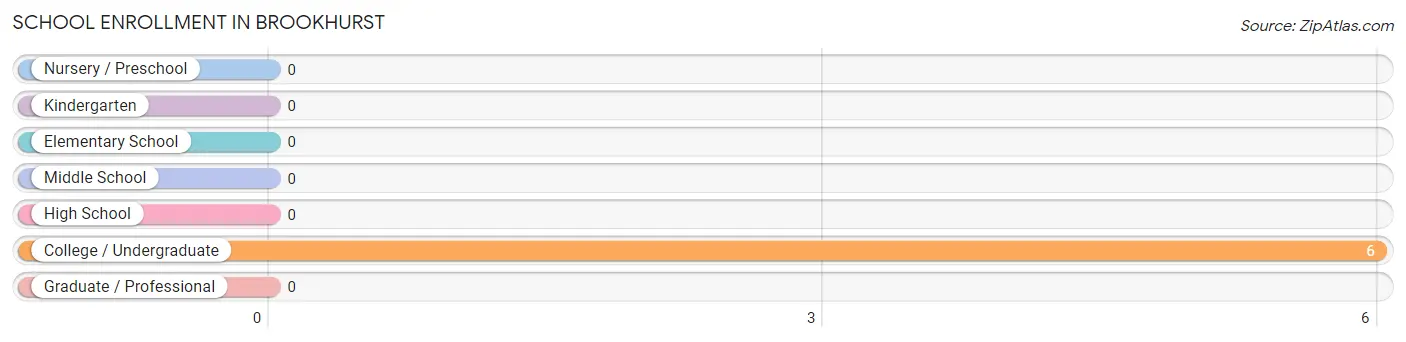
School Enrollment in Brookhurst
| School Level | # Students | % Students |
| Nursery / Preschool | 0 | 0.0% |
| Kindergarten | 0 | 0.0% |
| Elementary School | 0 | 0.0% |
| Middle School | 0 | 0.0% |
| High School | 0 | 0.0% |
| College / Undergraduate | 6 | 100.0% |
| Graduate / Professional | 0 | 0.0% |
| Total | 6 | 100.0% |
School Enrollment by Age by Funding Source in Brookhurst
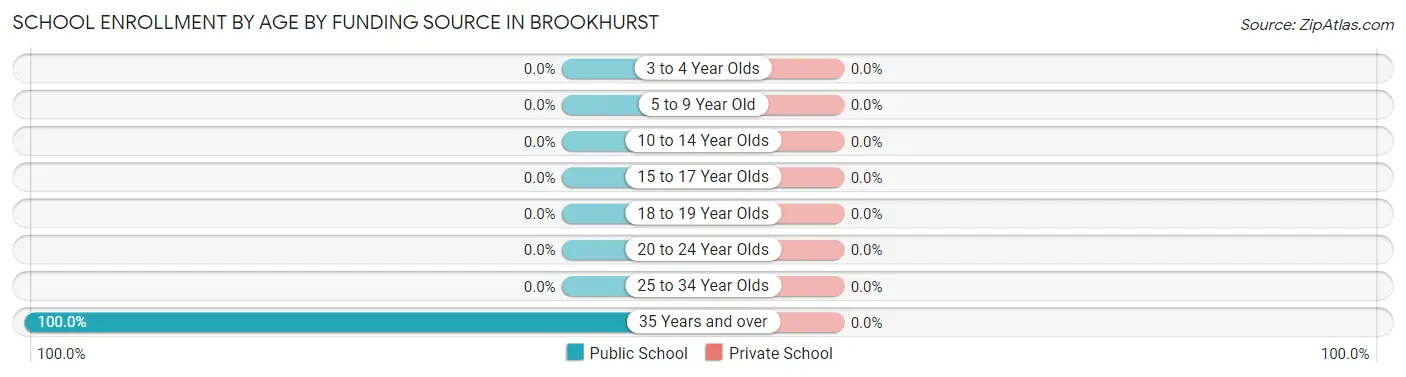
| Age Bracket | Public School | Private School |
| 3 to 4 Year Olds | 0 (0.0%) | 0 (0.0%) |
| 5 to 9 Year Old | 0 (0.0%) | 0 (0.0%) |
| 10 to 14 Year Olds | 0 (0.0%) | 0 (0.0%) |
| 15 to 17 Year Olds | 0 (0.0%) | 0 (0.0%) |
| 18 to 19 Year Olds | 0 (0.0%) | 0 (0.0%) |
| 20 to 24 Year Olds | 0 (0.0%) | 0 (0.0%) |
| 25 to 34 Year Olds | 0 (0.0%) | 0 (0.0%) |
| 35 Years and over | 6 (100.0%) | 0 (0.0%) |
| Total | 6 (100.0%) | 0 (0.0%) |
Educational Attainment by Field of Study in Brookhurst
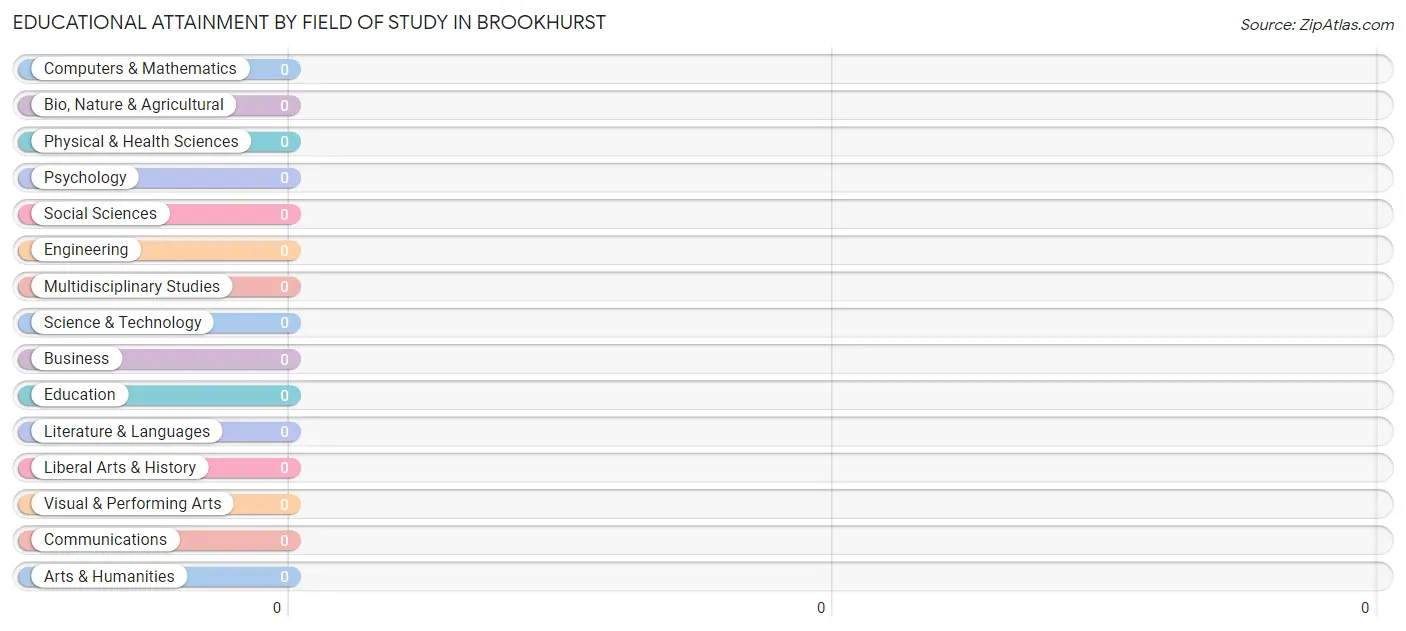
| Field of Study | # Graduates | % Graduates |
| Computers & Mathematics | 0 | 0.0% |
| Bio, Nature & Agricultural | 0 | 0.0% |
| Physical & Health Sciences | 0 | 0.0% |
| Psychology | 0 | 0.0% |
| Social Sciences | 0 | 0.0% |
| Engineering | 0 | 0.0% |
| Multidisciplinary Studies | 0 | 0.0% |
| Science & Technology | 0 | 0.0% |
| Business | 0 | 0.0% |
| Education | 0 | 0.0% |
| Literature & Languages | 0 | 0.0% |
| Liberal Arts & History | 0 | 0.0% |
| Visual & Performing Arts | 0 | 0.0% |
| Communications | 0 | 0.0% |
| Arts & Humanities | 0 | 0.0% |
| Total | 0 | 0.0% |
Transportation & Commute in Brookhurst
Vehicle Availability by Sex in Brookhurst
The most prevalent vehicle ownership categories in Brookhurst are males with 3 vehicles (9, accounting for 60.0%) and females with 3 vehicles (9, making up 34.6%).
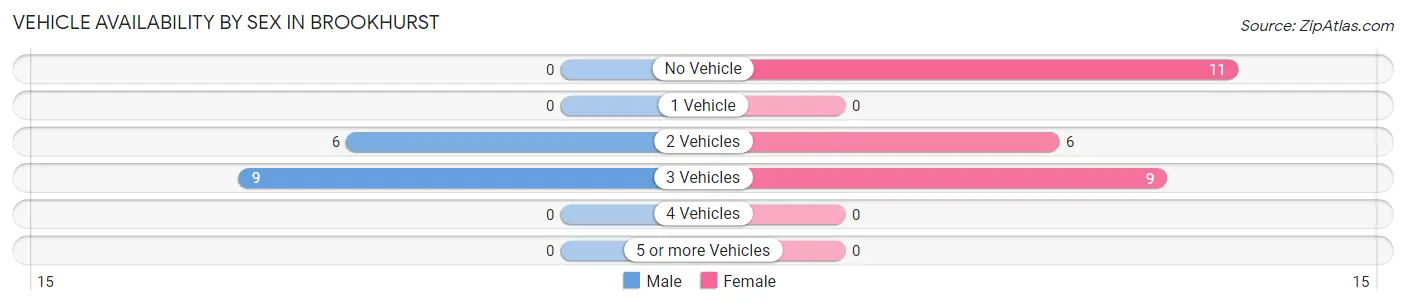
| Vehicles Available | Male | Female |
| No Vehicle | 0 (0.0%) | 11 (42.3%) |
| 1 Vehicle | 0 (0.0%) | 0 (0.0%) |
| 2 Vehicles | 6 (40.0%) | 6 (23.1%) |
| 3 Vehicles | 9 (60.0%) | 9 (34.6%) |
| 4 Vehicles | 0 (0.0%) | 0 (0.0%) |
| 5 or more Vehicles | 0 (0.0%) | 0 (0.0%) |
| Total | 15 (100.0%) | 26 (100.0%) |
Commute Time in Brookhurst
The most frequently occuring commute durations in Brookhurst are 15 to 19 minutes (21 commuters, 51.2%), 10 to 14 minutes (11 commuters, 26.8%), and 90 or more minutes (9 commuters, 22.0%).
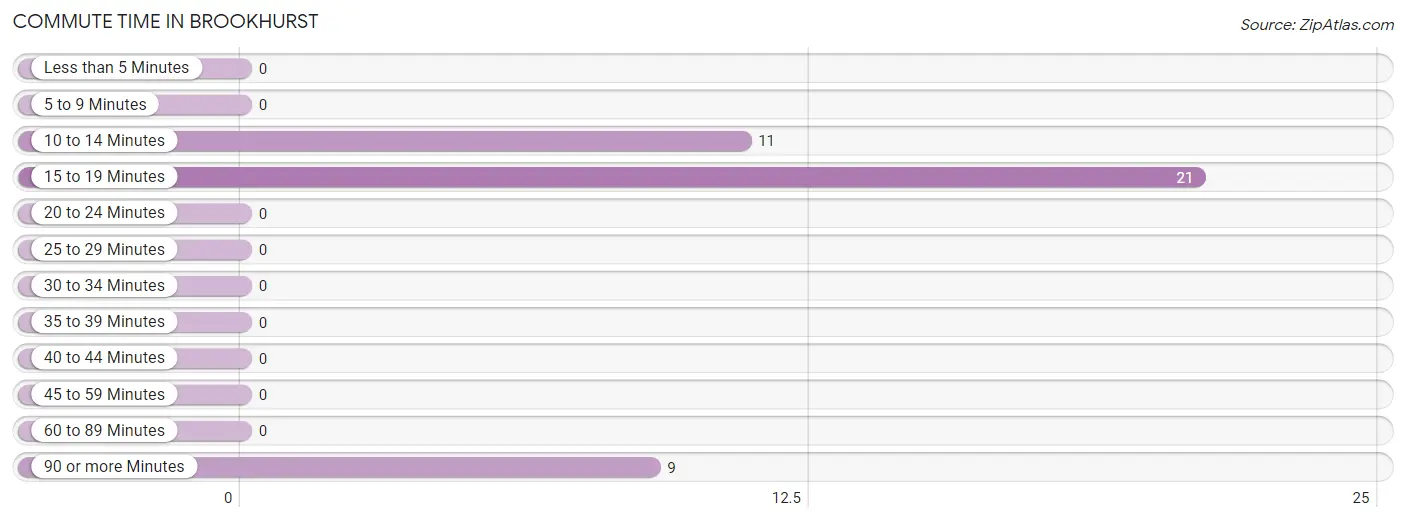
| Commute Time | # Commuters | % Commuters |
| Less than 5 Minutes | 0 | 0.0% |
| 5 to 9 Minutes | 0 | 0.0% |
| 10 to 14 Minutes | 11 | 26.8% |
| 15 to 19 Minutes | 21 | 51.2% |
| 20 to 24 Minutes | 0 | 0.0% |
| 25 to 29 Minutes | 0 | 0.0% |
| 30 to 34 Minutes | 0 | 0.0% |
| 35 to 39 Minutes | 0 | 0.0% |
| 40 to 44 Minutes | 0 | 0.0% |
| 45 to 59 Minutes | 0 | 0.0% |
| 60 to 89 Minutes | 0 | 0.0% |
| 90 or more Minutes | 9 | 22.0% |
Commute Time by Sex in Brookhurst
The most common commute times in Brookhurst are 90 or more minutes (9 commuters, 60.0%) for males and 15 to 19 minutes (15 commuters, 57.7%) for females.
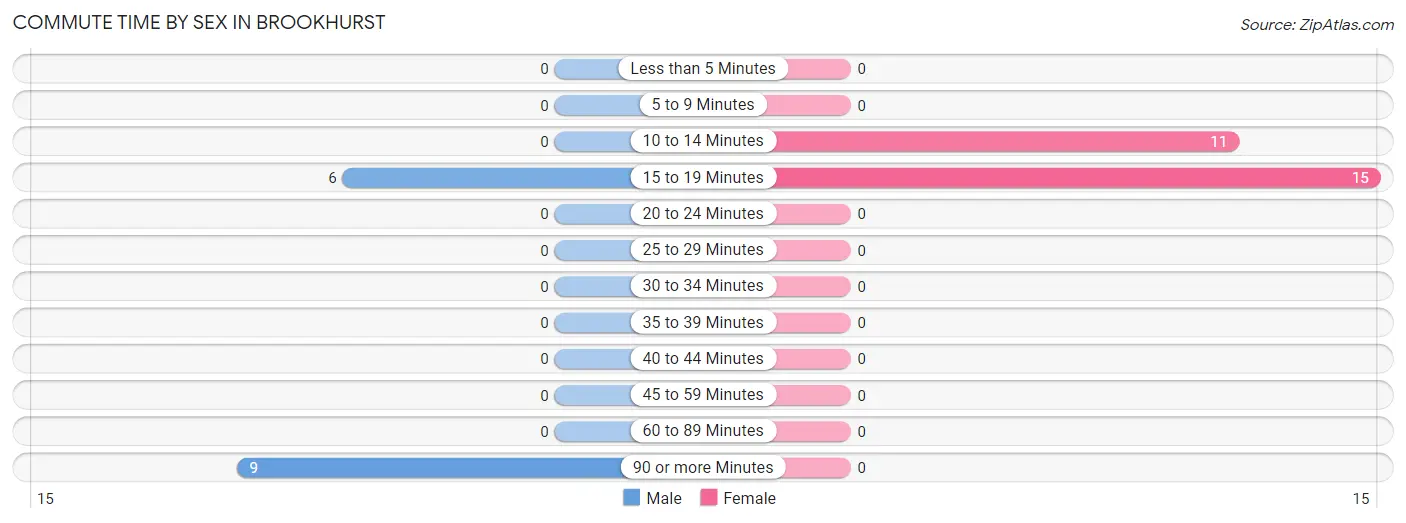
| Commute Time | Male | Female |
| Less than 5 Minutes | 0 (0.0%) | 0 (0.0%) |
| 5 to 9 Minutes | 0 (0.0%) | 0 (0.0%) |
| 10 to 14 Minutes | 0 (0.0%) | 11 (42.3%) |
| 15 to 19 Minutes | 6 (40.0%) | 15 (57.7%) |
| 20 to 24 Minutes | 0 (0.0%) | 0 (0.0%) |
| 25 to 29 Minutes | 0 (0.0%) | 0 (0.0%) |
| 30 to 34 Minutes | 0 (0.0%) | 0 (0.0%) |
| 35 to 39 Minutes | 0 (0.0%) | 0 (0.0%) |
| 40 to 44 Minutes | 0 (0.0%) | 0 (0.0%) |
| 45 to 59 Minutes | 0 (0.0%) | 0 (0.0%) |
| 60 to 89 Minutes | 0 (0.0%) | 0 (0.0%) |
| 90 or more Minutes | 9 (60.0%) | 0 (0.0%) |
Time of Departure to Work by Sex in Brookhurst
The most frequent times of departure to work in Brookhurst are 6:00 AM to 6:29 AM (9, 60.0%) for males and 6:30 AM to 6:59 AM (11, 42.3%) for females.
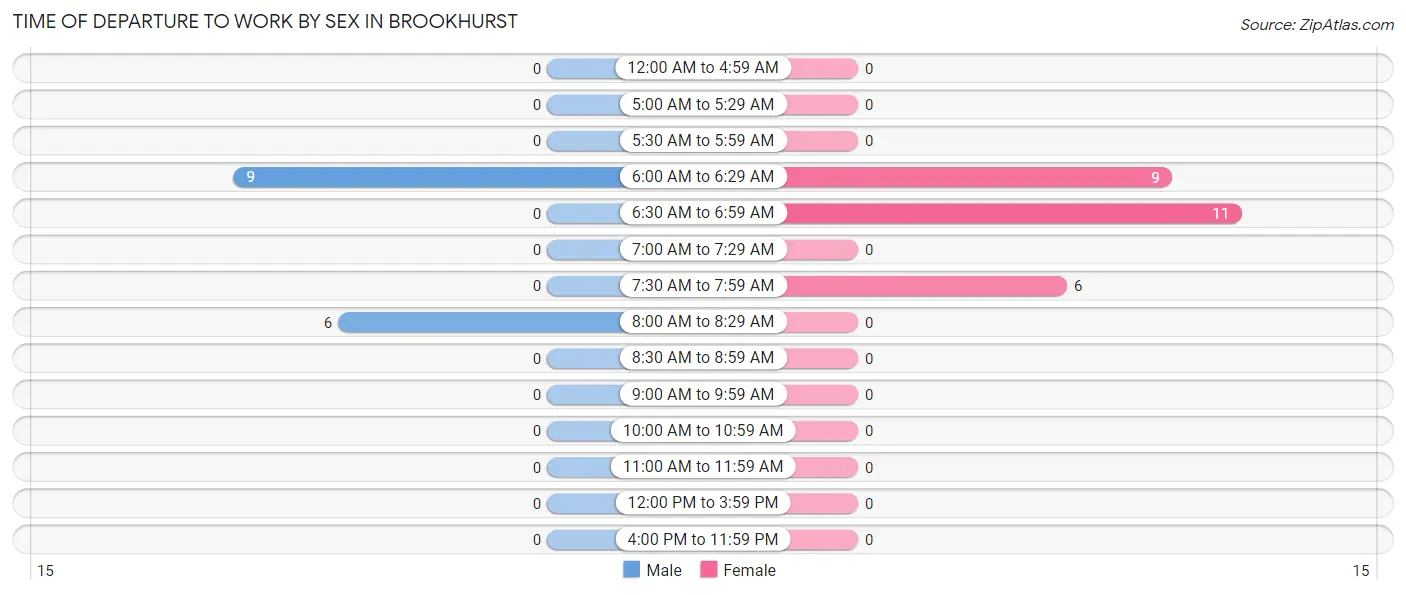
| Time of Departure | Male | Female |
| 12:00 AM to 4:59 AM | 0 (0.0%) | 0 (0.0%) |
| 5:00 AM to 5:29 AM | 0 (0.0%) | 0 (0.0%) |
| 5:30 AM to 5:59 AM | 0 (0.0%) | 0 (0.0%) |
| 6:00 AM to 6:29 AM | 9 (60.0%) | 9 (34.6%) |
| 6:30 AM to 6:59 AM | 0 (0.0%) | 11 (42.3%) |
| 7:00 AM to 7:29 AM | 0 (0.0%) | 0 (0.0%) |
| 7:30 AM to 7:59 AM | 0 (0.0%) | 6 (23.1%) |
| 8:00 AM to 8:29 AM | 6 (40.0%) | 0 (0.0%) |
| 8:30 AM to 8:59 AM | 0 (0.0%) | 0 (0.0%) |
| 9:00 AM to 9:59 AM | 0 (0.0%) | 0 (0.0%) |
| 10:00 AM to 10:59 AM | 0 (0.0%) | 0 (0.0%) |
| 11:00 AM to 11:59 AM | 0 (0.0%) | 0 (0.0%) |
| 12:00 PM to 3:59 PM | 0 (0.0%) | 0 (0.0%) |
| 4:00 PM to 11:59 PM | 0 (0.0%) | 0 (0.0%) |
| Total | 15 (100.0%) | 26 (100.0%) |
Housing Occupancy in Brookhurst
Occupancy by Ownership in Brookhurst
Of the total 54 dwellings in Brookhurst, owner-occupied units account for 45 (83.3%), while renter-occupied units make up 9 (16.7%).
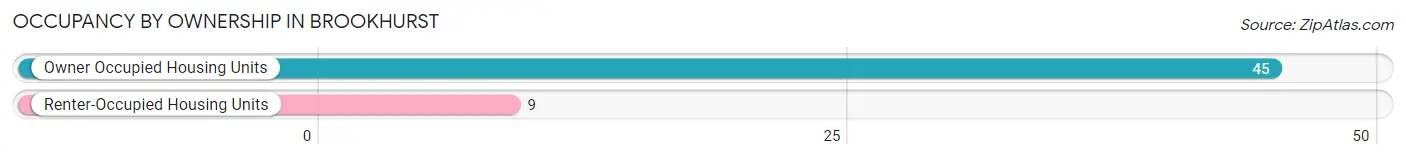
| Occupancy | # Housing Units | % Housing Units |
| Owner Occupied Housing Units | 45 | 83.3% |
| Renter-Occupied Housing Units | 9 | 16.7% |
| Total Occupied Housing Units | 54 | 100.0% |
Occupancy by Household Size in Brookhurst
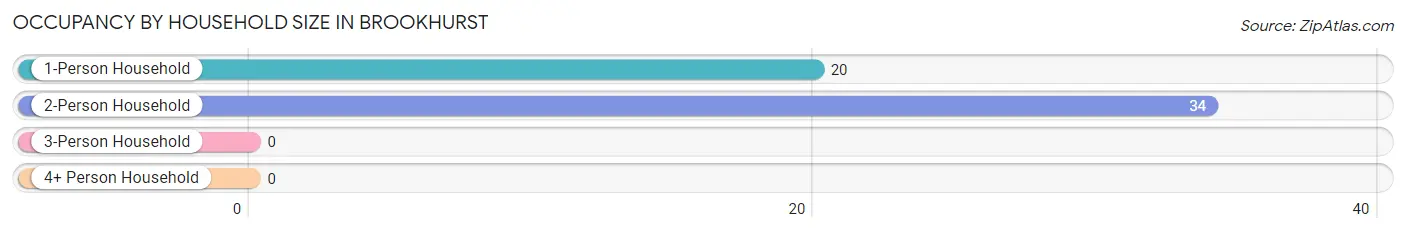
| Household Size | # Housing Units | % Housing Units |
| 1-Person Household | 20 | 37.0% |
| 2-Person Household | 34 | 63.0% |
| 3-Person Household | 0 | 0.0% |
| 4+ Person Household | 0 | 0.0% |
| Total Housing Units | 54 | 100.0% |
Occupancy by Ownership by Household Size in Brookhurst
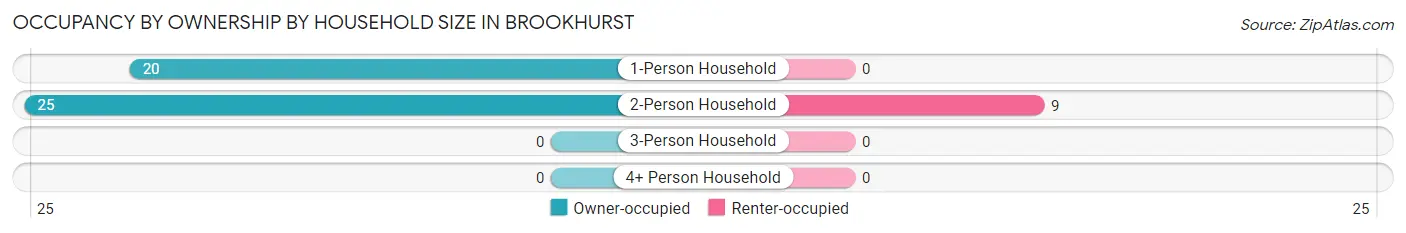
| Household Size | Owner-occupied | Renter-occupied |
| 1-Person Household | 20 (100.0%) | 0 (0.0%) |
| 2-Person Household | 25 (73.5%) | 9 (26.5%) |
| 3-Person Household | 0 (0.0%) | 0 (0.0%) |
| 4+ Person Household | 0 (0.0%) | 0 (0.0%) |
| Total Housing Units | 45 (83.3%) | 9 (16.7%) |
Occupancy by Educational Attainment in Brookhurst
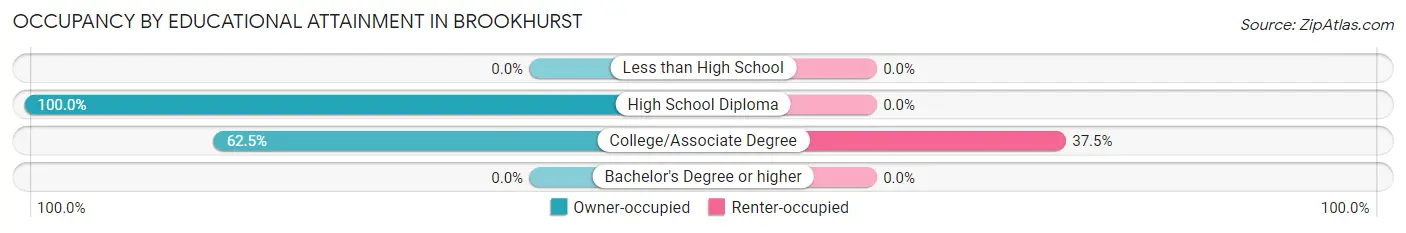
| Household Size | Owner-occupied | Renter-occupied |
| Less than High School | 0 (0.0%) | 0 (0.0%) |
| High School Diploma | 30 (100.0%) | 0 (0.0%) |
| College/Associate Degree | 15 (62.5%) | 9 (37.5%) |
| Bachelor's Degree or higher | 0 (0.0%) | 0 (0.0%) |
Occupancy by Age of Householder in Brookhurst
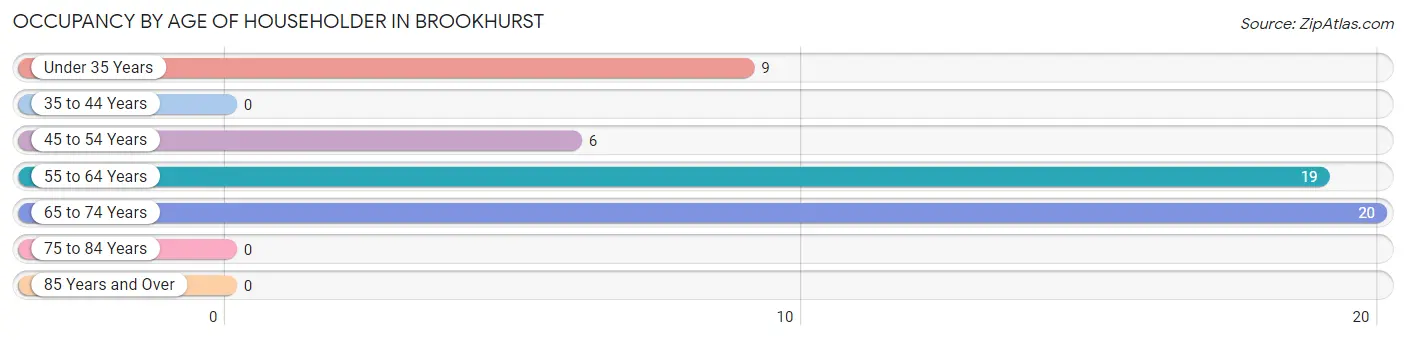
| Age Bracket | # Households | % Households |
| Under 35 Years | 9 | 16.7% |
| 35 to 44 Years | 0 | 0.0% |
| 45 to 54 Years | 6 | 11.1% |
| 55 to 64 Years | 19 | 35.2% |
| 65 to 74 Years | 20 | 37.0% |
| 75 to 84 Years | 0 | 0.0% |
| 85 Years and Over | 0 | 0.0% |
| Total | 54 | 100.0% |
Housing Finances in Brookhurst
Median Income by Occupancy in Brookhurst
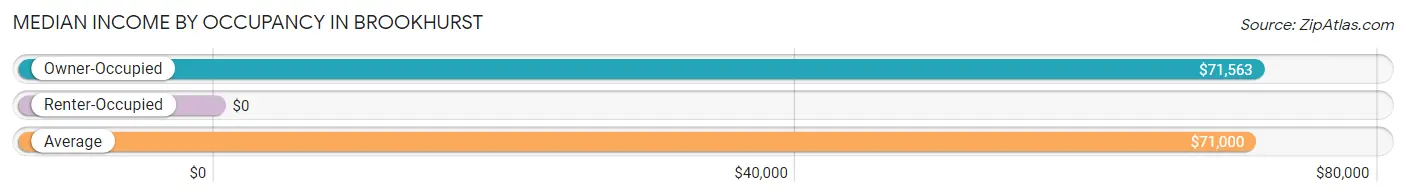
| Occupancy Type | # Households | Median Income |
| Owner-Occupied | 45 (83.3%) | $71,563 |
| Renter-Occupied | 9 (16.7%) | $0 |
| Average | 54 (100.0%) | $71,000 |
Occupancy by Householder Income Bracket in Brookhurst
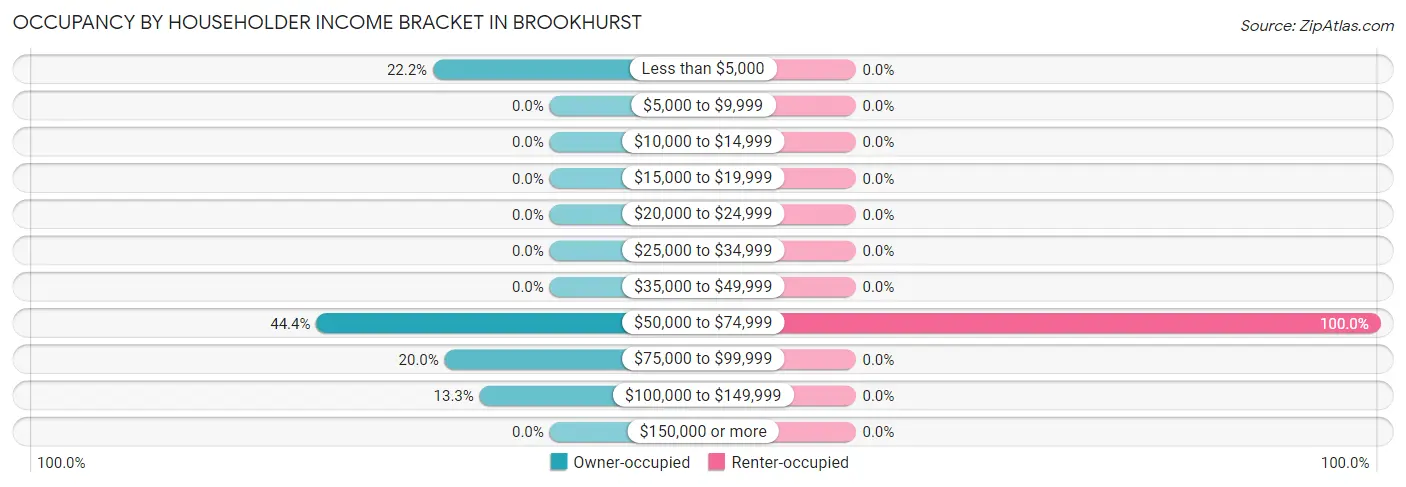
| Income Bracket | Owner-occupied | Renter-occupied |
| Less than $5,000 | 10 (22.2%) | 0 (0.0%) |
| $5,000 to $9,999 | 0 (0.0%) | 0 (0.0%) |
| $10,000 to $14,999 | 0 (0.0%) | 0 (0.0%) |
| $15,000 to $19,999 | 0 (0.0%) | 0 (0.0%) |
| $20,000 to $24,999 | 0 (0.0%) | 0 (0.0%) |
| $25,000 to $34,999 | 0 (0.0%) | 0 (0.0%) |
| $35,000 to $49,999 | 0 (0.0%) | 0 (0.0%) |
| $50,000 to $74,999 | 20 (44.4%) | 9 (100.0%) |
| $75,000 to $99,999 | 9 (20.0%) | 0 (0.0%) |
| $100,000 to $149,999 | 6 (13.3%) | 0 (0.0%) |
| $150,000 or more | 0 (0.0%) | 0 (0.0%) |
| Total | 45 (100.0%) | 9 (100.0%) |
Monthly Housing Cost Tiers in Brookhurst
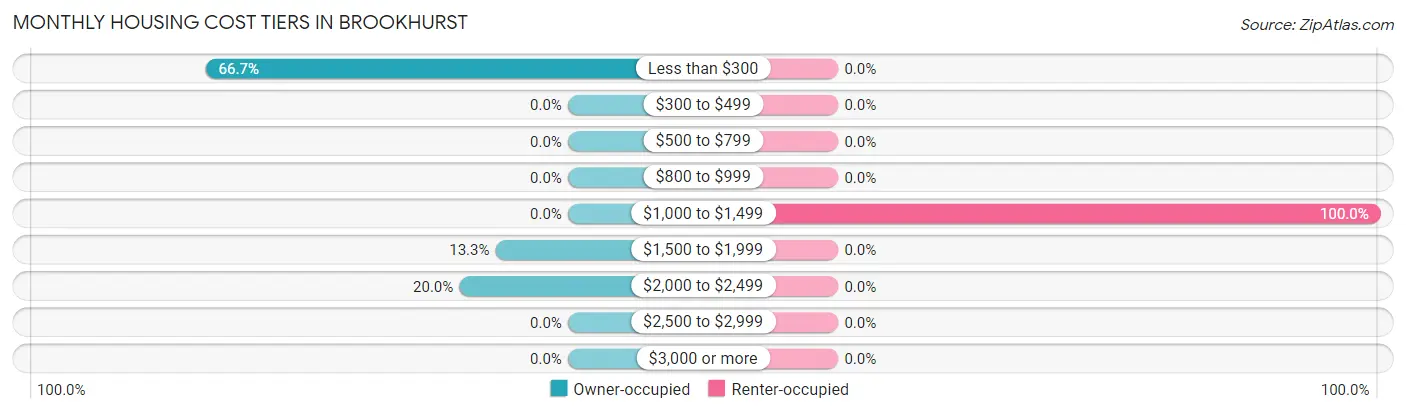
| Monthly Cost | Owner-occupied | Renter-occupied |
| Less than $300 | 30 (66.7%) | 0 (0.0%) |
| $300 to $499 | 0 (0.0%) | 0 (0.0%) |
| $500 to $799 | 0 (0.0%) | 0 (0.0%) |
| $800 to $999 | 0 (0.0%) | 0 (0.0%) |
| $1,000 to $1,499 | 0 (0.0%) | 9 (100.0%) |
| $1,500 to $1,999 | 6 (13.3%) | 0 (0.0%) |
| $2,000 to $2,499 | 9 (20.0%) | 0 (0.0%) |
| $2,500 to $2,999 | 0 (0.0%) | 0 (0.0%) |
| $3,000 or more | 0 (0.0%) | 0 (0.0%) |
| Total | 45 (100.0%) | 9 (100.0%) |
Physical Housing Characteristics in Brookhurst
Housing Structures in Brookhurst
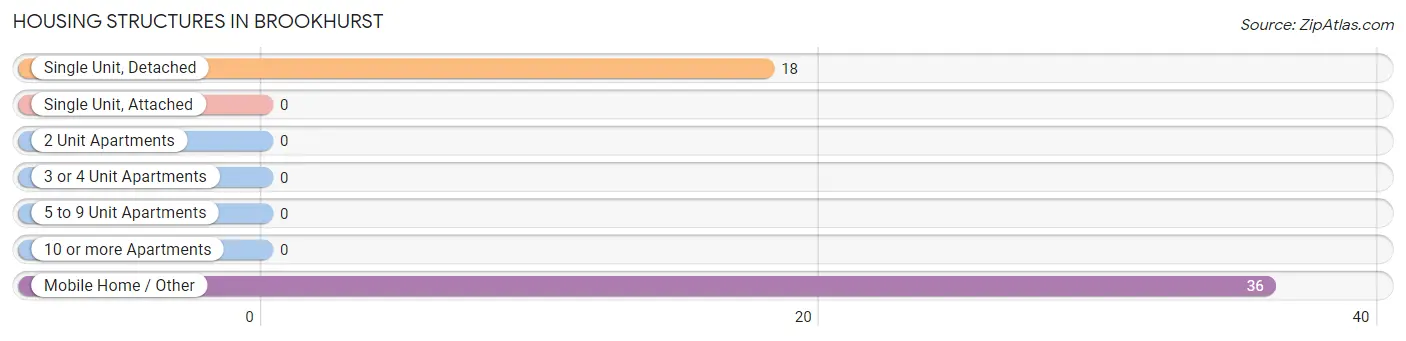
| Structure Type | # Housing Units | % Housing Units |
| Single Unit, Detached | 18 | 33.3% |
| Single Unit, Attached | 0 | 0.0% |
| 2 Unit Apartments | 0 | 0.0% |
| 3 or 4 Unit Apartments | 0 | 0.0% |
| 5 to 9 Unit Apartments | 0 | 0.0% |
| 10 or more Apartments | 0 | 0.0% |
| Mobile Home / Other | 36 | 66.7% |
| Total | 54 | 100.0% |
Housing Structures by Occupancy in Brookhurst
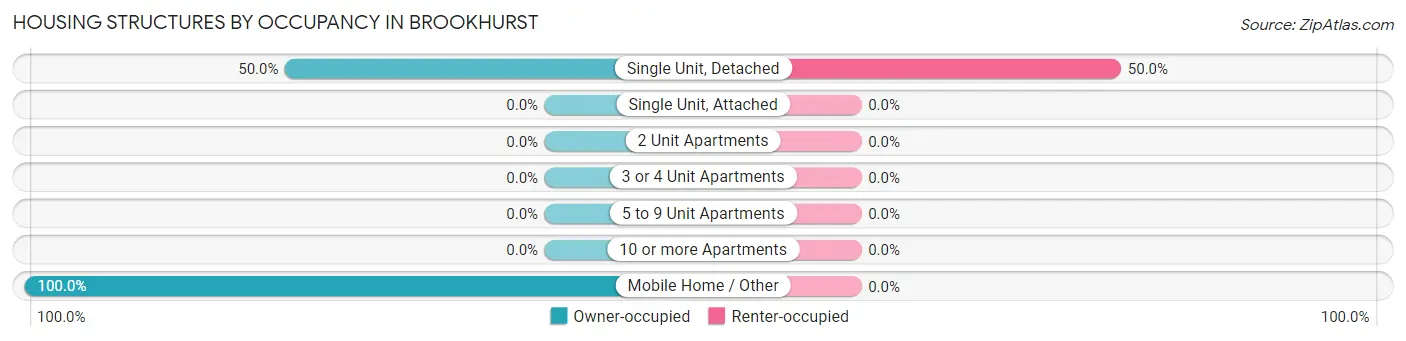
| Structure Type | Owner-occupied | Renter-occupied |
| Single Unit, Detached | 9 (50.0%) | 9 (50.0%) |
| Single Unit, Attached | 0 (0.0%) | 0 (0.0%) |
| 2 Unit Apartments | 0 (0.0%) | 0 (0.0%) |
| 3 or 4 Unit Apartments | 0 (0.0%) | 0 (0.0%) |
| 5 to 9 Unit Apartments | 0 (0.0%) | 0 (0.0%) |
| 10 or more Apartments | 0 (0.0%) | 0 (0.0%) |
| Mobile Home / Other | 36 (100.0%) | 0 (0.0%) |
| Total | 45 (83.3%) | 9 (16.7%) |
Housing Structures by Number of Rooms in Brookhurst
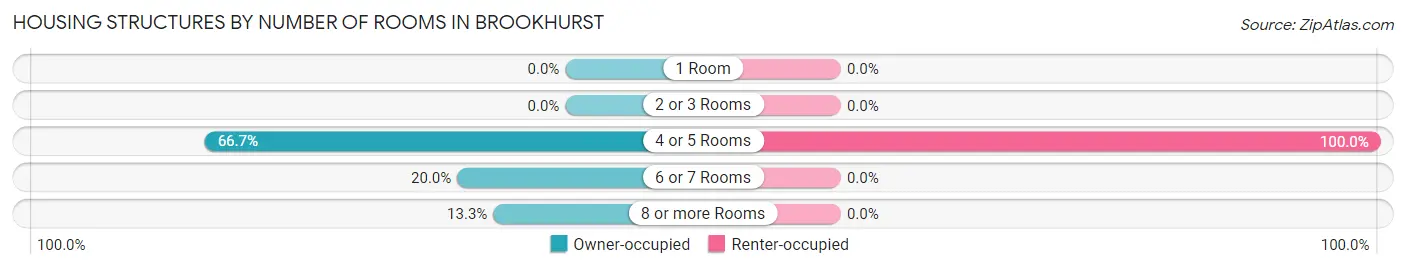
| Number of Rooms | Owner-occupied | Renter-occupied |
| 1 Room | 0 (0.0%) | 0 (0.0%) |
| 2 or 3 Rooms | 0 (0.0%) | 0 (0.0%) |
| 4 or 5 Rooms | 30 (66.7%) | 9 (100.0%) |
| 6 or 7 Rooms | 9 (20.0%) | 0 (0.0%) |
| 8 or more Rooms | 6 (13.3%) | 0 (0.0%) |
| Total | 45 (100.0%) | 9 (100.0%) |
Housing Structure by Heating Type in Brookhurst
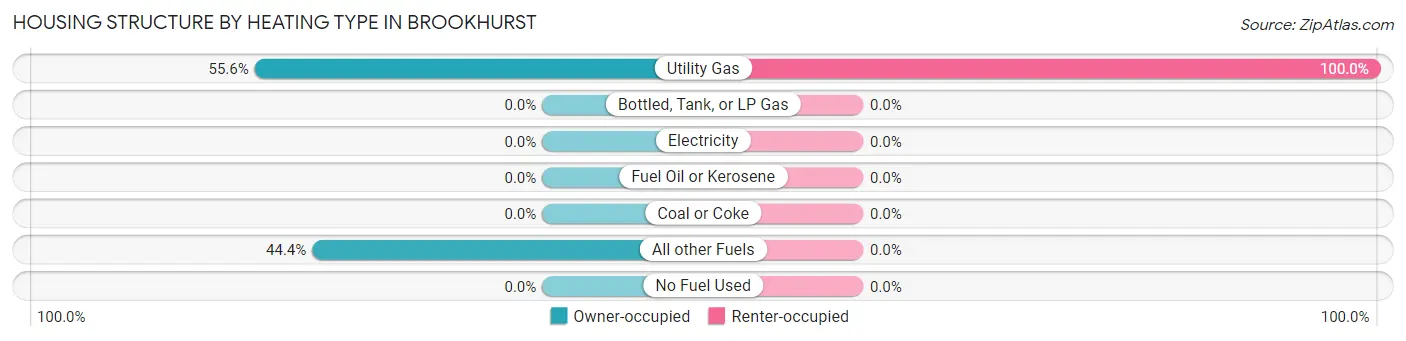
| Heating Type | Owner-occupied | Renter-occupied |
| Utility Gas | 25 (55.6%) | 9 (100.0%) |
| Bottled, Tank, or LP Gas | 0 (0.0%) | 0 (0.0%) |
| Electricity | 0 (0.0%) | 0 (0.0%) |
| Fuel Oil or Kerosene | 0 (0.0%) | 0 (0.0%) |
| Coal or Coke | 0 (0.0%) | 0 (0.0%) |
| All other Fuels | 20 (44.4%) | 0 (0.0%) |
| No Fuel Used | 0 (0.0%) | 0 (0.0%) |
| Total | 45 (100.0%) | 9 (100.0%) |
Household Vehicle Usage in Brookhurst
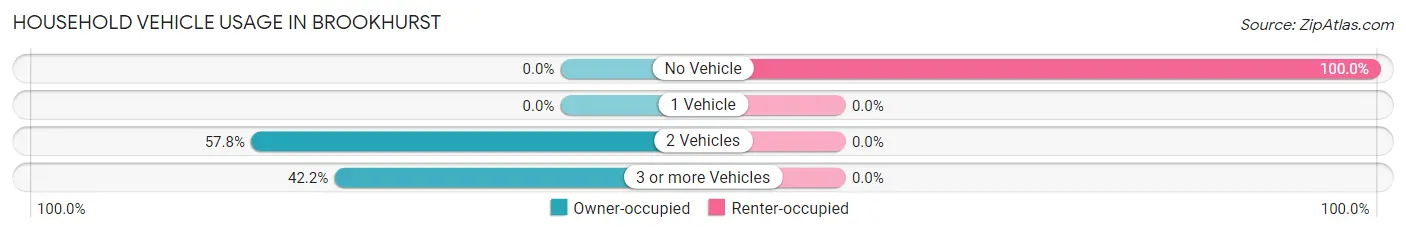
| Vehicles per Household | Owner-occupied | Renter-occupied |
| No Vehicle | 0 (0.0%) | 9 (100.0%) |
| 1 Vehicle | 0 (0.0%) | 0 (0.0%) |
| 2 Vehicles | 26 (57.8%) | 0 (0.0%) |
| 3 or more Vehicles | 19 (42.2%) | 0 (0.0%) |
| Total | 45 (100.0%) | 9 (100.0%) |
Real Estate & Mortgages in Brookhurst
Real Estate and Mortgage Overview in Brookhurst
| Characteristic | Without Mortgage | With Mortgage |
| Housing Units | 30 | 15 |
| Median Property Value | - | - |
| Median Household Income | - | - |
| Monthly Housing Costs | - | - |
| Real Estate Taxes | - | - |
Property Value by Mortgage Status in Brookhurst
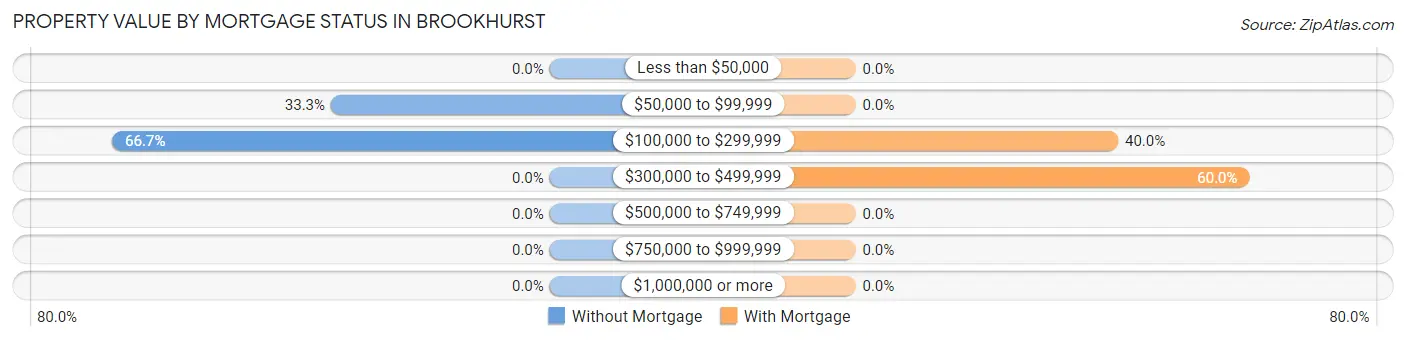
| Property Value | Without Mortgage | With Mortgage |
| Less than $50,000 | 0 (0.0%) | 0 (0.0%) |
| $50,000 to $99,999 | 10 (33.3%) | 0 (0.0%) |
| $100,000 to $299,999 | 20 (66.7%) | 6 (40.0%) |
| $300,000 to $499,999 | 0 (0.0%) | 9 (60.0%) |
| $500,000 to $749,999 | 0 (0.0%) | 0 (0.0%) |
| $750,000 to $999,999 | 0 (0.0%) | 0 (0.0%) |
| $1,000,000 or more | 0 (0.0%) | 0 (0.0%) |
| Total | 30 (100.0%) | 15 (100.0%) |
Household Income by Mortgage Status in Brookhurst
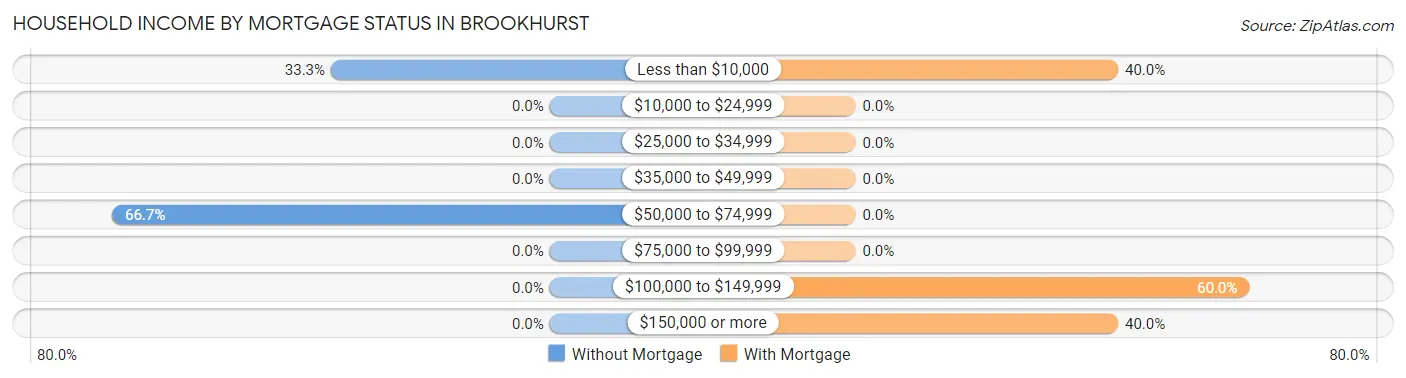
| Household Income | Without Mortgage | With Mortgage |
| Less than $10,000 | 10 (33.3%) | 6 (40.0%) |
| $10,000 to $24,999 | 0 (0.0%) | 0 (0.0%) |
| $25,000 to $34,999 | 0 (0.0%) | 0 (0.0%) |
| $35,000 to $49,999 | 0 (0.0%) | 0 (0.0%) |
| $50,000 to $74,999 | 20 (66.7%) | 0 (0.0%) |
| $75,000 to $99,999 | 0 (0.0%) | 0 (0.0%) |
| $100,000 to $149,999 | 0 (0.0%) | 9 (60.0%) |
| $150,000 or more | 0 (0.0%) | 6 (40.0%) |
| Total | 30 (100.0%) | 15 (100.0%) |
Property Value to Household Income Ratio in Brookhurst
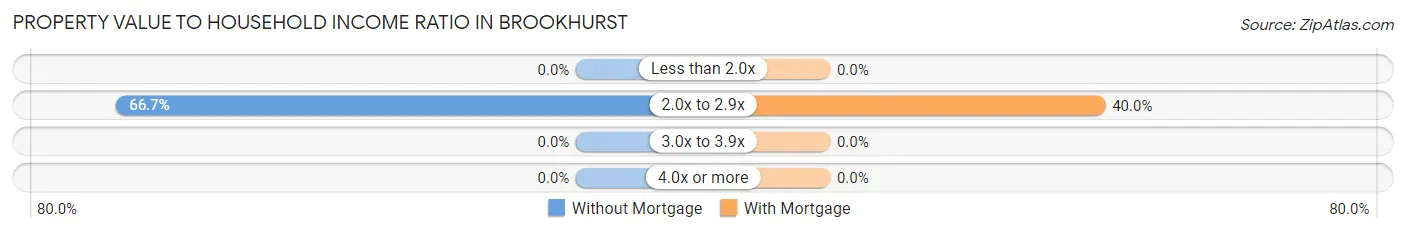
| Value-to-Income Ratio | Without Mortgage | With Mortgage |
| Less than 2.0x | 0 (0.0%) | 0 (0.0%) |
| 2.0x to 2.9x | 20 (66.7%) | 6 (40.0%) |
| 3.0x to 3.9x | 0 (0.0%) | 0 (0.0%) |
| 4.0x or more | 0 (0.0%) | 0 (0.0%) |
| Total | 30 (100.0%) | 15 (100.0%) |
Real Estate Taxes by Mortgage Status in Brookhurst
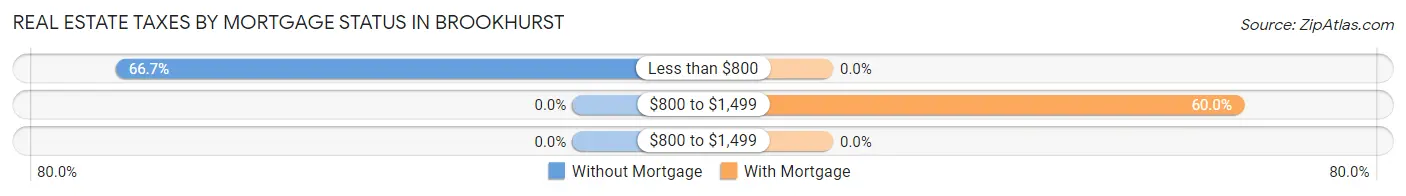
| Property Taxes | Without Mortgage | With Mortgage |
| Less than $800 | 20 (66.7%) | 0 (0.0%) |
| $800 to $1,499 | 0 (0.0%) | 9 (60.0%) |
| $800 to $1,499 | 0 (0.0%) | 0 (0.0%) |
| Total | 30 (100.0%) | 15 (100.0%) |
Health & Disability in Brookhurst
Health Insurance Coverage by Age in Brookhurst
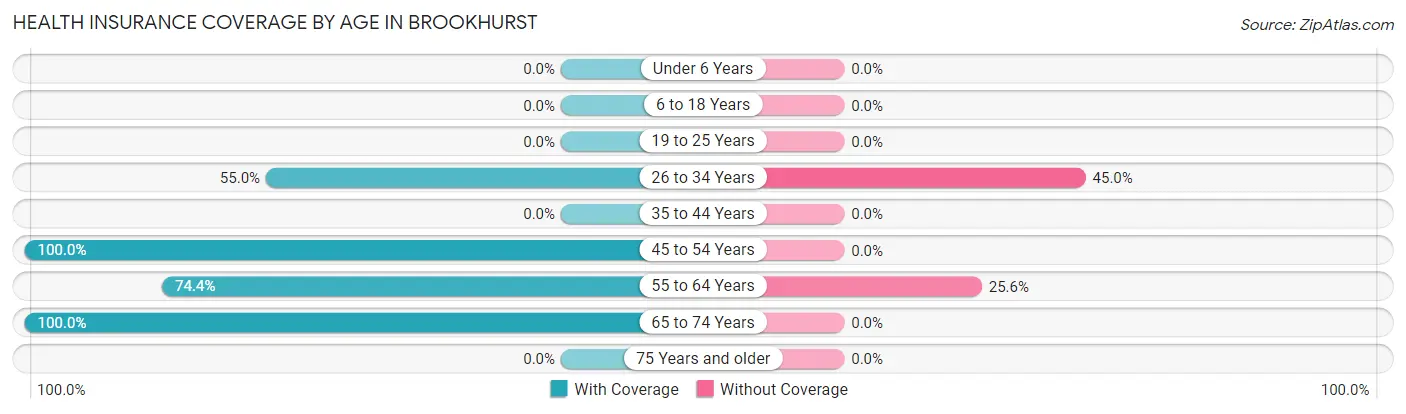
| Age Bracket | With Coverage | Without Coverage |
| Under 6 Years | 0 (0.0%) | 0 (0.0%) |
| 6 to 18 Years | 0 (0.0%) | 0 (0.0%) |
| 19 to 25 Years | 0 (0.0%) | 0 (0.0%) |
| 26 to 34 Years | 11 (55.0%) | 9 (45.0%) |
| 35 to 44 Years | 0 (0.0%) | 0 (0.0%) |
| 45 to 54 Years | 12 (100.0%) | 0 (0.0%) |
| 55 to 64 Years | 29 (74.4%) | 10 (25.6%) |
| 65 to 74 Years | 20 (100.0%) | 0 (0.0%) |
| 75 Years and older | 0 (0.0%) | 0 (0.0%) |
| Total | 72 (79.1%) | 19 (20.9%) |
Health Insurance Coverage by Citizenship Status in Brookhurst
| Citizenship Status | With Coverage | Without Coverage |
| Native Born | 0 (0.0%) | 0 (0.0%) |
| Foreign Born, Citizen | 0 (0.0%) | 0 (0.0%) |
| Foreign Born, not a Citizen | 0 (0.0%) | 0 (0.0%) |
Health Insurance Coverage by Household Income in Brookhurst
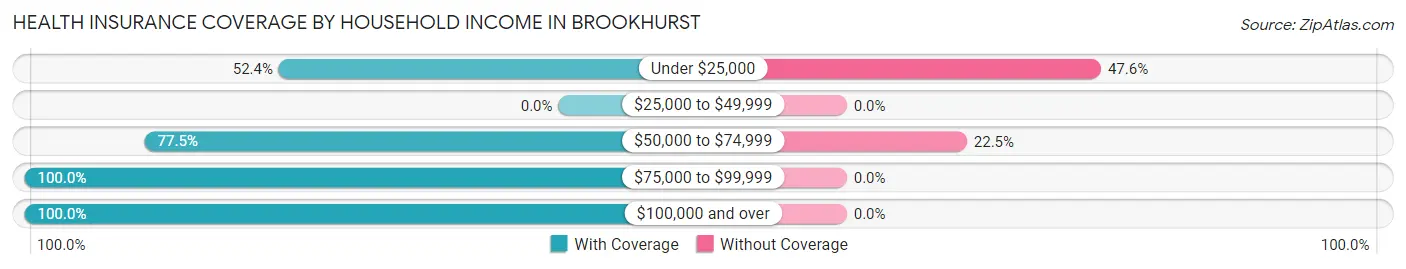
| Household Income | With Coverage | Without Coverage |
| Under $25,000 | 11 (52.4%) | 10 (47.6%) |
| $25,000 to $49,999 | 0 (0.0%) | 0 (0.0%) |
| $50,000 to $74,999 | 31 (77.5%) | 9 (22.5%) |
| $75,000 to $99,999 | 18 (100.0%) | 0 (0.0%) |
| $100,000 and over | 12 (100.0%) | 0 (0.0%) |
Public vs Private Health Insurance Coverage by Age in Brookhurst
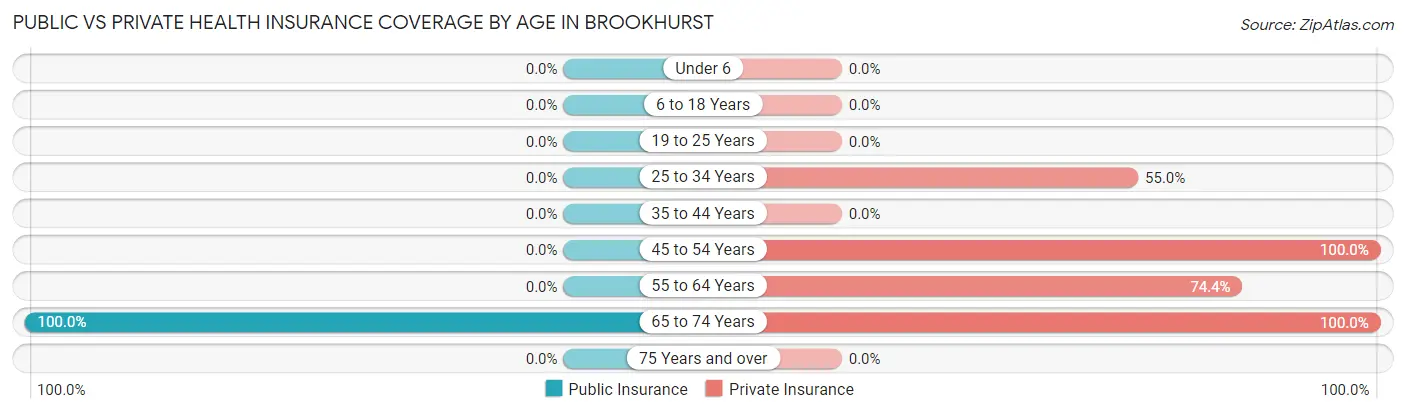
| Age Bracket | Public Insurance | Private Insurance |
| Under 6 | 0 (0.0%) | 0 (0.0%) |
| 6 to 18 Years | 0 (0.0%) | 0 (0.0%) |
| 19 to 25 Years | 0 (0.0%) | 0 (0.0%) |
| 25 to 34 Years | 0 (0.0%) | 11 (55.0%) |
| 35 to 44 Years | 0 (0.0%) | 0 (0.0%) |
| 45 to 54 Years | 0 (0.0%) | 12 (100.0%) |
| 55 to 64 Years | 0 (0.0%) | 29 (74.4%) |
| 65 to 74 Years | 20 (100.0%) | 20 (100.0%) |
| 75 Years and over | 0 (0.0%) | 0 (0.0%) |
| Total | 20 (22.0%) | 72 (79.1%) |
Disability Status by Sex by Age in Brookhurst
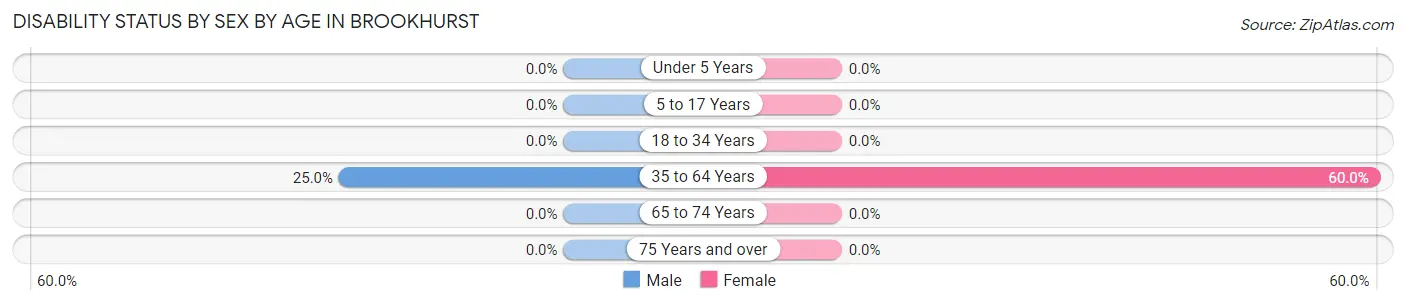
| Age Bracket | Male | Female |
| Under 5 Years | 0 (0.0%) | 0 (0.0%) |
| 5 to 17 Years | 0 (0.0%) | 0 (0.0%) |
| 18 to 34 Years | 0 (0.0%) | 0 (0.0%) |
| 35 to 64 Years | 9 (25.0%) | 9 (60.0%) |
| 65 to 74 Years | 0 (0.0%) | 0 (0.0%) |
| 75 Years and over | 0 (0.0%) | 0 (0.0%) |
Disability Class by Sex by Age in Brookhurst
Disability Class: Hearing Difficulty
| Age Bracket | Male | Female |
| Under 5 Years | 0 (0.0%) | 0 (0.0%) |
| 5 to 17 Years | 0 (0.0%) | 0 (0.0%) |
| 18 to 34 Years | 0 (0.0%) | 0 (0.0%) |
| 35 to 64 Years | 0 (0.0%) | 0 (0.0%) |
| 65 to 74 Years | 0 (0.0%) | 0 (0.0%) |
| 75 Years and over | 0 (0.0%) | 0 (0.0%) |
Disability Class: Vision Difficulty
| Age Bracket | Male | Female |
| Under 5 Years | 0 (0.0%) | 0 (0.0%) |
| 5 to 17 Years | 0 (0.0%) | 0 (0.0%) |
| 18 to 34 Years | 0 (0.0%) | 0 (0.0%) |
| 35 to 64 Years | 9 (25.0%) | 0 (0.0%) |
| 65 to 74 Years | 0 (0.0%) | 0 (0.0%) |
| 75 Years and over | 0 (0.0%) | 0 (0.0%) |
Disability Class: Cognitive Difficulty
| Age Bracket | Male | Female |
| 5 to 17 Years | 0 (0.0%) | 0 (0.0%) |
| 18 to 34 Years | 0 (0.0%) | 0 (0.0%) |
| 35 to 64 Years | 0 (0.0%) | 9 (60.0%) |
| 65 to 74 Years | 0 (0.0%) | 0 (0.0%) |
| 75 Years and over | 0 (0.0%) | 0 (0.0%) |
Disability Class: Ambulatory Difficulty
| Age Bracket | Male | Female |
| 5 to 17 Years | 0 (0.0%) | 0 (0.0%) |
| 18 to 34 Years | 0 (0.0%) | 0 (0.0%) |
| 35 to 64 Years | 0 (0.0%) | 0 (0.0%) |
| 65 to 74 Years | 0 (0.0%) | 0 (0.0%) |
| 75 Years and over | 0 (0.0%) | 0 (0.0%) |
Disability Class: Self-Care Difficulty
| Age Bracket | Male | Female |
| 5 to 17 Years | 0 (0.0%) | 0 (0.0%) |
| 18 to 34 Years | 0 (0.0%) | 0 (0.0%) |
| 35 to 64 Years | 0 (0.0%) | 0 (0.0%) |
| 65 to 74 Years | 0 (0.0%) | 0 (0.0%) |
| 75 Years and over | 0 (0.0%) | 0 (0.0%) |
Technology Access in Brookhurst
Computing Device Access in Brookhurst
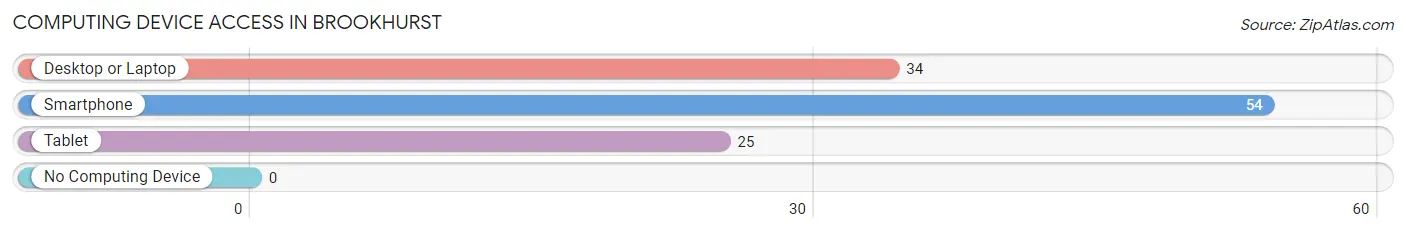
| Device Type | # Households | % Households |
| Desktop or Laptop | 34 | 63.0% |
| Smartphone | 54 | 100.0% |
| Tablet | 25 | 46.3% |
| No Computing Device | 0 | 0.0% |
| Total | 54 | 100.0% |
Internet Access in Brookhurst
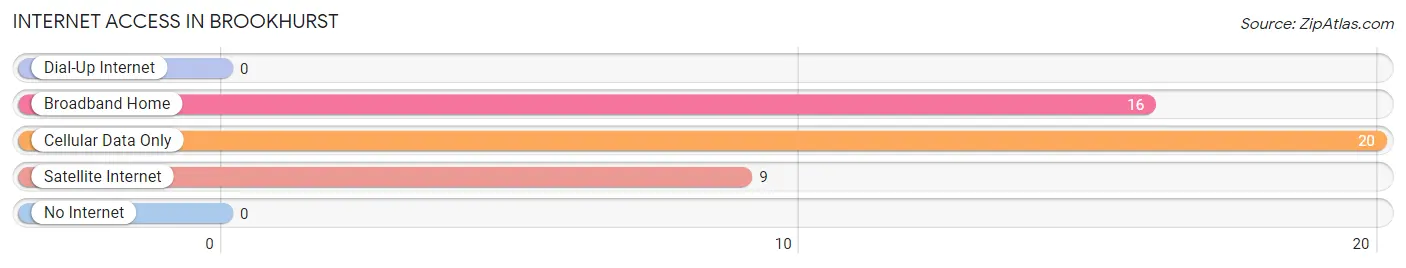
| Internet Type | # Households | % Households |
| Dial-Up Internet | 0 | 0.0% |
| Broadband Home | 16 | 29.6% |
| Cellular Data Only | 20 | 37.0% |
| Satellite Internet | 9 | 16.7% |
| No Internet | 0 | 0.0% |
| Total | 54 | 100.0% |
Brookhurst Summary
History
Brookhurst, Wyoming is a small town located in the southeastern corner of the state. It was founded in 1882 by a group of settlers who were looking for a place to settle and start a new life. The town was named after the nearby Brookhurst Creek, which was named after the first settler, John Brookhurst.
The town was originally a farming community, with the main crops being wheat, corn, and hay. The town also had a few small businesses, such as a general store, a blacksmith, and a post office.
In the early 1900s, the town began to grow and develop. The railroad came to town in 1906, and the town began to expand. The population grew to over 500 people by 1910.
The town continued to grow and develop throughout the 20th century. In the 1950s, the town was home to a large number of oil wells, which provided jobs and income for the townspeople. The town also had a number of small businesses, such as a grocery store, a hardware store, and a movie theater.
Geography
Brookhurst is located in the southeastern corner of Wyoming, near the border with Colorado. The town is situated in the foothills of the Rocky Mountains, and is surrounded by rolling hills and grasslands. The town is located at an elevation of 5,400 feet above sea level.
The climate in Brookhurst is semi-arid, with hot summers and cold winters. The average annual temperature is around 50 degrees Fahrenheit. The town receives an average of 16 inches of precipitation per year.
Economy
The economy of Brookhurst is largely based on agriculture and oil production. The town is home to a number of farms, which produce wheat, corn, hay, and other crops. The town also has a number of oil wells, which provide jobs and income for the townspeople.
The town also has a number of small businesses, such as a grocery store, a hardware store, and a movie theater. The town also has a few restaurants and bars.
Demographics
As of the 2010 census, the population of Brookhurst was 545 people. The racial makeup of the town was 97.3% White, 0.2% African American, 0.2% Native American, 0.2% Asian, 0.2% from other races, and 1.9% from two or more races.
The median household income in Brookhurst was $41,250, and the median family income was $45,625. The per capita income in the town was $19,845. About 11.2% of the population was below the poverty line.
Common Questions
What is Per Capita Income in Brookhurst?
Per Capita income in Brookhurst is $39,930.
What is the Median Household income in Brookhurst?
Median Household Income in Brookhurst is $71,000.
What is Inequality or Gini Index in Brookhurst?
Inequality or Gini Index in Brookhurst is 0.27.
What is the Total Population of Brookhurst?
Total Population of Brookhurst is 91.
What is the Total Male Population of Brookhurst?
Total Male Population of Brookhurst is 65.
What is the Total Female Population of Brookhurst?
Total Female Population of Brookhurst is 26.
What is the Ratio of Males per 100 Females in Brookhurst?
There are 250.00 Males per 100 Females in Brookhurst.
What is the Ratio of Females per 100 Males in Brookhurst?
There are 40.00 Females per 100 Males in Brookhurst.
What is the Median Population Age in Brookhurst?
Median Population Age in Brookhurst is 62.2 Years.
What is the Average Family Size in Brookhurst
Average Family Size in Brookhurst is 2.0 People.
What is the Average Household Size in Brookhurst
Average Household Size in Brookhurst is 1.7 People.
How Large is the Labor Force in Brookhurst?
There are 41 People in the Labor Forcein in Brookhurst.
What is the Percentage of People in the Labor Force in Brookhurst?
45.1% of People are in the Labor Force in Brookhurst.