Turnerville, WY Map & Demographics
Turnerville Map
Turnerville Overview
$39,070
PER CAPITA INCOME
13.8%
WAGE / INCOME GAP [ % ]
86.2¢/ $1
WAGE / INCOME GAP [ $ ]
0.37
INEQUALITY / GINI INDEX
328
TOTAL POPULATION
195
MALE POPULATION
133
FEMALE POPULATION
146.62
MALES / 100 FEMALES
68.21
FEMALES / 100 MALES
62.3
MEDIAN AGE
2.4
AVG FAMILY SIZE
2.4
AVG HOUSEHOLD SIZE
250
LABOR FORCE [ PEOPLE ]
78.4%
PERCENT IN LABOR FORCE
Turnerville Area Codes
Income in Turnerville
Income Overview in Turnerville
| Characteristic | Number | Measure |
| Per Capita Income | 328 | $39,070 |
| Median Family Income | 137 | $0 |
| Mean Family Income | 137 | $89,375 |
| Median Household Income | 137 | $0 |
| Mean Household Income | 137 | $89,375 |
| Income Deficit | 137 | $0 |
| Wage / Income Gap (%) | 328 | 13.84% |
| Wage / Income Gap ($) | 328 | 86.16¢ per $1 |
| Gini / Inequality Index | 328 | 0.37 |
Earnings by Sex in Turnerville
Average Earnings in Turnerville are $34,212, $33,533 for men and $38,920 for women, a difference of 13.8%.
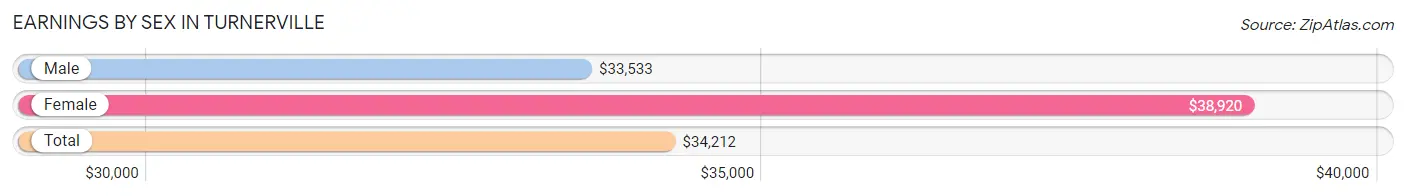
| Sex | Number | Average Earnings |
| Male | 186 (72.9%) | $33,533 |
| Female | 69 (27.1%) | $38,920 |
| Total | 255 (100.0%) | $34,212 |
Earnings by Sex by Income Bracket in Turnerville
The most common earnings brackets in Turnerville are $10,000 to $12,499 for men (69 | 37.1%) and $17,500 to $19,999 for women (22 | 31.9%).
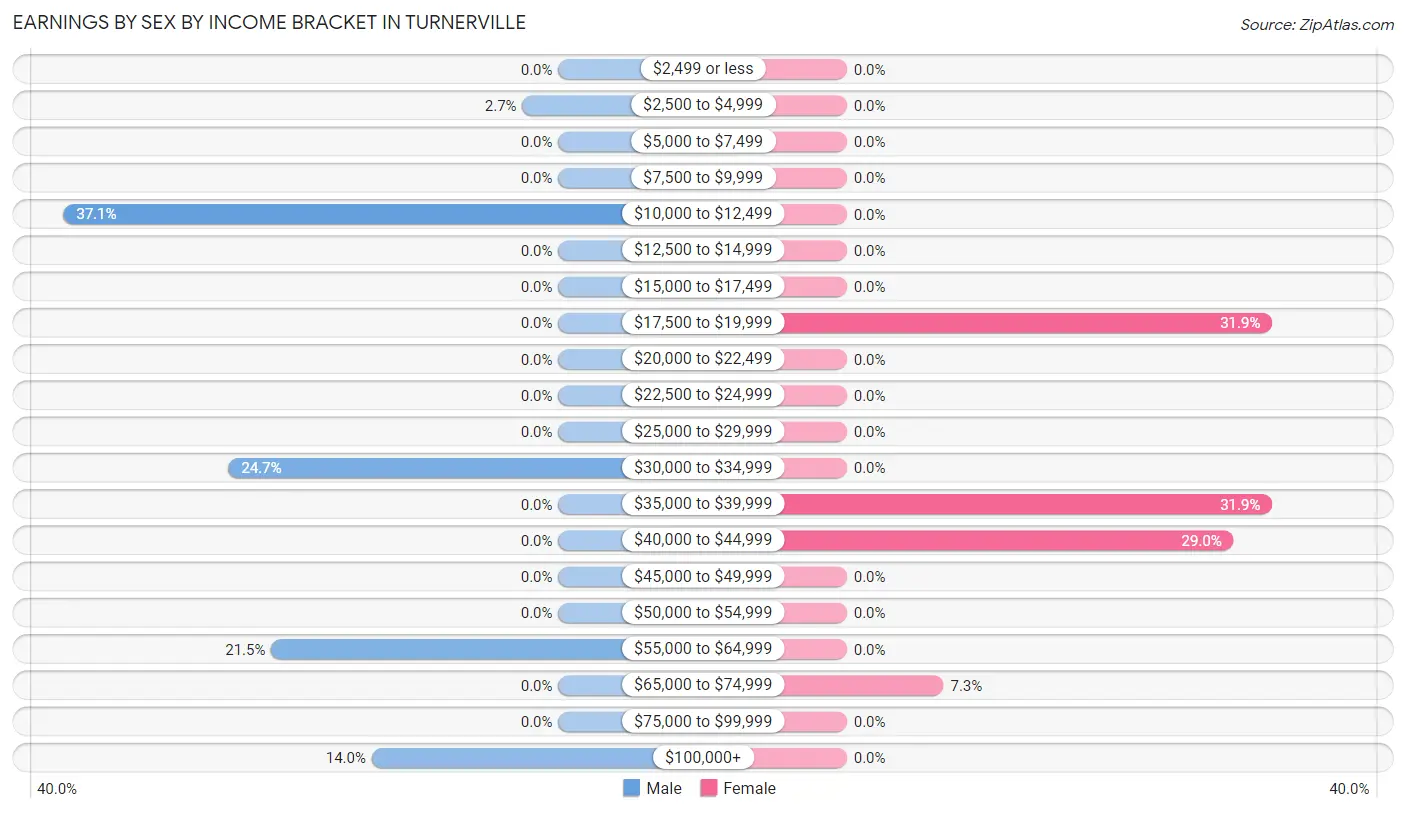
| Income | Male | Female |
| $2,499 or less | 0 (0.0%) | 0 (0.0%) |
| $2,500 to $4,999 | 5 (2.7%) | 0 (0.0%) |
| $5,000 to $7,499 | 0 (0.0%) | 0 (0.0%) |
| $7,500 to $9,999 | 0 (0.0%) | 0 (0.0%) |
| $10,000 to $12,499 | 69 (37.1%) | 0 (0.0%) |
| $12,500 to $14,999 | 0 (0.0%) | 0 (0.0%) |
| $15,000 to $17,499 | 0 (0.0%) | 0 (0.0%) |
| $17,500 to $19,999 | 0 (0.0%) | 22 (31.9%) |
| $20,000 to $22,499 | 0 (0.0%) | 0 (0.0%) |
| $22,500 to $24,999 | 0 (0.0%) | 0 (0.0%) |
| $25,000 to $29,999 | 0 (0.0%) | 0 (0.0%) |
| $30,000 to $34,999 | 46 (24.7%) | 0 (0.0%) |
| $35,000 to $39,999 | 0 (0.0%) | 22 (31.9%) |
| $40,000 to $44,999 | 0 (0.0%) | 20 (29.0%) |
| $45,000 to $49,999 | 0 (0.0%) | 0 (0.0%) |
| $50,000 to $54,999 | 0 (0.0%) | 0 (0.0%) |
| $55,000 to $64,999 | 40 (21.5%) | 0 (0.0%) |
| $65,000 to $74,999 | 0 (0.0%) | 5 (7.2%) |
| $75,000 to $99,999 | 0 (0.0%) | 0 (0.0%) |
| $100,000+ | 26 (14.0%) | 0 (0.0%) |
| Total | 186 (100.0%) | 69 (100.0%) |
Earnings by Sex by Educational Attainment in Turnerville
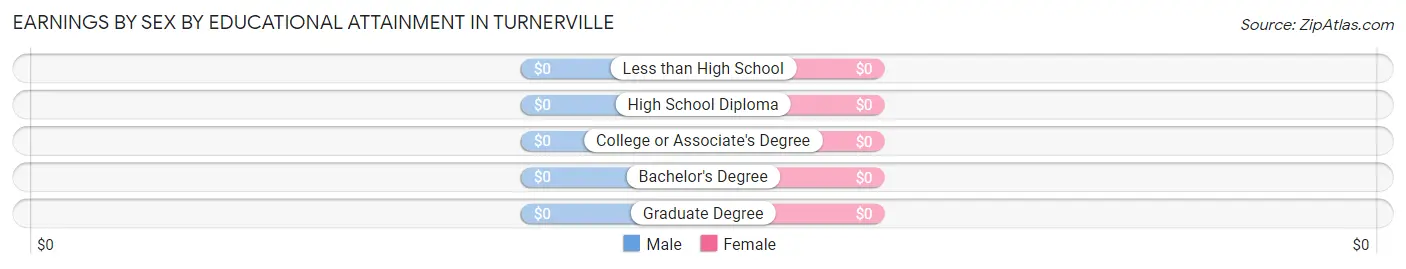
| Educational Attainment | Male Income | Female Income |
| Less than High School | - | - |
| High School Diploma | - | - |
| College or Associate's Degree | - | - |
| Bachelor's Degree | - | - |
| Graduate Degree | - | - |
| Total | $33,668 | $38,920 |
Family Income in Turnerville
Family Income Brackets in Turnerville
According to the Turnerville family income data, there are 69 families falling into the $35,000 to $49,999 income range, which is the most common income bracket and makes up 50.4% of all families.
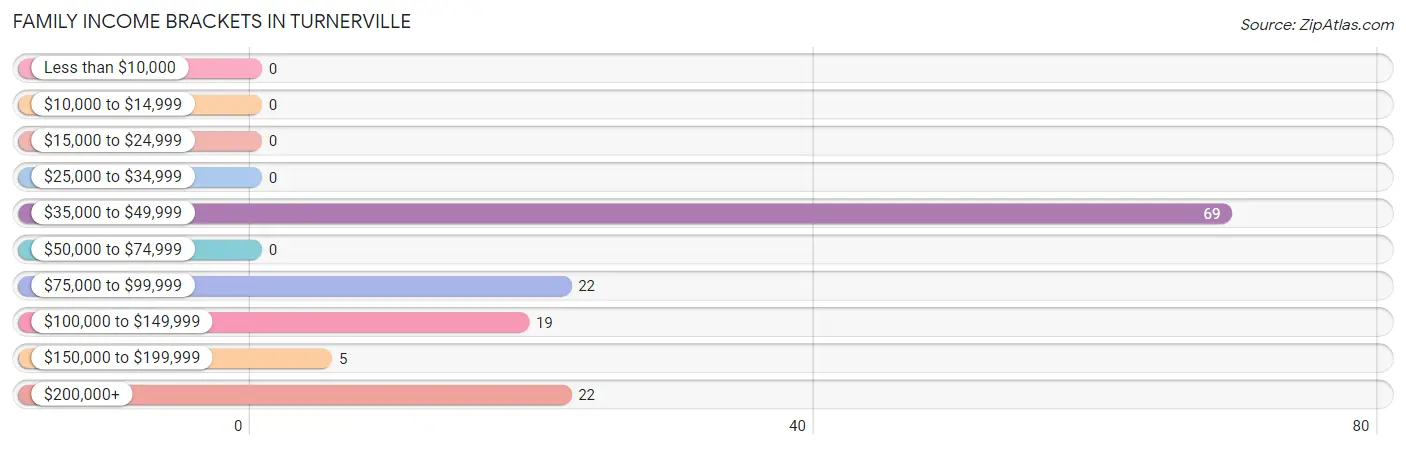
| Income Bracket | # Families | % Families |
| Less than $10,000 | 0 | 0.0% |
| $10,000 to $14,999 | 0 | 0.0% |
| $15,000 to $24,999 | 0 | 0.0% |
| $25,000 to $34,999 | 0 | 0.0% |
| $35,000 to $49,999 | 69 | 50.4% |
| $50,000 to $74,999 | 0 | 0.0% |
| $75,000 to $99,999 | 22 | 16.1% |
| $100,000 to $149,999 | 19 | 13.9% |
| $150,000 to $199,999 | 5 | 3.6% |
| $200,000+ | 22 | 16.1% |
Family Income by Famaliy Size in Turnerville
2-person families (110 | 80.3%) account for the highest median family income in Turnerville with $39,493 per family, while 2-person families (110 | 80.3%) have the highest median income of $19,746 per family member.
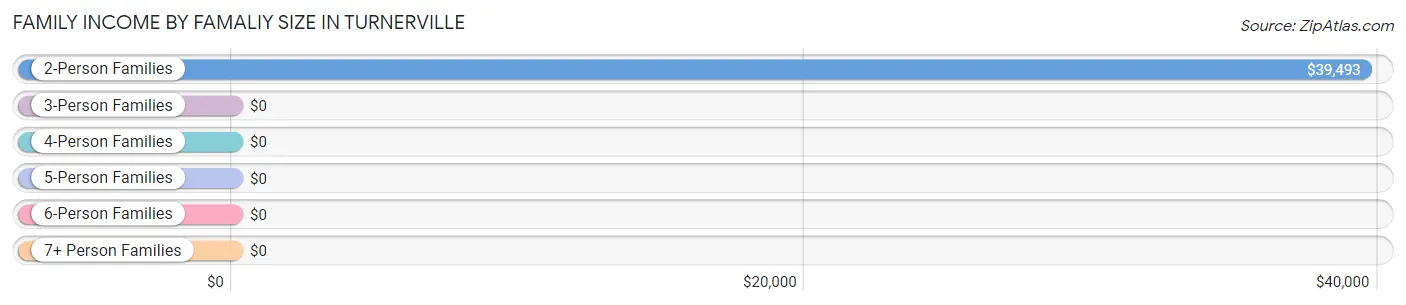
| Income Bracket | # Families | Median Income |
| 2-Person Families | 110 (80.3%) | $39,493 |
| 3-Person Families | 22 (16.1%) | $0 |
| 4-Person Families | 0 (0.0%) | $0 |
| 5-Person Families | 5 (3.6%) | $0 |
| 6-Person Families | 0 (0.0%) | $0 |
| 7+ Person Families | 0 (0.0%) | $0 |
| Total | 137 (100.0%) | $0 |
Family Income by Number of Earners in Turnerville
| Number of Earners | # Families | Median Income |
| No Earners | 0 (0.0%) | $0 |
| 1 Earner | 69 (50.4%) | $0 |
| 2 Earners | 41 (29.9%) | $0 |
| 3+ Earners | 27 (19.7%) | $0 |
| Total | 137 (100.0%) | $0 |
Household Income in Turnerville
Household Income Brackets in Turnerville
With 69 households falling in the category, the $35,000 to $49,999 income range is the most frequent in Turnerville, accounting for 50.4% of all households.
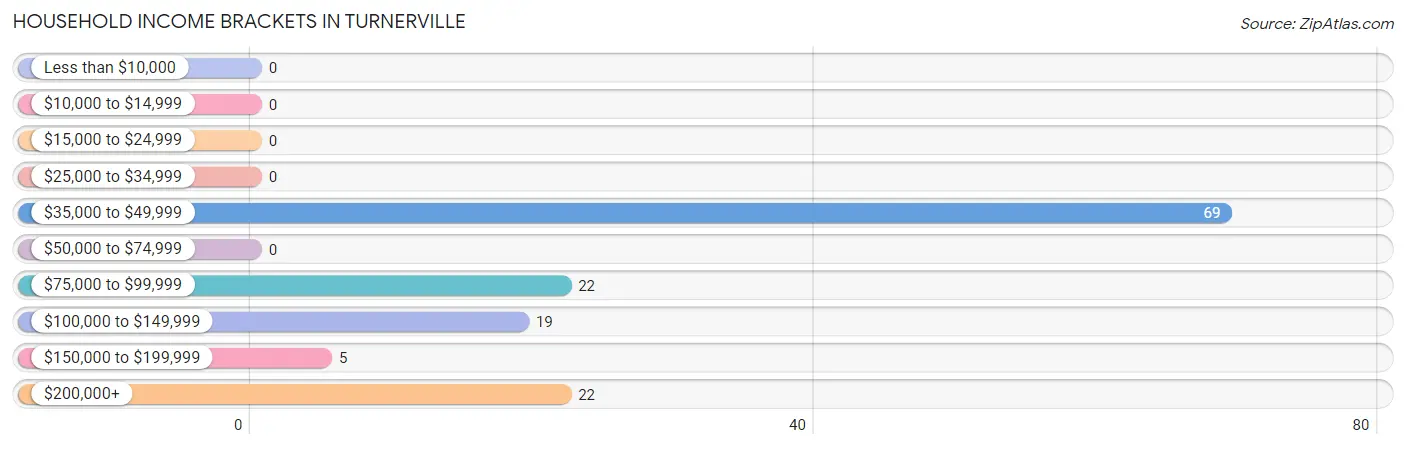
| Income Bracket | # Households | % Households |
| Less than $10,000 | 0 | 0.0% |
| $10,000 to $14,999 | 0 | 0.0% |
| $15,000 to $24,999 | 0 | 0.0% |
| $25,000 to $34,999 | 0 | 0.0% |
| $35,000 to $49,999 | 69 | 50.4% |
| $50,000 to $74,999 | 0 | 0.0% |
| $75,000 to $99,999 | 22 | 16.1% |
| $100,000 to $149,999 | 19 | 13.9% |
| $150,000 to $199,999 | 5 | 3.6% |
| $200,000+ | 22 | 16.1% |
Household Income by Householder Age in Turnerville
| Income Bracket | # Households | Median Income |
| 15 to 24 Years | 0 (0.0%) | $0 |
| 25 to 44 Years | 5 (3.6%) | $0 |
| 45 to 64 Years | 63 (46.0%) | $0 |
| 65+ Years | 69 (50.4%) | $0 |
| Total | 137 (100.0%) | $0 |
Poverty in Turnerville
Income Below Poverty by Sex and Age in Turnerville
| Age Bracket | Male | Female |
| Under 5 Years | 0 (0.0%) | 0 (0.0%) |
| 5 Years | 0 (0.0%) | 0 (0.0%) |
| 6 to 11 Years | 0 (0.0%) | 0 (0.0%) |
| 12 to 14 Years | 0 (0.0%) | 0 (0.0%) |
| 15 Years | 0 (0.0%) | 0 (0.0%) |
| 16 and 17 Years | 0 (0.0%) | 0 (0.0%) |
| 18 to 24 Years | 0 (0.0%) | 0 (0.0%) |
| 25 to 34 Years | 0 (0.0%) | 0 (0.0%) |
| 35 to 44 Years | 0 (0.0%) | 0 (0.0%) |
| 45 to 54 Years | 0 (0.0%) | 0 (0.0%) |
| 55 to 64 Years | 0 (0.0%) | 0 (0.0%) |
| 65 to 74 Years | 0 (0.0%) | 0 (0.0%) |
| 75 Years and over | 0 (0.0%) | 0 (0.0%) |
| Total | 0 (0.0%) | 0 (0.0%) |
Income Above Poverty by Sex and Age in Turnerville
According to the poverty statistics in Turnerville, males aged 12 to 14 years and females aged 35 to 44 years are the age groups that are most secure financially, with 100.0% of males and 100.0% of females in these age groups living above the poverty line.
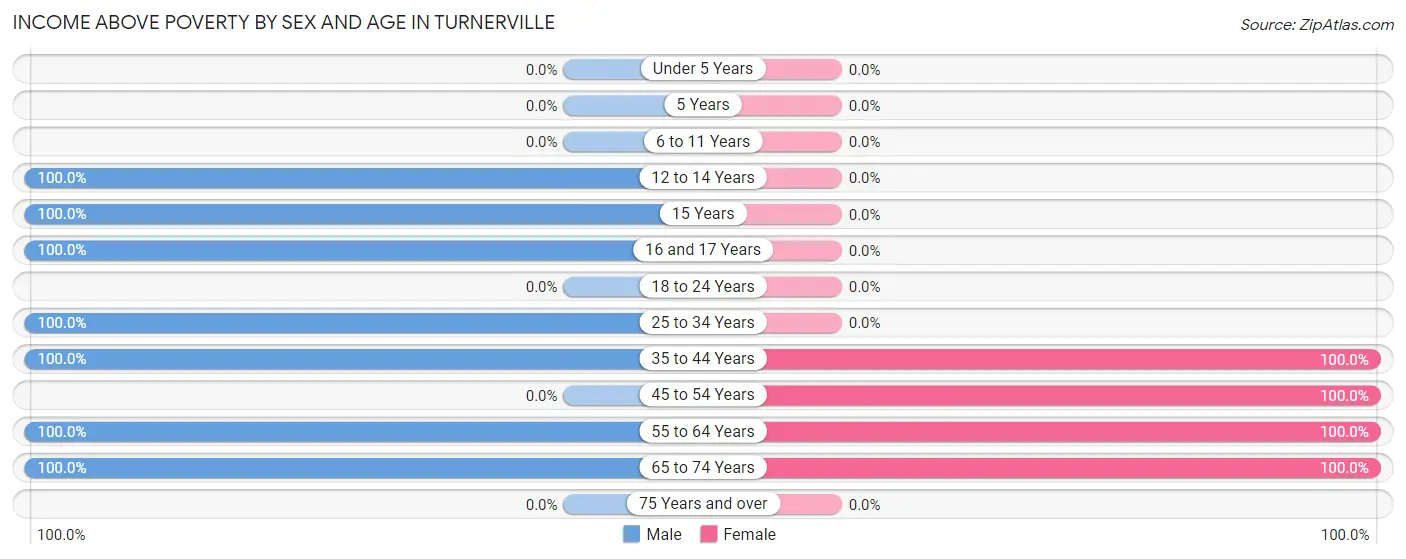
| Age Bracket | Male | Female |
| Under 5 Years | 0 (0.0%) | 0 (0.0%) |
| 5 Years | 0 (0.0%) | 0 (0.0%) |
| 6 to 11 Years | 0 (0.0%) | 0 (0.0%) |
| 12 to 14 Years | 6 (100.0%) | 0 (0.0%) |
| 15 Years | 3 (100.0%) | 0 (0.0%) |
| 16 and 17 Years | 5 (100.0%) | 0 (0.0%) |
| 18 to 24 Years | 0 (0.0%) | 0 (0.0%) |
| 25 to 34 Years | 46 (100.0%) | 0 (0.0%) |
| 35 to 44 Years | 5 (100.0%) | 5 (100.0%) |
| 45 to 54 Years | 0 (0.0%) | 20 (100.0%) |
| 55 to 64 Years | 61 (100.0%) | 44 (100.0%) |
| 65 to 74 Years | 69 (100.0%) | 64 (100.0%) |
| 75 Years and over | 0 (0.0%) | 0 (0.0%) |
| Total | 195 (100.0%) | 133 (100.0%) |
Income Below Poverty Among Married-Couple Families in Turnerville
| Children | Above Poverty | Below Poverty |
| No Children | 132 (100.0%) | 0 (0.0%) |
| 1 or 2 Children | 0 (0.0%) | 0 (0.0%) |
| 3 or 4 Children | 5 (100.0%) | 0 (0.0%) |
| 5 or more Children | 0 (0.0%) | 0 (0.0%) |
| Total | 137 (100.0%) | 0 (0.0%) |
Income Below Poverty Among Single-Parent Households in Turnerville
| Children | Single Father | Single Mother |
| No Children | 0 (0.0%) | 0 (0.0%) |
| 1 or 2 Children | 0 (0.0%) | 0 (0.0%) |
| 3 or 4 Children | 0 (0.0%) | 0 (0.0%) |
| 5 or more Children | 0 (0.0%) | 0 (0.0%) |
| Total | 0 (0.0%) | 0 (0.0%) |
Income Below Poverty Among Married-Couple vs Single-Parent Households in Turnerville
| Children | Married-Couple Families | Single-Parent Households |
| No Children | 0 (0.0%) | 0 (0.0%) |
| 1 or 2 Children | 0 (0.0%) | 0 (0.0%) |
| 3 or 4 Children | 0 (0.0%) | 0 (0.0%) |
| 5 or more Children | 0 (0.0%) | 0 (0.0%) |
| Total | 0 (0.0%) | 0 (0.0%) |
Race in Turnerville
The most populous races in Turnerville are , and White / Caucasian (328 | 100.0%).
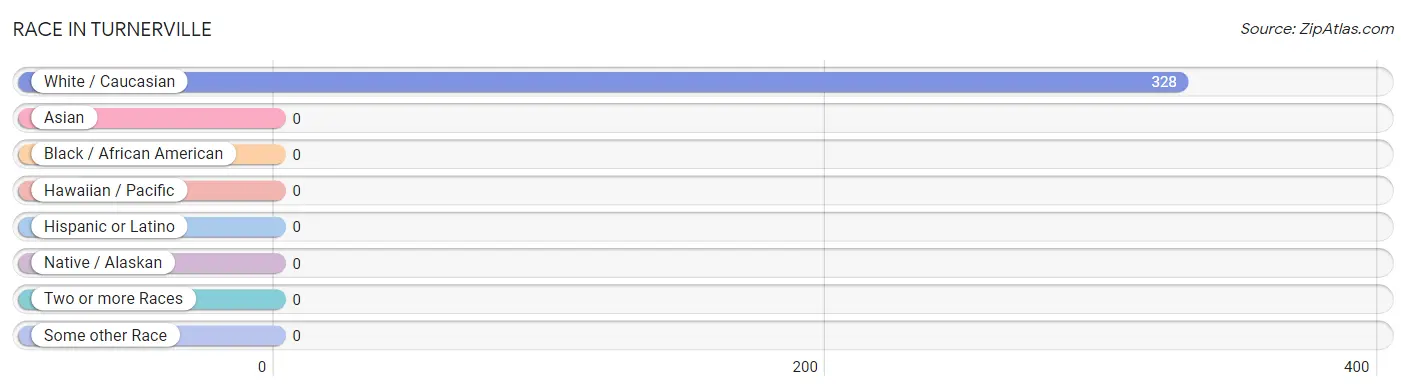
| Race | # Population | % Population |
| Asian | 0 | 0.0% |
| Black / African American | 0 | 0.0% |
| Hawaiian / Pacific | 0 | 0.0% |
| Hispanic or Latino | 0 | 0.0% |
| Native / Alaskan | 0 | 0.0% |
| White / Caucasian | 328 | 100.0% |
| Two or more Races | 0 | 0.0% |
| Some other Race | 0 | 0.0% |
| Total | 328 | 100.0% |
Ancestry in Turnerville
The most populous ancestries reported in Turnerville are English (151 | 46.0%), American (89 | 27.1%), and German (21 | 6.4%), together accounting for 79.6% of all Turnerville residents.
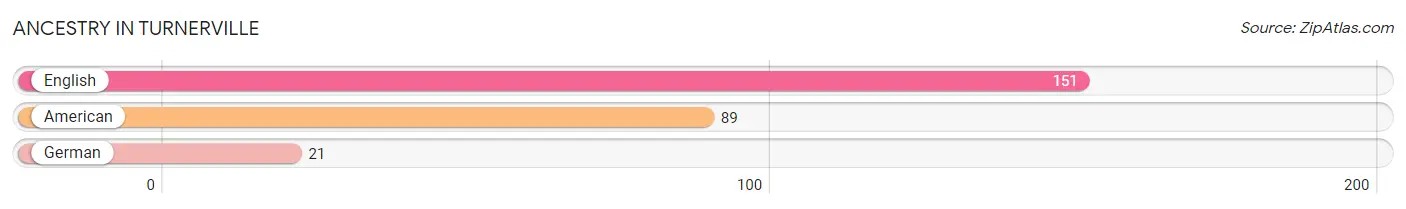
| Ancestry | # Population | % Population |
| American | 89 | 27.1% |
| English | 151 | 46.0% |
| German | 21 | 6.4% | View All 3 Rows |
Immigrants in Turnerville

| Immigration Origin | # Population | % Population | View All 0 Rows |
Sex and Age in Turnerville
Sex and Age in Turnerville
The most populous age groups in Turnerville are 70 to 74 Years (69 | 35.4%) for men and 70 to 74 Years (64 | 48.1%) for women.
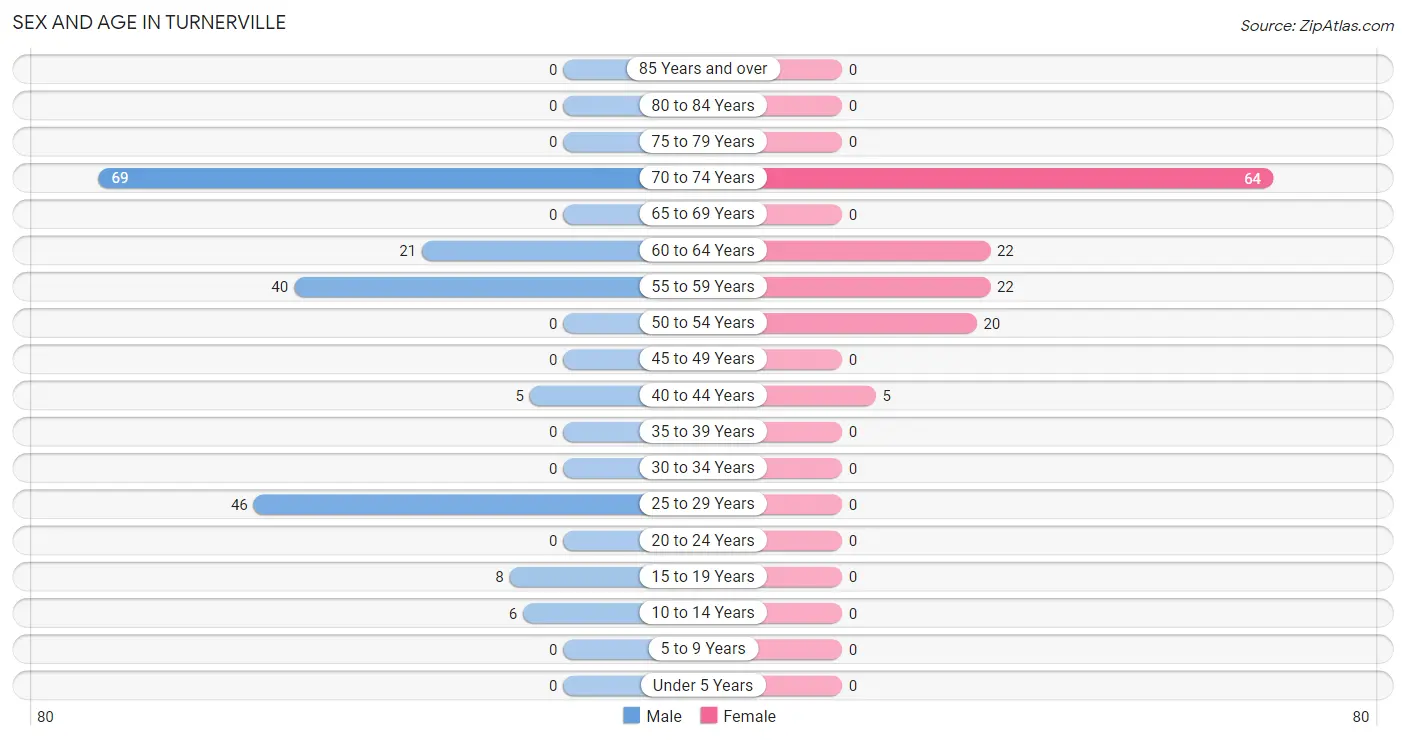
| Age Bracket | Male | Female |
| Under 5 Years | 0 (0.0%) | 0 (0.0%) |
| 5 to 9 Years | 0 (0.0%) | 0 (0.0%) |
| 10 to 14 Years | 6 (3.1%) | 0 (0.0%) |
| 15 to 19 Years | 8 (4.1%) | 0 (0.0%) |
| 20 to 24 Years | 0 (0.0%) | 0 (0.0%) |
| 25 to 29 Years | 46 (23.6%) | 0 (0.0%) |
| 30 to 34 Years | 0 (0.0%) | 0 (0.0%) |
| 35 to 39 Years | 0 (0.0%) | 0 (0.0%) |
| 40 to 44 Years | 5 (2.6%) | 5 (3.8%) |
| 45 to 49 Years | 0 (0.0%) | 0 (0.0%) |
| 50 to 54 Years | 0 (0.0%) | 20 (15.0%) |
| 55 to 59 Years | 40 (20.5%) | 22 (16.5%) |
| 60 to 64 Years | 21 (10.8%) | 22 (16.5%) |
| 65 to 69 Years | 0 (0.0%) | 0 (0.0%) |
| 70 to 74 Years | 69 (35.4%) | 64 (48.1%) |
| 75 to 79 Years | 0 (0.0%) | 0 (0.0%) |
| 80 to 84 Years | 0 (0.0%) | 0 (0.0%) |
| 85 Years and over | 0 (0.0%) | 0 (0.0%) |
| Total | 195 (100.0%) | 133 (100.0%) |
Families and Households in Turnerville
Median Family Size in Turnerville
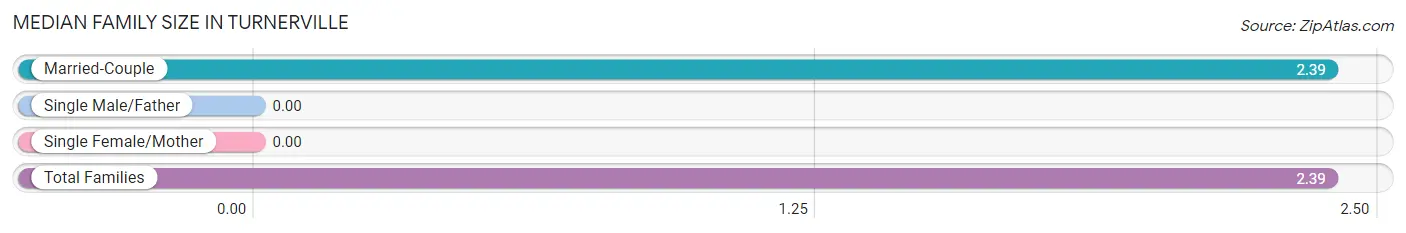
| Family Type | # Families | Family Size |
| Married-Couple | 137 (100.0%) | 2.39 |
| Single Male/Father | 0 (0.0%) | - |
| Single Female/Mother | 0 (0.0%) | - |
| Total Families | 137 (100.0%) | 2.39 |
Median Household Size in Turnerville
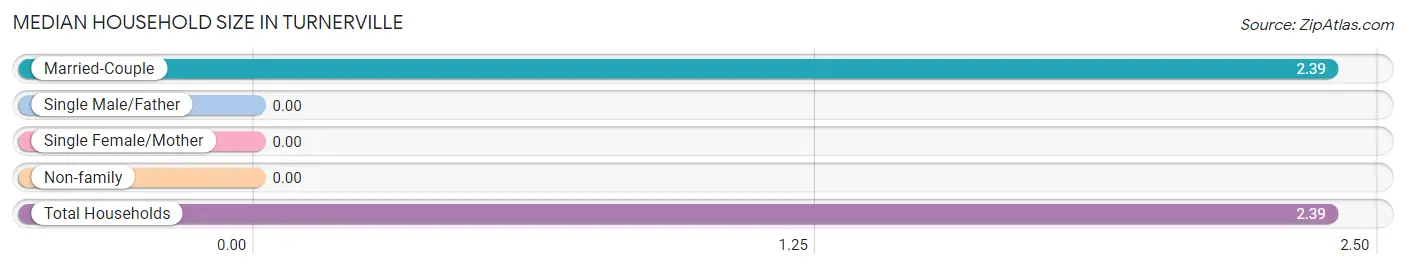
| Household Type | # Households | Household Size |
| Married-Couple | 137 (100.0%) | 2.39 |
| Single Male/Father | 0 (0.0%) | - |
| Single Female/Mother | 0 (0.0%) | - |
| Non-family | 0 (0.0%) | - |
| Total Households | 137 (100.0%) | 2.39 |
Household Size by Marriage Status in Turnerville
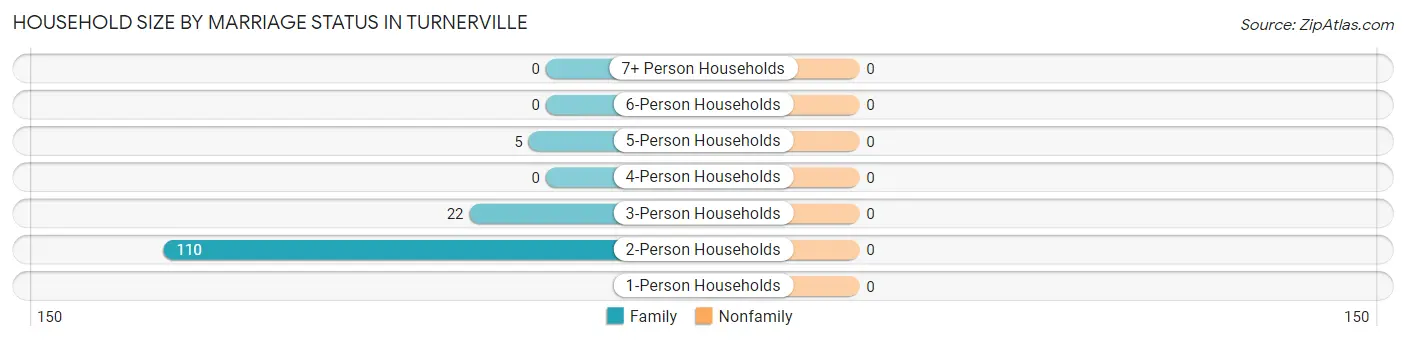
| Household Size | Family Households | Nonfamily Households |
| 1-Person Households | - | 0 (0.0%) |
| 2-Person Households | 110 (80.3%) | 0 (0.0%) |
| 3-Person Households | 22 (16.1%) | 0 (0.0%) |
| 4-Person Households | 0 (0.0%) | 0 (0.0%) |
| 5-Person Households | 5 (3.6%) | 0 (0.0%) |
| 6-Person Households | 0 (0.0%) | 0 (0.0%) |
| 7+ Person Households | 0 (0.0%) | 0 (0.0%) |
| Total | 137 (100.0%) | 0 (0.0%) |
Female Fertility in Turnerville
Fertility by Age in Turnerville
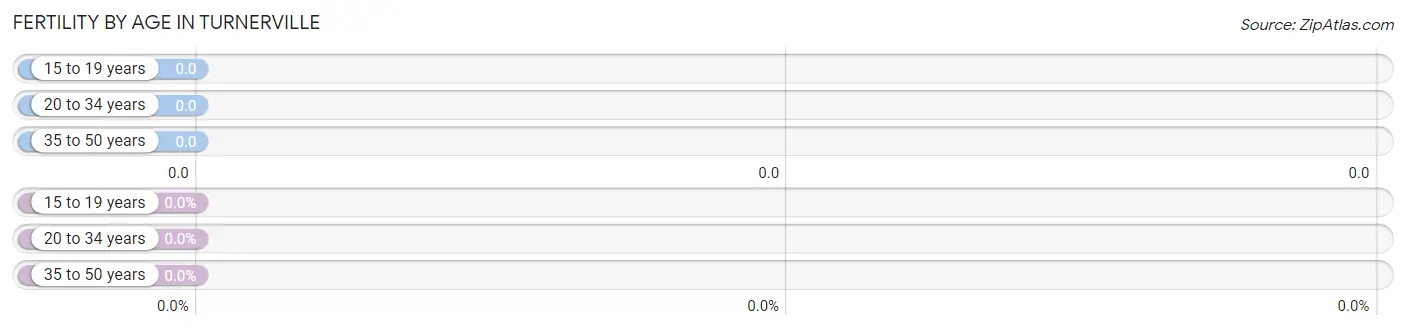
| Age Bracket | Women with Births | Births / 1,000 Women |
| 15 to 19 years | 0 (0.0%) | 0.0 |
| 20 to 34 years | 0 (0.0%) | 0.0 |
| 35 to 50 years | 0 (0.0%) | 0.0 |
| Total | 0 (0.0%) | 0.0 |
Fertility by Age by Marriage Status in Turnerville
| Age Bracket | Married | Unmarried |
| 15 to 19 years | 0 (0.0%) | 0 (0.0%) |
| 20 to 34 years | 0 (0.0%) | 0 (0.0%) |
| 35 to 50 years | 0 (0.0%) | 0 (0.0%) |
| Total | 0 (0.0%) | 0 (0.0%) |
Fertility by Education in Turnerville
| Educational Attainment | Women with Births | Births / 1,000 Women |
| Less than High School | 0 (0.0%) | 0.0 |
| High School Diploma | 0 (0.0%) | 0.0 |
| College or Associate's Degree | 0 (0.0%) | 0.0 |
| Bachelor's Degree | 0 (0.0%) | 0.0 |
| Graduate Degree | 0 (0.0%) | 0.0 |
| Total | 0 (0.0%) | 0.0 |
Fertility by Education by Marriage Status in Turnerville
| Educational Attainment | Married | Unmarried |
| Less than High School | 0 (0.0%) | 0 (0.0%) |
| High School Diploma | 0 (0.0%) | 0 (0.0%) |
| College or Associate's Degree | 0 (0.0%) | 0 (0.0%) |
| Bachelor's Degree | 0 (0.0%) | 0 (0.0%) |
| Graduate Degree | 0 (0.0%) | 0 (0.0%) |
| Total | 0 (0.0%) | 0 (0.0%) |
Employment Characteristics in Turnerville
Employment by Class of Employer in Turnerville
Among the 250 employed individuals in Turnerville, private company employees (111 | 44.4%), self-employed (not incorporated) (91 | 36.4%), and not-for-profit organizations (26 | 10.4%) make up the most common classes of employment.
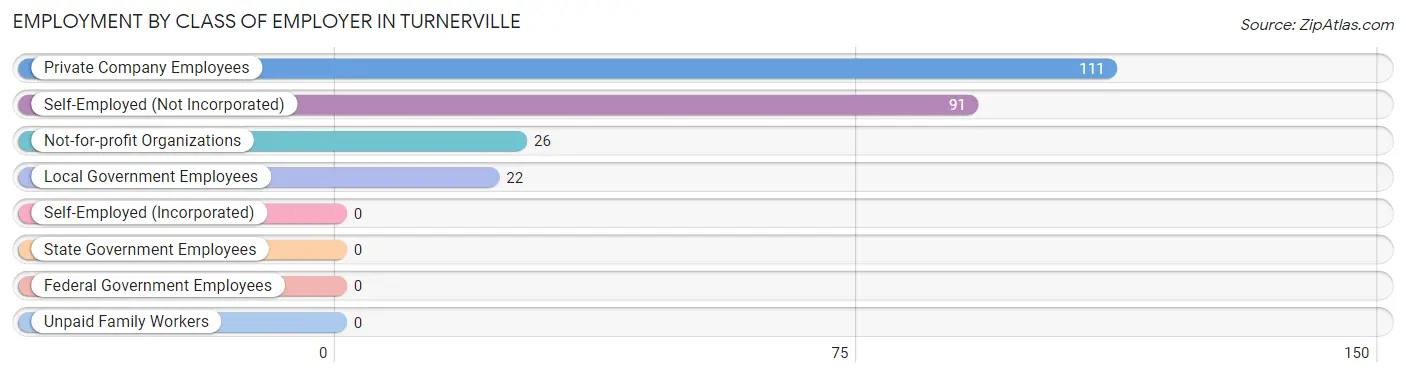
| Employer Class | # Employees | % Employees |
| Private Company Employees | 111 | 44.4% |
| Self-Employed (Incorporated) | 0 | 0.0% |
| Self-Employed (Not Incorporated) | 91 | 36.4% |
| Not-for-profit Organizations | 26 | 10.4% |
| Local Government Employees | 22 | 8.8% |
| State Government Employees | 0 | 0.0% |
| Federal Government Employees | 0 | 0.0% |
| Unpaid Family Workers | 0 | 0.0% |
| Total | 250 | 100.0% |
Employment Status by Age in Turnerville
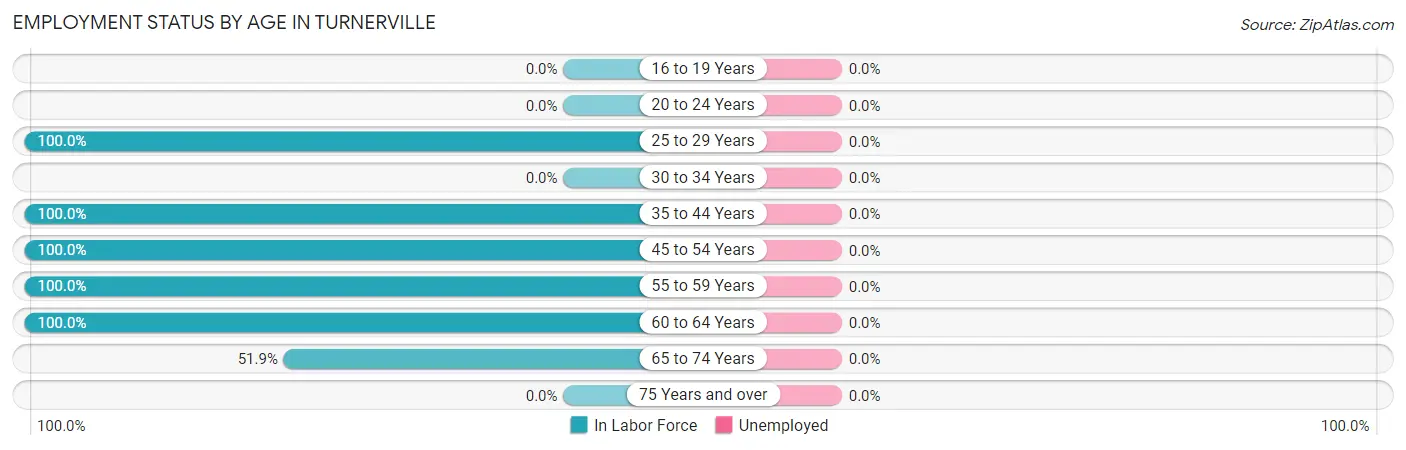
| Age Bracket | In Labor Force | Unemployed |
| 16 to 19 Years | 0 (0.0%) | 0 (0.0%) |
| 20 to 24 Years | 0 (0.0%) | 0 (0.0%) |
| 25 to 29 Years | 46 (100.0%) | 0 (0.0%) |
| 30 to 34 Years | 0 (0.0%) | 0 (0.0%) |
| 35 to 44 Years | 10 (100.0%) | 0 (0.0%) |
| 45 to 54 Years | 20 (100.0%) | 0 (0.0%) |
| 55 to 59 Years | 62 (100.0%) | 0 (0.0%) |
| 60 to 64 Years | 43 (100.0%) | 0 (0.0%) |
| 65 to 74 Years | 69 (51.9%) | 0 (0.0%) |
| 75 Years and over | 0 (0.0%) | 0 (0.0%) |
| Total | 250 (78.4%) | 0 (0.0%) |
Employment Status by Educational Attainment in Turnerville
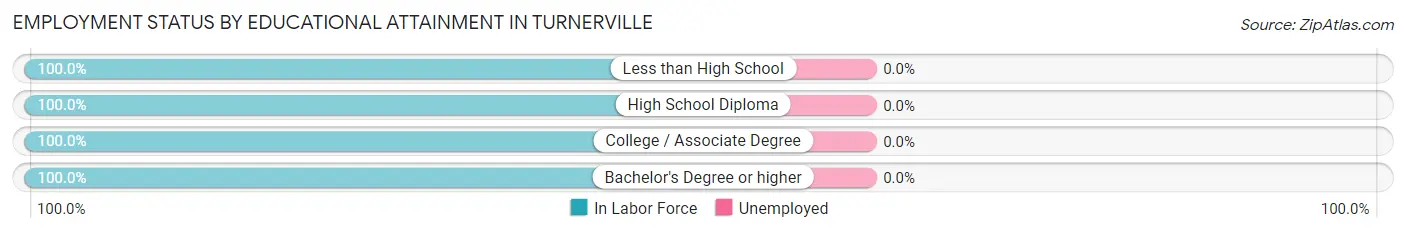
| Educational Attainment | In Labor Force | Unemployed |
| Less than High School | 20 (100.0%) | 0 (0.0%) |
| High School Diploma | 40 (100.0%) | 0 (0.0%) |
| College / Associate Degree | 111 (100.0%) | 0 (0.0%) |
| Bachelor's Degree or higher | 10 (100.0%) | 0 (0.0%) |
| Total | 181 (100.0%) | 0 (0.0%) |
Employment Occupations by Sex in Turnerville
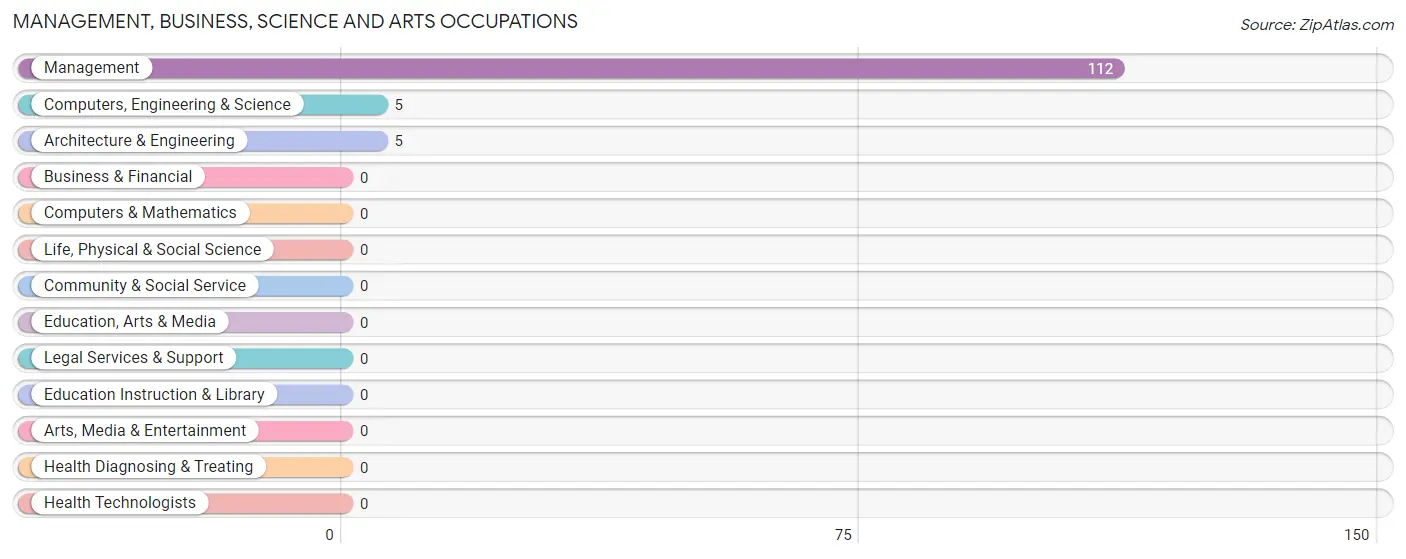
Management, Business, Science and Arts Occupations
The most common Management, Business, Science and Arts occupations in Turnerville are Management (112 | 44.8%), Computers, Engineering & Science (5 | 2.0%), and Architecture & Engineering (5 | 2.0%).
Management, Business, Science and Arts Occupations by Sex
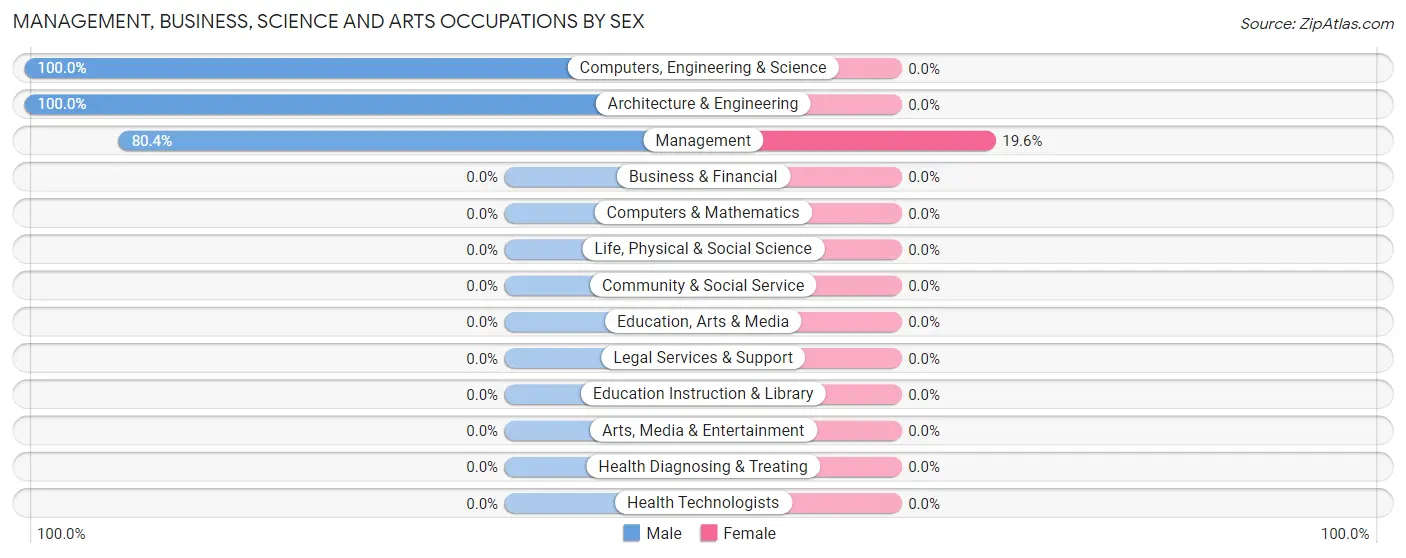
| Occupation | Male | Female |
| Management | 90 (80.4%) | 22 (19.6%) |
| Business & Financial | 0 (0.0%) | 0 (0.0%) |
| Computers, Engineering & Science | 5 (100.0%) | 0 (0.0%) |
| Computers & Mathematics | 0 (0.0%) | 0 (0.0%) |
| Architecture & Engineering | 5 (100.0%) | 0 (0.0%) |
| Life, Physical & Social Science | 0 (0.0%) | 0 (0.0%) |
| Community & Social Service | 0 (0.0%) | 0 (0.0%) |
| Education, Arts & Media | 0 (0.0%) | 0 (0.0%) |
| Legal Services & Support | 0 (0.0%) | 0 (0.0%) |
| Education Instruction & Library | 0 (0.0%) | 0 (0.0%) |
| Arts, Media & Entertainment | 0 (0.0%) | 0 (0.0%) |
| Health Diagnosing & Treating | 0 (0.0%) | 0 (0.0%) |
| Health Technologists | 0 (0.0%) | 0 (0.0%) |
| Total (Category) | 95 (81.2%) | 22 (18.8%) |
| Total (Overall) | 181 (72.4%) | 69 (27.6%) |
Services Occupations
Services Occupations by Sex
| Occupation | Male | Female |
| Healthcare Support | 0 (0.0%) | 0 (0.0%) |
| Security & Protection | 0 (0.0%) | 0 (0.0%) |
| Firefighting & Prevention | 0 (0.0%) | 0 (0.0%) |
| Law Enforcement | 0 (0.0%) | 0 (0.0%) |
| Food Preparation & Serving | 0 (0.0%) | 0 (0.0%) |
| Cleaning & Maintenance | 0 (0.0%) | 0 (0.0%) |
| Personal Care & Service | 0 (0.0%) | 0 (0.0%) |
| Total (Category) | 0 (0.0%) | 0 (0.0%) |
| Total (Overall) | 181 (72.4%) | 69 (27.6%) |
Sales and Office Occupations
The most common Sales and Office occupations in Turnerville are Office & Administration (25 | 10.0%), and Sales & Related (19 | 7.6%).
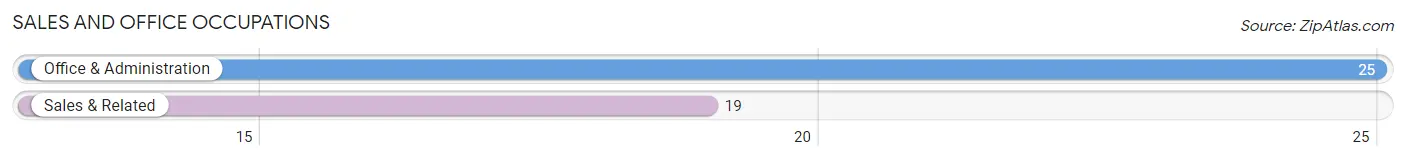
Sales and Office Occupations by Sex

| Occupation | Male | Female |
| Sales & Related | 19 (100.0%) | 0 (0.0%) |
| Office & Administration | 0 (0.0%) | 25 (100.0%) |
| Total (Category) | 19 (43.2%) | 25 (56.8%) |
| Total (Overall) | 181 (72.4%) | 69 (27.6%) |
Natural Resources, Construction and Maintenance Occupations
The most common Natural Resources, Construction and Maintenance occupations in Turnerville are Construction & Extraction (46 | 18.4%), and Installation, Maintenance & Repair (21 | 8.4%).
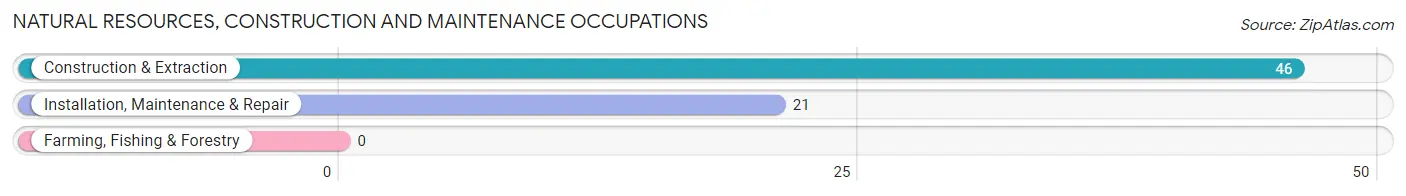
Natural Resources, Construction and Maintenance Occupations by Sex
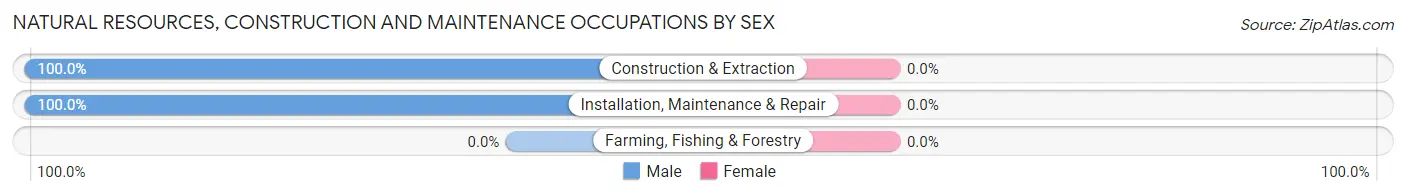
| Occupation | Male | Female |
| Farming, Fishing & Forestry | 0 (0.0%) | 0 (0.0%) |
| Construction & Extraction | 46 (100.0%) | 0 (0.0%) |
| Installation, Maintenance & Repair | 21 (100.0%) | 0 (0.0%) |
| Total (Category) | 67 (100.0%) | 0 (0.0%) |
| Total (Overall) | 181 (72.4%) | 69 (27.6%) |
Production, Transportation and Moving Occupations
The most common Production, Transportation and Moving occupations in Turnerville are , and Transportation (22 | 8.8%).
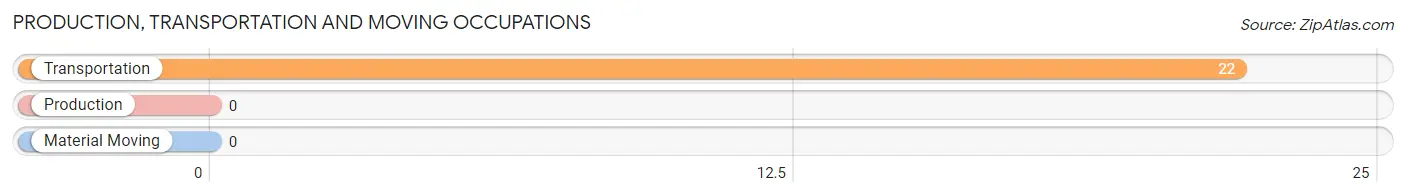
Production, Transportation and Moving Occupations by Sex
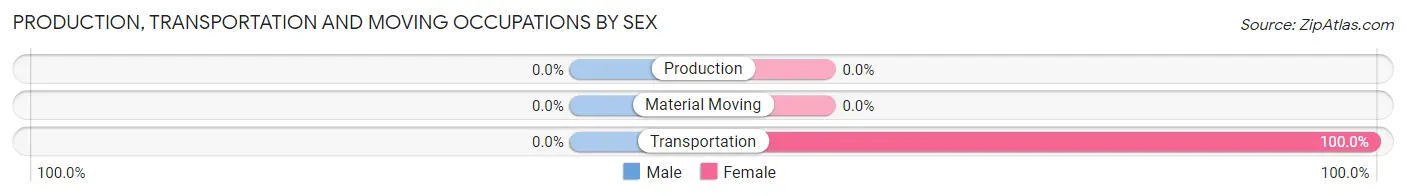
| Occupation | Male | Female |
| Production | 0 (0.0%) | 0 (0.0%) |
| Transportation | 0 (0.0%) | 22 (100.0%) |
| Material Moving | 0 (0.0%) | 0 (0.0%) |
| Total (Category) | 0 (0.0%) | 22 (100.0%) |
| Total (Overall) | 181 (72.4%) | 69 (27.6%) |
Employment Industries by Sex in Turnerville
Employment Industries in Turnerville
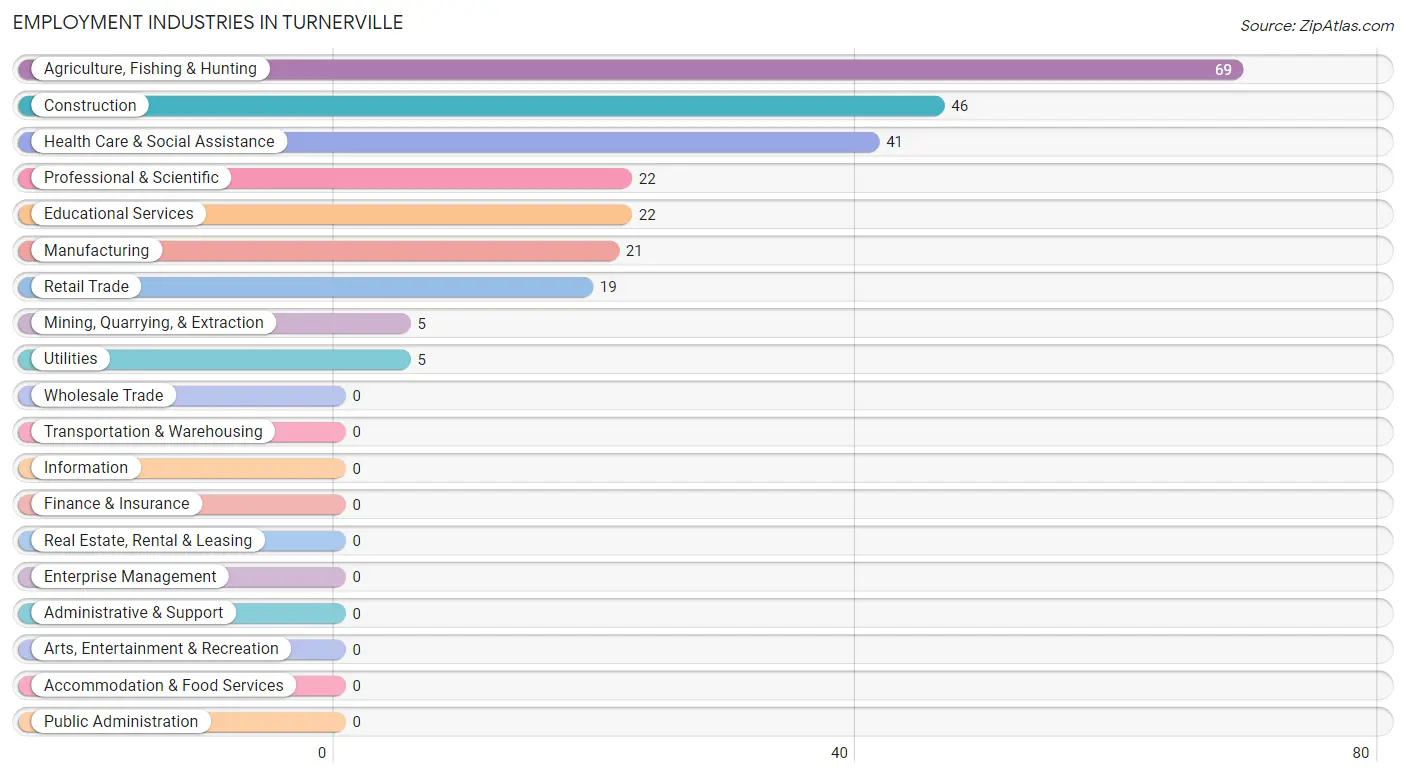
The major employment industries in Turnerville include Agriculture, Fishing & Hunting (69 | 27.6%), Construction (46 | 18.4%), Health Care & Social Assistance (41 | 16.4%), Professional & Scientific (22 | 8.8%), and Educational Services (22 | 8.8%).
Employment Industries by Sex in Turnerville
The Turnerville industries that see more men than women are Agriculture, Fishing & Hunting (100.0%), Mining, Quarrying, & Extraction (100.0%), and Construction (100.0%), whereas the industries that tend to have a higher number of women are Utilities (100.0%), Professional & Scientific (100.0%), and Educational Services (100.0%).
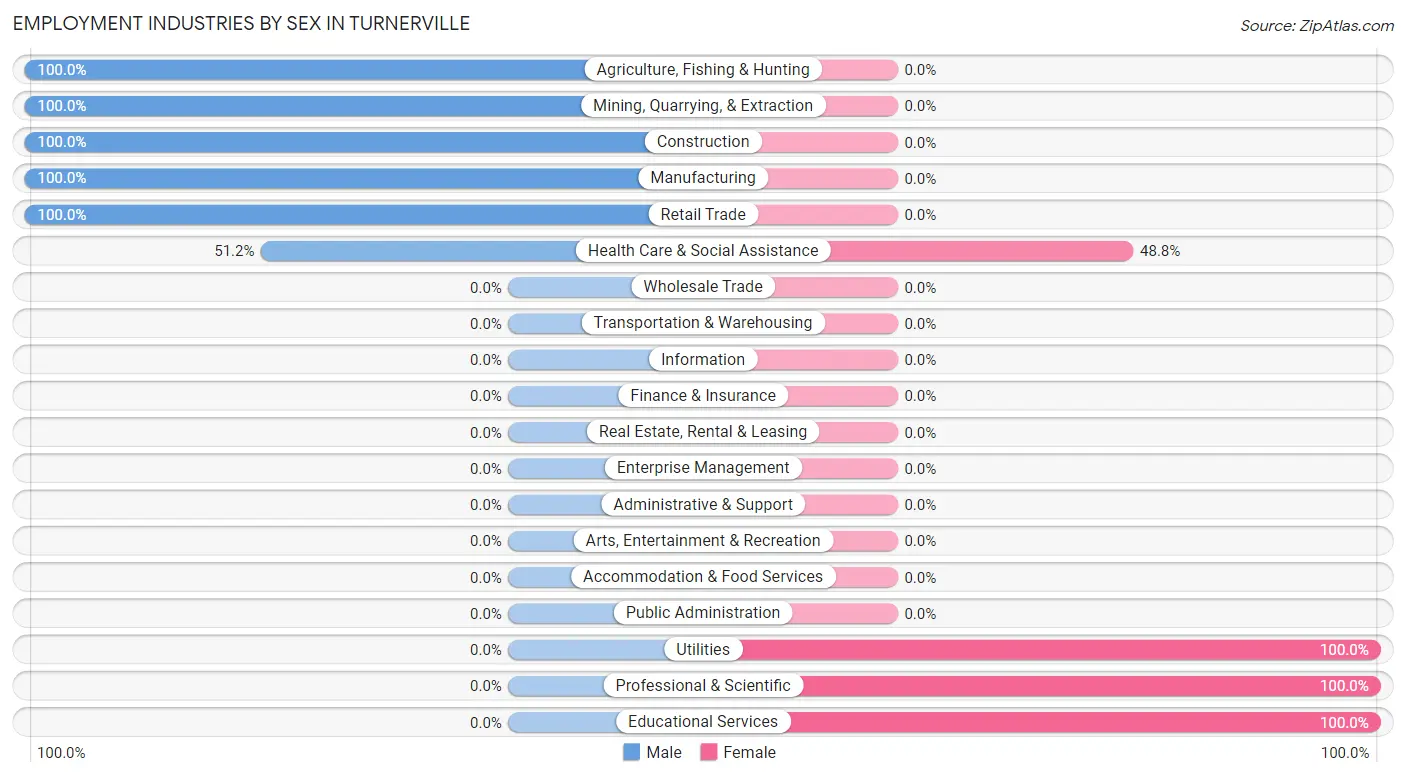
| Industry | Male | Female |
| Agriculture, Fishing & Hunting | 69 (100.0%) | 0 (0.0%) |
| Mining, Quarrying, & Extraction | 5 (100.0%) | 0 (0.0%) |
| Construction | 46 (100.0%) | 0 (0.0%) |
| Manufacturing | 21 (100.0%) | 0 (0.0%) |
| Wholesale Trade | 0 (0.0%) | 0 (0.0%) |
| Retail Trade | 19 (100.0%) | 0 (0.0%) |
| Transportation & Warehousing | 0 (0.0%) | 0 (0.0%) |
| Utilities | 0 (0.0%) | 5 (100.0%) |
| Information | 0 (0.0%) | 0 (0.0%) |
| Finance & Insurance | 0 (0.0%) | 0 (0.0%) |
| Real Estate, Rental & Leasing | 0 (0.0%) | 0 (0.0%) |
| Professional & Scientific | 0 (0.0%) | 22 (100.0%) |
| Enterprise Management | 0 (0.0%) | 0 (0.0%) |
| Administrative & Support | 0 (0.0%) | 0 (0.0%) |
| Educational Services | 0 (0.0%) | 22 (100.0%) |
| Health Care & Social Assistance | 21 (51.2%) | 20 (48.8%) |
| Arts, Entertainment & Recreation | 0 (0.0%) | 0 (0.0%) |
| Accommodation & Food Services | 0 (0.0%) | 0 (0.0%) |
| Public Administration | 0 (0.0%) | 0 (0.0%) |
| Total | 181 (72.4%) | 69 (27.6%) |
Education in Turnerville
School Enrollment in Turnerville
The most common levels of schooling among the 19 students in Turnerville are high school (8 | 42.1%), middle school (6 | 31.6%), and college / undergraduate (5 | 26.3%).
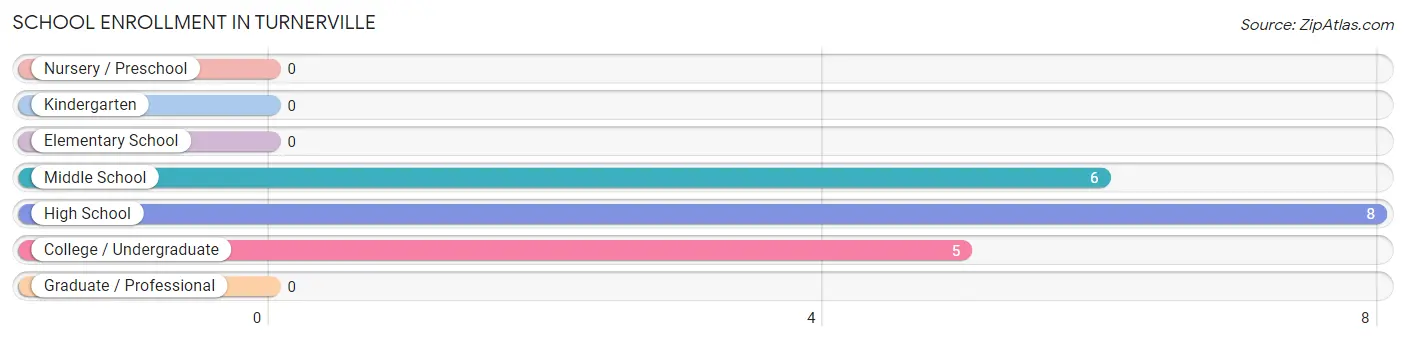
| School Level | # Students | % Students |
| Nursery / Preschool | 0 | 0.0% |
| Kindergarten | 0 | 0.0% |
| Elementary School | 0 | 0.0% |
| Middle School | 6 | 31.6% |
| High School | 8 | 42.1% |
| College / Undergraduate | 5 | 26.3% |
| Graduate / Professional | 0 | 0.0% |
| Total | 19 | 100.0% |
School Enrollment by Age by Funding Source in Turnerville
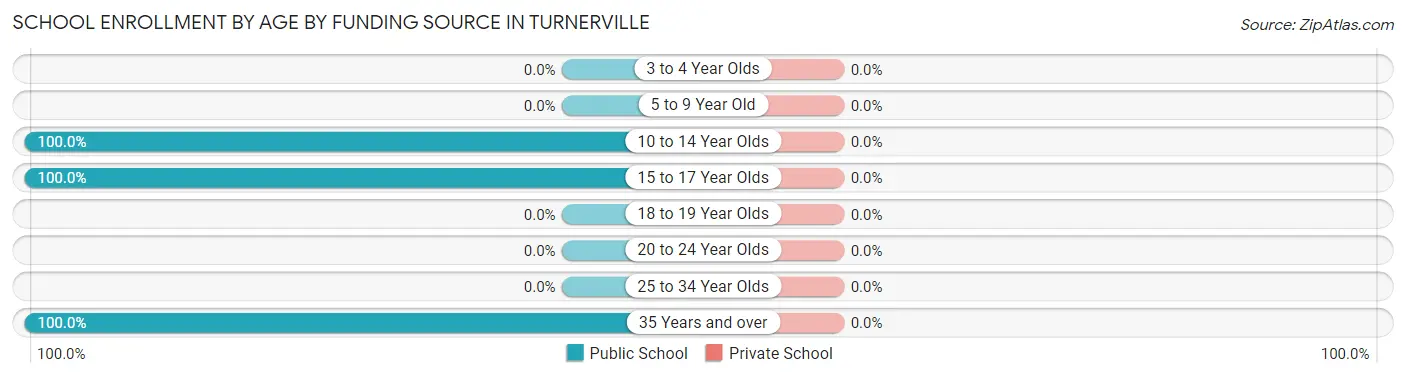
| Age Bracket | Public School | Private School |
| 3 to 4 Year Olds | 0 (0.0%) | 0 (0.0%) |
| 5 to 9 Year Old | 0 (0.0%) | 0 (0.0%) |
| 10 to 14 Year Olds | 6 (100.0%) | 0 (0.0%) |
| 15 to 17 Year Olds | 8 (100.0%) | 0 (0.0%) |
| 18 to 19 Year Olds | 0 (0.0%) | 0 (0.0%) |
| 20 to 24 Year Olds | 0 (0.0%) | 0 (0.0%) |
| 25 to 34 Year Olds | 0 (0.0%) | 0 (0.0%) |
| 35 Years and over | 5 (100.0%) | 0 (0.0%) |
| Total | 19 (100.0%) | 0 (0.0%) |
Educational Attainment by Field of Study in Turnerville
Education (64 | 81.0%), business (10 | 12.7%), and engineering (5 | 6.3%) are the most common fields of study among 79 individuals in Turnerville who have obtained a bachelor's degree or higher.
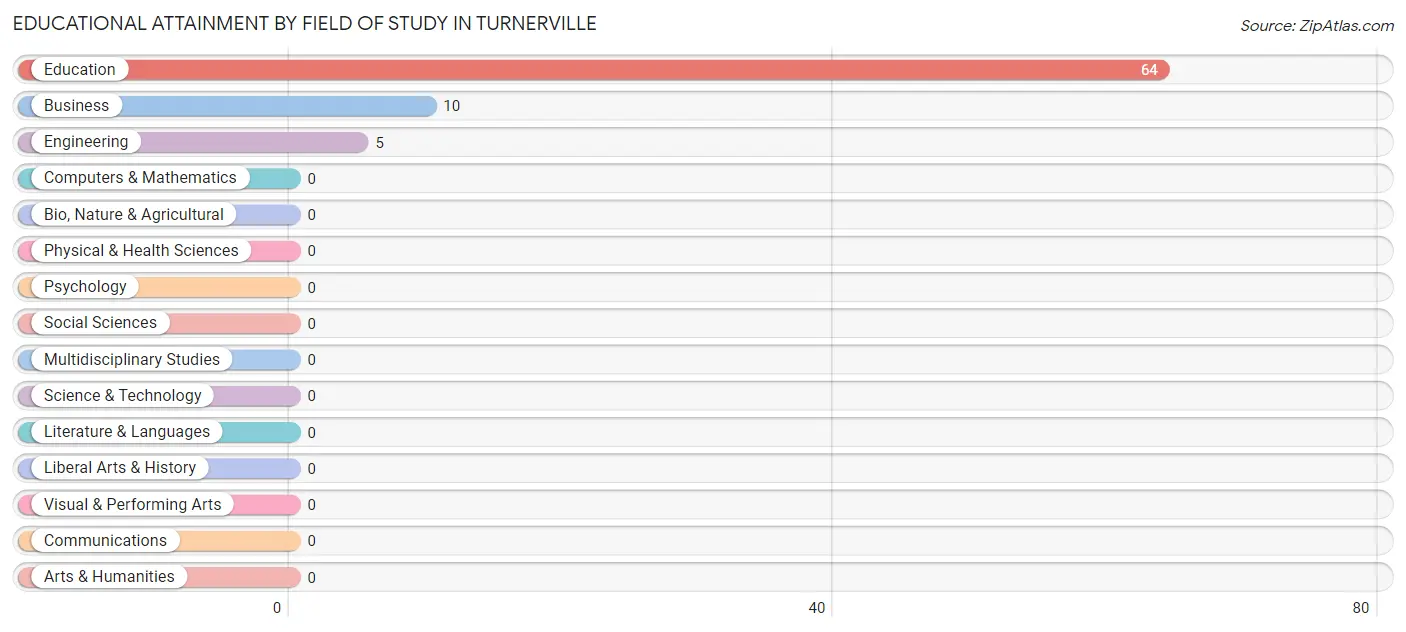
| Field of Study | # Graduates | % Graduates |
| Computers & Mathematics | 0 | 0.0% |
| Bio, Nature & Agricultural | 0 | 0.0% |
| Physical & Health Sciences | 0 | 0.0% |
| Psychology | 0 | 0.0% |
| Social Sciences | 0 | 0.0% |
| Engineering | 5 | 6.3% |
| Multidisciplinary Studies | 0 | 0.0% |
| Science & Technology | 0 | 0.0% |
| Business | 10 | 12.7% |
| Education | 64 | 81.0% |
| Literature & Languages | 0 | 0.0% |
| Liberal Arts & History | 0 | 0.0% |
| Visual & Performing Arts | 0 | 0.0% |
| Communications | 0 | 0.0% |
| Arts & Humanities | 0 | 0.0% |
| Total | 79 | 100.0% |
Transportation & Commute in Turnerville
Vehicle Availability by Sex in Turnerville
The most prevalent vehicle ownership categories in Turnerville are males with 3 vehicles (90, accounting for 49.7%) and females with 3 vehicles (22, making up 130.4%).
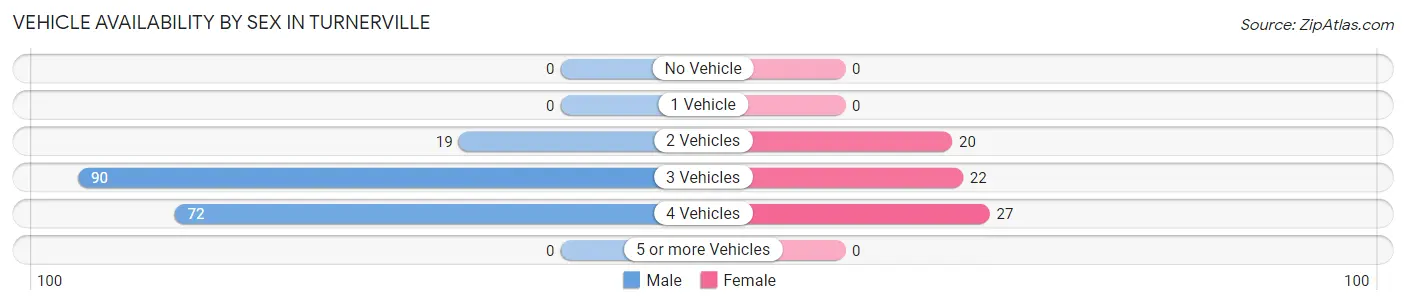
| Vehicles Available | Male | Female |
| No Vehicle | 0 (0.0%) | 0 (0.0%) |
| 1 Vehicle | 0 (0.0%) | 0 (0.0%) |
| 2 Vehicles | 19 (10.5%) | 20 (29.0%) |
| 3 Vehicles | 90 (49.7%) | 22 (31.9%) |
| 4 Vehicles | 72 (39.8%) | 27 (39.1%) |
| 5 or more Vehicles | 0 (0.0%) | 0 (0.0%) |
| Total | 181 (100.0%) | 69 (100.0%) |
Commute Time in Turnerville
The most frequently occuring commute durations in Turnerville are 20 to 24 minutes (86 commuters, 47.5%), less than 5 minutes (22 commuters, 12.1%), and 15 to 19 minutes (22 commuters, 12.1%).
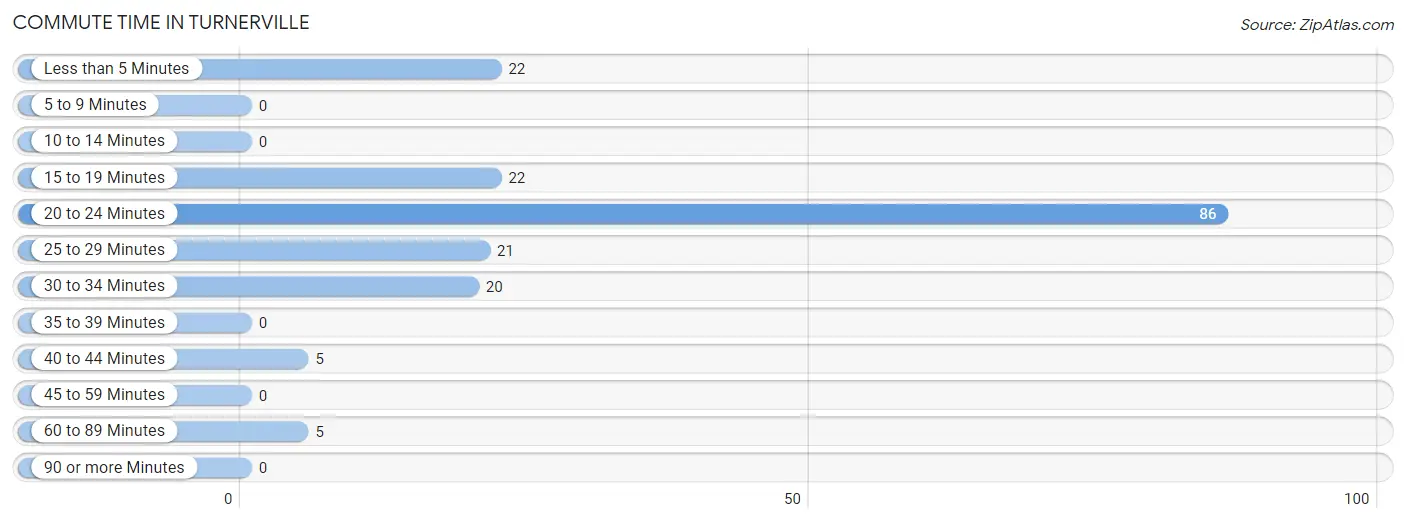
| Commute Time | # Commuters | % Commuters |
| Less than 5 Minutes | 22 | 12.1% |
| 5 to 9 Minutes | 0 | 0.0% |
| 10 to 14 Minutes | 0 | 0.0% |
| 15 to 19 Minutes | 22 | 12.1% |
| 20 to 24 Minutes | 86 | 47.5% |
| 25 to 29 Minutes | 21 | 11.6% |
| 30 to 34 Minutes | 20 | 11.1% |
| 35 to 39 Minutes | 0 | 0.0% |
| 40 to 44 Minutes | 5 | 2.8% |
| 45 to 59 Minutes | 0 | 0.0% |
| 60 to 89 Minutes | 5 | 2.8% |
| 90 or more Minutes | 0 | 0.0% |
Commute Time by Sex in Turnerville
The most common commute times in Turnerville are 20 to 24 minutes (86 commuters, 76.8%) for males and less than 5 minutes (22 commuters, 31.9%) for females.
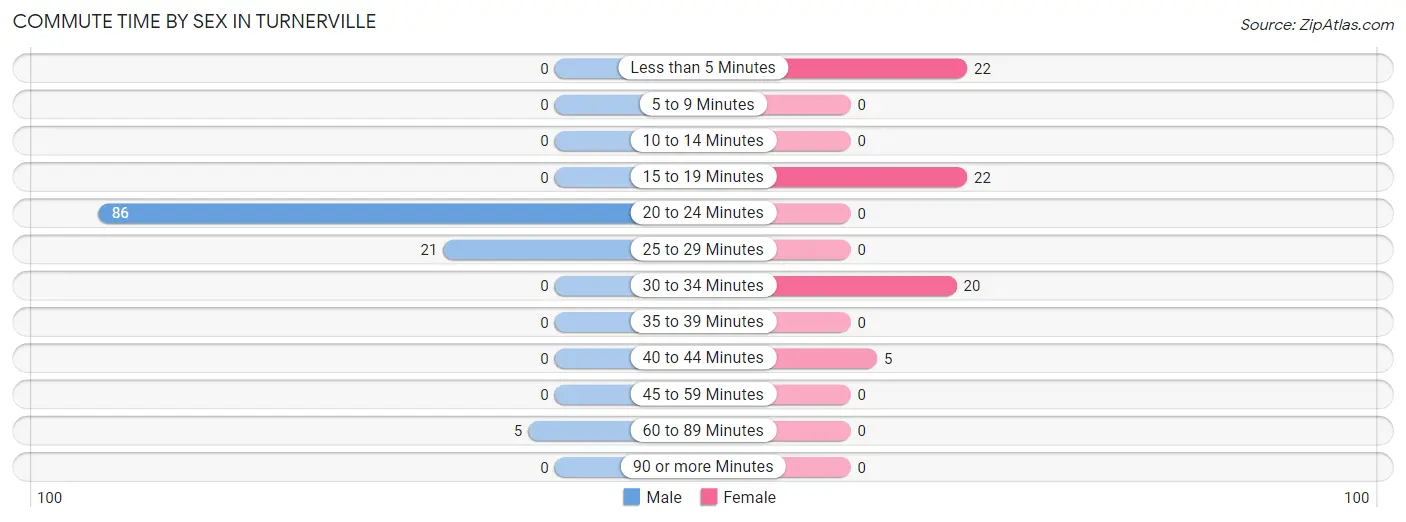
| Commute Time | Male | Female |
| Less than 5 Minutes | 0 (0.0%) | 22 (31.9%) |
| 5 to 9 Minutes | 0 (0.0%) | 0 (0.0%) |
| 10 to 14 Minutes | 0 (0.0%) | 0 (0.0%) |
| 15 to 19 Minutes | 0 (0.0%) | 22 (31.9%) |
| 20 to 24 Minutes | 86 (76.8%) | 0 (0.0%) |
| 25 to 29 Minutes | 21 (18.8%) | 0 (0.0%) |
| 30 to 34 Minutes | 0 (0.0%) | 20 (29.0%) |
| 35 to 39 Minutes | 0 (0.0%) | 0 (0.0%) |
| 40 to 44 Minutes | 0 (0.0%) | 5 (7.2%) |
| 45 to 59 Minutes | 0 (0.0%) | 0 (0.0%) |
| 60 to 89 Minutes | 5 (4.5%) | 0 (0.0%) |
| 90 or more Minutes | 0 (0.0%) | 0 (0.0%) |
Time of Departure to Work by Sex in Turnerville
The most frequent times of departure to work in Turnerville are 7:00 AM to 7:29 AM (86, 76.8%) for males and 7:00 AM to 7:29 AM (25, 36.2%) for females.
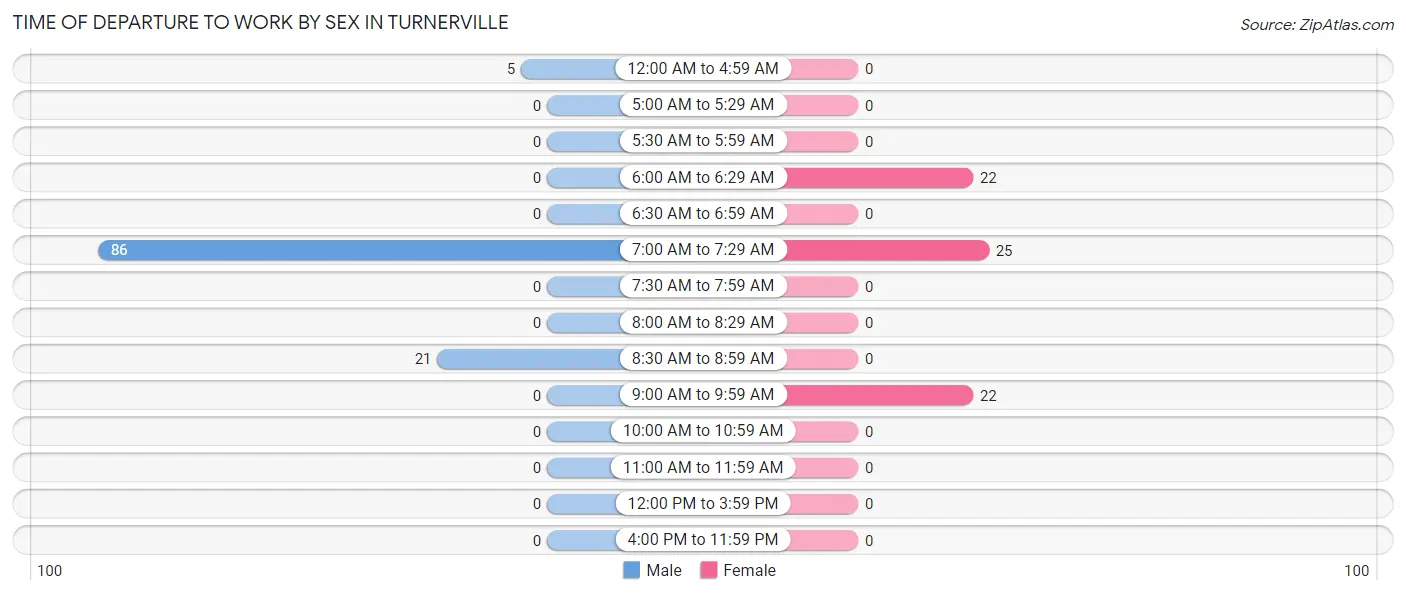
| Time of Departure | Male | Female |
| 12:00 AM to 4:59 AM | 5 (4.5%) | 0 (0.0%) |
| 5:00 AM to 5:29 AM | 0 (0.0%) | 0 (0.0%) |
| 5:30 AM to 5:59 AM | 0 (0.0%) | 0 (0.0%) |
| 6:00 AM to 6:29 AM | 0 (0.0%) | 22 (31.9%) |
| 6:30 AM to 6:59 AM | 0 (0.0%) | 0 (0.0%) |
| 7:00 AM to 7:29 AM | 86 (76.8%) | 25 (36.2%) |
| 7:30 AM to 7:59 AM | 0 (0.0%) | 0 (0.0%) |
| 8:00 AM to 8:29 AM | 0 (0.0%) | 0 (0.0%) |
| 8:30 AM to 8:59 AM | 21 (18.8%) | 0 (0.0%) |
| 9:00 AM to 9:59 AM | 0 (0.0%) | 22 (31.9%) |
| 10:00 AM to 10:59 AM | 0 (0.0%) | 0 (0.0%) |
| 11:00 AM to 11:59 AM | 0 (0.0%) | 0 (0.0%) |
| 12:00 PM to 3:59 PM | 0 (0.0%) | 0 (0.0%) |
| 4:00 PM to 11:59 PM | 0 (0.0%) | 0 (0.0%) |
| Total | 112 (100.0%) | 69 (100.0%) |
Housing Occupancy in Turnerville
Occupancy by Ownership in Turnerville
Of the total 137 dwellings in Turnerville, owner-occupied units account for 137 (100.0%), while renter-occupied units make up 0 (0.0%).
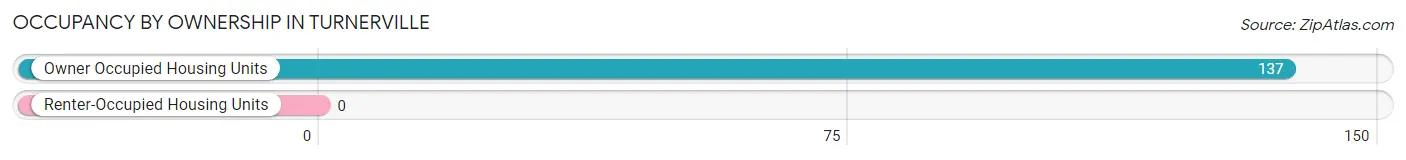
| Occupancy | # Housing Units | % Housing Units |
| Owner Occupied Housing Units | 137 | 100.0% |
| Renter-Occupied Housing Units | 0 | 0.0% |
| Total Occupied Housing Units | 137 | 100.0% |
Occupancy by Household Size in Turnerville
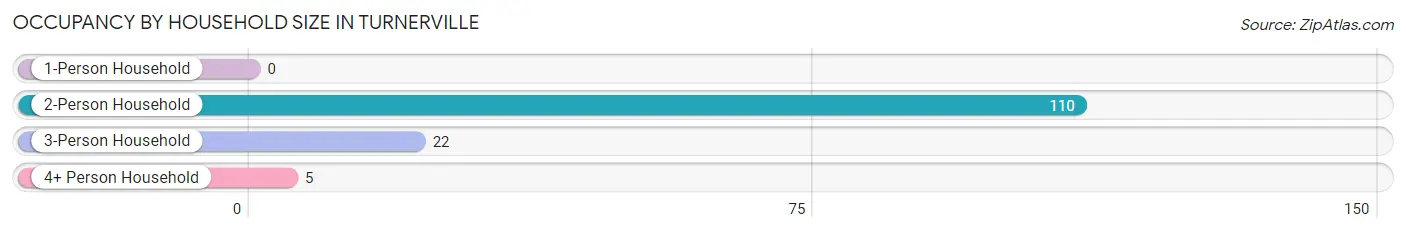
| Household Size | # Housing Units | % Housing Units |
| 1-Person Household | 0 | 0.0% |
| 2-Person Household | 110 | 80.3% |
| 3-Person Household | 22 | 16.1% |
| 4+ Person Household | 5 | 3.6% |
| Total Housing Units | 137 | 100.0% |
Occupancy by Ownership by Household Size in Turnerville
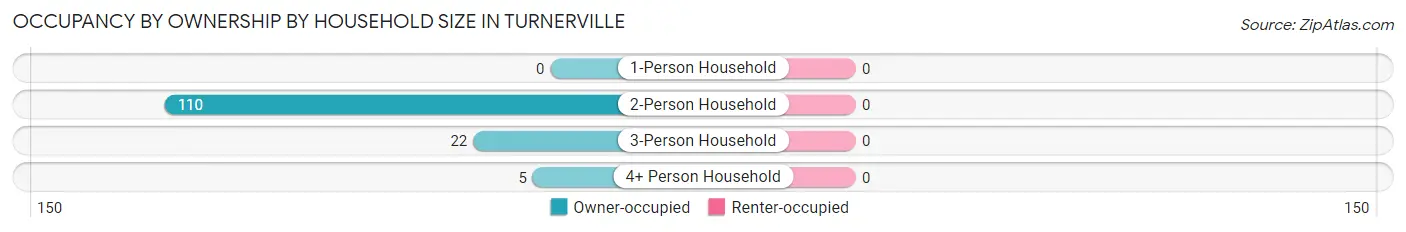
| Household Size | Owner-occupied | Renter-occupied |
| 1-Person Household | 0 (0.0%) | 0 (0.0%) |
| 2-Person Household | 110 (100.0%) | 0 (0.0%) |
| 3-Person Household | 22 (100.0%) | 0 (0.0%) |
| 4+ Person Household | 5 (100.0%) | 0 (0.0%) |
| Total Housing Units | 137 (100.0%) | 0 (0.0%) |
Occupancy by Educational Attainment in Turnerville
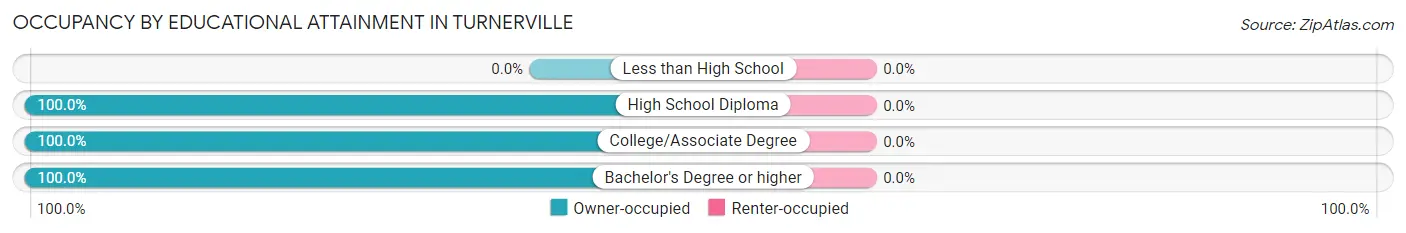
| Household Size | Owner-occupied | Renter-occupied |
| Less than High School | 0 (0.0%) | 0 (0.0%) |
| High School Diploma | 19 (100.0%) | 0 (0.0%) |
| College/Associate Degree | 113 (100.0%) | 0 (0.0%) |
| Bachelor's Degree or higher | 5 (100.0%) | 0 (0.0%) |
Occupancy by Age of Householder in Turnerville
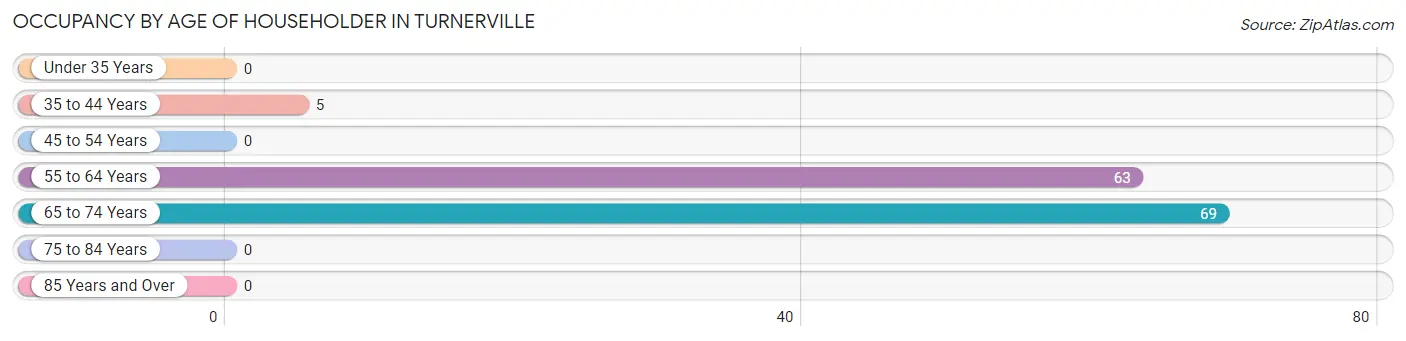
| Age Bracket | # Households | % Households |
| Under 35 Years | 0 | 0.0% |
| 35 to 44 Years | 5 | 3.6% |
| 45 to 54 Years | 0 | 0.0% |
| 55 to 64 Years | 63 | 46.0% |
| 65 to 74 Years | 69 | 50.4% |
| 75 to 84 Years | 0 | 0.0% |
| 85 Years and Over | 0 | 0.0% |
| Total | 137 | 100.0% |
Housing Finances in Turnerville
Median Income by Occupancy in Turnerville
| Occupancy Type | # Households | Median Income |
| Owner-Occupied | 137 (100.0%) | $0 |
| Renter-Occupied | 0 (0.0%) | $0 |
| Average | 137 (100.0%) | $0 |
Occupancy by Householder Income Bracket in Turnerville
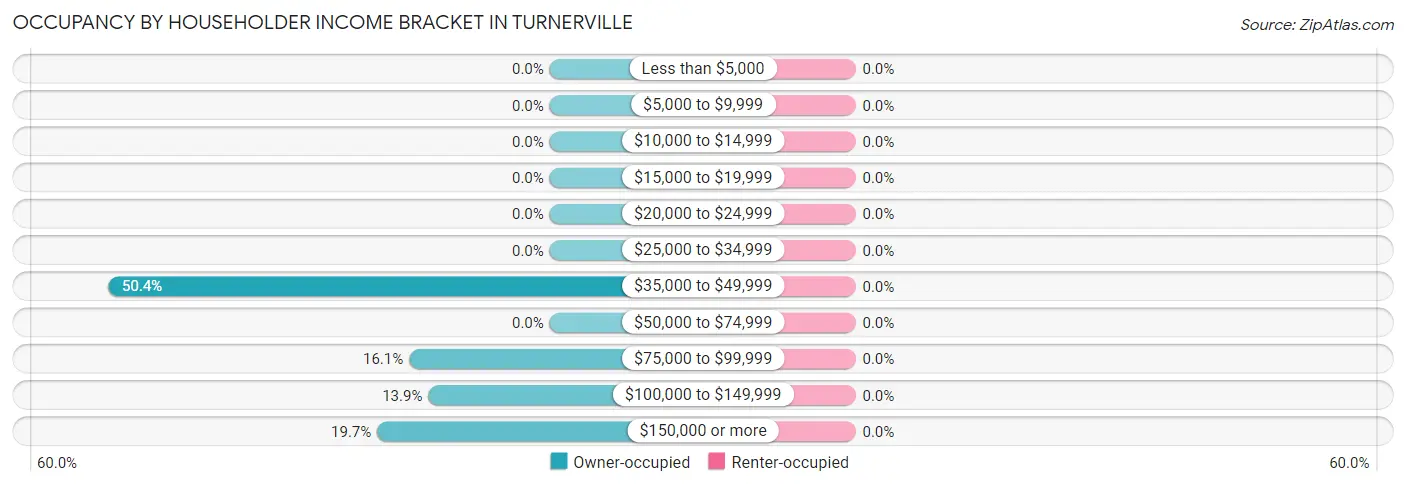
| Income Bracket | Owner-occupied | Renter-occupied |
| Less than $5,000 | 0 (0.0%) | 0 (0.0%) |
| $5,000 to $9,999 | 0 (0.0%) | 0 (0.0%) |
| $10,000 to $14,999 | 0 (0.0%) | 0 (0.0%) |
| $15,000 to $19,999 | 0 (0.0%) | 0 (0.0%) |
| $20,000 to $24,999 | 0 (0.0%) | 0 (0.0%) |
| $25,000 to $34,999 | 0 (0.0%) | 0 (0.0%) |
| $35,000 to $49,999 | 69 (50.4%) | 0 (0.0%) |
| $50,000 to $74,999 | 0 (0.0%) | 0 (0.0%) |
| $75,000 to $99,999 | 22 (16.1%) | 0 (0.0%) |
| $100,000 to $149,999 | 19 (13.9%) | 0 (0.0%) |
| $150,000 or more | 27 (19.7%) | 0 (0.0%) |
| Total | 137 (100.0%) | 0 (0.0%) |
Monthly Housing Cost Tiers in Turnerville
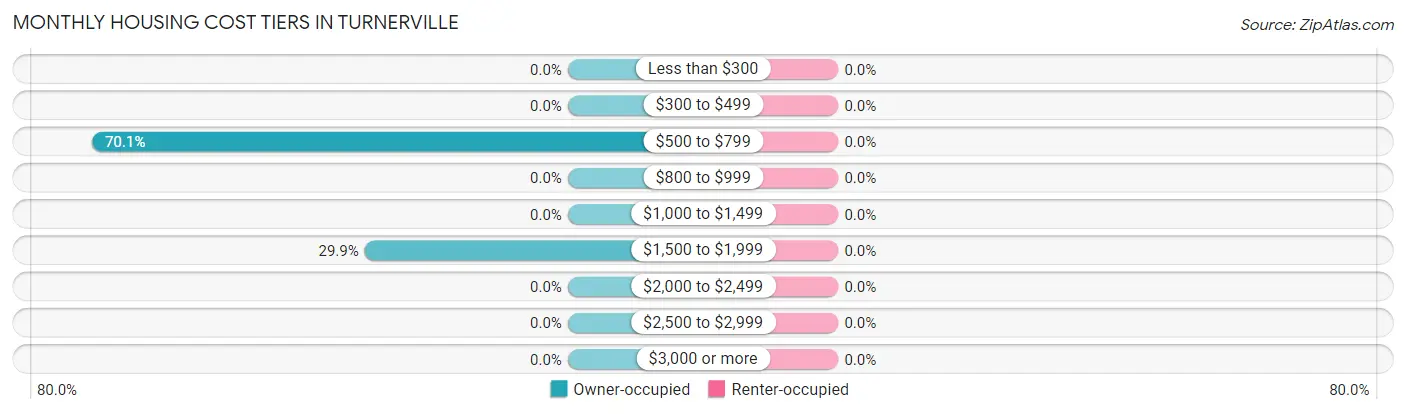
| Monthly Cost | Owner-occupied | Renter-occupied |
| Less than $300 | 0 (0.0%) | 0 (0.0%) |
| $300 to $499 | 0 (0.0%) | 0 (0.0%) |
| $500 to $799 | 96 (70.1%) | 0 (0.0%) |
| $800 to $999 | 0 (0.0%) | 0 (0.0%) |
| $1,000 to $1,499 | 0 (0.0%) | 0 (0.0%) |
| $1,500 to $1,999 | 41 (29.9%) | 0 (0.0%) |
| $2,000 to $2,499 | 0 (0.0%) | 0 (0.0%) |
| $2,500 to $2,999 | 0 (0.0%) | 0 (0.0%) |
| $3,000 or more | 0 (0.0%) | 0 (0.0%) |
| Total | 137 (100.0%) | 0 (0.0%) |
Physical Housing Characteristics in Turnerville
Housing Structures in Turnerville
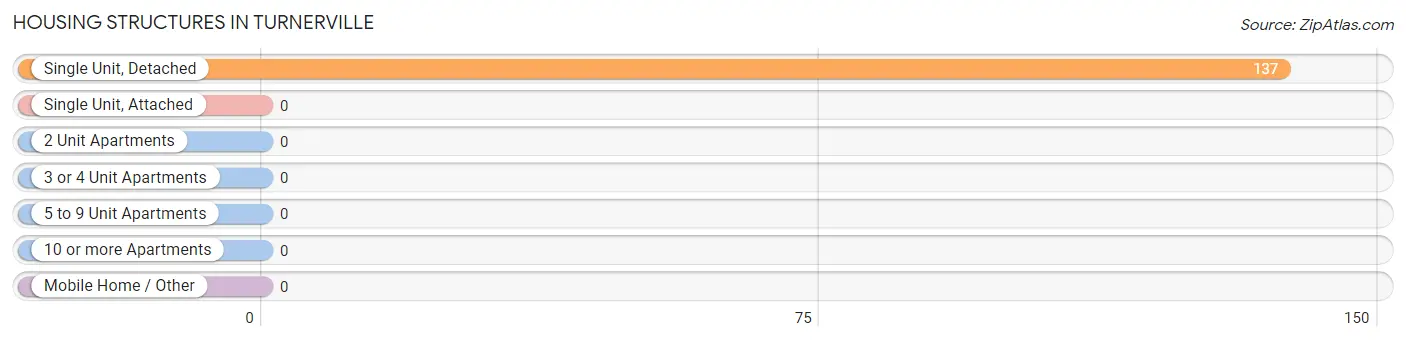
| Structure Type | # Housing Units | % Housing Units |
| Single Unit, Detached | 137 | 100.0% |
| Single Unit, Attached | 0 | 0.0% |
| 2 Unit Apartments | 0 | 0.0% |
| 3 or 4 Unit Apartments | 0 | 0.0% |
| 5 to 9 Unit Apartments | 0 | 0.0% |
| 10 or more Apartments | 0 | 0.0% |
| Mobile Home / Other | 0 | 0.0% |
| Total | 137 | 100.0% |
Housing Structures by Occupancy in Turnerville
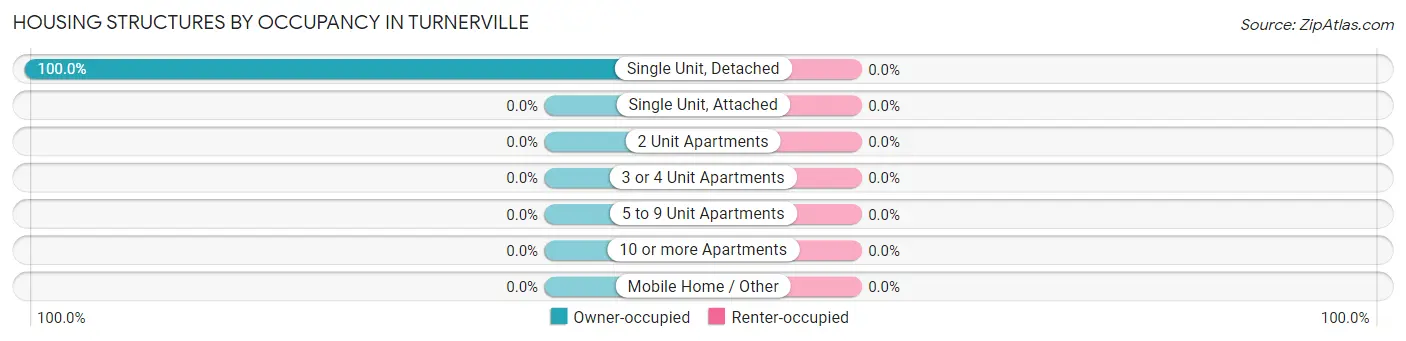
| Structure Type | Owner-occupied | Renter-occupied |
| Single Unit, Detached | 137 (100.0%) | 0 (0.0%) |
| Single Unit, Attached | 0 (0.0%) | 0 (0.0%) |
| 2 Unit Apartments | 0 (0.0%) | 0 (0.0%) |
| 3 or 4 Unit Apartments | 0 (0.0%) | 0 (0.0%) |
| 5 to 9 Unit Apartments | 0 (0.0%) | 0 (0.0%) |
| 10 or more Apartments | 0 (0.0%) | 0 (0.0%) |
| Mobile Home / Other | 0 (0.0%) | 0 (0.0%) |
| Total | 137 (100.0%) | 0 (0.0%) |
Housing Structures by Number of Rooms in Turnerville
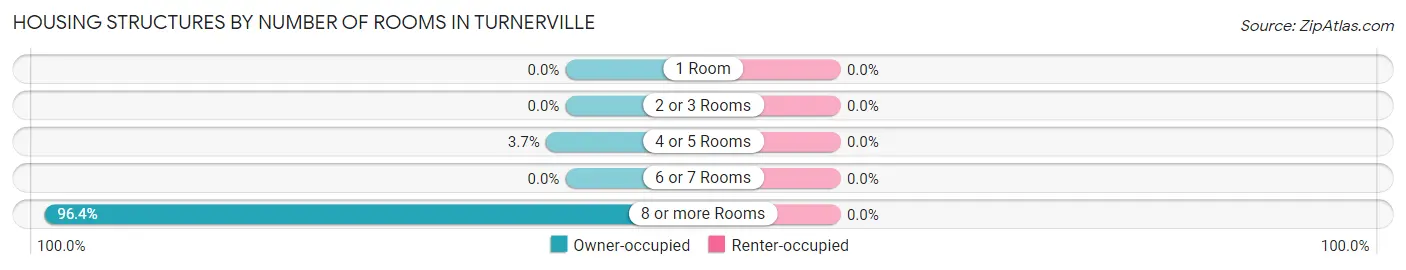
| Number of Rooms | Owner-occupied | Renter-occupied |
| 1 Room | 0 (0.0%) | 0 (0.0%) |
| 2 or 3 Rooms | 0 (0.0%) | 0 (0.0%) |
| 4 or 5 Rooms | 5 (3.6%) | 0 (0.0%) |
| 6 or 7 Rooms | 0 (0.0%) | 0 (0.0%) |
| 8 or more Rooms | 132 (96.4%) | 0 (0.0%) |
| Total | 137 (100.0%) | 0 (0.0%) |
Housing Structure by Heating Type in Turnerville
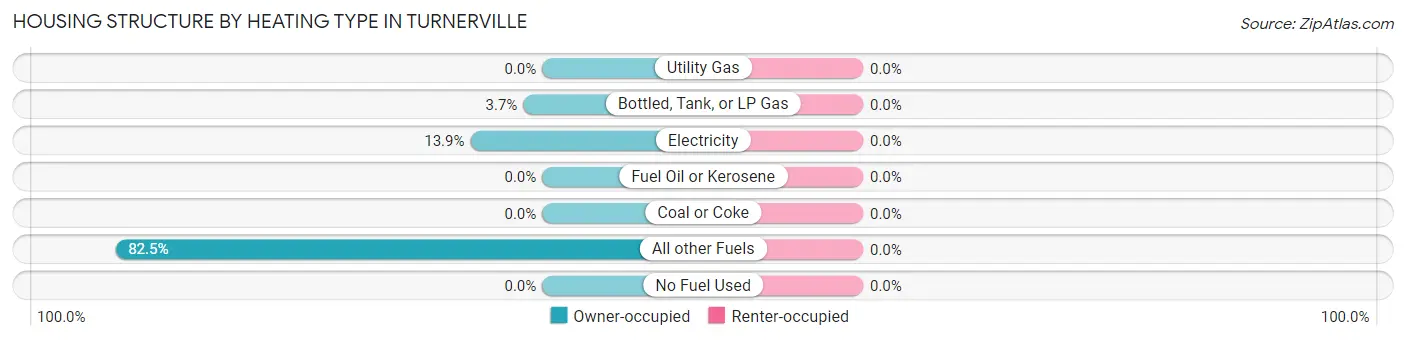
| Heating Type | Owner-occupied | Renter-occupied |
| Utility Gas | 0 (0.0%) | 0 (0.0%) |
| Bottled, Tank, or LP Gas | 5 (3.6%) | 0 (0.0%) |
| Electricity | 19 (13.9%) | 0 (0.0%) |
| Fuel Oil or Kerosene | 0 (0.0%) | 0 (0.0%) |
| Coal or Coke | 0 (0.0%) | 0 (0.0%) |
| All other Fuels | 113 (82.5%) | 0 (0.0%) |
| No Fuel Used | 0 (0.0%) | 0 (0.0%) |
| Total | 137 (100.0%) | 0 (0.0%) |
Household Vehicle Usage in Turnerville
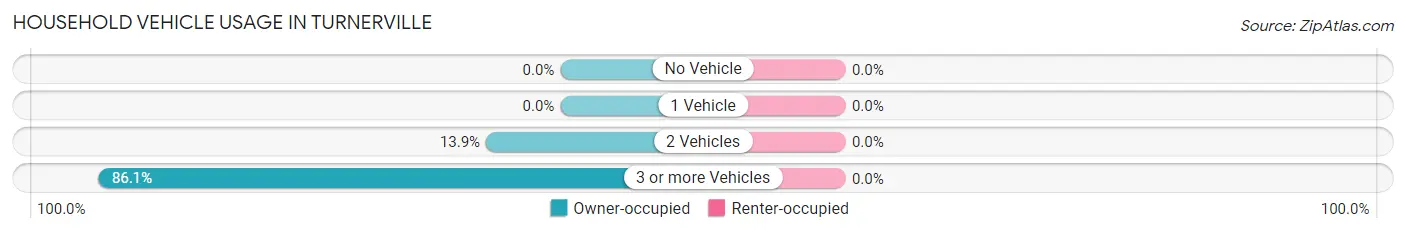
| Vehicles per Household | Owner-occupied | Renter-occupied |
| No Vehicle | 0 (0.0%) | 0 (0.0%) |
| 1 Vehicle | 0 (0.0%) | 0 (0.0%) |
| 2 Vehicles | 19 (13.9%) | 0 (0.0%) |
| 3 or more Vehicles | 118 (86.1%) | 0 (0.0%) |
| Total | 137 (100.0%) | 0 (0.0%) |
Real Estate & Mortgages in Turnerville
Real Estate and Mortgage Overview in Turnerville
| Characteristic | Without Mortgage | With Mortgage |
| Housing Units | 96 | 41 |
| Median Property Value | $1,326,100 | $0 |
| Median Household Income | - | - |
| Monthly Housing Costs | $735 | $0 |
| Real Estate Taxes | $4,304 | $0 |
Property Value by Mortgage Status in Turnerville
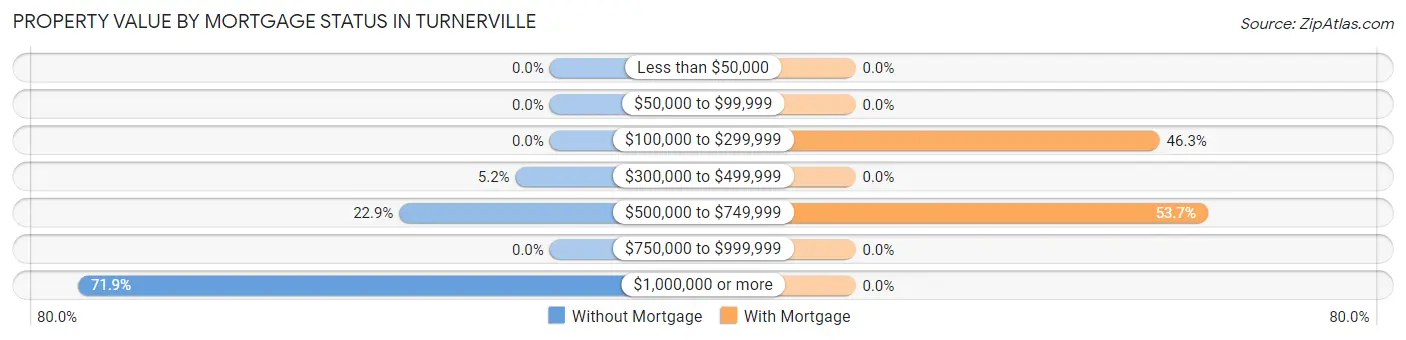
| Property Value | Without Mortgage | With Mortgage |
| Less than $50,000 | 0 (0.0%) | 0 (0.0%) |
| $50,000 to $99,999 | 0 (0.0%) | 0 (0.0%) |
| $100,000 to $299,999 | 0 (0.0%) | 19 (46.3%) |
| $300,000 to $499,999 | 5 (5.2%) | 0 (0.0%) |
| $500,000 to $749,999 | 22 (22.9%) | 22 (53.7%) |
| $750,000 to $999,999 | 0 (0.0%) | 0 (0.0%) |
| $1,000,000 or more | 69 (71.9%) | 0 (0.0%) |
| Total | 96 (100.0%) | 41 (100.0%) |
Household Income by Mortgage Status in Turnerville
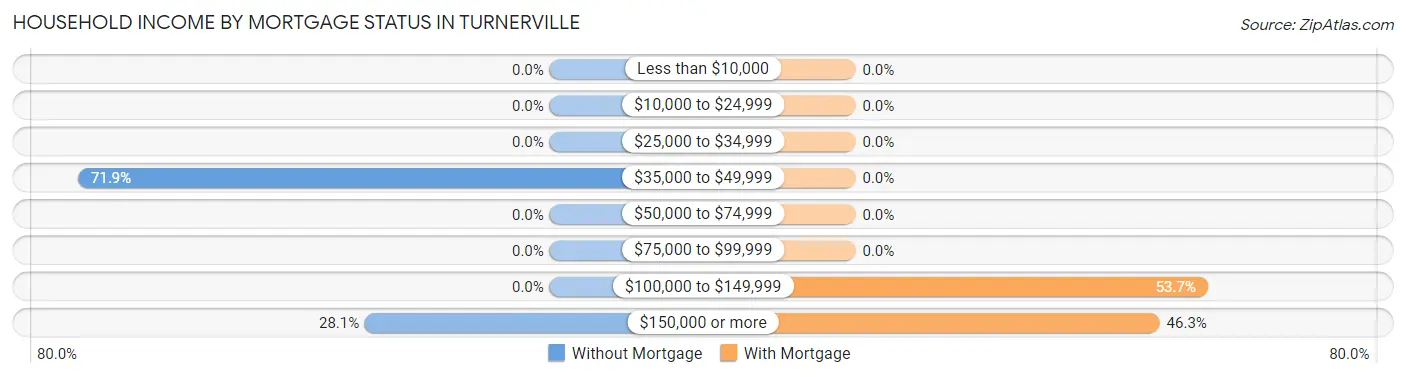
| Household Income | Without Mortgage | With Mortgage |
| Less than $10,000 | 0 (0.0%) | 0 (0.0%) |
| $10,000 to $24,999 | 0 (0.0%) | 0 (0.0%) |
| $25,000 to $34,999 | 0 (0.0%) | 0 (0.0%) |
| $35,000 to $49,999 | 69 (71.9%) | 0 (0.0%) |
| $50,000 to $74,999 | 0 (0.0%) | 0 (0.0%) |
| $75,000 to $99,999 | 0 (0.0%) | 0 (0.0%) |
| $100,000 to $149,999 | 0 (0.0%) | 22 (53.7%) |
| $150,000 or more | 27 (28.1%) | 19 (46.3%) |
| Total | 96 (100.0%) | 41 (100.0%) |
Property Value to Household Income Ratio in Turnerville
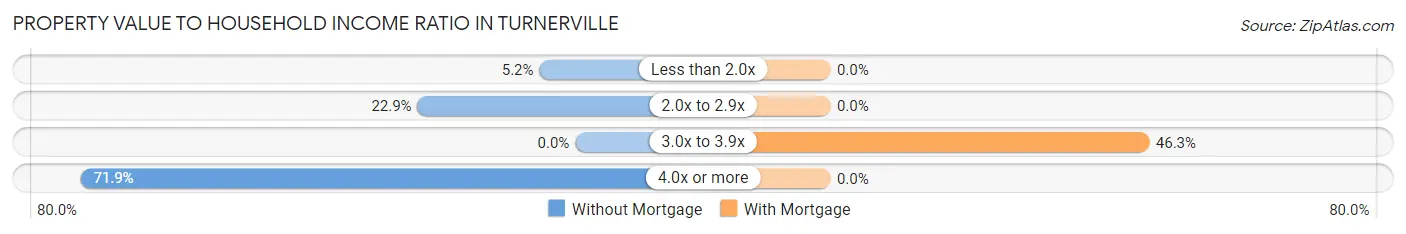
| Value-to-Income Ratio | Without Mortgage | With Mortgage |
| Less than 2.0x | 5 (5.2%) | 0 (0.0%) |
| 2.0x to 2.9x | 22 (22.9%) | 0 (0.0%) |
| 3.0x to 3.9x | 0 (0.0%) | 19 (46.3%) |
| 4.0x or more | 69 (71.9%) | 0 (0.0%) |
| Total | 96 (100.0%) | 41 (100.0%) |
Real Estate Taxes by Mortgage Status in Turnerville
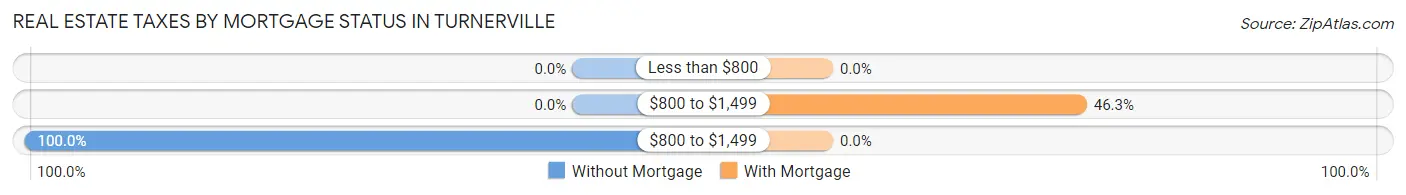
| Property Taxes | Without Mortgage | With Mortgage |
| Less than $800 | 0 (0.0%) | 0 (0.0%) |
| $800 to $1,499 | 0 (0.0%) | 19 (46.3%) |
| $800 to $1,499 | 96 (100.0%) | 0 (0.0%) |
| Total | 96 (100.0%) | 41 (100.0%) |
Health & Disability in Turnerville
Health Insurance Coverage by Age in Turnerville
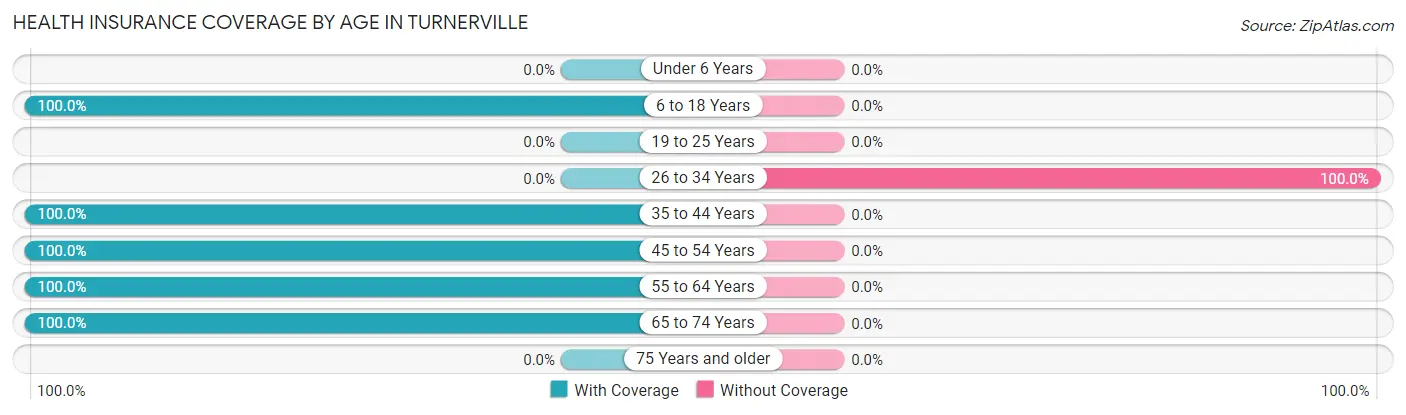
| Age Bracket | With Coverage | Without Coverage |
| Under 6 Years | 0 (0.0%) | 0 (0.0%) |
| 6 to 18 Years | 14 (100.0%) | 0 (0.0%) |
| 19 to 25 Years | 0 (0.0%) | 0 (0.0%) |
| 26 to 34 Years | 0 (0.0%) | 46 (100.0%) |
| 35 to 44 Years | 10 (100.0%) | 0 (0.0%) |
| 45 to 54 Years | 20 (100.0%) | 0 (0.0%) |
| 55 to 64 Years | 105 (100.0%) | 0 (0.0%) |
| 65 to 74 Years | 133 (100.0%) | 0 (0.0%) |
| 75 Years and older | 0 (0.0%) | 0 (0.0%) |
| Total | 282 (86.0%) | 46 (14.0%) |
Health Insurance Coverage by Citizenship Status in Turnerville
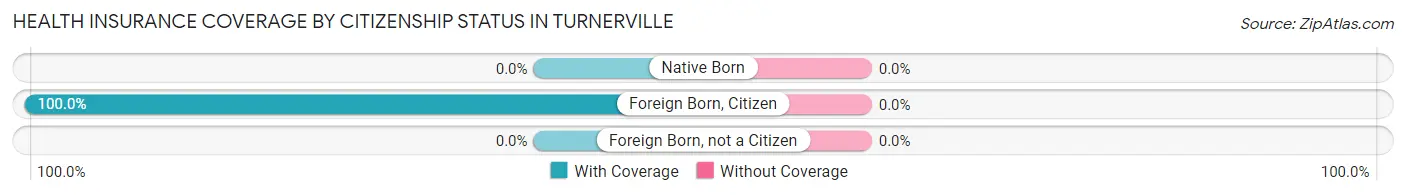
| Citizenship Status | With Coverage | Without Coverage |
| Native Born | 0 (0.0%) | 0 (0.0%) |
| Foreign Born, Citizen | 14 (100.0%) | 0 (0.0%) |
| Foreign Born, not a Citizen | 0 (0.0%) | 0 (0.0%) |
Health Insurance Coverage by Household Income in Turnerville
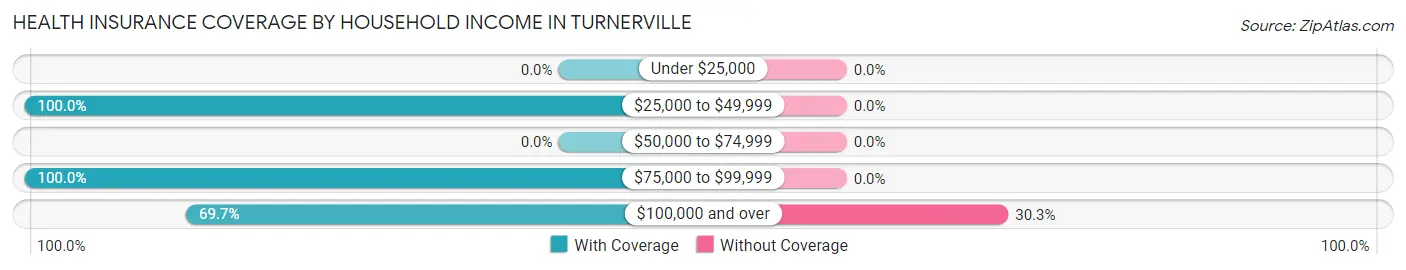
| Household Income | With Coverage | Without Coverage |
| Under $25,000 | 0 (0.0%) | 0 (0.0%) |
| $25,000 to $49,999 | 133 (100.0%) | 0 (0.0%) |
| $50,000 to $74,999 | 0 (0.0%) | 0 (0.0%) |
| $75,000 to $99,999 | 43 (100.0%) | 0 (0.0%) |
| $100,000 and over | 106 (69.7%) | 46 (30.3%) |
Public vs Private Health Insurance Coverage by Age in Turnerville
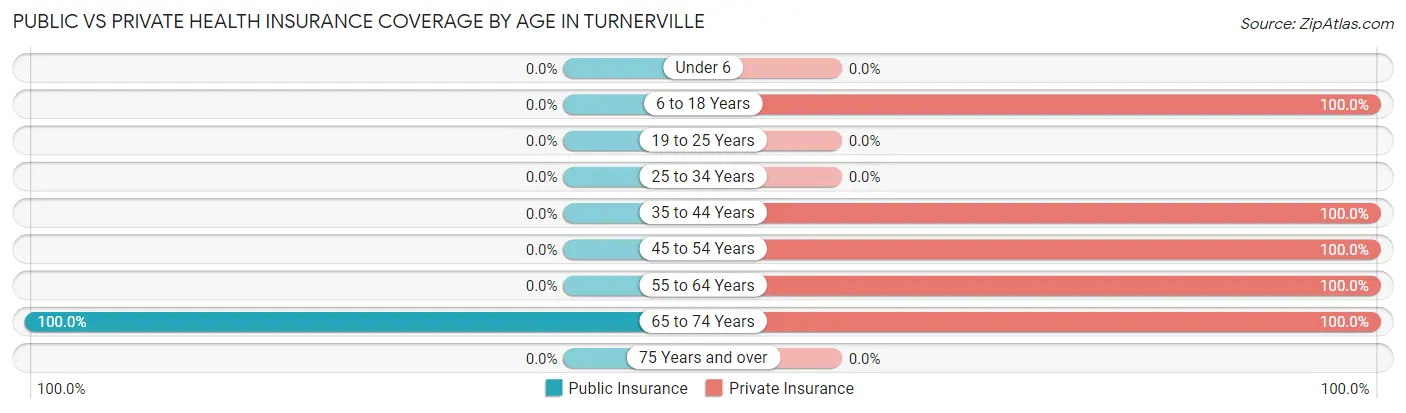
| Age Bracket | Public Insurance | Private Insurance |
| Under 6 | 0 (0.0%) | 0 (0.0%) |
| 6 to 18 Years | 0 (0.0%) | 14 (100.0%) |
| 19 to 25 Years | 0 (0.0%) | 0 (0.0%) |
| 25 to 34 Years | 0 (0.0%) | 0 (0.0%) |
| 35 to 44 Years | 0 (0.0%) | 10 (100.0%) |
| 45 to 54 Years | 0 (0.0%) | 20 (100.0%) |
| 55 to 64 Years | 0 (0.0%) | 105 (100.0%) |
| 65 to 74 Years | 133 (100.0%) | 133 (100.0%) |
| 75 Years and over | 0 (0.0%) | 0 (0.0%) |
| Total | 133 (40.6%) | 282 (86.0%) |
Disability Status by Sex by Age in Turnerville
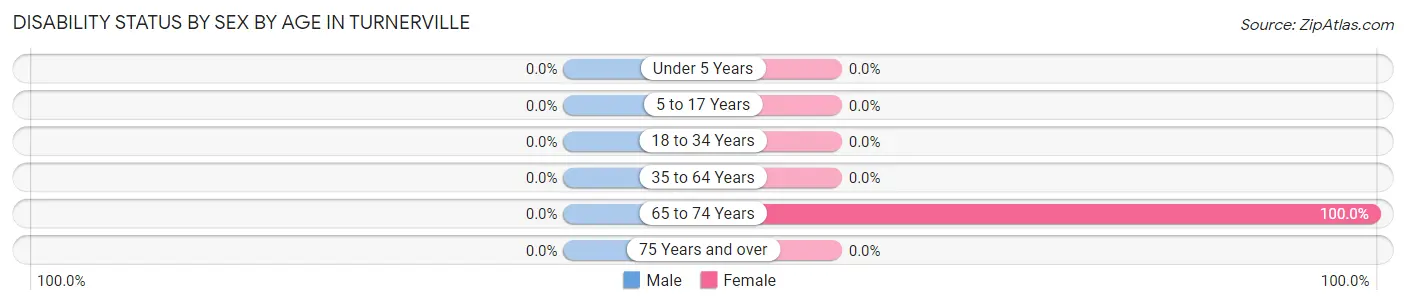
| Age Bracket | Male | Female |
| Under 5 Years | 0 (0.0%) | 0 (0.0%) |
| 5 to 17 Years | 0 (0.0%) | 0 (0.0%) |
| 18 to 34 Years | 0 (0.0%) | 0 (0.0%) |
| 35 to 64 Years | 0 (0.0%) | 0 (0.0%) |
| 65 to 74 Years | 0 (0.0%) | 64 (100.0%) |
| 75 Years and over | 0 (0.0%) | 0 (0.0%) |
Disability Class by Sex by Age in Turnerville
Disability Class: Hearing Difficulty
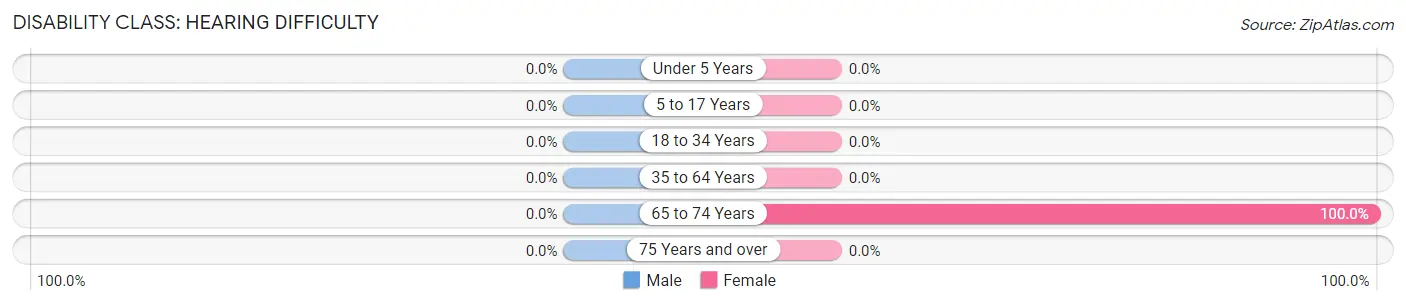
| Age Bracket | Male | Female |
| Under 5 Years | 0 (0.0%) | 0 (0.0%) |
| 5 to 17 Years | 0 (0.0%) | 0 (0.0%) |
| 18 to 34 Years | 0 (0.0%) | 0 (0.0%) |
| 35 to 64 Years | 0 (0.0%) | 0 (0.0%) |
| 65 to 74 Years | 0 (0.0%) | 64 (100.0%) |
| 75 Years and over | 0 (0.0%) | 0 (0.0%) |
Disability Class: Vision Difficulty
| Age Bracket | Male | Female |
| Under 5 Years | 0 (0.0%) | 0 (0.0%) |
| 5 to 17 Years | 0 (0.0%) | 0 (0.0%) |
| 18 to 34 Years | 0 (0.0%) | 0 (0.0%) |
| 35 to 64 Years | 0 (0.0%) | 0 (0.0%) |
| 65 to 74 Years | 0 (0.0%) | 0 (0.0%) |
| 75 Years and over | 0 (0.0%) | 0 (0.0%) |
Disability Class: Cognitive Difficulty
| Age Bracket | Male | Female |
| 5 to 17 Years | 0 (0.0%) | 0 (0.0%) |
| 18 to 34 Years | 0 (0.0%) | 0 (0.0%) |
| 35 to 64 Years | 0 (0.0%) | 0 (0.0%) |
| 65 to 74 Years | 0 (0.0%) | 0 (0.0%) |
| 75 Years and over | 0 (0.0%) | 0 (0.0%) |
Disability Class: Ambulatory Difficulty
| Age Bracket | Male | Female |
| 5 to 17 Years | 0 (0.0%) | 0 (0.0%) |
| 18 to 34 Years | 0 (0.0%) | 0 (0.0%) |
| 35 to 64 Years | 0 (0.0%) | 0 (0.0%) |
| 65 to 74 Years | 0 (0.0%) | 0 (0.0%) |
| 75 Years and over | 0 (0.0%) | 0 (0.0%) |
Disability Class: Self-Care Difficulty
| Age Bracket | Male | Female |
| 5 to 17 Years | 0 (0.0%) | 0 (0.0%) |
| 18 to 34 Years | 0 (0.0%) | 0 (0.0%) |
| 35 to 64 Years | 0 (0.0%) | 0 (0.0%) |
| 65 to 74 Years | 0 (0.0%) | 0 (0.0%) |
| 75 Years and over | 0 (0.0%) | 0 (0.0%) |
Technology Access in Turnerville
Computing Device Access in Turnerville
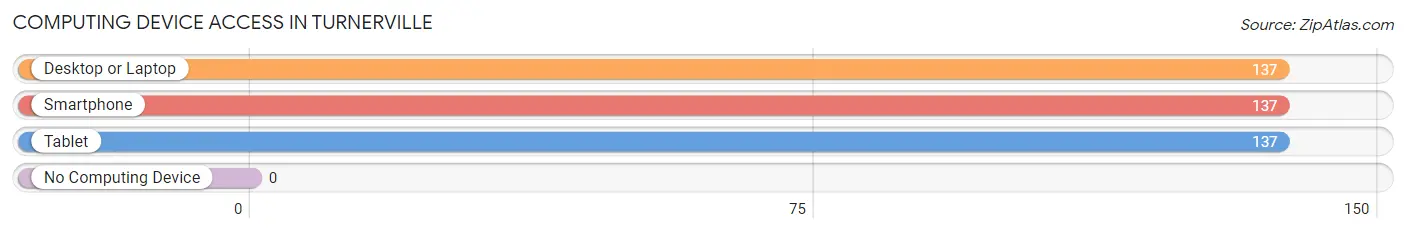
| Device Type | # Households | % Households |
| Desktop or Laptop | 137 | 100.0% |
| Smartphone | 137 | 100.0% |
| Tablet | 137 | 100.0% |
| No Computing Device | 0 | 0.0% |
| Total | 137 | 100.0% |
Internet Access in Turnerville
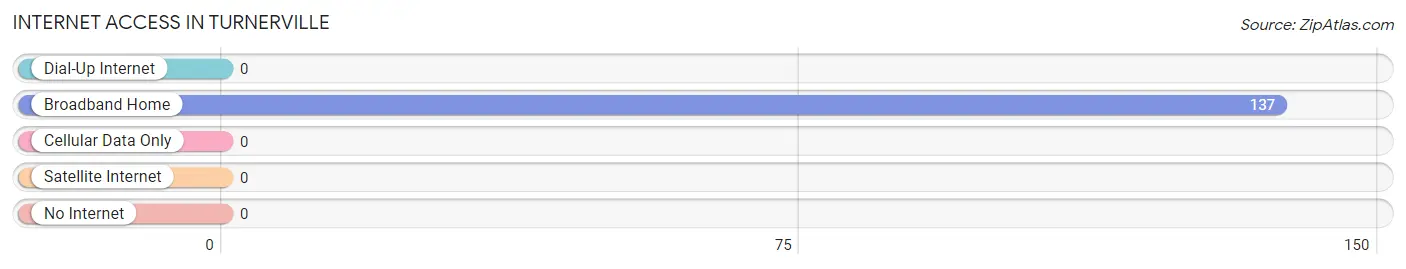
| Internet Type | # Households | % Households |
| Dial-Up Internet | 0 | 0.0% |
| Broadband Home | 137 | 100.0% |
| Cellular Data Only | 0 | 0.0% |
| Satellite Internet | 0 | 0.0% |
| No Internet | 0 | 0.0% |
| Total | 137 | 100.0% |
Turnerville Summary
History
Turnerville, Wyoming is a small town located in the southeastern corner of the state. It was founded in 1882 by a group of settlers who were looking for a place to settle and start a new life. The town was named after the Turners, a family of settlers who had come from Missouri. The town was originally a farming community, but over the years it has grown to include a variety of businesses and services.
The town was originally part of the Wyoming Territory, but in 1890 it became part of the newly formed state of Wyoming. During the early years of the town, it was a quiet and peaceful place. The town was known for its friendly people and its strong sense of community.
In the early 1900s, the town began to grow and develop. The first school was built in 1910 and the first post office was established in 1911. The town also had a bank, a hotel, a general store, and a few other businesses.
The town continued to grow and develop throughout the 20th century. In the 1950s, the town was home to a large number of oil wells, which provided jobs and income for many of the town’s residents. The town also had a number of small businesses, including a grocery store, a hardware store, and a few restaurants.
In the late 1970s, the town began to decline. Many of the businesses closed and the population began to decline. In the 1980s, the town was revitalized with the opening of a new school and the construction of a new library. The town also began to attract new businesses, including a movie theater and a bowling alley.
Today, Turnerville is a small town with a population of just over 500 people. The town is still known for its friendly people and its strong sense of community.
Geography
Turnerville is located in the southeastern corner of Wyoming, near the border with Colorado. The town is situated in the foothills of the Rocky Mountains, at an elevation of 5,400 feet. The town is surrounded by rolling hills and grasslands, with the nearby mountains providing a beautiful backdrop.
The town is located in the Big Horn Basin, which is a large area of land that is surrounded by mountains. The area is known for its wide open spaces and its abundance of wildlife. The nearby Big Horn River provides a source of water for the town and the surrounding area.
The climate in Turnerville is semi-arid, with hot summers and cold winters. The average temperature in the summer is around 80 degrees Fahrenheit, while the average temperature in the winter is around 20 degrees Fahrenheit.
Economy
The economy of Turnerville is largely based on agriculture and tourism. The town is home to a number of farms, which produce a variety of crops, including wheat, corn, and hay. The town also has a number of small businesses, including a grocery store, a hardware store, and a few restaurants.
Tourism is also an important part of the economy in Turnerville. The town is located near a number of popular tourist attractions, including the Big Horn National Forest, the Bighorn Mountains, and the Big Horn River. The town also has a number of recreational activities, including fishing, hunting, and camping.
Demographics
As of the 2010 census, the population of Turnerville was 514 people. The town is predominantly white, with 94.3% of the population being white. The town also has a small Hispanic population, with 4.3% of the population being Hispanic. The median household income in the town is $41,250, and the median age is 44.7 years.
Common Questions
What is Per Capita Income in Turnerville?
Per Capita income in Turnerville is $39,070.
What is Income or Wage Gap in Turnerville?
Income or Wage Gap in Turnerville is 13.8%.
Women in Turnerville earn 86.2 cents for every dollar earned by a man.
What is Inequality or Gini Index in Turnerville?
Inequality or Gini Index in Turnerville is 0.37.
What is the Total Population of Turnerville?
Total Population of Turnerville is 328.
What is the Total Male Population of Turnerville?
Total Male Population of Turnerville is 195.
What is the Total Female Population of Turnerville?
Total Female Population of Turnerville is 133.
What is the Ratio of Males per 100 Females in Turnerville?
There are 146.62 Males per 100 Females in Turnerville.
What is the Ratio of Females per 100 Males in Turnerville?
There are 68.21 Females per 100 Males in Turnerville.
What is the Median Population Age in Turnerville?
Median Population Age in Turnerville is 62.3 Years.
What is the Average Family Size in Turnerville
Average Family Size in Turnerville is 2.4 People.
What is the Average Household Size in Turnerville
Average Household Size in Turnerville is 2.4 People.
How Large is the Labor Force in Turnerville?
There are 250 People in the Labor Forcein in Turnerville.
What is the Percentage of People in the Labor Force in Turnerville?
78.4% of People are in the Labor Force in Turnerville.