North Rock Springs, WY Map & Demographics
North Rock Springs Map
North Rock Springs Overview
$51,074
PER CAPITA INCOME
$153,488
AVG FAMILY INCOME
$116,182
AVG HOUSEHOLD INCOME
71.7%
WAGE / INCOME GAP [ % ]
28.3¢/ $1
WAGE / INCOME GAP [ $ ]
0.37
INEQUALITY / GINI INDEX
2,529
TOTAL POPULATION
1,372
MALE POPULATION
1,157
FEMALE POPULATION
118.58
MALES / 100 FEMALES
84.33
FEMALES / 100 MALES
40.2
MEDIAN AGE
2.8
AVG FAMILY SIZE
2.3
AVG HOUSEHOLD SIZE
1,524
LABOR FORCE [ PEOPLE ]
70.6%
PERCENT IN LABOR FORCE
4.3%
UNEMPLOYMENT RATE
Income in North Rock Springs
Income Overview in North Rock Springs
Per Capita Income in North Rock Springs is $51,074, while median incomes of families and households are $153,488 and $116,182 respectively.
| Characteristic | Number | Measure |
| Per Capita Income | 2,529 | $51,074 |
| Median Family Income | 705 | $153,488 |
| Mean Family Income | 705 | $141,697 |
| Median Household Income | 1,090 | $116,182 |
| Mean Household Income | 1,090 | $117,621 |
| Income Deficit | 705 | $0 |
| Wage / Income Gap (%) | 2,529 | 71.73% |
| Wage / Income Gap ($) | 2,529 | 28.27¢ per $1 |
| Gini / Inequality Index | 2,529 | 0.37 |
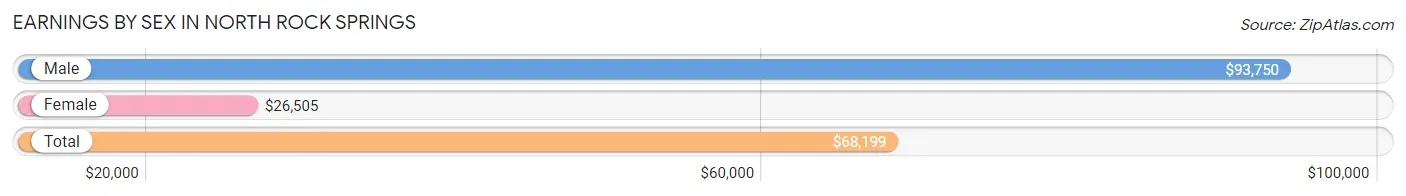
Earnings by Sex in North Rock Springs
Average Earnings in North Rock Springs are $68,199, $93,750 for men and $26,505 for women, a difference of 71.7%.
| Sex | Number | Average Earnings |
| Male | 820 (53.9%) | $93,750 |
| Female | 702 (46.1%) | $26,505 |
| Total | 1,522 (100.0%) | $68,199 |
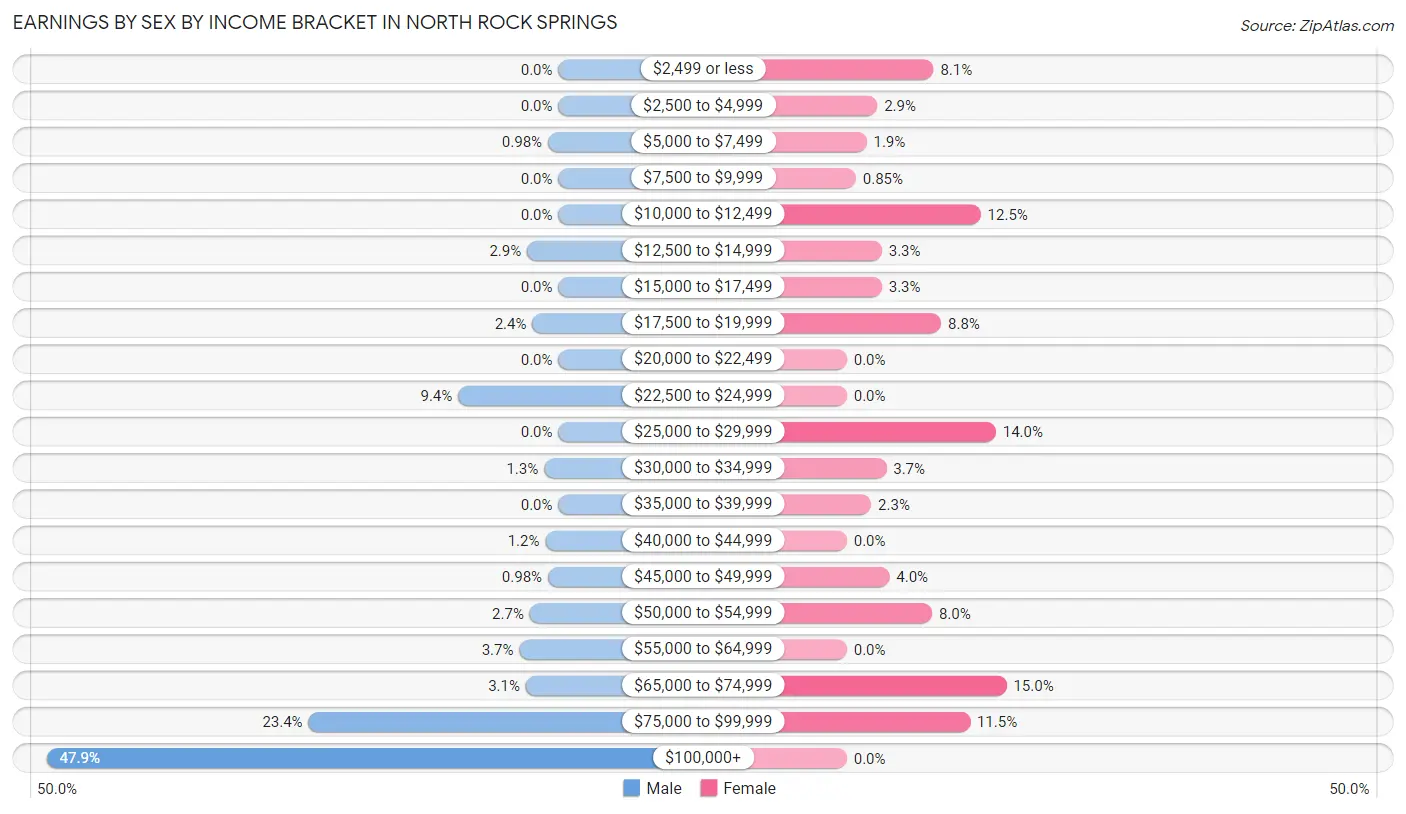
Earnings by Sex by Income Bracket in North Rock Springs
The most common earnings brackets in North Rock Springs are $100,000+ for men (393 | 47.9%) and $65,000 to $74,999 for women (105 | 15.0%).
| Income | Male | Female |
| $2,499 or less | 0 (0.0%) | 57 (8.1%) |
| $2,500 to $4,999 | 0 (0.0%) | 20 (2.9%) |
| $5,000 to $7,499 | 8 (1.0%) | 13 (1.8%) |
| $7,500 to $9,999 | 0 (0.0%) | 6 (0.9%) |
| $10,000 to $12,499 | 0 (0.0%) | 88 (12.5%) |
| $12,500 to $14,999 | 24 (2.9%) | 23 (3.3%) |
| $15,000 to $17,499 | 0 (0.0%) | 23 (3.3%) |
| $17,500 to $19,999 | 20 (2.4%) | 62 (8.8%) |
| $20,000 to $22,499 | 0 (0.0%) | 0 (0.0%) |
| $22,500 to $24,999 | 77 (9.4%) | 0 (0.0%) |
| $25,000 to $29,999 | 0 (0.0%) | 98 (14.0%) |
| $30,000 to $34,999 | 11 (1.3%) | 26 (3.7%) |
| $35,000 to $39,999 | 0 (0.0%) | 16 (2.3%) |
| $40,000 to $44,999 | 10 (1.2%) | 0 (0.0%) |
| $45,000 to $49,999 | 8 (1.0%) | 28 (4.0%) |
| $50,000 to $54,999 | 22 (2.7%) | 56 (8.0%) |
| $55,000 to $64,999 | 30 (3.7%) | 0 (0.0%) |
| $65,000 to $74,999 | 25 (3.0%) | 105 (15.0%) |
| $75,000 to $99,999 | 192 (23.4%) | 81 (11.5%) |
| $100,000+ | 393 (47.9%) | 0 (0.0%) |
| Total | 820 (100.0%) | 702 (100.0%) |
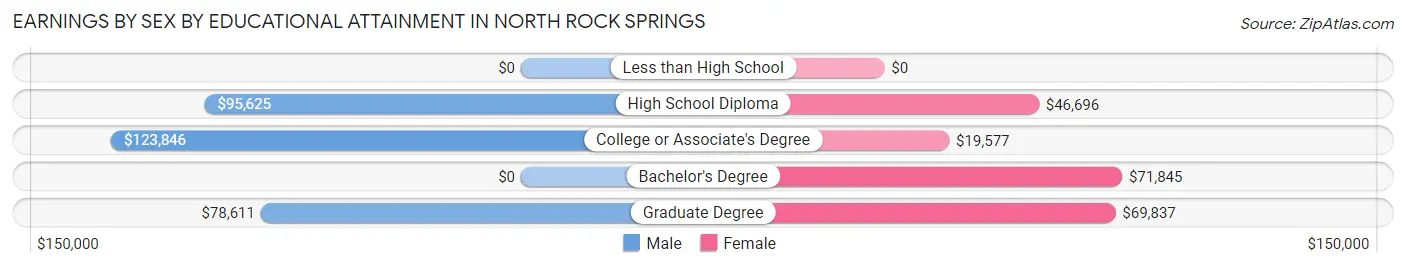
Earnings by Sex by Educational Attainment in North Rock Springs
Average earnings in North Rock Springs are $103,103 for men and $45,223 for women, a difference of 56.1%. Men with an educational attainment of college or associate's degree enjoy the highest average annual earnings of $123,846, while those with graduate degree education earn the least with $78,611. Women with an educational attainment of bachelor's degree earn the most with the average annual earnings of $71,845, while those with college or associate's degree education have the smallest earnings of $19,577.
| Educational Attainment | Male Income | Female Income |
| Less than High School | - | - |
| High School Diploma | $95,625 | $46,696 |
| College or Associate's Degree | $123,846 | $19,577 |
| Bachelor's Degree | - | - |
| Graduate Degree | $78,611 | $69,837 |
| Total | $103,103 | $45,223 |
Family Income in North Rock Springs
Family Income Brackets in North Rock Springs
According to the North Rock Springs family income data, there are 316 families falling into the $150,000 to $199,999 income range, which is the most common income bracket and makes up 44.8% of all families.
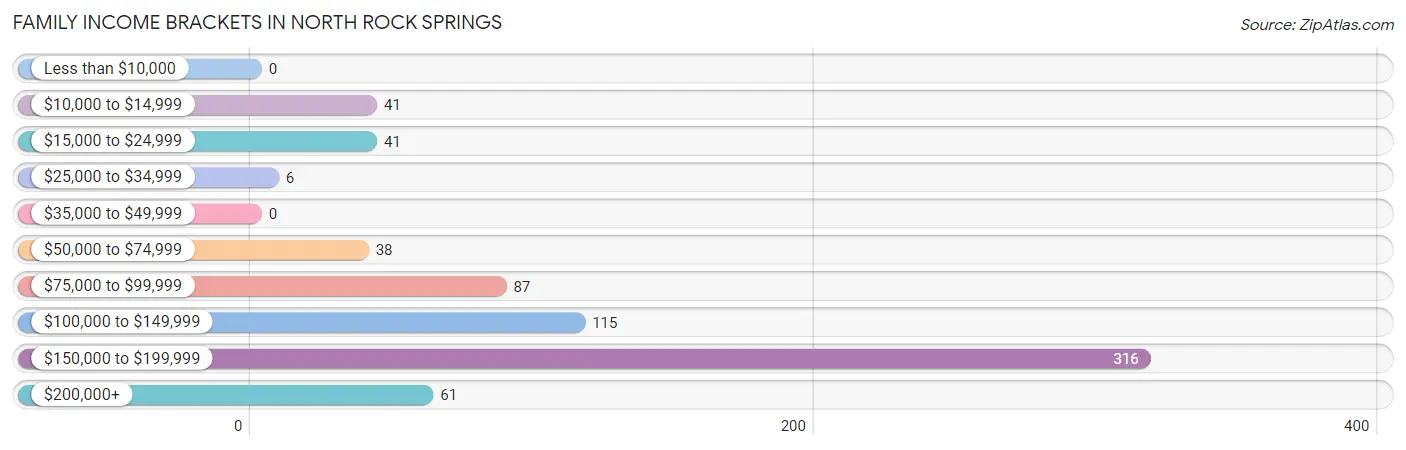
| Income Bracket | # Families | % Families |
| Less than $10,000 | 0 | 0.0% |
| $10,000 to $14,999 | 41 | 5.8% |
| $15,000 to $24,999 | 41 | 5.8% |
| $25,000 to $34,999 | 6 | 0.9% |
| $35,000 to $49,999 | 0 | 0.0% |
| $50,000 to $74,999 | 38 | 5.4% |
| $75,000 to $99,999 | 87 | 12.3% |
| $100,000 to $149,999 | 115 | 16.3% |
| $150,000 to $199,999 | 316 | 44.8% |
| $200,000+ | 61 | 8.7% |
Family Income by Famaliy Size in North Rock Springs
3-person families (161 | 22.8%) account for the highest median family income in North Rock Springs with $171,552 per family, while 2-person families (357 | 50.6%) have the highest median income of $57,648 per family member.
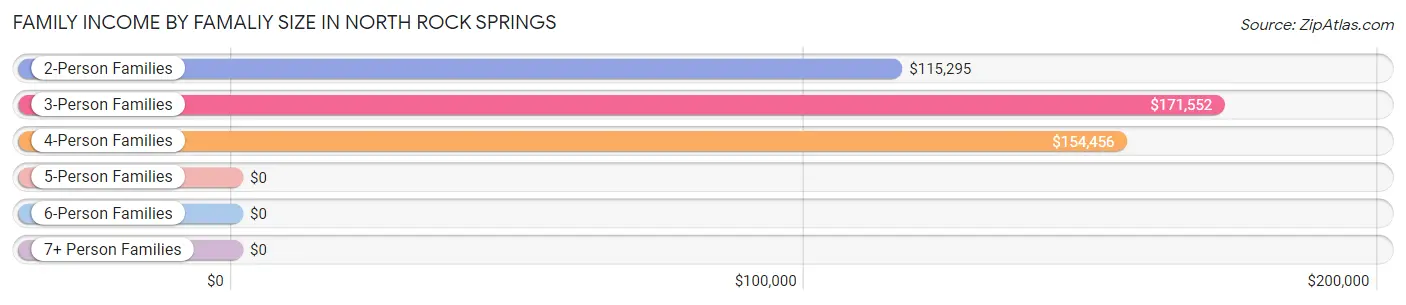
| Income Bracket | # Families | Median Income |
| 2-Person Families | 357 (50.6%) | $115,295 |
| 3-Person Families | 161 (22.8%) | $171,552 |
| 4-Person Families | 173 (24.5%) | $154,456 |
| 5-Person Families | 4 (0.6%) | $0 |
| 6-Person Families | 10 (1.4%) | $0 |
| 7+ Person Families | 0 (0.0%) | $0 |
| Total | 705 (100.0%) | $153,488 |
Family Income by Number of Earners in North Rock Springs
The median family income in North Rock Springs is $153,488, with families comprising 3+ earners (100) having the highest median family income of $184,111, while families with 1 earner (211) have the lowest median family income of $79,850, accounting for 14.2% and 29.9% of families, respectively.
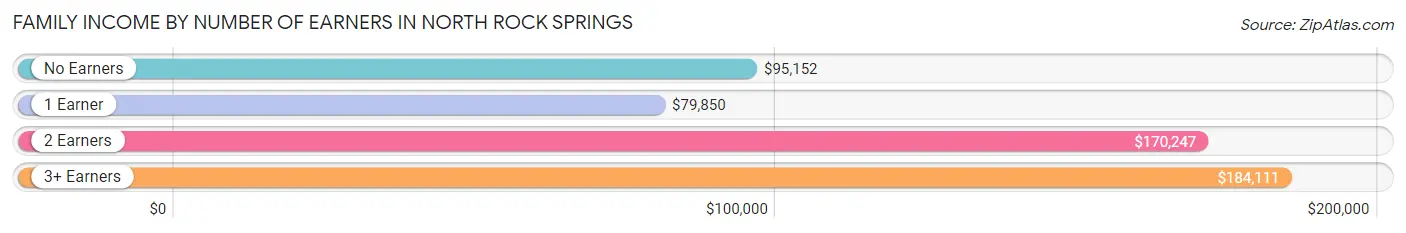
| Number of Earners | # Families | Median Income |
| No Earners | 62 (8.8%) | $95,152 |
| 1 Earner | 211 (29.9%) | $79,850 |
| 2 Earners | 332 (47.1%) | $170,247 |
| 3+ Earners | 100 (14.2%) | $184,111 |
| Total | 705 (100.0%) | $153,488 |
Household Income in North Rock Springs
Household Income Brackets in North Rock Springs
With 374 households falling in the category, the $150,000 to $199,999 income range is the most frequent in North Rock Springs, accounting for 34.3% of all households. In contrast, only 24 households (2.2%) fall into the $10,000 to $14,999 income bracket, making it the least populous group.
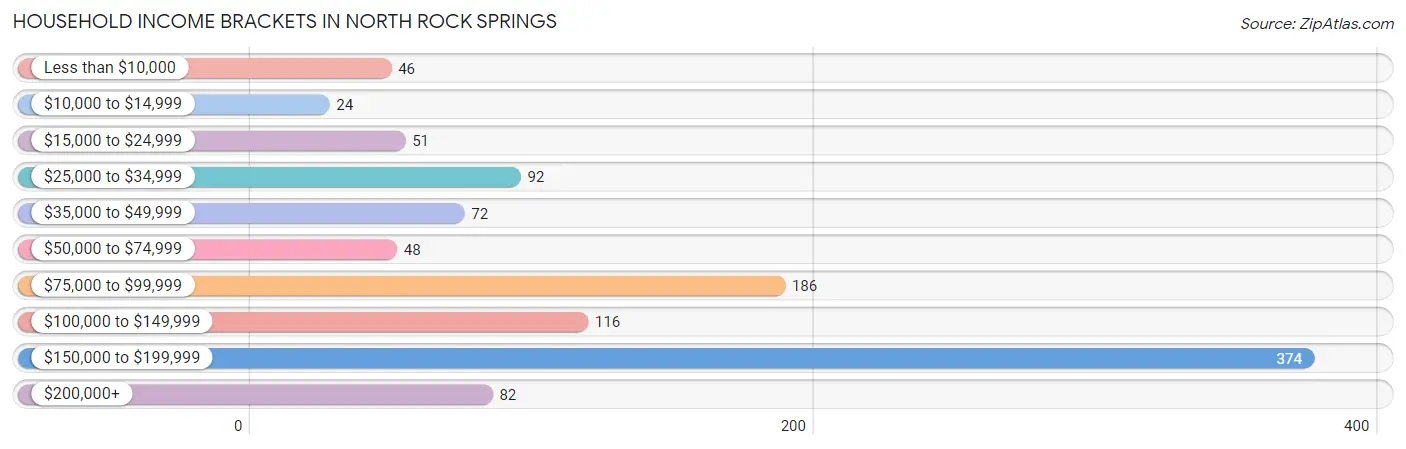
| Income Bracket | # Households | % Households |
| Less than $10,000 | 46 | 4.2% |
| $10,000 to $14,999 | 24 | 2.2% |
| $15,000 to $24,999 | 51 | 4.7% |
| $25,000 to $34,999 | 92 | 8.4% |
| $35,000 to $49,999 | 72 | 6.6% |
| $50,000 to $74,999 | 48 | 4.4% |
| $75,000 to $99,999 | 186 | 17.1% |
| $100,000 to $149,999 | 116 | 10.6% |
| $150,000 to $199,999 | 374 | 34.3% |
| $200,000+ | 82 | 7.5% |
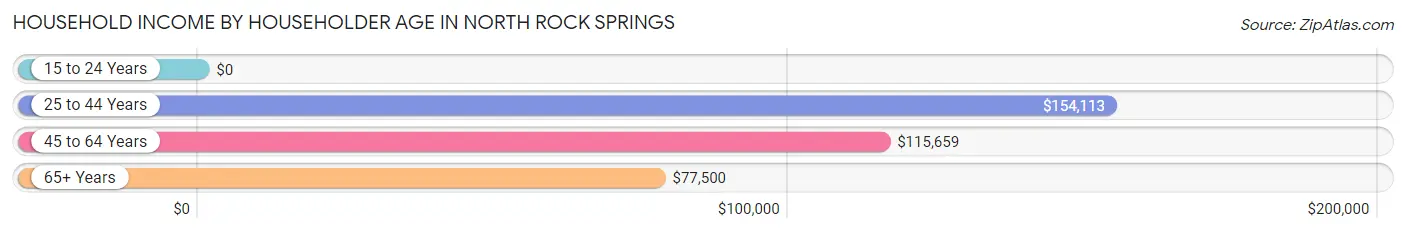
Household Income by Householder Age in North Rock Springs
The median household income in North Rock Springs is $116,182, with the highest median household income of $154,113 found in the 25 to 44 years age bracket for the primary householder. A total of 384 households (35.2%) fall into this category. Meanwhile, the 15 to 24 years age bracket for the primary householder has the lowest median household income of $0, with 71 households (6.5%) in this group.
| Income Bracket | # Households | Median Income |
| 15 to 24 Years | 71 (6.5%) | $0 |
| 25 to 44 Years | 384 (35.2%) | $154,113 |
| 45 to 64 Years | 425 (39.0%) | $115,659 |
| 65+ Years | 210 (19.3%) | $77,500 |
| Total | 1,090 (100.0%) | $116,182 |
Poverty in North Rock Springs
Income Below Poverty by Sex and Age in North Rock Springs
With 7.9% poverty level for males and 19.5% for females among the residents of North Rock Springs, 55 to 64 year old males and 18 to 24 year old females are the most vulnerable to poverty, with 70 males (20.5%) and 64 females (80.0%) in their respective age groups living below the poverty level.
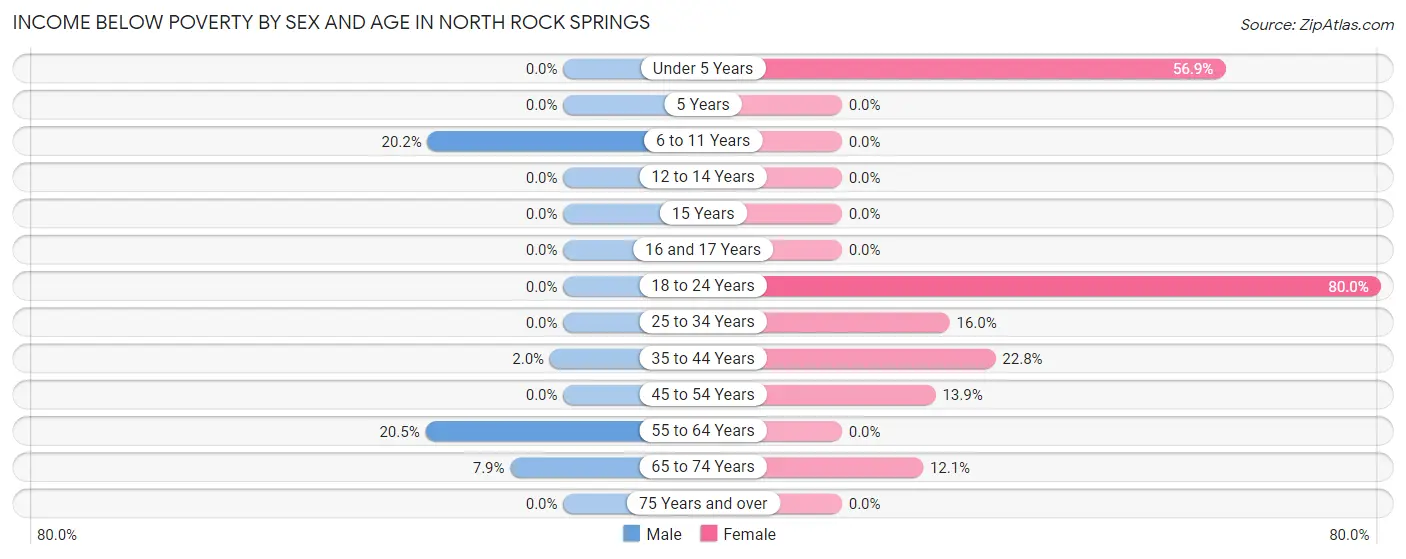
| Age Bracket | Male | Female |
| Under 5 Years | 0 (0.0%) | 37 (56.9%) |
| 5 Years | 0 (0.0%) | 0 (0.0%) |
| 6 to 11 Years | 25 (20.2%) | 0 (0.0%) |
| 12 to 14 Years | 0 (0.0%) | 0 (0.0%) |
| 15 Years | 0 (0.0%) | 0 (0.0%) |
| 16 and 17 Years | 0 (0.0%) | 0 (0.0%) |
| 18 to 24 Years | 0 (0.0%) | 64 (80.0%) |
| 25 to 34 Years | 0 (0.0%) | 28 (16.0%) |
| 35 to 44 Years | 3 (2.0%) | 60 (22.8%) |
| 45 to 54 Years | 0 (0.0%) | 16 (13.9%) |
| 55 to 64 Years | 70 (20.5%) | 0 (0.0%) |
| 65 to 74 Years | 10 (7.9%) | 20 (12.0%) |
| 75 Years and over | 0 (0.0%) | 0 (0.0%) |
| Total | 108 (7.9%) | 225 (19.5%) |
Income Above Poverty by Sex and Age in North Rock Springs
According to the poverty statistics in North Rock Springs, males aged under 5 years and females aged 12 to 14 years are the age groups that are most secure financially, with 100.0% of males and 100.0% of females in these age groups living above the poverty line.
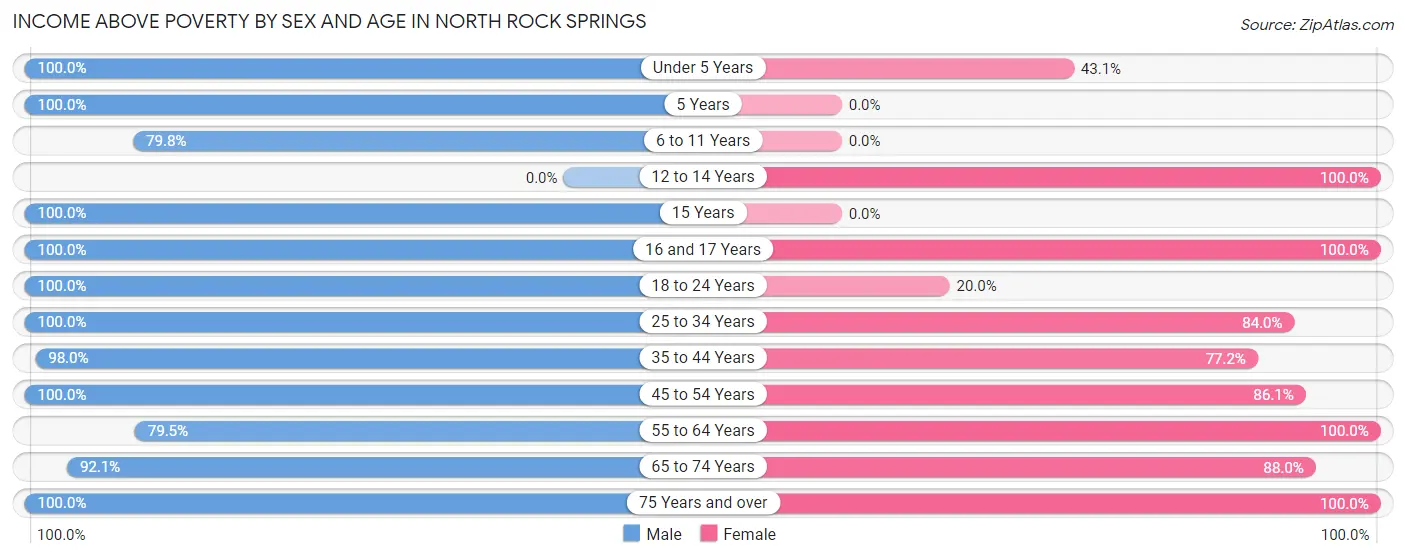
| Age Bracket | Male | Female |
| Under 5 Years | 32 (100.0%) | 28 (43.1%) |
| 5 Years | 12 (100.0%) | 0 (0.0%) |
| 6 to 11 Years | 99 (79.8%) | 0 (0.0%) |
| 12 to 14 Years | 0 (0.0%) | 50 (100.0%) |
| 15 Years | 88 (100.0%) | 0 (0.0%) |
| 16 and 17 Years | 13 (100.0%) | 87 (100.0%) |
| 18 to 24 Years | 157 (100.0%) | 16 (20.0%) |
| 25 to 34 Years | 141 (100.0%) | 147 (84.0%) |
| 35 to 44 Years | 148 (98.0%) | 203 (77.2%) |
| 45 to 54 Years | 174 (100.0%) | 99 (86.1%) |
| 55 to 64 Years | 272 (79.5%) | 146 (100.0%) |
| 65 to 74 Years | 117 (92.1%) | 146 (87.9%) |
| 75 Years and over | 11 (100.0%) | 10 (100.0%) |
| Total | 1,264 (92.1%) | 932 (80.5%) |
Income Below Poverty Among Married-Couple Families in North Rock Springs
The poverty statistics for married-couple families in North Rock Springs show that 2.5% or 16 of the total 637 families live below the poverty line. Families with 1 or 2 children have the highest poverty rate of 6.7%, comprising of 16 families. On the other hand, families with no children have the lowest poverty rate of 0.0%, which includes 0 families.
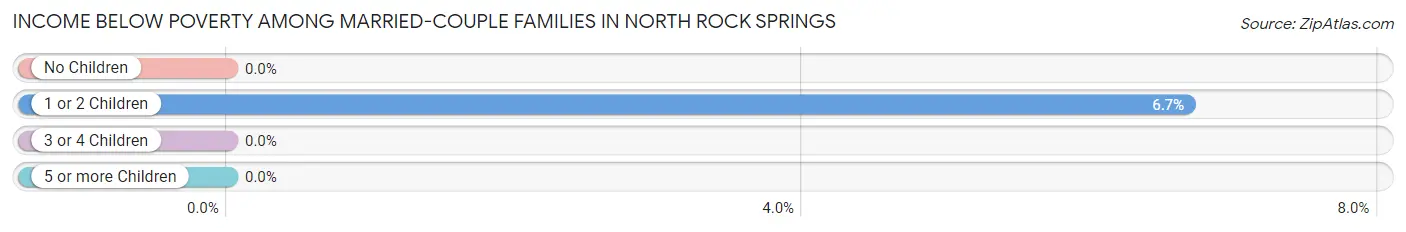
| Children | Above Poverty | Below Poverty |
| No Children | 387 (100.0%) | 0 (0.0%) |
| 1 or 2 Children | 224 (93.3%) | 16 (6.7%) |
| 3 or 4 Children | 10 (100.0%) | 0 (0.0%) |
| 5 or more Children | 0 (0.0%) | 0 (0.0%) |
| Total | 621 (97.5%) | 16 (2.5%) |
Income Below Poverty Among Single-Parent Households in North Rock Springs
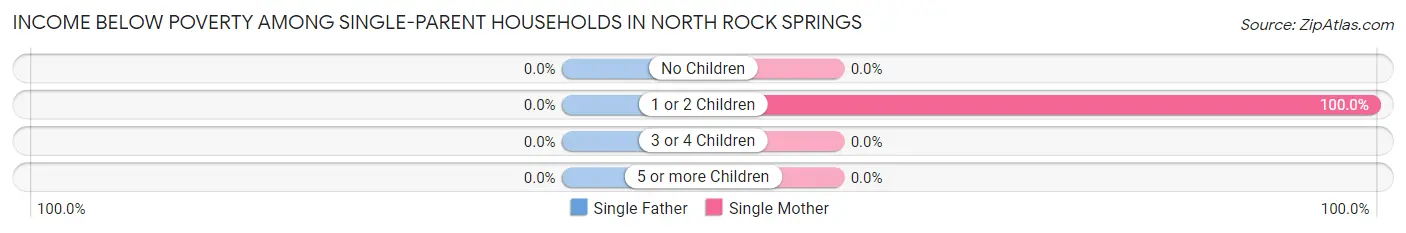
| Children | Single Father | Single Mother |
| No Children | 0 (0.0%) | 0 (0.0%) |
| 1 or 2 Children | 0 (0.0%) | 41 (100.0%) |
| 3 or 4 Children | 0 (0.0%) | 0 (0.0%) |
| 5 or more Children | 0 (0.0%) | 0 (0.0%) |
| Total | 0 (0.0%) | 41 (60.3%) |
Income Below Poverty Among Married-Couple vs Single-Parent Households in North Rock Springs
The poverty data for North Rock Springs shows that 16 of the married-couple family households (2.5%) and 41 of the single-parent households (60.3%) are living below the poverty level. Within the married-couple family households, those with 1 or 2 children have the highest poverty rate, with 16 households (6.7%) falling below the poverty line. Among the single-parent households, those with 1 or 2 children have the highest poverty rate, with 41 household (100.0%) living below poverty.
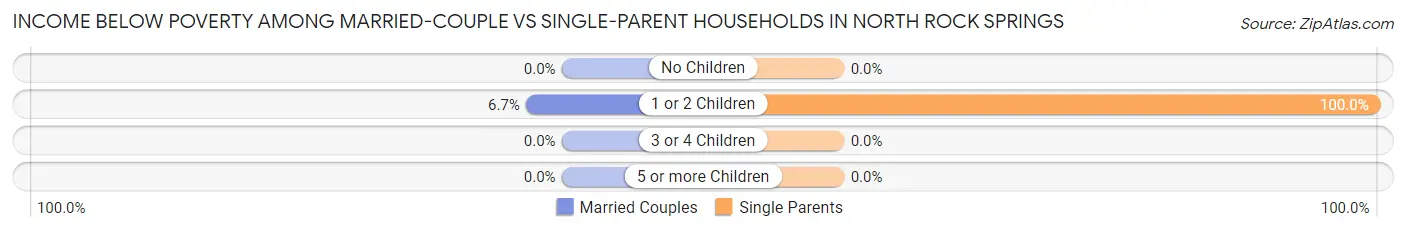
| Children | Married-Couple Families | Single-Parent Households |
| No Children | 0 (0.0%) | 0 (0.0%) |
| 1 or 2 Children | 16 (6.7%) | 41 (100.0%) |
| 3 or 4 Children | 0 (0.0%) | 0 (0.0%) |
| 5 or more Children | 0 (0.0%) | 0 (0.0%) |
| Total | 16 (2.5%) | 41 (60.3%) |
Race in North Rock Springs
The most populous races in North Rock Springs are White / Caucasian (2,177 | 86.1%), Hispanic or Latino (503 | 19.9%), and Some other Race (276 | 10.9%).
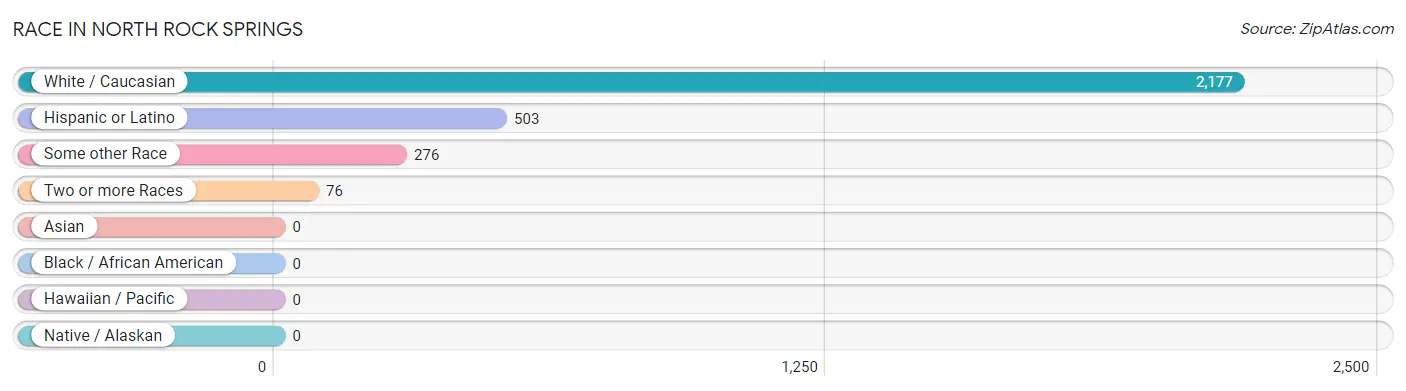
| Race | # Population | % Population |
| Asian | 0 | 0.0% |
| Black / African American | 0 | 0.0% |
| Hawaiian / Pacific | 0 | 0.0% |
| Hispanic or Latino | 503 | 19.9% |
| Native / Alaskan | 0 | 0.0% |
| White / Caucasian | 2,177 | 86.1% |
| Two or more Races | 76 | 3.0% |
| Some other Race | 276 | 10.9% |
| Total | 2,529 | 100.0% |
Ancestry in North Rock Springs
The most populous ancestries reported in North Rock Springs are Mexican (487 | 19.3%), English (420 | 16.6%), German (385 | 15.2%), Irish (331 | 13.1%), and European (95 | 3.8%), together accounting for 67.9% of all North Rock Springs residents.

| Ancestry | # Population | % Population |
| American | 71 | 2.8% |
| Danish | 48 | 1.9% |
| Dutch | 16 | 0.6% |
| English | 420 | 16.6% |
| European | 95 | 3.8% |
| German | 385 | 15.2% |
| Hungarian | 46 | 1.8% |
| Irish | 331 | 13.1% |
| Italian | 64 | 2.5% |
| Mexican | 487 | 19.3% |
| Northern European | 38 | 1.5% |
| Norwegian | 51 | 2.0% |
| Polish | 28 | 1.1% |
| Scandinavian | 28 | 1.1% |
| Scotch-Irish | 6 | 0.2% |
| Scottish | 55 | 2.2% |
| Slavic | 57 | 2.2% |
| Slovene | 23 | 0.9% |
| Spanish | 16 | 0.6% |
| Swedish | 92 | 3.6% |
| Welsh | 8 | 0.3% | View All 21 Rows |
Immigrants in North Rock Springs
The most numerous immigrant groups reported in North Rock Springs came from Central America (62 | 2.5%), Latin America (62 | 2.5%), Mexico (62 | 2.5%), Europe (20 | 0.8%), and Southern Europe (20 | 0.8%), together accounting for 8.9% of all North Rock Springs residents.
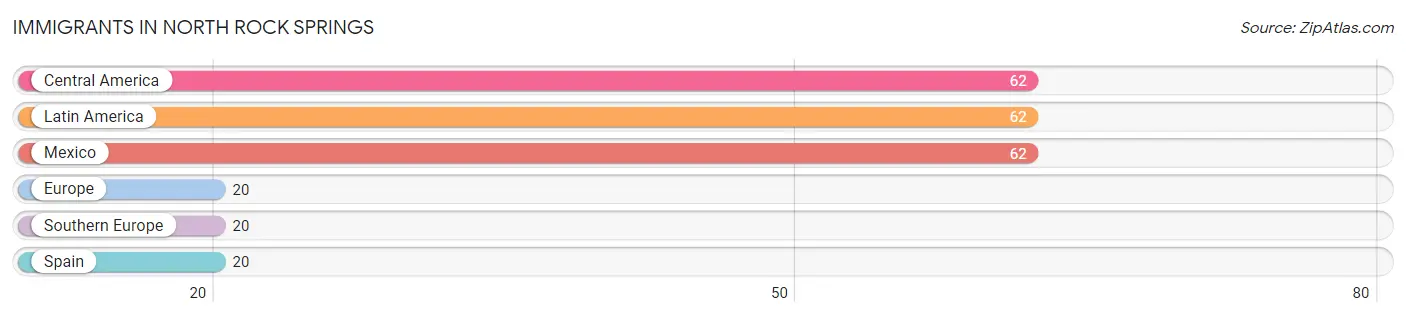
| Immigration Origin | # Population | % Population |
| Central America | 62 | 2.5% |
| Europe | 20 | 0.8% |
| Latin America | 62 | 2.5% |
| Mexico | 62 | 2.5% |
| Southern Europe | 20 | 0.8% |
| Spain | 20 | 0.8% | View All 6 Rows |
Sex and Age in North Rock Springs
Sex and Age in North Rock Springs
The most populous age groups in North Rock Springs are 60 to 64 Years (188 | 13.7%) for men and 35 to 39 Years (141 | 12.2%) for women.
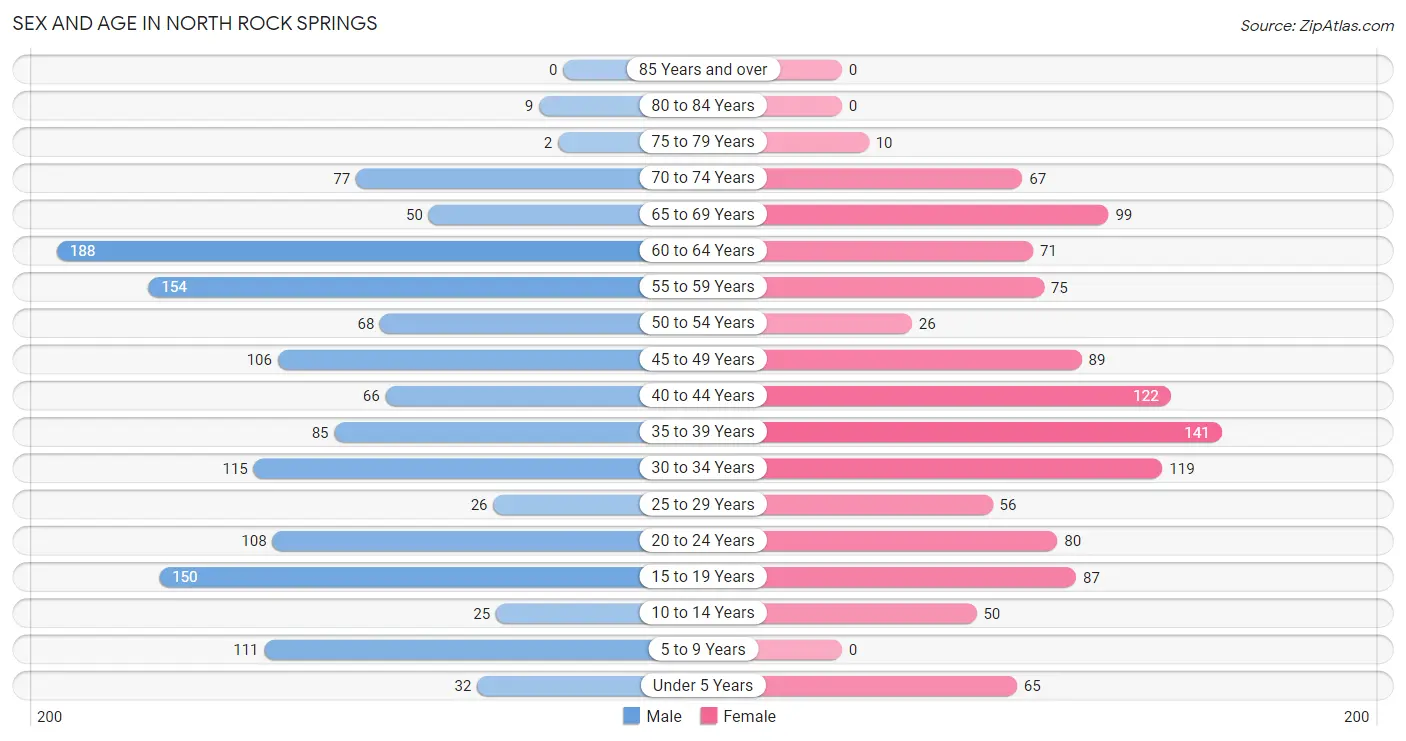
| Age Bracket | Male | Female |
| Under 5 Years | 32 (2.3%) | 65 (5.6%) |
| 5 to 9 Years | 111 (8.1%) | 0 (0.0%) |
| 10 to 14 Years | 25 (1.8%) | 50 (4.3%) |
| 15 to 19 Years | 150 (10.9%) | 87 (7.5%) |
| 20 to 24 Years | 108 (7.9%) | 80 (6.9%) |
| 25 to 29 Years | 26 (1.9%) | 56 (4.8%) |
| 30 to 34 Years | 115 (8.4%) | 119 (10.3%) |
| 35 to 39 Years | 85 (6.2%) | 141 (12.2%) |
| 40 to 44 Years | 66 (4.8%) | 122 (10.5%) |
| 45 to 49 Years | 106 (7.7%) | 89 (7.7%) |
| 50 to 54 Years | 68 (5.0%) | 26 (2.2%) |
| 55 to 59 Years | 154 (11.2%) | 75 (6.5%) |
| 60 to 64 Years | 188 (13.7%) | 71 (6.1%) |
| 65 to 69 Years | 50 (3.6%) | 99 (8.6%) |
| 70 to 74 Years | 77 (5.6%) | 67 (5.8%) |
| 75 to 79 Years | 2 (0.2%) | 10 (0.9%) |
| 80 to 84 Years | 9 (0.7%) | 0 (0.0%) |
| 85 Years and over | 0 (0.0%) | 0 (0.0%) |
| Total | 1,372 (100.0%) | 1,157 (100.0%) |
Families and Households in North Rock Springs
Median Family Size in North Rock Springs
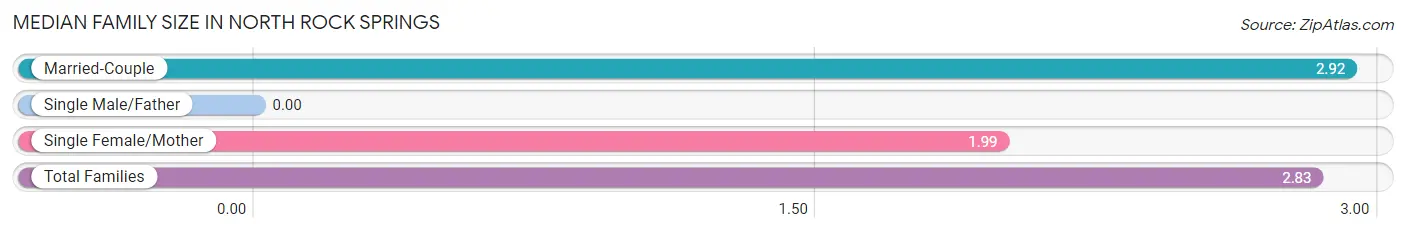
| Family Type | # Families | Family Size |
| Married-Couple | 637 (90.3%) | 2.92 |
| Single Male/Father | 0 (0.0%) | - |
| Single Female/Mother | 68 (9.7%) | 1.99 |
| Total Families | 705 (100.0%) | 2.83 |
Median Household Size in North Rock Springs
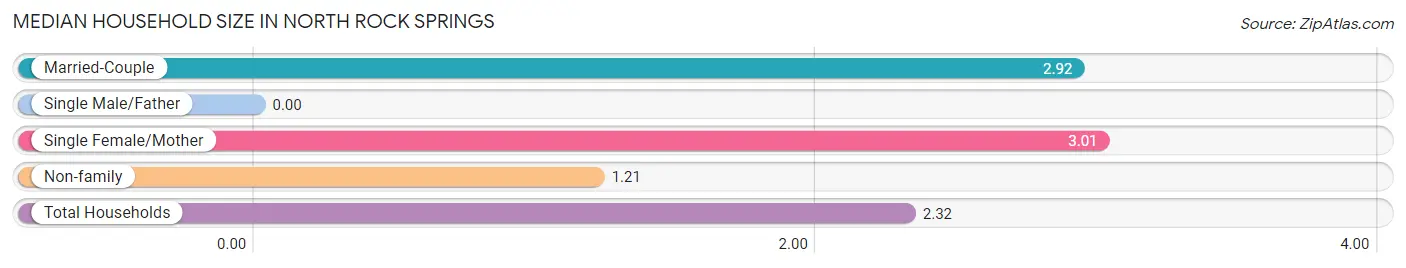
| Household Type | # Households | Household Size |
| Married-Couple | 637 (58.4%) | 2.92 |
| Single Male/Father | 0 (0.0%) | - |
| Single Female/Mother | 68 (6.2%) | 3.01 |
| Non-family | 385 (35.3%) | 1.21 |
| Total Households | 1,090 (100.0%) | 2.32 |
Household Size by Marriage Status in North Rock Springs
Out of a total of 1,090 households in North Rock Springs, 705 (64.7%) are family households, while 385 (35.3%) are nonfamily households. The most numerous type of family households are 2-person households, comprising 316, and the most common type of nonfamily households are 1-person households, comprising 287.
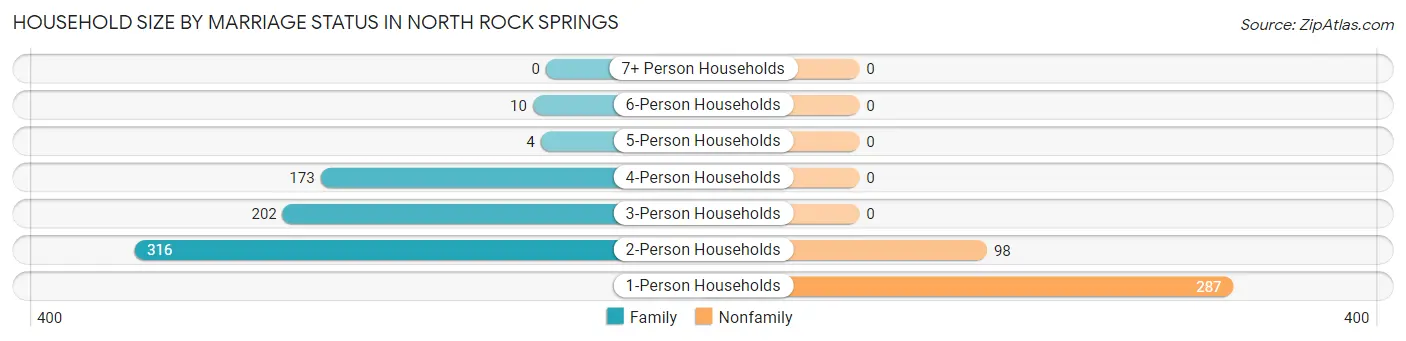
| Household Size | Family Households | Nonfamily Households |
| 1-Person Households | - | 287 (26.3%) |
| 2-Person Households | 316 (29.0%) | 98 (9.0%) |
| 3-Person Households | 202 (18.5%) | 0 (0.0%) |
| 4-Person Households | 173 (15.9%) | 0 (0.0%) |
| 5-Person Households | 4 (0.4%) | 0 (0.0%) |
| 6-Person Households | 10 (0.9%) | 0 (0.0%) |
| 7+ Person Households | 0 (0.0%) | 0 (0.0%) |
| Total | 705 (64.7%) | 385 (35.3%) |
Female Fertility in North Rock Springs
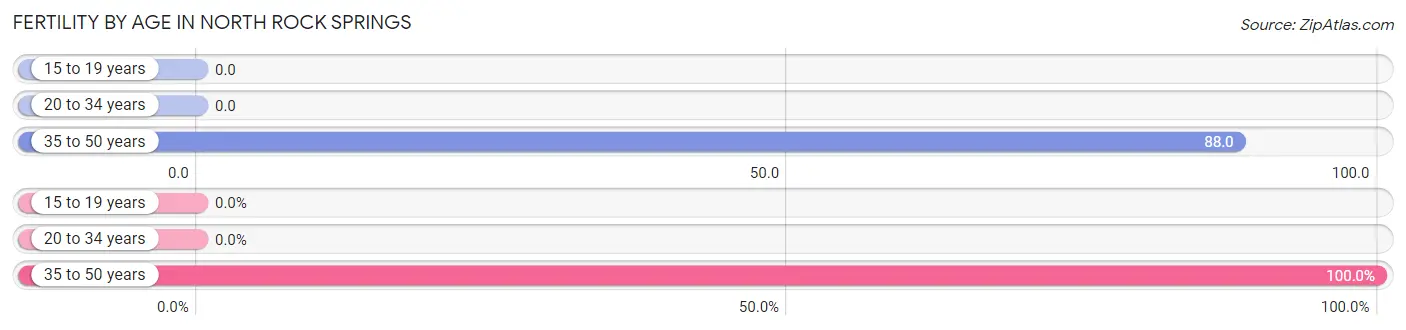
Fertility by Age in North Rock Springs
Average fertility rate in North Rock Springs is 45.0 births per 1,000 women. Women in the age bracket of 35 to 50 years have the highest fertility rate with 88.0 births per 1,000 women. Women in the age bracket of 35 to 50 years acount for 100.0% of all women with births.
| Age Bracket | Women with Births | Births / 1,000 Women |
| 15 to 19 years | 0 (0.0%) | 0.0 |
| 20 to 34 years | 0 (0.0%) | 0.0 |
| 35 to 50 years | 31 (100.0%) | 88.0 |
| Total | 31 (100.0%) | 45.0 |
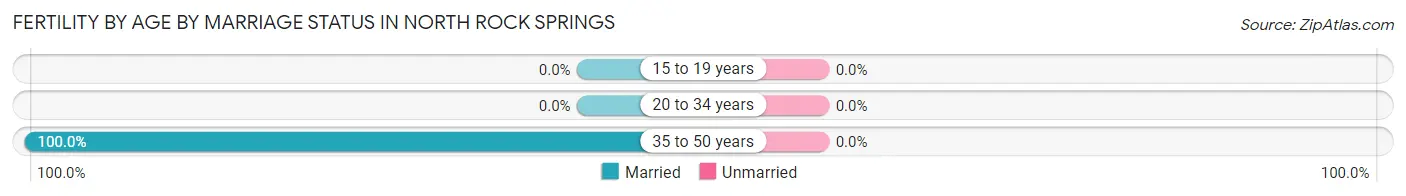
Fertility by Age by Marriage Status in North Rock Springs
| Age Bracket | Married | Unmarried |
| 15 to 19 years | 0 (0.0%) | 0 (0.0%) |
| 20 to 34 years | 0 (0.0%) | 0 (0.0%) |
| 35 to 50 years | 31 (100.0%) | 0 (0.0%) |
| Total | 31 (100.0%) | 0 (0.0%) |
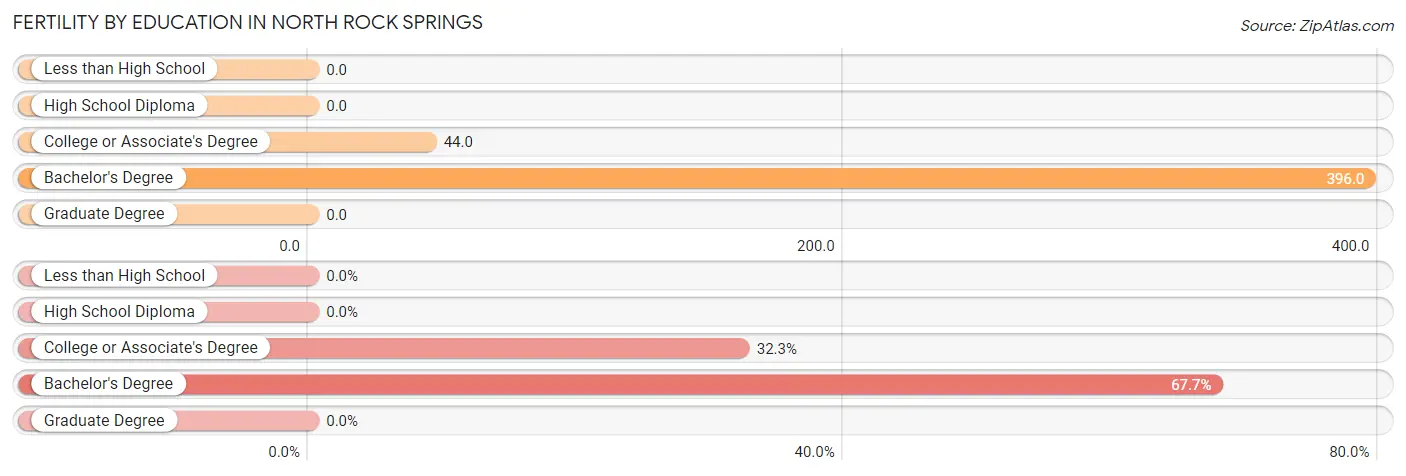
Fertility by Education in North Rock Springs
| Educational Attainment | Women with Births | Births / 1,000 Women |
| Less than High School | 0 (0.0%) | 0.0 |
| High School Diploma | 0 (0.0%) | 0.0 |
| College or Associate's Degree | 10 (32.3%) | 44.0 |
| Bachelor's Degree | 21 (67.7%) | 396.0 |
| Graduate Degree | 0 (0.0%) | 0.0 |
| Total | 31 (100.0%) | 45.0 |
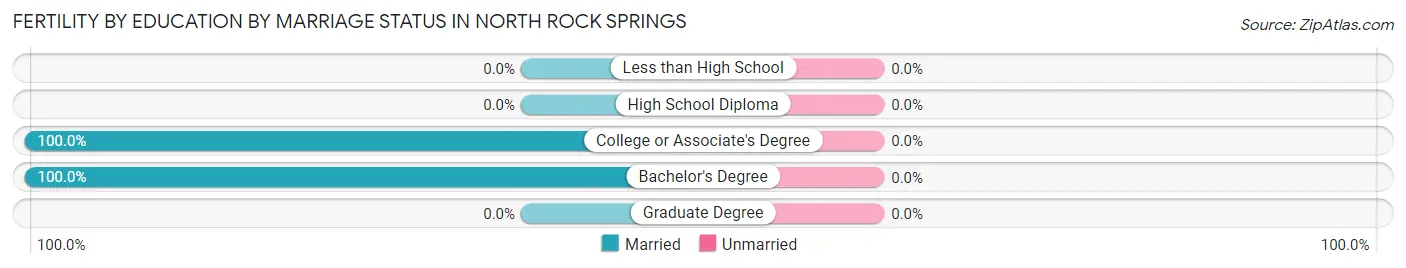
Fertility by Education by Marriage Status in North Rock Springs
| Educational Attainment | Married | Unmarried |
| Less than High School | 0 (0.0%) | 0 (0.0%) |
| High School Diploma | 0 (0.0%) | 0 (0.0%) |
| College or Associate's Degree | 10 (100.0%) | 0 (0.0%) |
| Bachelor's Degree | 21 (100.0%) | 0 (0.0%) |
| Graduate Degree | 0 (0.0%) | 0 (0.0%) |
| Total | 31 (100.0%) | 0 (0.0%) |
Employment Characteristics in North Rock Springs
Employment by Class of Employer in North Rock Springs
Among the 1,458 employed individuals in North Rock Springs, private company employees (1,068 | 73.3%), federal government employees (98 | 6.7%), and state government employees (89 | 6.1%) make up the most common classes of employment.
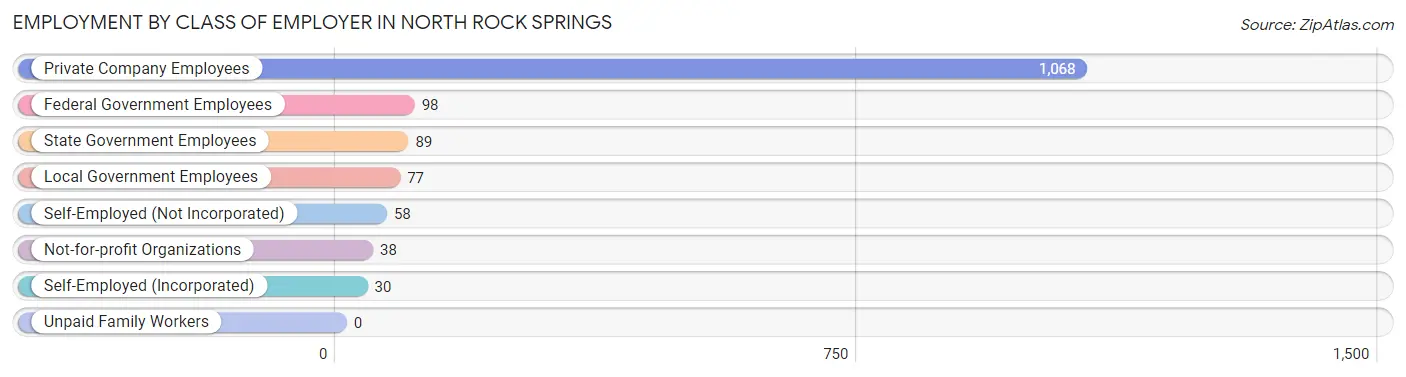
| Employer Class | # Employees | % Employees |
| Private Company Employees | 1,068 | 73.3% |
| Self-Employed (Incorporated) | 30 | 2.1% |
| Self-Employed (Not Incorporated) | 58 | 4.0% |
| Not-for-profit Organizations | 38 | 2.6% |
| Local Government Employees | 77 | 5.3% |
| State Government Employees | 89 | 6.1% |
| Federal Government Employees | 98 | 6.7% |
| Unpaid Family Workers | 0 | 0.0% |
| Total | 1,458 | 100.0% |
Employment Status by Age in North Rock Springs
According to the labor force statistics for North Rock Springs, out of the total population over 16 years of age (2,158), 70.6% or 1,524 individuals are in the labor force, with 4.3% or 66 of them unemployed. The age group with the highest labor force participation rate is 20 to 24 years, with 100.0% or 188 individuals in the labor force. Within the labor force, the 25 to 29 years age range has the highest percentage of unemployed individuals, with 34.1% or 28 of them being unemployed.
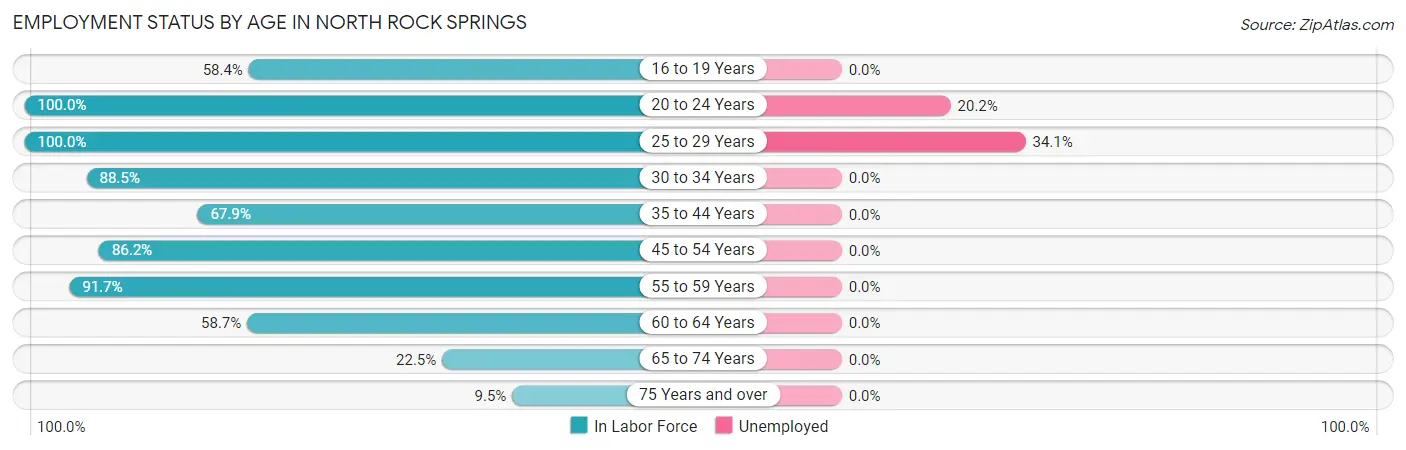
| Age Bracket | In Labor Force | Unemployed |
| 16 to 19 Years | 87 (58.4%) | 0 (0.0%) |
| 20 to 24 Years | 188 (100.0%) | 38 (20.2%) |
| 25 to 29 Years | 82 (100.0%) | 28 (34.1%) |
| 30 to 34 Years | 207 (88.5%) | 0 (0.0%) |
| 35 to 44 Years | 281 (67.9%) | 0 (0.0%) |
| 45 to 54 Years | 249 (86.2%) | 0 (0.0%) |
| 55 to 59 Years | 210 (91.7%) | 0 (0.0%) |
| 60 to 64 Years | 152 (58.7%) | 0 (0.0%) |
| 65 to 74 Years | 66 (22.5%) | 0 (0.0%) |
| 75 Years and over | 2 (9.5%) | 0 (0.0%) |
| Total | 1,524 (70.6%) | 66 (4.3%) |
Employment Status by Educational Attainment in North Rock Springs
According to labor force statistics for North Rock Springs, 78.4% of individuals (1,181) out of the total population between 25 and 64 years of age (1,507) are in the labor force, with 2.4% or 28 of them being unemployed. The group with the highest labor force participation rate are those with the educational attainment of bachelor's degree or higher, with 98.5% or 263 individuals in the labor force. Within the labor force, individuals with high school diploma education have the highest percentage of unemployment, with 5.1% or 28 of them being unemployed.
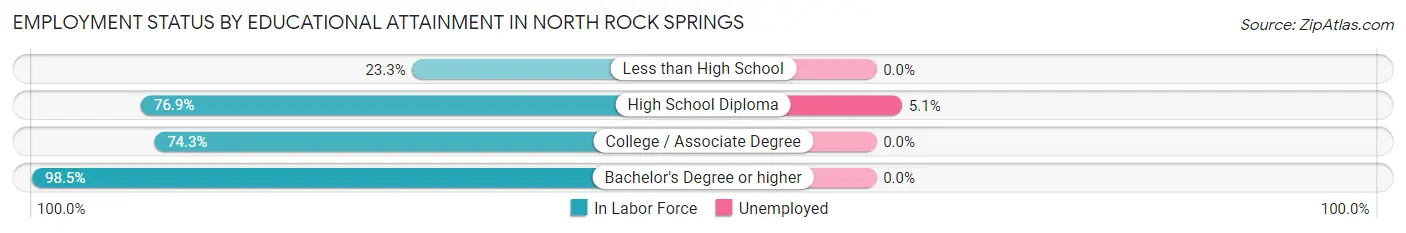
| Educational Attainment | In Labor Force | Unemployed |
| Less than High School | 10 (23.3%) | 0 (0.0%) |
| High School Diploma | 549 (76.9%) | 36 (5.1%) |
| College / Associate Degree | 359 (74.3%) | 0 (0.0%) |
| Bachelor's Degree or higher | 263 (98.5%) | 0 (0.0%) |
| Total | 1,181 (78.4%) | 36 (2.4%) |
Employment Occupations by Sex in North Rock Springs
Management, Business, Science and Arts Occupations
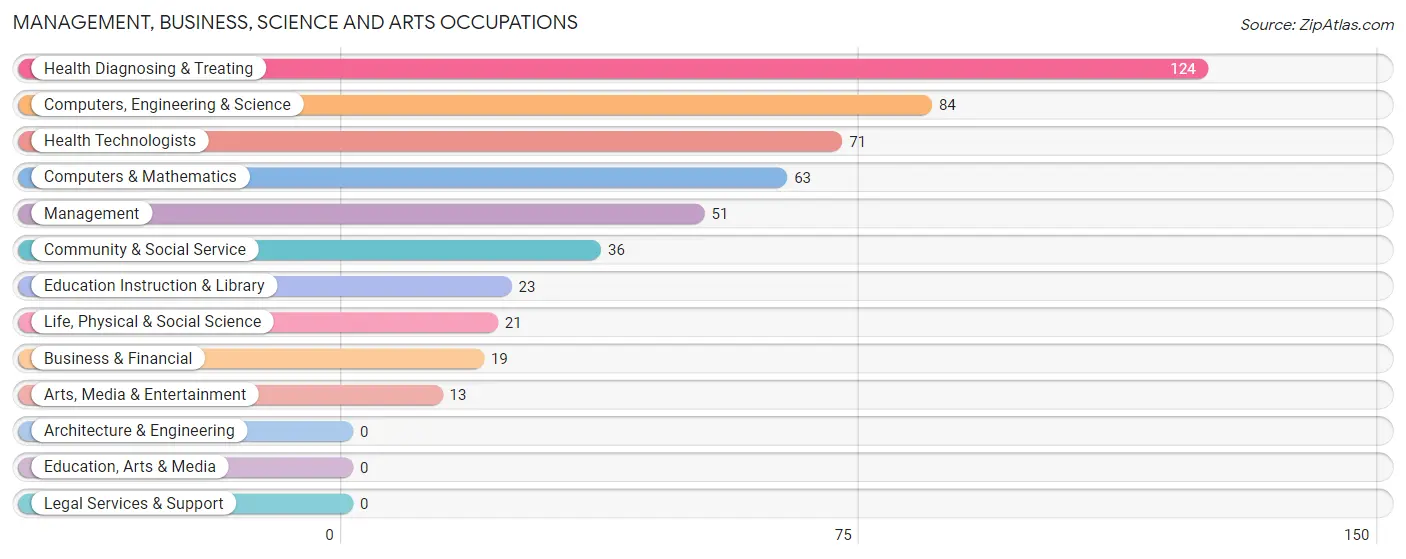
The most common Management, Business, Science and Arts occupations in North Rock Springs are Health Diagnosing & Treating (124 | 8.5%), Computers, Engineering & Science (84 | 5.8%), Health Technologists (71 | 4.9%), Computers & Mathematics (63 | 4.3%), and Management (51 | 3.5%).
Management, Business, Science and Arts Occupations by Sex
Within the Management, Business, Science and Arts occupations in North Rock Springs, the most male-oriented occupations are Life, Physical & Social Science (100.0%), Computers, Engineering & Science (75.0%), and Computers & Mathematics (66.7%), while the most female-oriented occupations are Business & Financial (100.0%), Community & Social Service (100.0%), and Education Instruction & Library (100.0%).
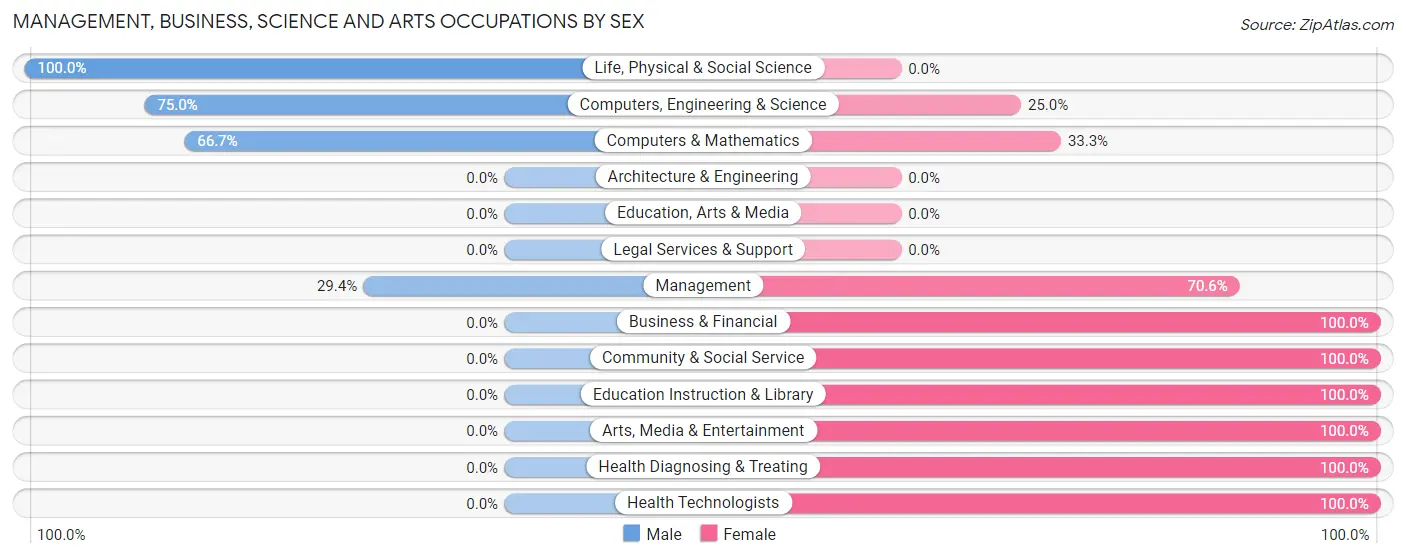
| Occupation | Male | Female |
| Management | 15 (29.4%) | 36 (70.6%) |
| Business & Financial | 0 (0.0%) | 19 (100.0%) |
| Computers, Engineering & Science | 63 (75.0%) | 21 (25.0%) |
| Computers & Mathematics | 42 (66.7%) | 21 (33.3%) |
| Architecture & Engineering | 0 (0.0%) | 0 (0.0%) |
| Life, Physical & Social Science | 21 (100.0%) | 0 (0.0%) |
| Community & Social Service | 0 (0.0%) | 36 (100.0%) |
| Education, Arts & Media | 0 (0.0%) | 0 (0.0%) |
| Legal Services & Support | 0 (0.0%) | 0 (0.0%) |
| Education Instruction & Library | 0 (0.0%) | 23 (100.0%) |
| Arts, Media & Entertainment | 0 (0.0%) | 13 (100.0%) |
| Health Diagnosing & Treating | 0 (0.0%) | 124 (100.0%) |
| Health Technologists | 0 (0.0%) | 71 (100.0%) |
| Total (Category) | 78 (24.8%) | 236 (75.2%) |
| Total (Overall) | 775 (53.2%) | 683 (46.8%) |
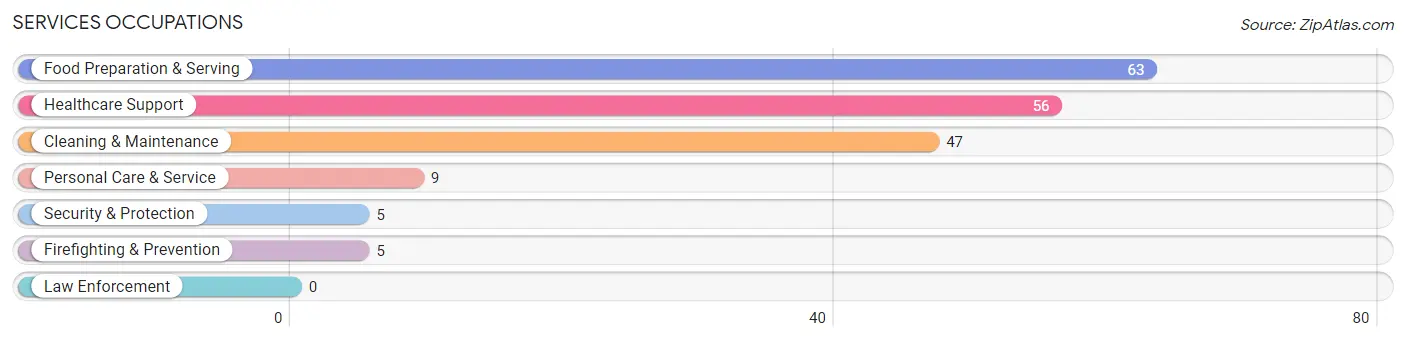
Services Occupations
The most common Services occupations in North Rock Springs are Food Preparation & Serving (63 | 4.3%), Healthcare Support (56 | 3.8%), Cleaning & Maintenance (47 | 3.2%), Personal Care & Service (9 | 0.6%), and Security & Protection (5 | 0.3%).
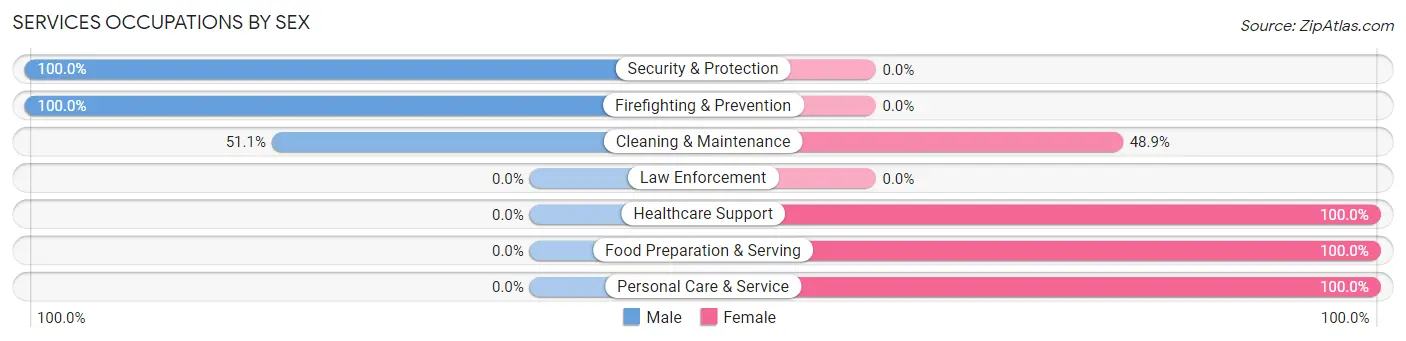
Services Occupations by Sex
Within the Services occupations in North Rock Springs, the most male-oriented occupations are Security & Protection (100.0%), Firefighting & Prevention (100.0%), and Cleaning & Maintenance (51.1%), while the most female-oriented occupations are Healthcare Support (100.0%), Food Preparation & Serving (100.0%), and Personal Care & Service (100.0%).
| Occupation | Male | Female |
| Healthcare Support | 0 (0.0%) | 56 (100.0%) |
| Security & Protection | 5 (100.0%) | 0 (0.0%) |
| Firefighting & Prevention | 5 (100.0%) | 0 (0.0%) |
| Law Enforcement | 0 (0.0%) | 0 (0.0%) |
| Food Preparation & Serving | 0 (0.0%) | 63 (100.0%) |
| Cleaning & Maintenance | 24 (51.1%) | 23 (48.9%) |
| Personal Care & Service | 0 (0.0%) | 9 (100.0%) |
| Total (Category) | 29 (16.1%) | 151 (83.9%) |
| Total (Overall) | 775 (53.2%) | 683 (46.8%) |
Sales and Office Occupations
The most common Sales and Office occupations in North Rock Springs are Office & Administration (171 | 11.7%), and Sales & Related (93 | 6.4%).
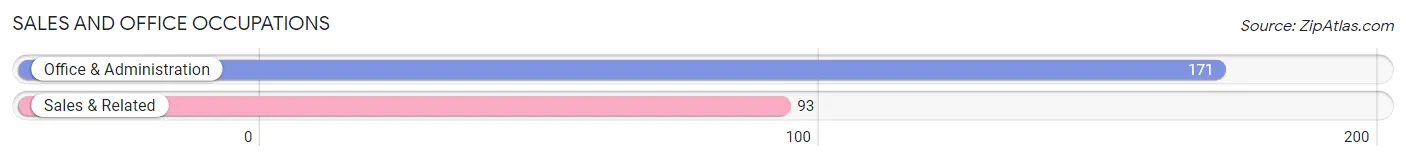
Sales and Office Occupations by Sex

| Occupation | Male | Female |
| Sales & Related | 63 (67.7%) | 30 (32.3%) |
| Office & Administration | 0 (0.0%) | 171 (100.0%) |
| Total (Category) | 63 (23.9%) | 201 (76.1%) |
| Total (Overall) | 775 (53.2%) | 683 (46.8%) |
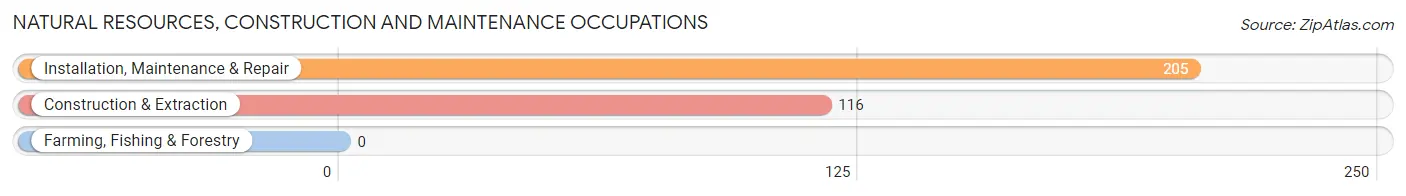
Natural Resources, Construction and Maintenance Occupations
The most common Natural Resources, Construction and Maintenance occupations in North Rock Springs are Installation, Maintenance & Repair (205 | 14.1%), and Construction & Extraction (116 | 8.0%).
Natural Resources, Construction and Maintenance Occupations by Sex
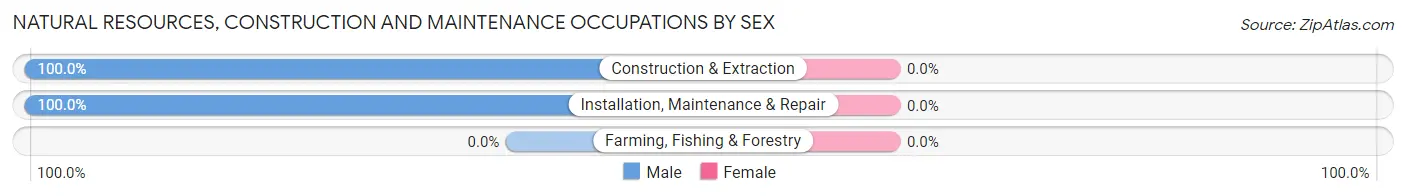
| Occupation | Male | Female |
| Farming, Fishing & Forestry | 0 (0.0%) | 0 (0.0%) |
| Construction & Extraction | 116 (100.0%) | 0 (0.0%) |
| Installation, Maintenance & Repair | 205 (100.0%) | 0 (0.0%) |
| Total (Category) | 321 (100.0%) | 0 (0.0%) |
| Total (Overall) | 775 (53.2%) | 683 (46.8%) |
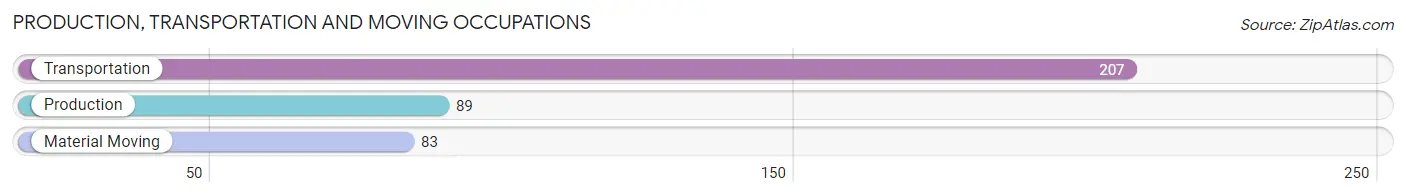
Production, Transportation and Moving Occupations
The most common Production, Transportation and Moving occupations in North Rock Springs are Transportation (207 | 14.2%), Production (89 | 6.1%), and Material Moving (83 | 5.7%).
Production, Transportation and Moving Occupations by Sex
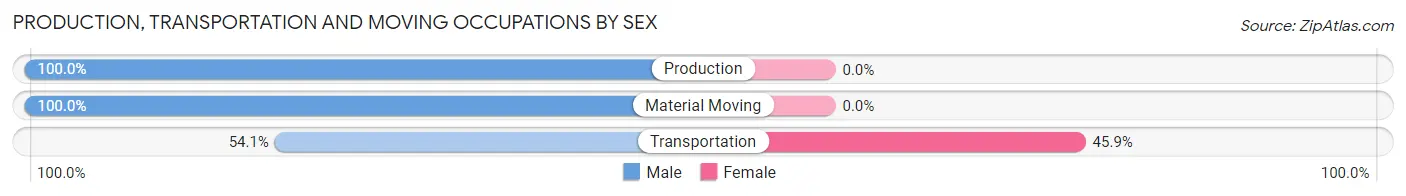
| Occupation | Male | Female |
| Production | 89 (100.0%) | 0 (0.0%) |
| Transportation | 112 (54.1%) | 95 (45.9%) |
| Material Moving | 83 (100.0%) | 0 (0.0%) |
| Total (Category) | 284 (74.9%) | 95 (25.1%) |
| Total (Overall) | 775 (53.2%) | 683 (46.8%) |
Employment Industries by Sex in North Rock Springs
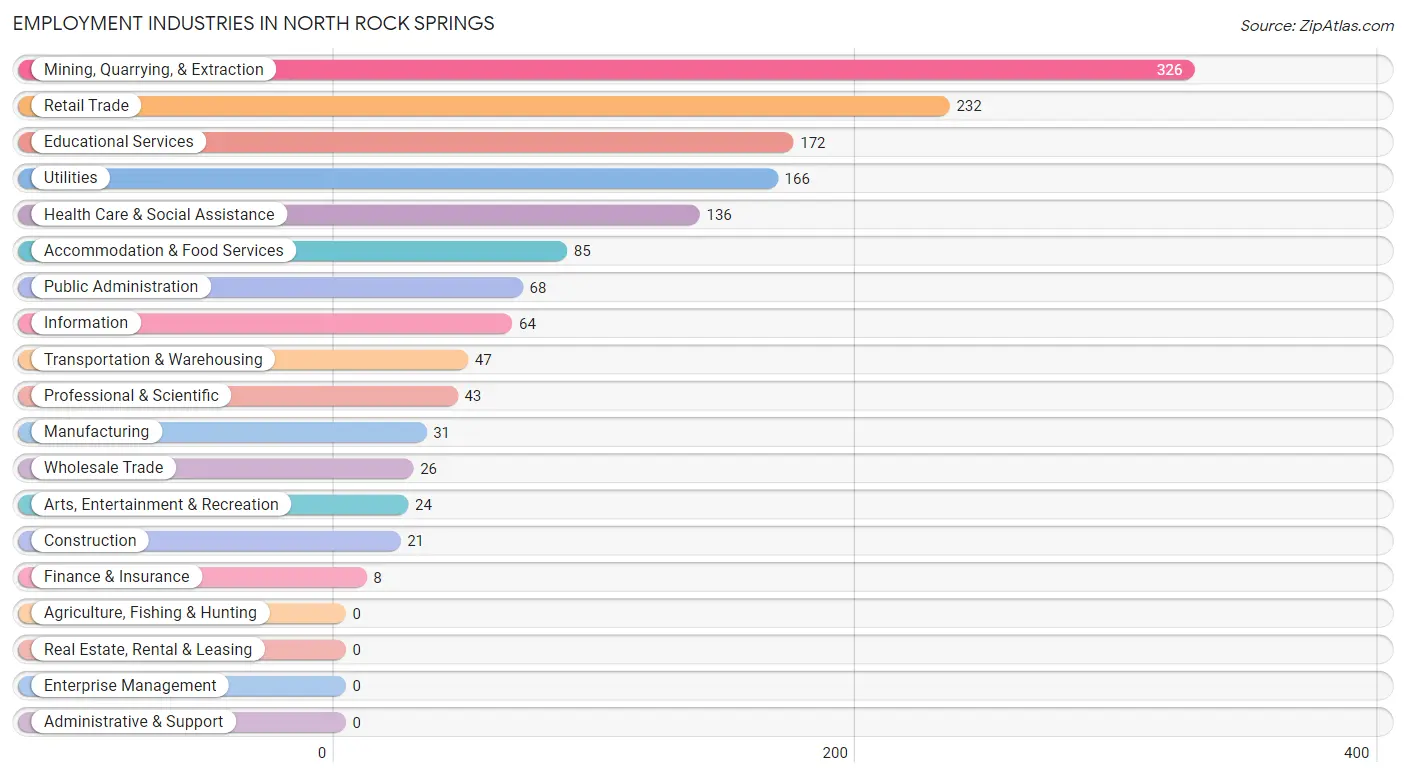
Employment Industries in North Rock Springs
The major employment industries in North Rock Springs include Mining, Quarrying, & Extraction (326 | 22.4%), Retail Trade (232 | 15.9%), Educational Services (172 | 11.8%), Utilities (166 | 11.4%), and Health Care & Social Assistance (136 | 9.3%).
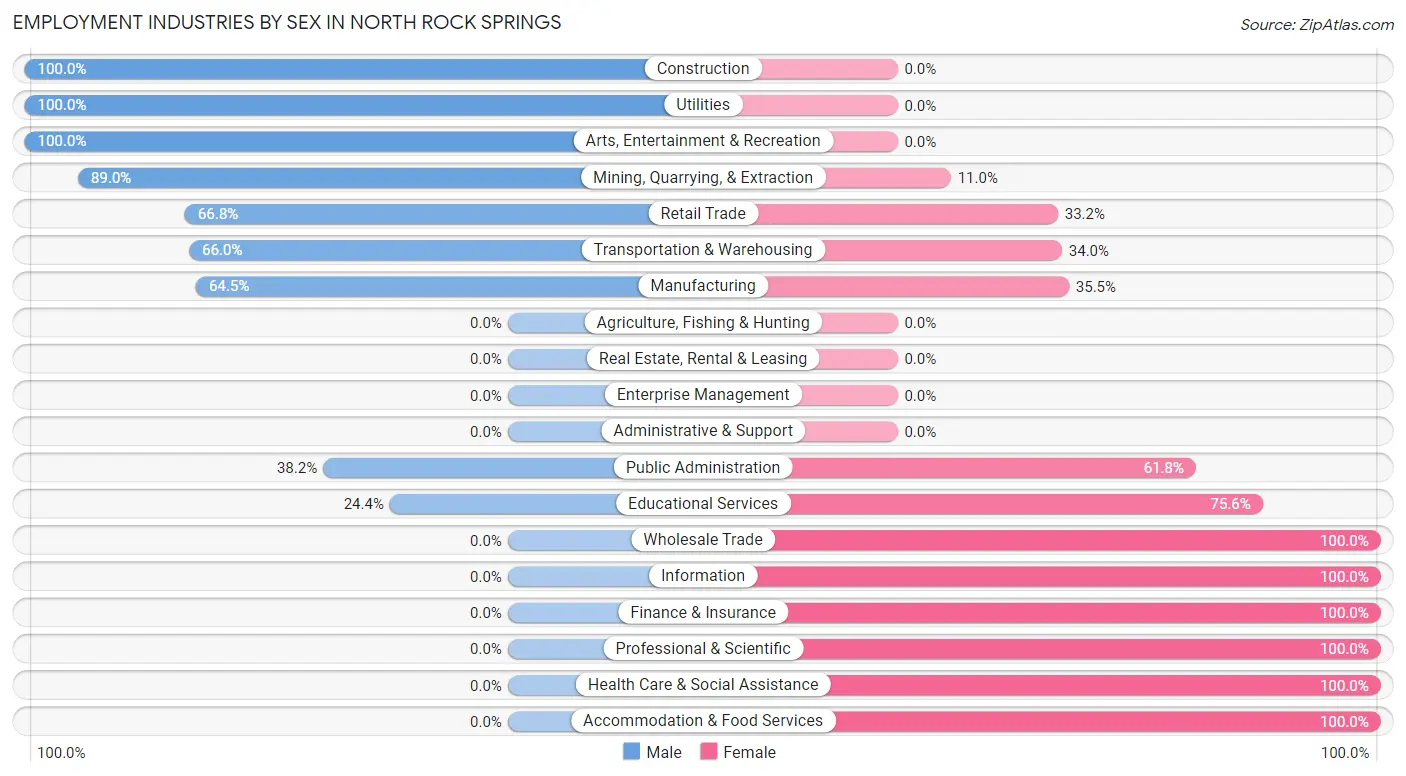
Employment Industries by Sex in North Rock Springs
The North Rock Springs industries that see more men than women are Construction (100.0%), Utilities (100.0%), and Arts, Entertainment & Recreation (100.0%), whereas the industries that tend to have a higher number of women are Wholesale Trade (100.0%), Information (100.0%), and Finance & Insurance (100.0%).
| Industry | Male | Female |
| Agriculture, Fishing & Hunting | 0 (0.0%) | 0 (0.0%) |
| Mining, Quarrying, & Extraction | 290 (89.0%) | 36 (11.0%) |
| Construction | 21 (100.0%) | 0 (0.0%) |
| Manufacturing | 20 (64.5%) | 11 (35.5%) |
| Wholesale Trade | 0 (0.0%) | 26 (100.0%) |
| Retail Trade | 155 (66.8%) | 77 (33.2%) |
| Transportation & Warehousing | 31 (66.0%) | 16 (34.0%) |
| Utilities | 166 (100.0%) | 0 (0.0%) |
| Information | 0 (0.0%) | 64 (100.0%) |
| Finance & Insurance | 0 (0.0%) | 8 (100.0%) |
| Real Estate, Rental & Leasing | 0 (0.0%) | 0 (0.0%) |
| Professional & Scientific | 0 (0.0%) | 43 (100.0%) |
| Enterprise Management | 0 (0.0%) | 0 (0.0%) |
| Administrative & Support | 0 (0.0%) | 0 (0.0%) |
| Educational Services | 42 (24.4%) | 130 (75.6%) |
| Health Care & Social Assistance | 0 (0.0%) | 136 (100.0%) |
| Arts, Entertainment & Recreation | 24 (100.0%) | 0 (0.0%) |
| Accommodation & Food Services | 0 (0.0%) | 85 (100.0%) |
| Public Administration | 26 (38.2%) | 42 (61.8%) |
| Total | 775 (53.2%) | 683 (46.8%) |
Education in North Rock Springs
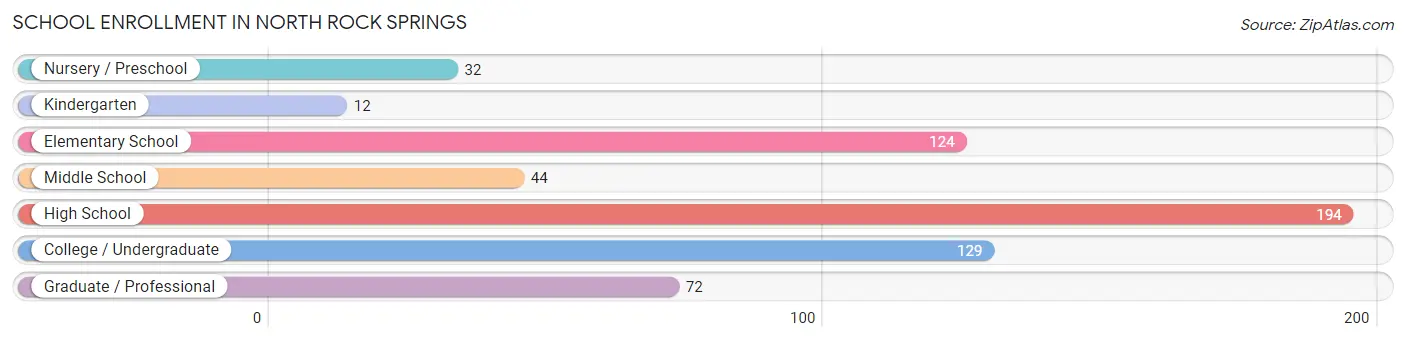
School Enrollment in North Rock Springs
The most common levels of schooling among the 607 students in North Rock Springs are high school (194 | 32.0%), college / undergraduate (129 | 21.2%), and elementary school (124 | 20.4%).
| School Level | # Students | % Students |
| Nursery / Preschool | 32 | 5.3% |
| Kindergarten | 12 | 2.0% |
| Elementary School | 124 | 20.4% |
| Middle School | 44 | 7.2% |
| High School | 194 | 32.0% |
| College / Undergraduate | 129 | 21.2% |
| Graduate / Professional | 72 | 11.9% |
| Total | 607 | 100.0% |
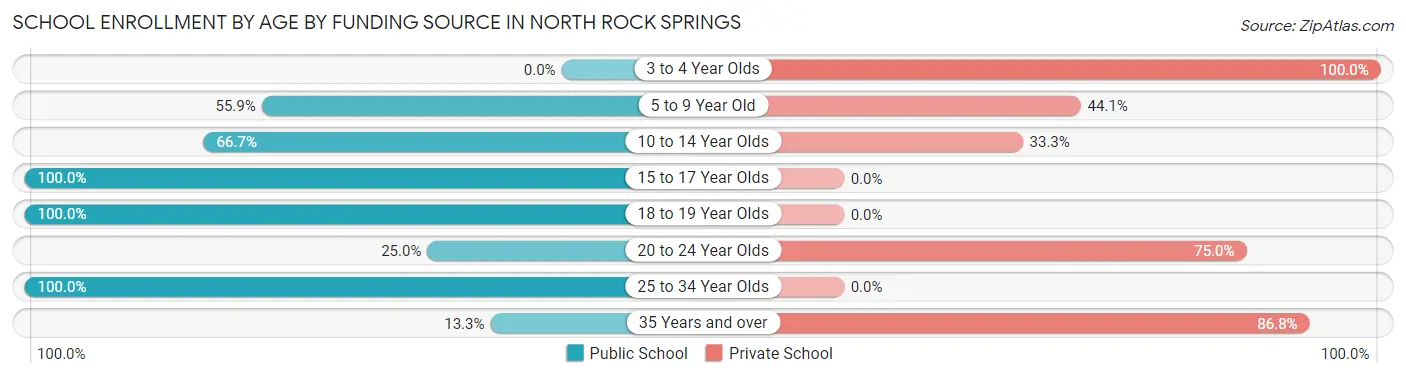
School Enrollment by Age by Funding Source in North Rock Springs
Out of a total of 607 students who are enrolled in schools in North Rock Springs, 208 (34.3%) attend a private institution, while the remaining 399 (65.7%) are enrolled in public schools. The age group of 3 to 4 year olds has the highest likelihood of being enrolled in private schools, with 32 (100.0% in the age bracket) enrolled. Conversely, the age group of 15 to 17 year olds has the lowest likelihood of being enrolled in a private school, with 188 (100.0% in the age bracket) attending a public institution.
| Age Bracket | Public School | Private School |
| 3 to 4 Year Olds | 0 (0.0%) | 32 (100.0%) |
| 5 to 9 Year Old | 62 (55.9%) | 49 (44.1%) |
| 10 to 14 Year Olds | 50 (66.7%) | 25 (33.3%) |
| 15 to 17 Year Olds | 188 (100.0%) | 0 (0.0%) |
| 18 to 19 Year Olds | 49 (100.0%) | 0 (0.0%) |
| 20 to 24 Year Olds | 10 (25.0%) | 30 (75.0%) |
| 25 to 34 Year Olds | 29 (100.0%) | 0 (0.0%) |
| 35 Years and over | 11 (13.3%) | 72 (86.8%) |
| Total | 399 (65.7%) | 208 (34.3%) |
Educational Attainment by Field of Study in North Rock Springs
Education (95 | 30.4%), bio, nature & agricultural (68 | 21.8%), business (48 | 15.4%), science & technology (42 | 13.5%), and computers & mathematics (21 | 6.7%) are the most common fields of study among 312 individuals in North Rock Springs who have obtained a bachelor's degree or higher.
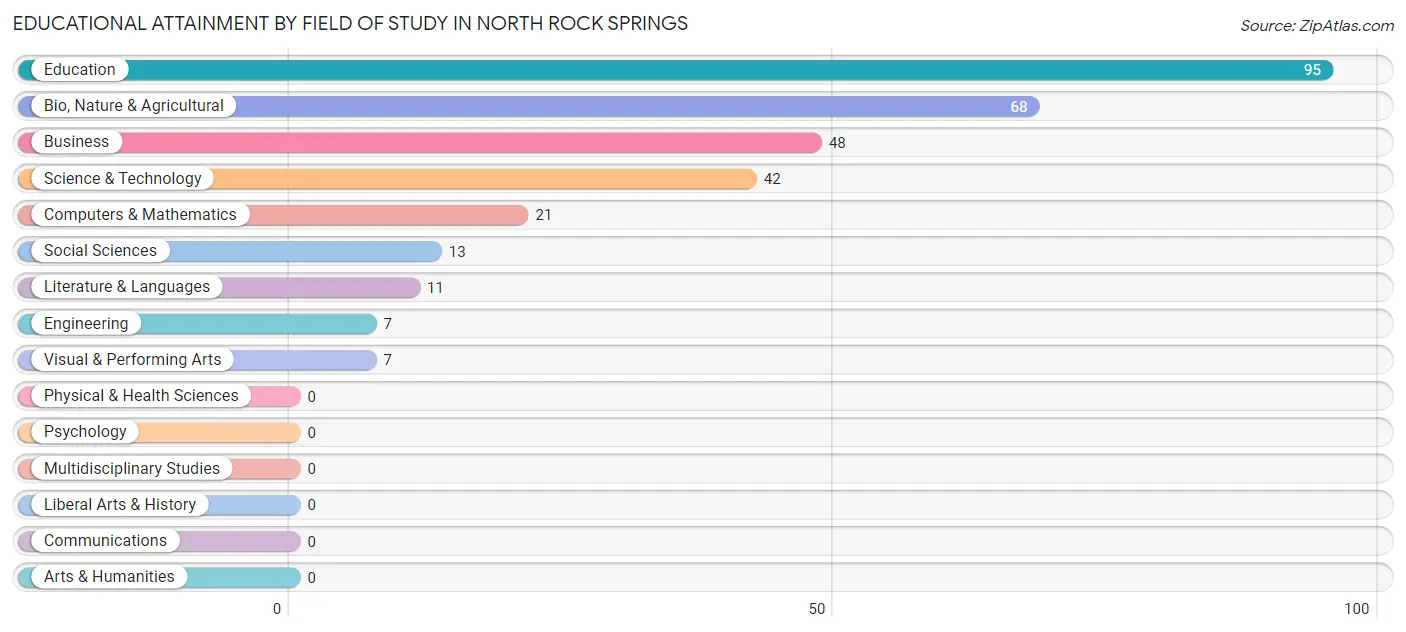
| Field of Study | # Graduates | % Graduates |
| Computers & Mathematics | 21 | 6.7% |
| Bio, Nature & Agricultural | 68 | 21.8% |
| Physical & Health Sciences | 0 | 0.0% |
| Psychology | 0 | 0.0% |
| Social Sciences | 13 | 4.2% |
| Engineering | 7 | 2.2% |
| Multidisciplinary Studies | 0 | 0.0% |
| Science & Technology | 42 | 13.5% |
| Business | 48 | 15.4% |
| Education | 95 | 30.4% |
| Literature & Languages | 11 | 3.5% |
| Liberal Arts & History | 0 | 0.0% |
| Visual & Performing Arts | 7 | 2.2% |
| Communications | 0 | 0.0% |
| Arts & Humanities | 0 | 0.0% |
| Total | 312 | 100.0% |
Transportation & Commute in North Rock Springs
Vehicle Availability by Sex in North Rock Springs
The most prevalent vehicle ownership categories in North Rock Springs are males with 4 vehicles (256, accounting for 33.0%) and females with 4 vehicles (151, making up 37.5%).
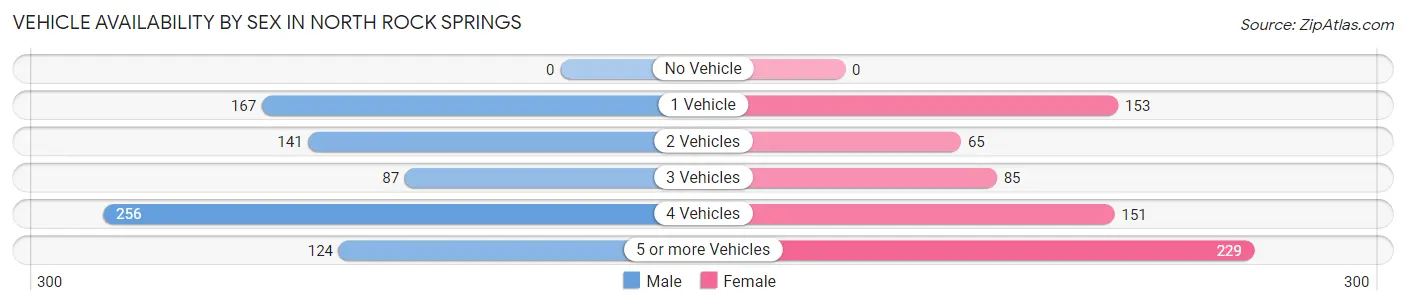
| Vehicles Available | Male | Female |
| No Vehicle | 0 (0.0%) | 0 (0.0%) |
| 1 Vehicle | 167 (21.5%) | 153 (22.4%) |
| 2 Vehicles | 141 (18.2%) | 65 (9.5%) |
| 3 Vehicles | 87 (11.2%) | 85 (12.4%) |
| 4 Vehicles | 256 (33.0%) | 151 (22.1%) |
| 5 or more Vehicles | 124 (16.0%) | 229 (33.5%) |
| Total | 775 (100.0%) | 683 (100.0%) |
Commute Time in North Rock Springs
The most frequently occuring commute durations in North Rock Springs are 15 to 19 minutes (312 commuters, 24.3%), 10 to 14 minutes (273 commuters, 21.3%), and 45 to 59 minutes (217 commuters, 16.9%).
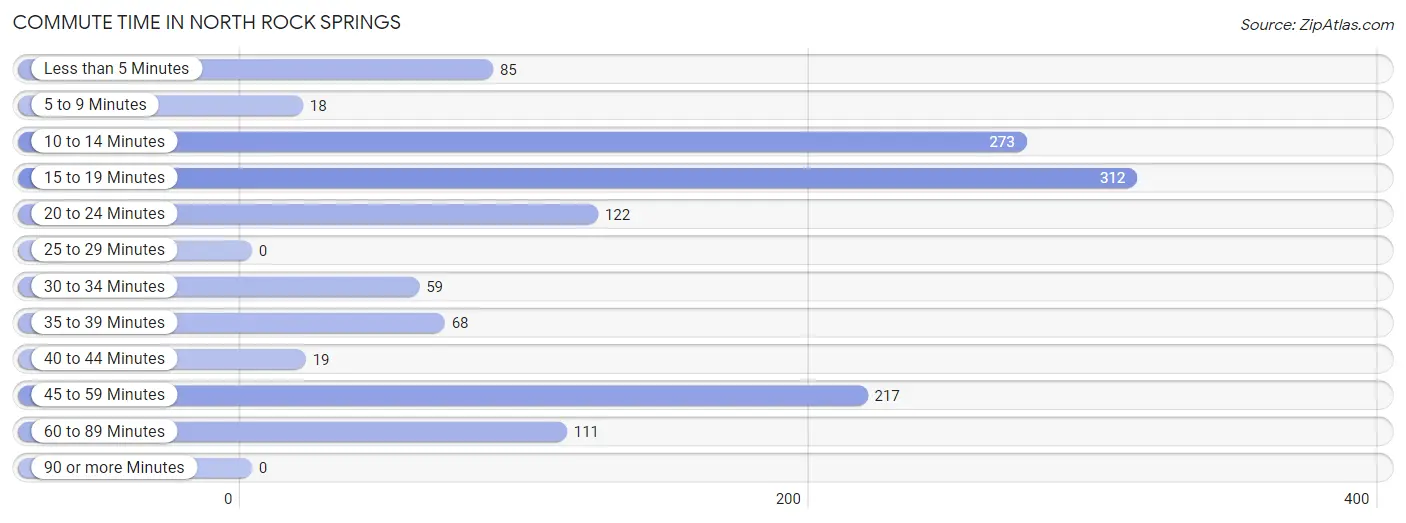
| Commute Time | # Commuters | % Commuters |
| Less than 5 Minutes | 85 | 6.6% |
| 5 to 9 Minutes | 18 | 1.4% |
| 10 to 14 Minutes | 273 | 21.3% |
| 15 to 19 Minutes | 312 | 24.3% |
| 20 to 24 Minutes | 122 | 9.5% |
| 25 to 29 Minutes | 0 | 0.0% |
| 30 to 34 Minutes | 59 | 4.6% |
| 35 to 39 Minutes | 68 | 5.3% |
| 40 to 44 Minutes | 19 | 1.5% |
| 45 to 59 Minutes | 217 | 16.9% |
| 60 to 89 Minutes | 111 | 8.6% |
| 90 or more Minutes | 0 | 0.0% |
Commute Time by Sex in North Rock Springs
The most common commute times in North Rock Springs are 45 to 59 minutes (178 commuters, 24.5%) for males and 10 to 14 minutes (230 commuters, 41.2%) for females.
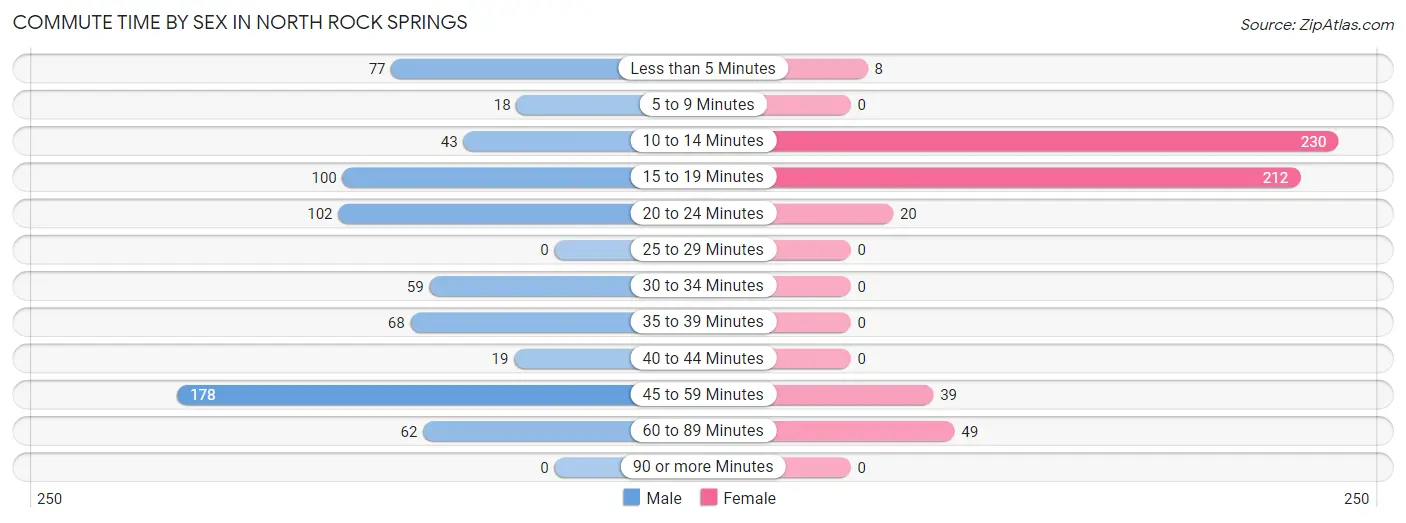
| Commute Time | Male | Female |
| Less than 5 Minutes | 77 (10.6%) | 8 (1.4%) |
| 5 to 9 Minutes | 18 (2.5%) | 0 (0.0%) |
| 10 to 14 Minutes | 43 (5.9%) | 230 (41.2%) |
| 15 to 19 Minutes | 100 (13.8%) | 212 (38.0%) |
| 20 to 24 Minutes | 102 (14.1%) | 20 (3.6%) |
| 25 to 29 Minutes | 0 (0.0%) | 0 (0.0%) |
| 30 to 34 Minutes | 59 (8.1%) | 0 (0.0%) |
| 35 to 39 Minutes | 68 (9.4%) | 0 (0.0%) |
| 40 to 44 Minutes | 19 (2.6%) | 0 (0.0%) |
| 45 to 59 Minutes | 178 (24.5%) | 39 (7.0%) |
| 60 to 89 Minutes | 62 (8.5%) | 49 (8.8%) |
| 90 or more Minutes | 0 (0.0%) | 0 (0.0%) |
Time of Departure to Work by Sex in North Rock Springs
The most frequent times of departure to work in North Rock Springs are 5:30 AM to 5:59 AM (170, 23.4%) for males and 7:00 AM to 7:29 AM (203, 36.4%) for females.
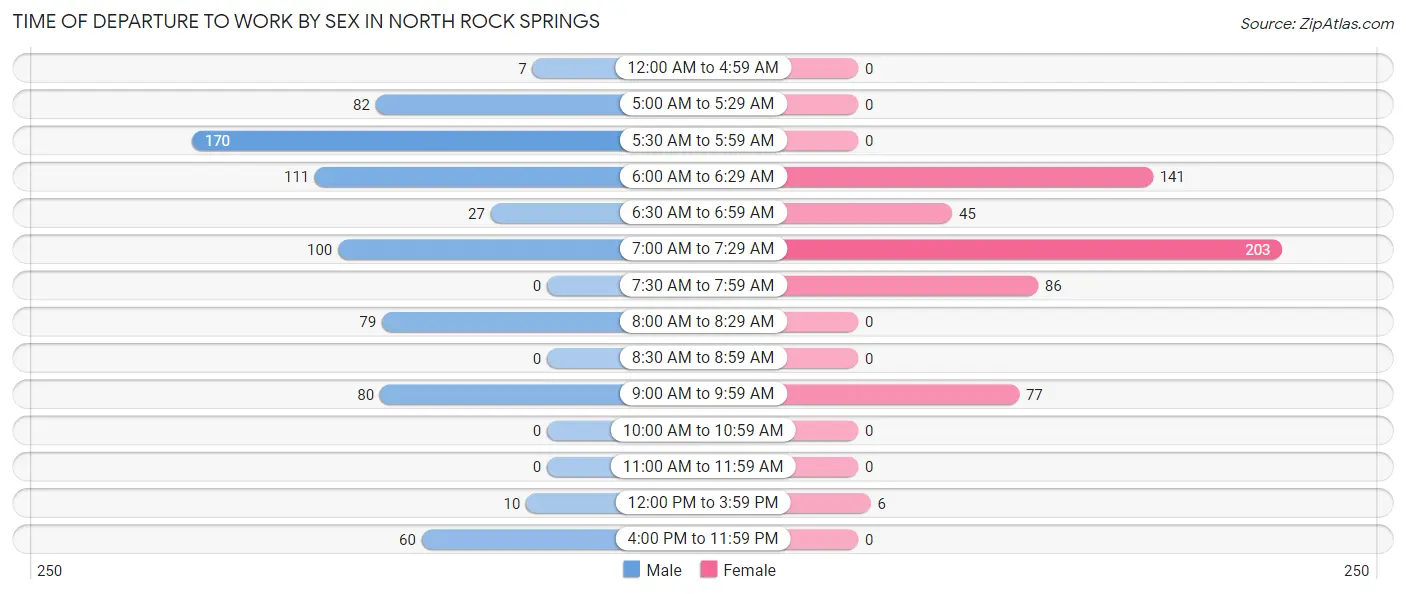
| Time of Departure | Male | Female |
| 12:00 AM to 4:59 AM | 7 (1.0%) | 0 (0.0%) |
| 5:00 AM to 5:29 AM | 82 (11.3%) | 0 (0.0%) |
| 5:30 AM to 5:59 AM | 170 (23.4%) | 0 (0.0%) |
| 6:00 AM to 6:29 AM | 111 (15.3%) | 141 (25.3%) |
| 6:30 AM to 6:59 AM | 27 (3.7%) | 45 (8.1%) |
| 7:00 AM to 7:29 AM | 100 (13.8%) | 203 (36.4%) |
| 7:30 AM to 7:59 AM | 0 (0.0%) | 86 (15.4%) |
| 8:00 AM to 8:29 AM | 79 (10.9%) | 0 (0.0%) |
| 8:30 AM to 8:59 AM | 0 (0.0%) | 0 (0.0%) |
| 9:00 AM to 9:59 AM | 80 (11.0%) | 77 (13.8%) |
| 10:00 AM to 10:59 AM | 0 (0.0%) | 0 (0.0%) |
| 11:00 AM to 11:59 AM | 0 (0.0%) | 0 (0.0%) |
| 12:00 PM to 3:59 PM | 10 (1.4%) | 6 (1.1%) |
| 4:00 PM to 11:59 PM | 60 (8.3%) | 0 (0.0%) |
| Total | 726 (100.0%) | 558 (100.0%) |
Housing Occupancy in North Rock Springs
Occupancy by Ownership in North Rock Springs
Of the total 1,090 dwellings in North Rock Springs, owner-occupied units account for 967 (88.7%), while renter-occupied units make up 123 (11.3%).
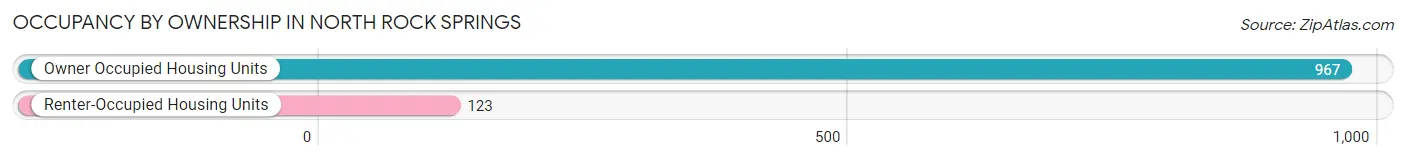
| Occupancy | # Housing Units | % Housing Units |
| Owner Occupied Housing Units | 967 | 88.7% |
| Renter-Occupied Housing Units | 123 | 11.3% |
| Total Occupied Housing Units | 1,090 | 100.0% |
Occupancy by Household Size in North Rock Springs
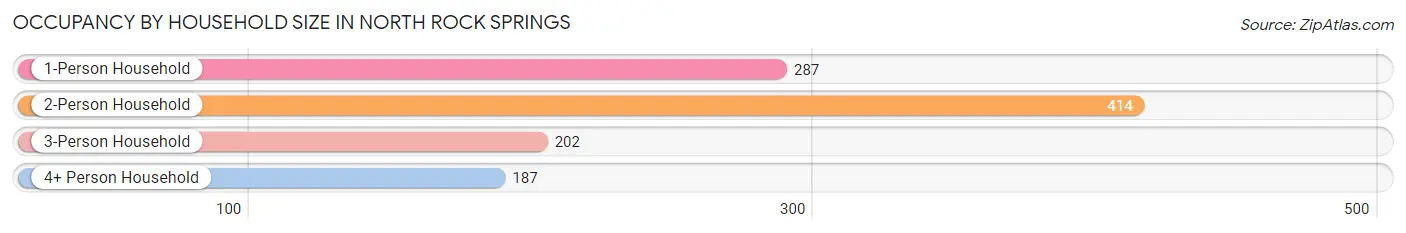
| Household Size | # Housing Units | % Housing Units |
| 1-Person Household | 287 | 26.3% |
| 2-Person Household | 414 | 38.0% |
| 3-Person Household | 202 | 18.5% |
| 4+ Person Household | 187 | 17.2% |
| Total Housing Units | 1,090 | 100.0% |
Occupancy by Ownership by Household Size in North Rock Springs
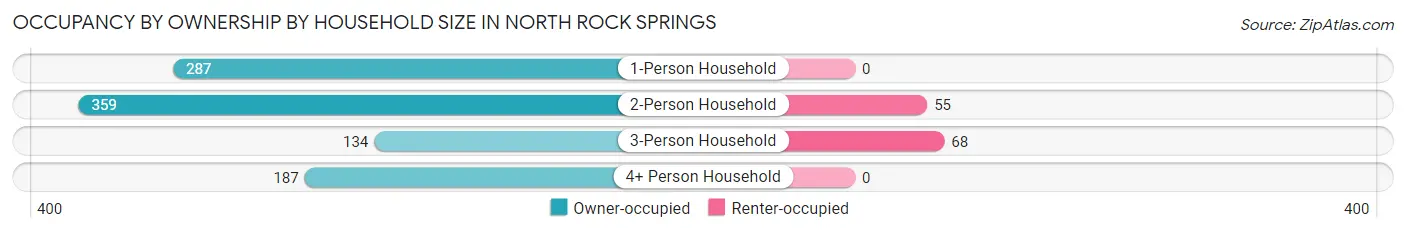
| Household Size | Owner-occupied | Renter-occupied |
| 1-Person Household | 287 (100.0%) | 0 (0.0%) |
| 2-Person Household | 359 (86.7%) | 55 (13.3%) |
| 3-Person Household | 134 (66.3%) | 68 (33.7%) |
| 4+ Person Household | 187 (100.0%) | 0 (0.0%) |
| Total Housing Units | 967 (88.7%) | 123 (11.3%) |
Occupancy by Educational Attainment in North Rock Springs
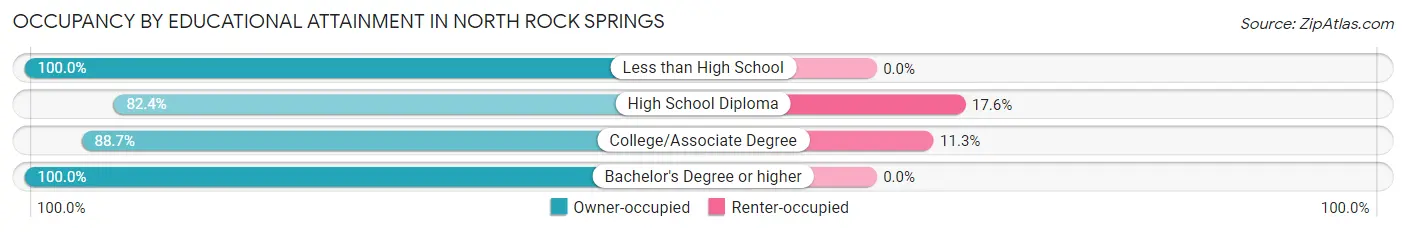
| Household Size | Owner-occupied | Renter-occupied |
| Less than High School | 49 (100.0%) | 0 (0.0%) |
| High School Diploma | 332 (82.4%) | 71 (17.6%) |
| College/Associate Degree | 408 (88.7%) | 52 (11.3%) |
| Bachelor's Degree or higher | 178 (100.0%) | 0 (0.0%) |
Occupancy by Age of Householder in North Rock Springs
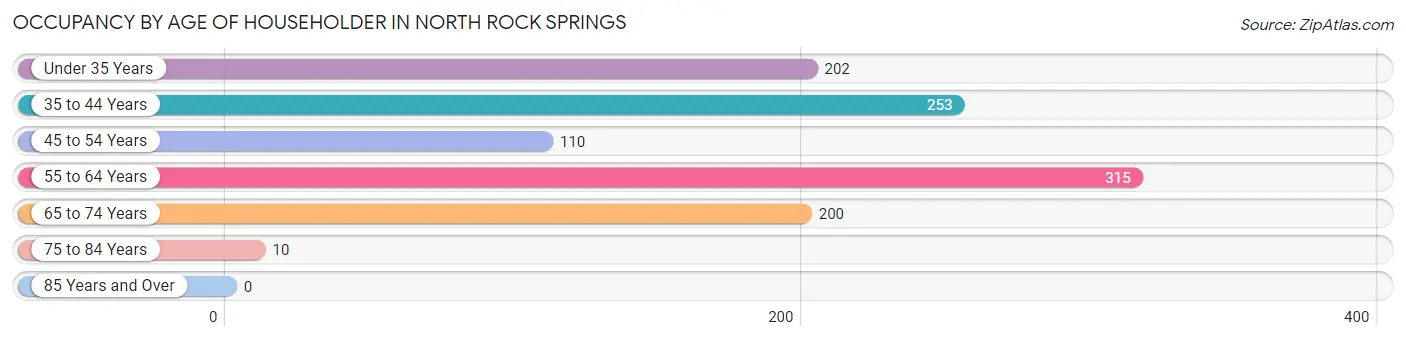
| Age Bracket | # Households | % Households |
| Under 35 Years | 202 | 18.5% |
| 35 to 44 Years | 253 | 23.2% |
| 45 to 54 Years | 110 | 10.1% |
| 55 to 64 Years | 315 | 28.9% |
| 65 to 74 Years | 200 | 18.3% |
| 75 to 84 Years | 10 | 0.9% |
| 85 Years and Over | 0 | 0.0% |
| Total | 1,090 | 100.0% |
Housing Finances in North Rock Springs
Median Income by Occupancy in North Rock Springs
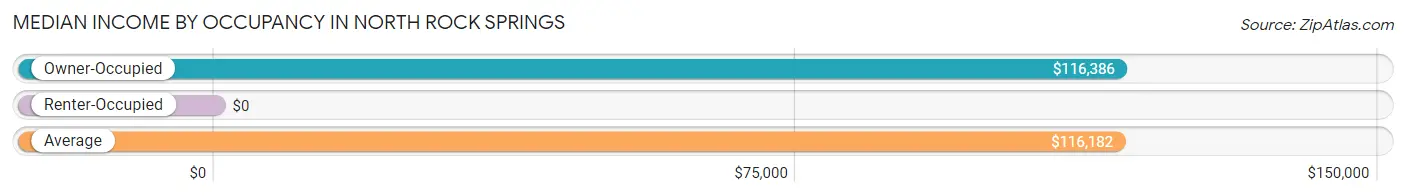
| Occupancy Type | # Households | Median Income |
| Owner-Occupied | 967 (88.7%) | $116,386 |
| Renter-Occupied | 123 (11.3%) | $0 |
| Average | 1,090 (100.0%) | $116,182 |
Occupancy by Householder Income Bracket in North Rock Springs
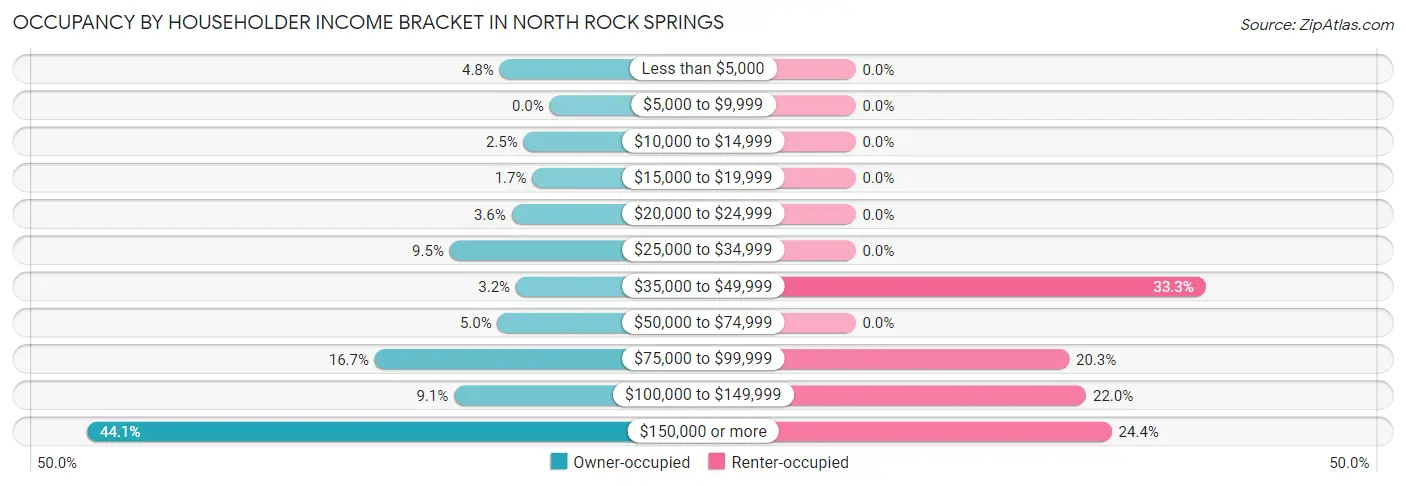
| Income Bracket | Owner-occupied | Renter-occupied |
| Less than $5,000 | 46 (4.8%) | 0 (0.0%) |
| $5,000 to $9,999 | 0 (0.0%) | 0 (0.0%) |
| $10,000 to $14,999 | 24 (2.5%) | 0 (0.0%) |
| $15,000 to $19,999 | 16 (1.7%) | 0 (0.0%) |
| $20,000 to $24,999 | 35 (3.6%) | 0 (0.0%) |
| $25,000 to $34,999 | 92 (9.5%) | 0 (0.0%) |
| $35,000 to $49,999 | 31 (3.2%) | 41 (33.3%) |
| $50,000 to $74,999 | 48 (5.0%) | 0 (0.0%) |
| $75,000 to $99,999 | 161 (16.7%) | 25 (20.3%) |
| $100,000 to $149,999 | 88 (9.1%) | 27 (22.0%) |
| $150,000 or more | 426 (44.1%) | 30 (24.4%) |
| Total | 967 (100.0%) | 123 (100.0%) |
Monthly Housing Cost Tiers in North Rock Springs
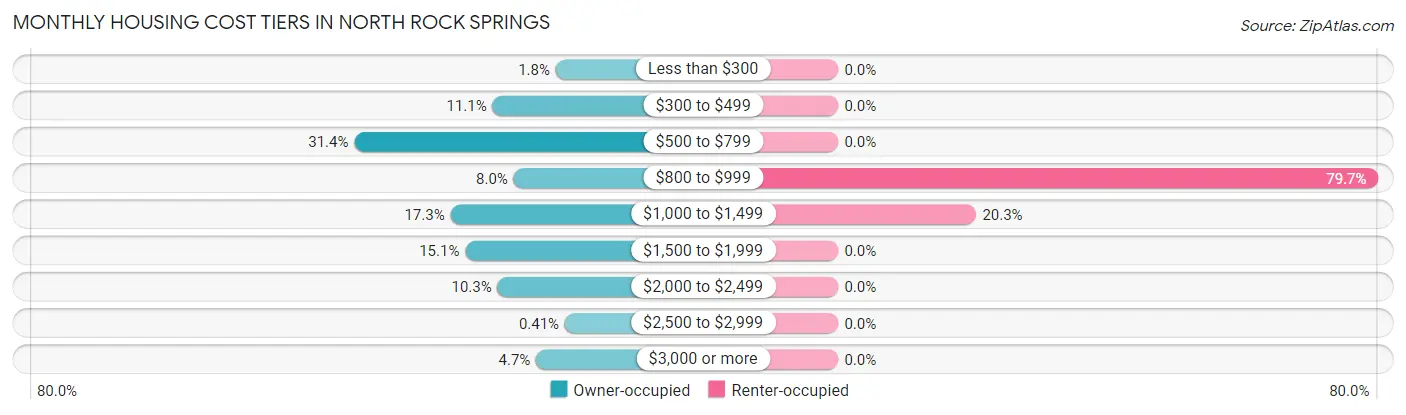
| Monthly Cost | Owner-occupied | Renter-occupied |
| Less than $300 | 17 (1.8%) | 0 (0.0%) |
| $300 to $499 | 107 (11.1%) | 0 (0.0%) |
| $500 to $799 | 304 (31.4%) | 0 (0.0%) |
| $800 to $999 | 77 (8.0%) | 98 (79.7%) |
| $1,000 to $1,499 | 167 (17.3%) | 25 (20.3%) |
| $1,500 to $1,999 | 146 (15.1%) | 0 (0.0%) |
| $2,000 to $2,499 | 100 (10.3%) | 0 (0.0%) |
| $2,500 to $2,999 | 4 (0.4%) | 0 (0.0%) |
| $3,000 or more | 45 (4.6%) | 0 (0.0%) |
| Total | 967 (100.0%) | 123 (100.0%) |
Physical Housing Characteristics in North Rock Springs
Housing Structures in North Rock Springs
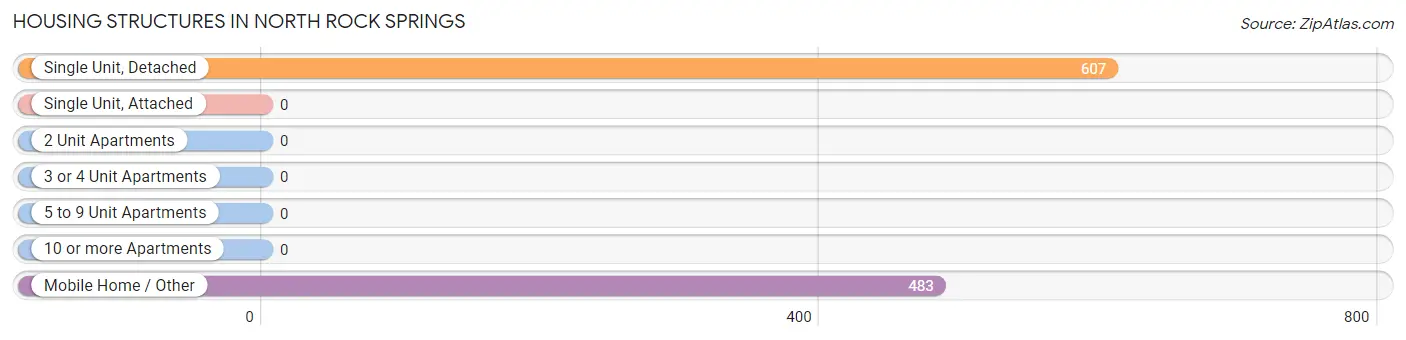
| Structure Type | # Housing Units | % Housing Units |
| Single Unit, Detached | 607 | 55.7% |
| Single Unit, Attached | 0 | 0.0% |
| 2 Unit Apartments | 0 | 0.0% |
| 3 or 4 Unit Apartments | 0 | 0.0% |
| 5 to 9 Unit Apartments | 0 | 0.0% |
| 10 or more Apartments | 0 | 0.0% |
| Mobile Home / Other | 483 | 44.3% |
| Total | 1,090 | 100.0% |
Housing Structures by Occupancy in North Rock Springs
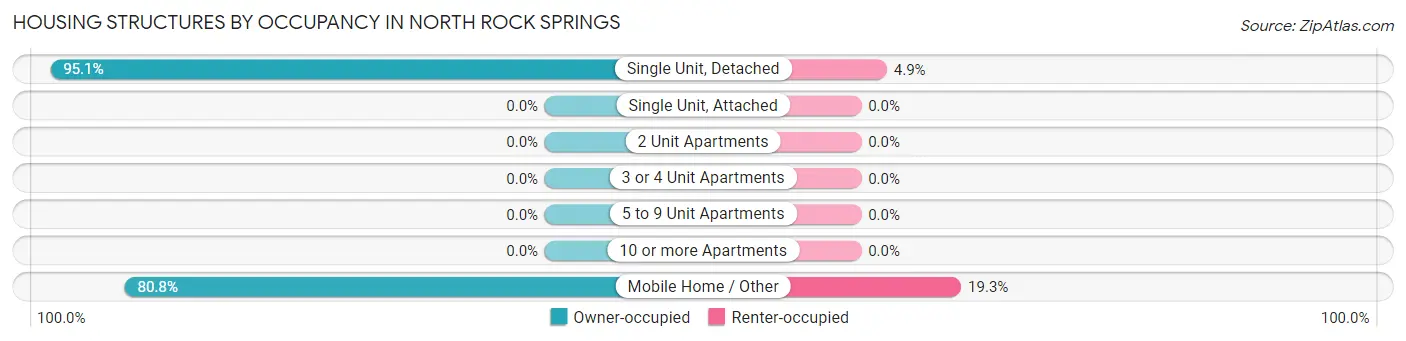
| Structure Type | Owner-occupied | Renter-occupied |
| Single Unit, Detached | 577 (95.1%) | 30 (4.9%) |
| Single Unit, Attached | 0 (0.0%) | 0 (0.0%) |
| 2 Unit Apartments | 0 (0.0%) | 0 (0.0%) |
| 3 or 4 Unit Apartments | 0 (0.0%) | 0 (0.0%) |
| 5 to 9 Unit Apartments | 0 (0.0%) | 0 (0.0%) |
| 10 or more Apartments | 0 (0.0%) | 0 (0.0%) |
| Mobile Home / Other | 390 (80.7%) | 93 (19.3%) |
| Total | 967 (88.7%) | 123 (11.3%) |
Housing Structures by Number of Rooms in North Rock Springs
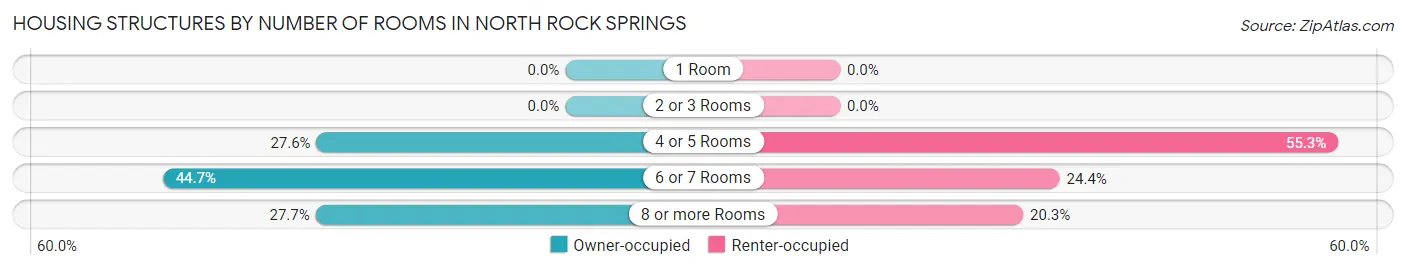
| Number of Rooms | Owner-occupied | Renter-occupied |
| 1 Room | 0 (0.0%) | 0 (0.0%) |
| 2 or 3 Rooms | 0 (0.0%) | 0 (0.0%) |
| 4 or 5 Rooms | 267 (27.6%) | 68 (55.3%) |
| 6 or 7 Rooms | 432 (44.7%) | 30 (24.4%) |
| 8 or more Rooms | 268 (27.7%) | 25 (20.3%) |
| Total | 967 (100.0%) | 123 (100.0%) |
Housing Structure by Heating Type in North Rock Springs
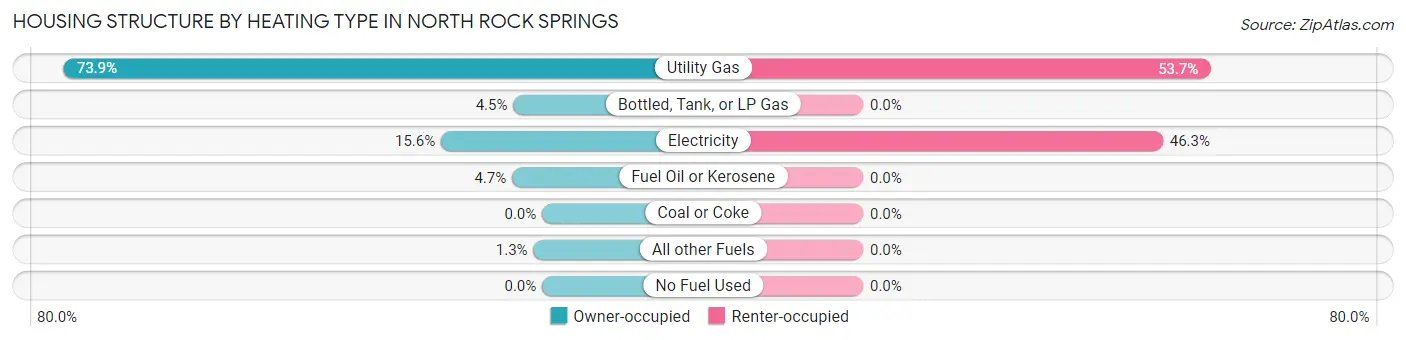
| Heating Type | Owner-occupied | Renter-occupied |
| Utility Gas | 715 (73.9%) | 66 (53.7%) |
| Bottled, Tank, or LP Gas | 43 (4.4%) | 0 (0.0%) |
| Electricity | 151 (15.6%) | 57 (46.3%) |
| Fuel Oil or Kerosene | 45 (4.6%) | 0 (0.0%) |
| Coal or Coke | 0 (0.0%) | 0 (0.0%) |
| All other Fuels | 13 (1.3%) | 0 (0.0%) |
| No Fuel Used | 0 (0.0%) | 0 (0.0%) |
| Total | 967 (100.0%) | 123 (100.0%) |
Household Vehicle Usage in North Rock Springs
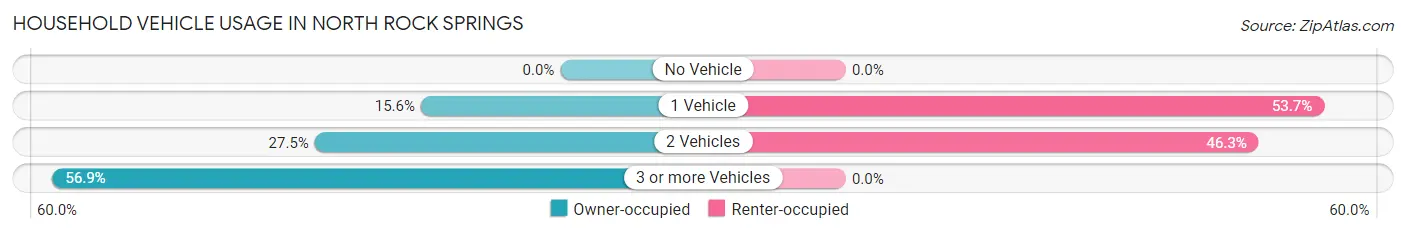
| Vehicles per Household | Owner-occupied | Renter-occupied |
| No Vehicle | 0 (0.0%) | 0 (0.0%) |
| 1 Vehicle | 151 (15.6%) | 66 (53.7%) |
| 2 Vehicles | 266 (27.5%) | 57 (46.3%) |
| 3 or more Vehicles | 550 (56.9%) | 0 (0.0%) |
| Total | 967 (100.0%) | 123 (100.0%) |
Real Estate & Mortgages in North Rock Springs
Real Estate and Mortgage Overview in North Rock Springs
| Characteristic | Without Mortgage | With Mortgage |
| Housing Units | 494 | 473 |
| Median Property Value | $243,200 | $349,100 |
| Median Household Income | $78,854 | $313 |
| Monthly Housing Costs | $606 | $45 |
| Real Estate Taxes | - | - |
Property Value by Mortgage Status in North Rock Springs
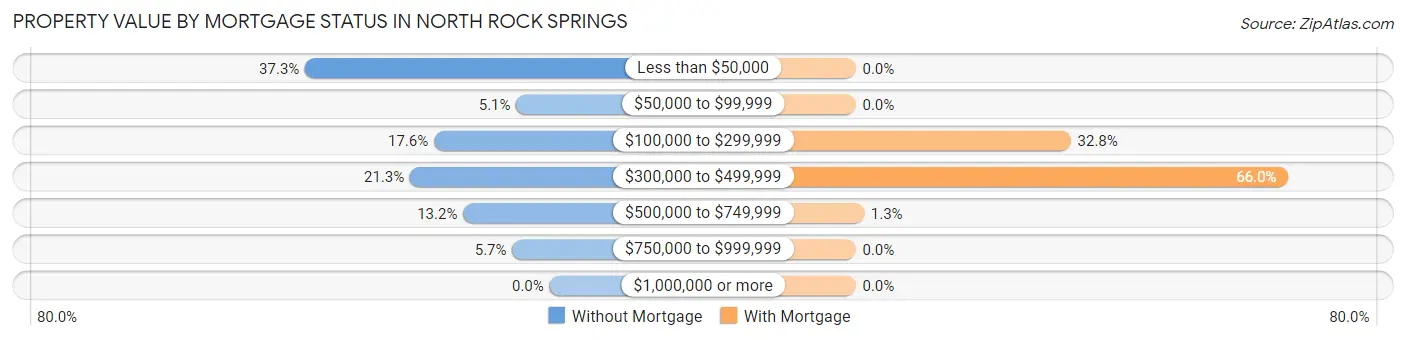
| Property Value | Without Mortgage | With Mortgage |
| Less than $50,000 | 184 (37.2%) | 0 (0.0%) |
| $50,000 to $99,999 | 25 (5.1%) | 0 (0.0%) |
| $100,000 to $299,999 | 87 (17.6%) | 155 (32.8%) |
| $300,000 to $499,999 | 105 (21.3%) | 312 (66.0%) |
| $500,000 to $749,999 | 65 (13.2%) | 6 (1.3%) |
| $750,000 to $999,999 | 28 (5.7%) | 0 (0.0%) |
| $1,000,000 or more | 0 (0.0%) | 0 (0.0%) |
| Total | 494 (100.0%) | 473 (100.0%) |
Household Income by Mortgage Status in North Rock Springs
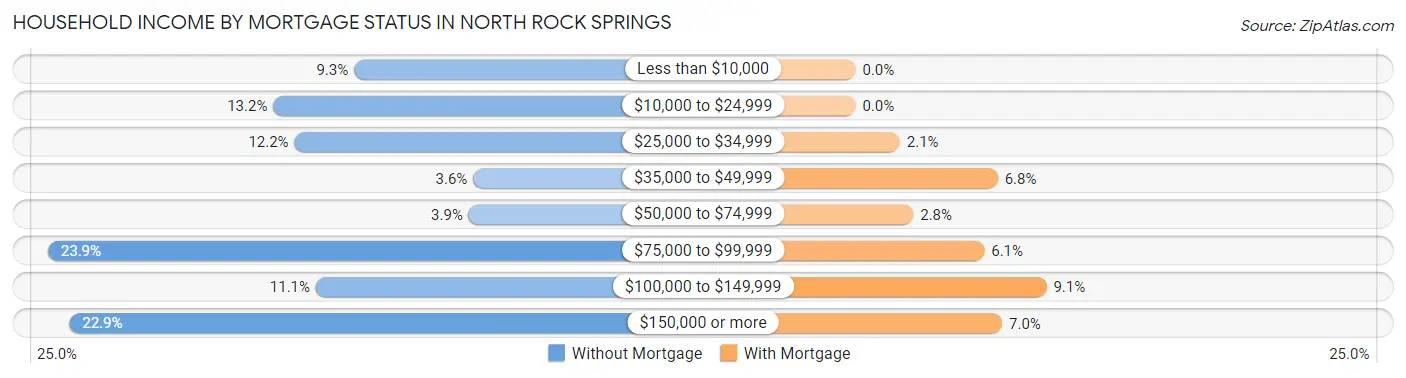
| Household Income | Without Mortgage | With Mortgage |
| Less than $10,000 | 46 (9.3%) | 0 (0.0%) |
| $10,000 to $24,999 | 65 (13.2%) | 0 (0.0%) |
| $25,000 to $34,999 | 60 (12.1%) | 10 (2.1%) |
| $35,000 to $49,999 | 18 (3.6%) | 32 (6.8%) |
| $50,000 to $74,999 | 19 (3.8%) | 13 (2.8%) |
| $75,000 to $99,999 | 118 (23.9%) | 29 (6.1%) |
| $100,000 to $149,999 | 55 (11.1%) | 43 (9.1%) |
| $150,000 or more | 113 (22.9%) | 33 (7.0%) |
| Total | 494 (100.0%) | 473 (100.0%) |
Property Value to Household Income Ratio in North Rock Springs
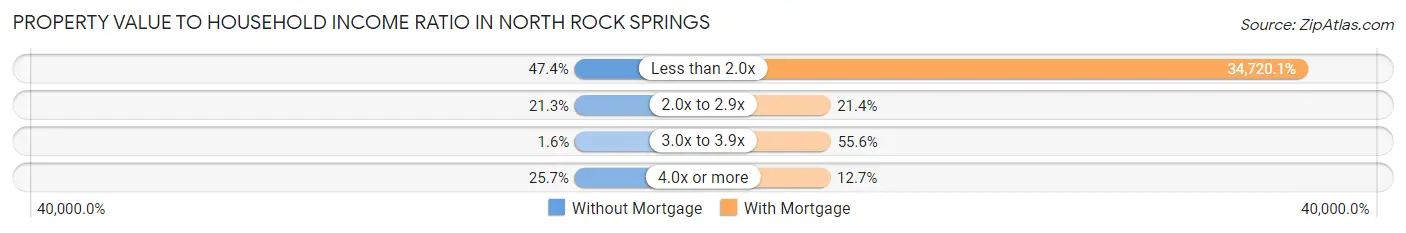
| Value-to-Income Ratio | Without Mortgage | With Mortgage |
| Less than 2.0x | 234 (47.4%) | 164,226 (34,720.1%) |
| 2.0x to 2.9x | 105 (21.3%) | 101 (21.3%) |
| 3.0x to 3.9x | 8 (1.6%) | 263 (55.6%) |
| 4.0x or more | 127 (25.7%) | 60 (12.7%) |
| Total | 494 (100.0%) | 473 (100.0%) |
Real Estate Taxes by Mortgage Status in North Rock Springs
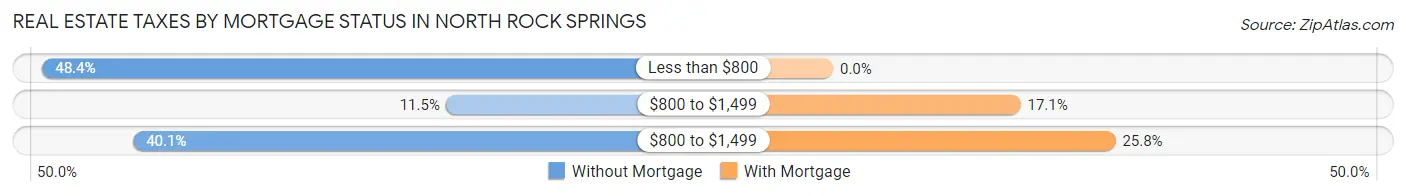
| Property Taxes | Without Mortgage | With Mortgage |
| Less than $800 | 239 (48.4%) | 0 (0.0%) |
| $800 to $1,499 | 57 (11.5%) | 81 (17.1%) |
| $800 to $1,499 | 198 (40.1%) | 122 (25.8%) |
| Total | 494 (100.0%) | 473 (100.0%) |
Health & Disability in North Rock Springs
Health Insurance Coverage by Age in North Rock Springs
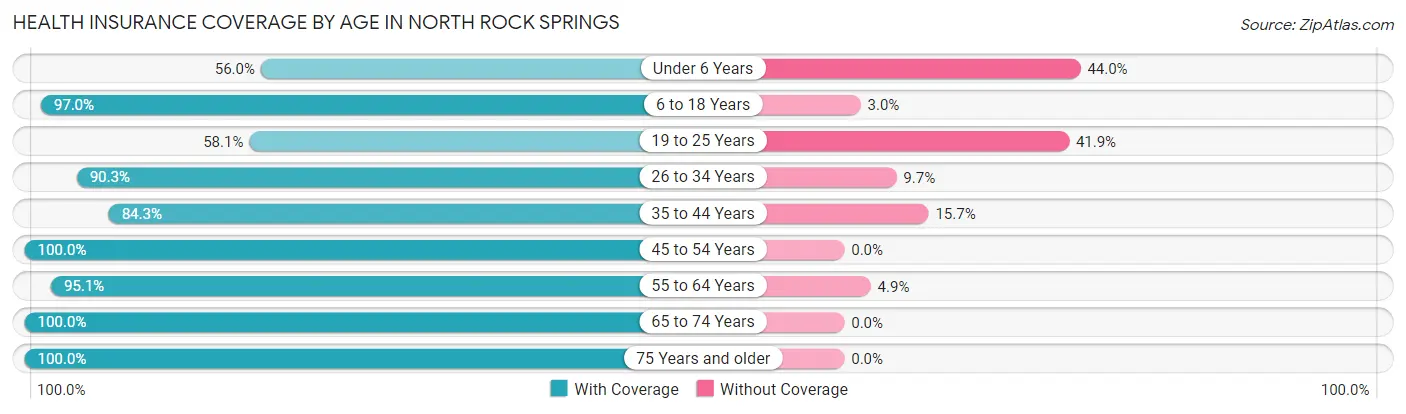
| Age Bracket | With Coverage | Without Coverage |
| Under 6 Years | 61 (56.0%) | 48 (44.0%) |
| 6 to 18 Years | 351 (97.0%) | 11 (3.0%) |
| 19 to 25 Years | 154 (58.1%) | 111 (41.9%) |
| 26 to 34 Years | 260 (90.3%) | 28 (9.7%) |
| 35 to 44 Years | 349 (84.3%) | 65 (15.7%) |
| 45 to 54 Years | 289 (100.0%) | 0 (0.0%) |
| 55 to 64 Years | 464 (95.1%) | 24 (4.9%) |
| 65 to 74 Years | 293 (100.0%) | 0 (0.0%) |
| 75 Years and older | 21 (100.0%) | 0 (0.0%) |
| Total | 2,242 (88.6%) | 287 (11.4%) |
Health Insurance Coverage by Citizenship Status in North Rock Springs
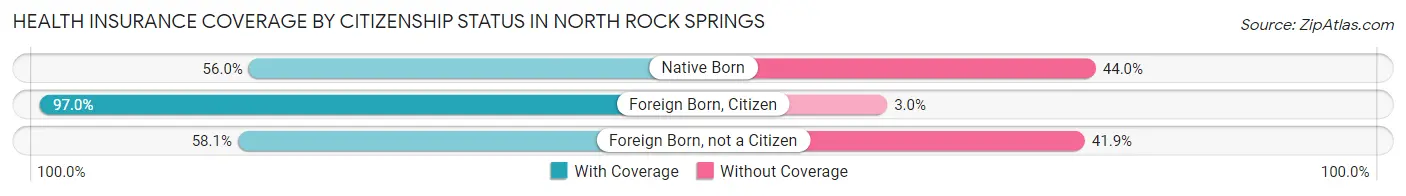
| Citizenship Status | With Coverage | Without Coverage |
| Native Born | 61 (56.0%) | 48 (44.0%) |
| Foreign Born, Citizen | 351 (97.0%) | 11 (3.0%) |
| Foreign Born, not a Citizen | 154 (58.1%) | 111 (41.9%) |
Health Insurance Coverage by Household Income in North Rock Springs
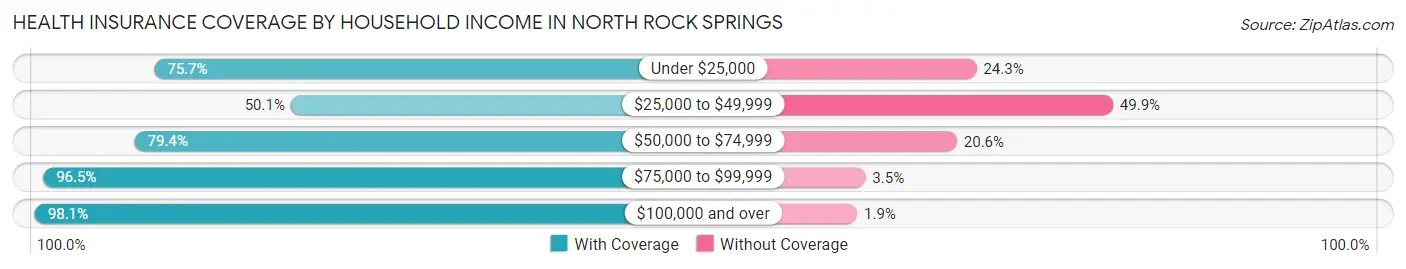
| Household Income | With Coverage | Without Coverage |
| Under $25,000 | 162 (75.7%) | 52 (24.3%) |
| $25,000 to $49,999 | 175 (50.1%) | 174 (49.9%) |
| $50,000 to $74,999 | 77 (79.4%) | 20 (20.6%) |
| $75,000 to $99,999 | 304 (96.5%) | 11 (3.5%) |
| $100,000 and over | 1,521 (98.1%) | 30 (1.9%) |
Public vs Private Health Insurance Coverage by Age in North Rock Springs
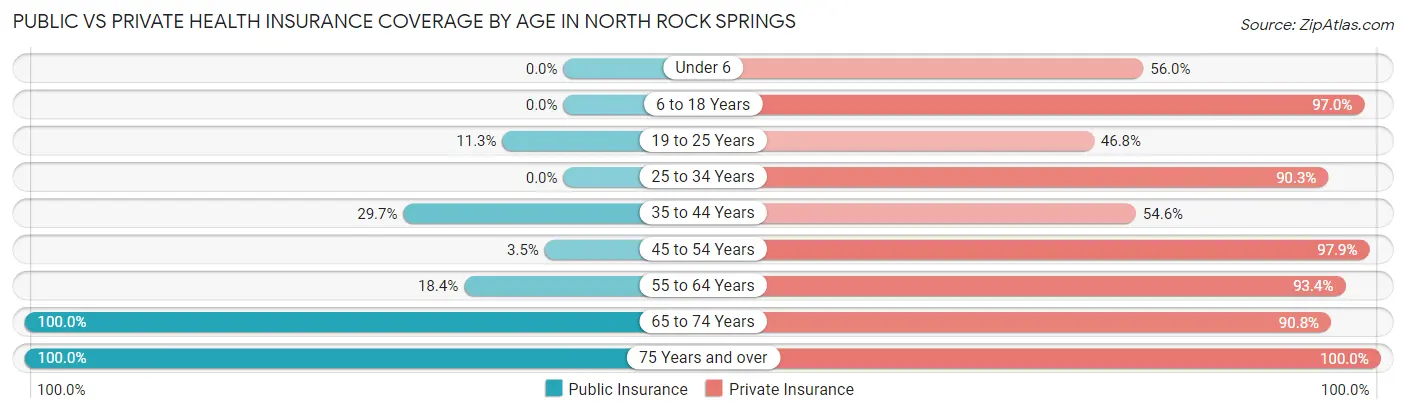
| Age Bracket | Public Insurance | Private Insurance |
| Under 6 | 0 (0.0%) | 61 (56.0%) |
| 6 to 18 Years | 0 (0.0%) | 351 (97.0%) |
| 19 to 25 Years | 30 (11.3%) | 124 (46.8%) |
| 25 to 34 Years | 0 (0.0%) | 260 (90.3%) |
| 35 to 44 Years | 123 (29.7%) | 226 (54.6%) |
| 45 to 54 Years | 10 (3.5%) | 283 (97.9%) |
| 55 to 64 Years | 90 (18.4%) | 456 (93.4%) |
| 65 to 74 Years | 293 (100.0%) | 266 (90.8%) |
| 75 Years and over | 21 (100.0%) | 21 (100.0%) |
| Total | 567 (22.4%) | 2,048 (81.0%) |
Disability Status by Sex by Age in North Rock Springs
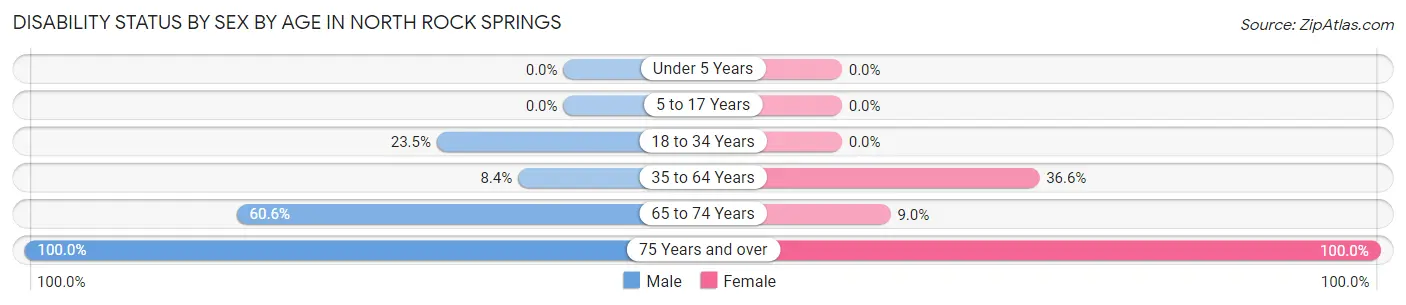
| Age Bracket | Male | Female |
| Under 5 Years | 0 (0.0%) | 0 (0.0%) |
| 5 to 17 Years | 0 (0.0%) | 0 (0.0%) |
| 18 to 34 Years | 70 (23.5%) | 0 (0.0%) |
| 35 to 64 Years | 56 (8.4%) | 192 (36.6%) |
| 65 to 74 Years | 77 (60.6%) | 15 (9.0%) |
| 75 Years and over | 11 (100.0%) | 10 (100.0%) |
Disability Class by Sex by Age in North Rock Springs
Disability Class: Hearing Difficulty
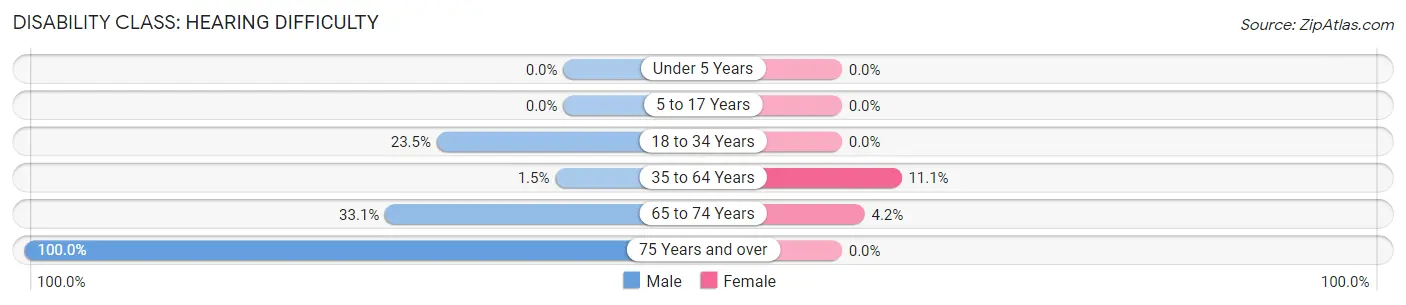
| Age Bracket | Male | Female |
| Under 5 Years | 0 (0.0%) | 0 (0.0%) |
| 5 to 17 Years | 0 (0.0%) | 0 (0.0%) |
| 18 to 34 Years | 70 (23.5%) | 0 (0.0%) |
| 35 to 64 Years | 10 (1.5%) | 58 (11.1%) |
| 65 to 74 Years | 42 (33.1%) | 7 (4.2%) |
| 75 Years and over | 11 (100.0%) | 0 (0.0%) |
Disability Class: Vision Difficulty
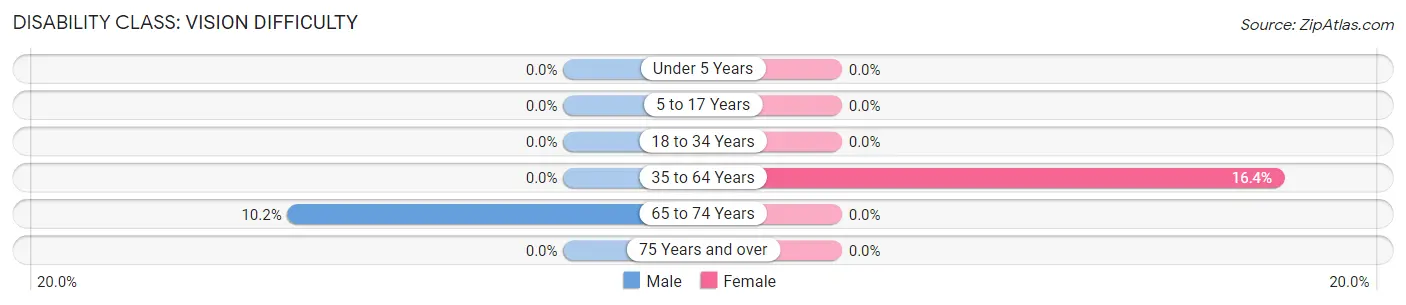
| Age Bracket | Male | Female |
| Under 5 Years | 0 (0.0%) | 0 (0.0%) |
| 5 to 17 Years | 0 (0.0%) | 0 (0.0%) |
| 18 to 34 Years | 0 (0.0%) | 0 (0.0%) |
| 35 to 64 Years | 0 (0.0%) | 86 (16.4%) |
| 65 to 74 Years | 13 (10.2%) | 0 (0.0%) |
| 75 Years and over | 0 (0.0%) | 0 (0.0%) |
Disability Class: Cognitive Difficulty
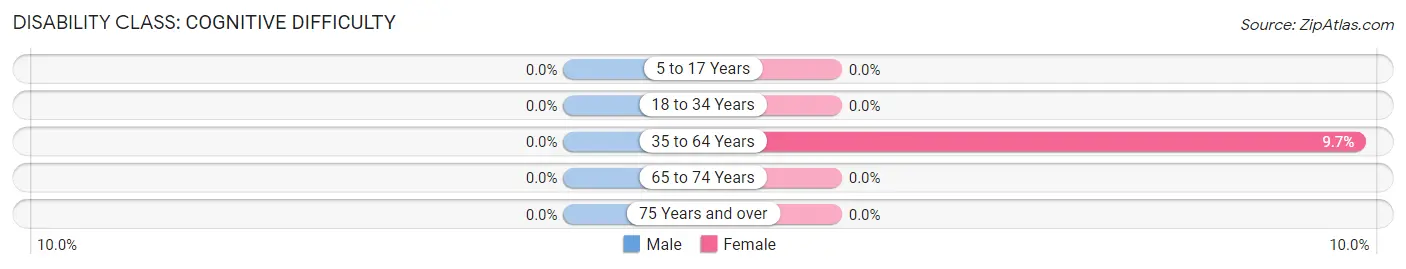
| Age Bracket | Male | Female |
| 5 to 17 Years | 0 (0.0%) | 0 (0.0%) |
| 18 to 34 Years | 0 (0.0%) | 0 (0.0%) |
| 35 to 64 Years | 0 (0.0%) | 51 (9.7%) |
| 65 to 74 Years | 0 (0.0%) | 0 (0.0%) |
| 75 Years and over | 0 (0.0%) | 0 (0.0%) |
Disability Class: Ambulatory Difficulty
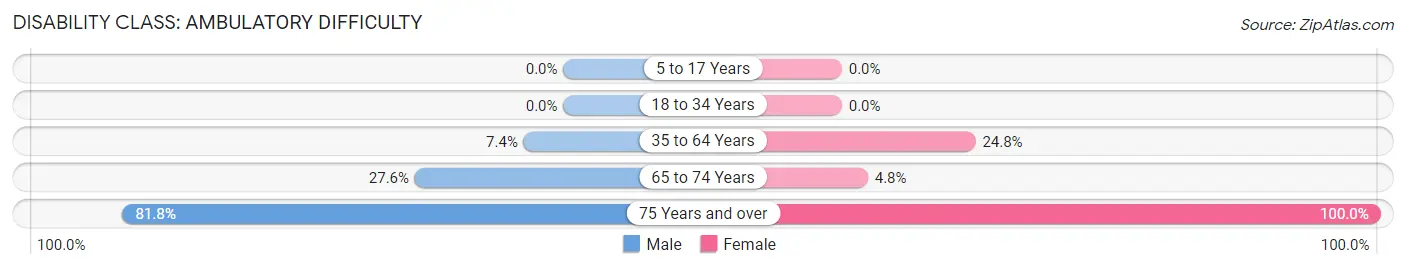
| Age Bracket | Male | Female |
| 5 to 17 Years | 0 (0.0%) | 0 (0.0%) |
| 18 to 34 Years | 0 (0.0%) | 0 (0.0%) |
| 35 to 64 Years | 49 (7.3%) | 130 (24.8%) |
| 65 to 74 Years | 35 (27.6%) | 8 (4.8%) |
| 75 Years and over | 9 (81.8%) | 10 (100.0%) |
Disability Class: Self-Care Difficulty
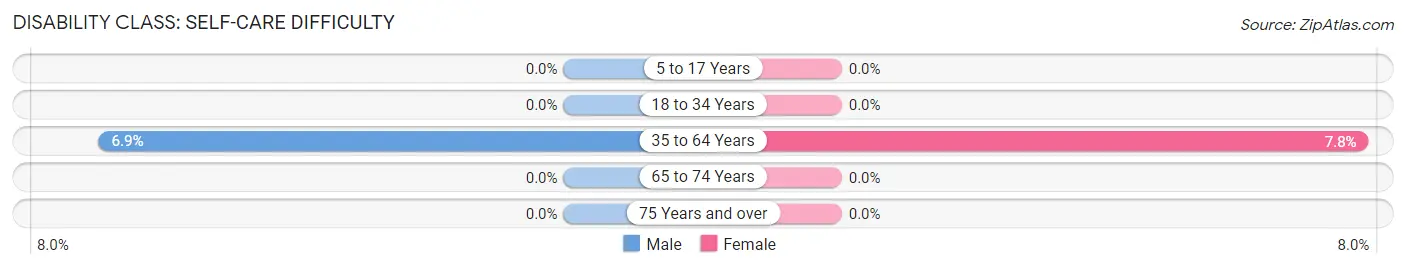
| Age Bracket | Male | Female |
| 5 to 17 Years | 0 (0.0%) | 0 (0.0%) |
| 18 to 34 Years | 0 (0.0%) | 0 (0.0%) |
| 35 to 64 Years | 46 (6.9%) | 41 (7.8%) |
| 65 to 74 Years | 0 (0.0%) | 0 (0.0%) |
| 75 Years and over | 0 (0.0%) | 0 (0.0%) |
Technology Access in North Rock Springs
Computing Device Access in North Rock Springs
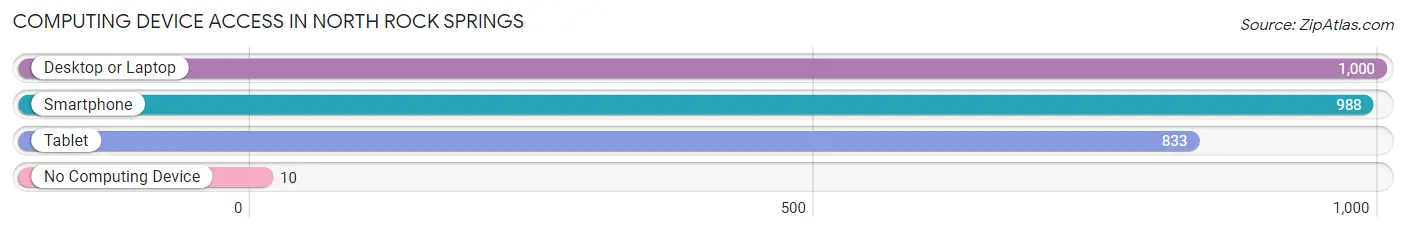
| Device Type | # Households | % Households |
| Desktop or Laptop | 1,000 | 91.7% |
| Smartphone | 988 | 90.6% |
| Tablet | 833 | 76.4% |
| No Computing Device | 10 | 0.9% |
| Total | 1,090 | 100.0% |
Internet Access in North Rock Springs
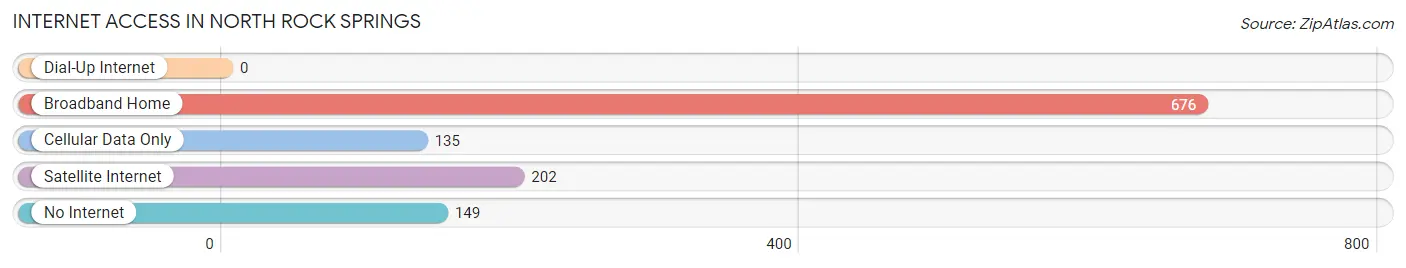
| Internet Type | # Households | % Households |
| Dial-Up Internet | 0 | 0.0% |
| Broadband Home | 676 | 62.0% |
| Cellular Data Only | 135 | 12.4% |
| Satellite Internet | 202 | 18.5% |
| No Internet | 149 | 13.7% |
| Total | 1,090 | 100.0% |
North Rock Springs Summary
Rock Springs, Wyoming is a city located in Sweetwater County, Wyoming, United States. The population was 23,036 at the 2010 census, making it the fifth largest city in the state. Rock Springs is the principal city of the Rock Springs micropolitan statistical area, which has a population of 37,975.
History
Rock Springs was established in 1868 as a railroad town. The Union Pacific Coal Department was created to supply coal to the railroad and the town quickly grew. The town was named after the nearby springs, which were named by the early French-Canadian trappers for the flint rocks found near the springs.
The town quickly grew and by 1885, it had a population of over 3,000. The town was incorporated in 1888 and by 1890, the population had grown to over 5,000.
In the early 1900s, Rock Springs was a major center for coal mining. The Union Pacific Coal Company employed over 2,000 miners and produced over 2 million tons of coal each year. The coal industry was the main source of employment and income for the town.
In the late 1950s, the coal industry began to decline and the town's population began to decline as well. By the 1970s, the population had dropped to around 10,000.
Geography
Rock Springs is located in the southwestern part of Wyoming at the intersection of Interstate 80 and US Route 191. The city is located in the Green River Basin, which is part of the Great Basin. The city is surrounded by the Red Desert to the north and the Wyoming Range to the south.
The city has a total area of 16.2 square miles, of which 16.1 square miles is land and 0.1 square miles is water.
Economy
Rock Springs is the economic center of Sweetwater County. The city is home to several major employers, including the Union Pacific Railroad, the Wyoming Department of Transportation, and the Rock Springs-Sweetwater County Airport.
The city is also home to several major industries, including oil and gas production, coal mining, and tourism. The city is also home to several major retail stores, including Walmart, Target, and Home Depot.
Demographics
As of the 2010 census, there were 23,036 people, 8,845 households, and 5,845 families residing in the city. The population density was 1,427.3 people per square mile. The racial makeup of the city was 87.3% White, 0.7% African American, 0.9% Native American, 0.7% Asian, 0.1% Pacific Islander, 8.2% from other races, and 2.2% from two or more races. Hispanic or Latino of any race were 20.2% of the population.
The median income for a household in the city was $41,945, and the median income for a family was $50,945. The per capita income for the city was $20,945. About 11.2% of families and 14.3% of the population were below the poverty line, including 19.2% of those under age 18 and 8.2% of those age 65 or over.
Conclusion
Rock Springs, Wyoming is a city located in Sweetwater County, Wyoming, United States. The city has a rich history, with its roots in the coal mining industry. The city is now home to several major employers, including the Union Pacific Railroad, the Wyoming Department of Transportation, and the Rock Springs-Sweetwater County Airport. The city also has a diverse economy, with industries such as oil and gas production, coal mining, and tourism. The population of Rock Springs is 23,036, with a median household income of $41,945 and a median family income of $50,945.
Common Questions
What is Per Capita Income in North Rock Springs?
Per Capita income in North Rock Springs is $51,074.
What is the Median Family Income in North Rock Springs?
Median Family Income in North Rock Springs is $153,488.
What is the Median Household income in North Rock Springs?
Median Household Income in North Rock Springs is $116,182.
What is Income or Wage Gap in North Rock Springs?
Income or Wage Gap in North Rock Springs is 71.7%.
Women in North Rock Springs earn 28.3 cents for every dollar earned by a man.
What is Inequality or Gini Index in North Rock Springs?
Inequality or Gini Index in North Rock Springs is 0.37.
What is the Total Population of North Rock Springs?
Total Population of North Rock Springs is 2,529.
What is the Total Male Population of North Rock Springs?
Total Male Population of North Rock Springs is 1,372.
What is the Total Female Population of North Rock Springs?
Total Female Population of North Rock Springs is 1,157.
What is the Ratio of Males per 100 Females in North Rock Springs?
There are 118.58 Males per 100 Females in North Rock Springs.
What is the Ratio of Females per 100 Males in North Rock Springs?
There are 84.33 Females per 100 Males in North Rock Springs.
What is the Median Population Age in North Rock Springs?
Median Population Age in North Rock Springs is 40.2 Years.
What is the Average Family Size in North Rock Springs
Average Family Size in North Rock Springs is 2.8 People.
What is the Average Household Size in North Rock Springs
Average Household Size in North Rock Springs is 2.3 People.
How Large is the Labor Force in North Rock Springs?
There are 1,524 People in the Labor Forcein in North Rock Springs.
What is the Percentage of People in the Labor Force in North Rock Springs?
70.6% of People are in the Labor Force in North Rock Springs.
What is the Unemployment Rate in North Rock Springs?
Unemployment Rate in North Rock Springs is 4.3%.