Newcastle, WY Map & Demographics
Newcastle Map
Newcastle Overview
$30,038
PER CAPITA INCOME
$74,718
AVG FAMILY INCOME
$71,597
AVG HOUSEHOLD INCOME
34.4%
WAGE / INCOME GAP [ % ]
65.6¢/ $1
WAGE / INCOME GAP [ $ ]
$9,757
FAMILY INCOME DEFICIT
0.43
INEQUALITY / GINI INDEX
3,380
TOTAL POPULATION
1,838
MALE POPULATION
1,542
FEMALE POPULATION
119.20
MALES / 100 FEMALES
83.90
FEMALES / 100 MALES
35.3
MEDIAN AGE
3.4
AVG FAMILY SIZE
3.0
AVG HOUSEHOLD SIZE
1,493
LABOR FORCE [ PEOPLE ]
55.0%
PERCENT IN LABOR FORCE
2.7%
UNEMPLOYMENT RATE
Newcastle Zip Codes
Newcastle Area Codes
Income in Newcastle
Income Overview in Newcastle
Per Capita Income in Newcastle is $30,038, while median incomes of families and households are $74,718 and $71,597 respectively.
| Characteristic | Number | Measure |
| Per Capita Income | 3,380 | $30,038 |
| Median Family Income | 695 | $74,718 |
| Mean Family Income | 695 | $100,290 |
| Median Household Income | 1,028 | $71,597 |
| Mean Household Income | 1,028 | $88,973 |
| Income Deficit | 695 | $9,757 |
| Wage / Income Gap (%) | 3,380 | 34.41% |
| Wage / Income Gap ($) | 3,380 | 65.59¢ per $1 |
| Gini / Inequality Index | 3,380 | 0.43 |
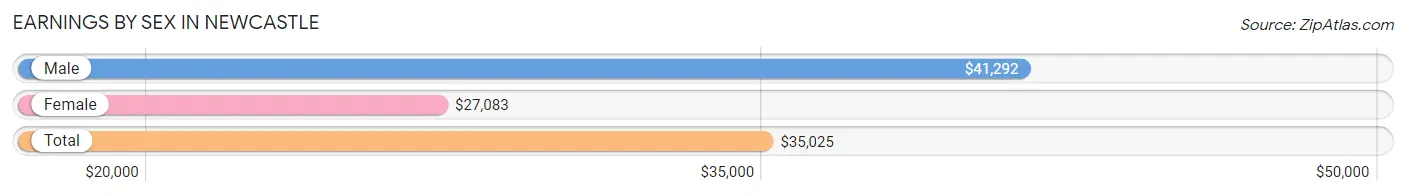
Earnings by Sex in Newcastle
Average Earnings in Newcastle are $35,025, $41,292 for men and $27,083 for women, a difference of 34.4%.
| Sex | Number | Average Earnings |
| Male | 963 (56.1%) | $41,292 |
| Female | 754 (43.9%) | $27,083 |
| Total | 1,717 (100.0%) | $35,025 |
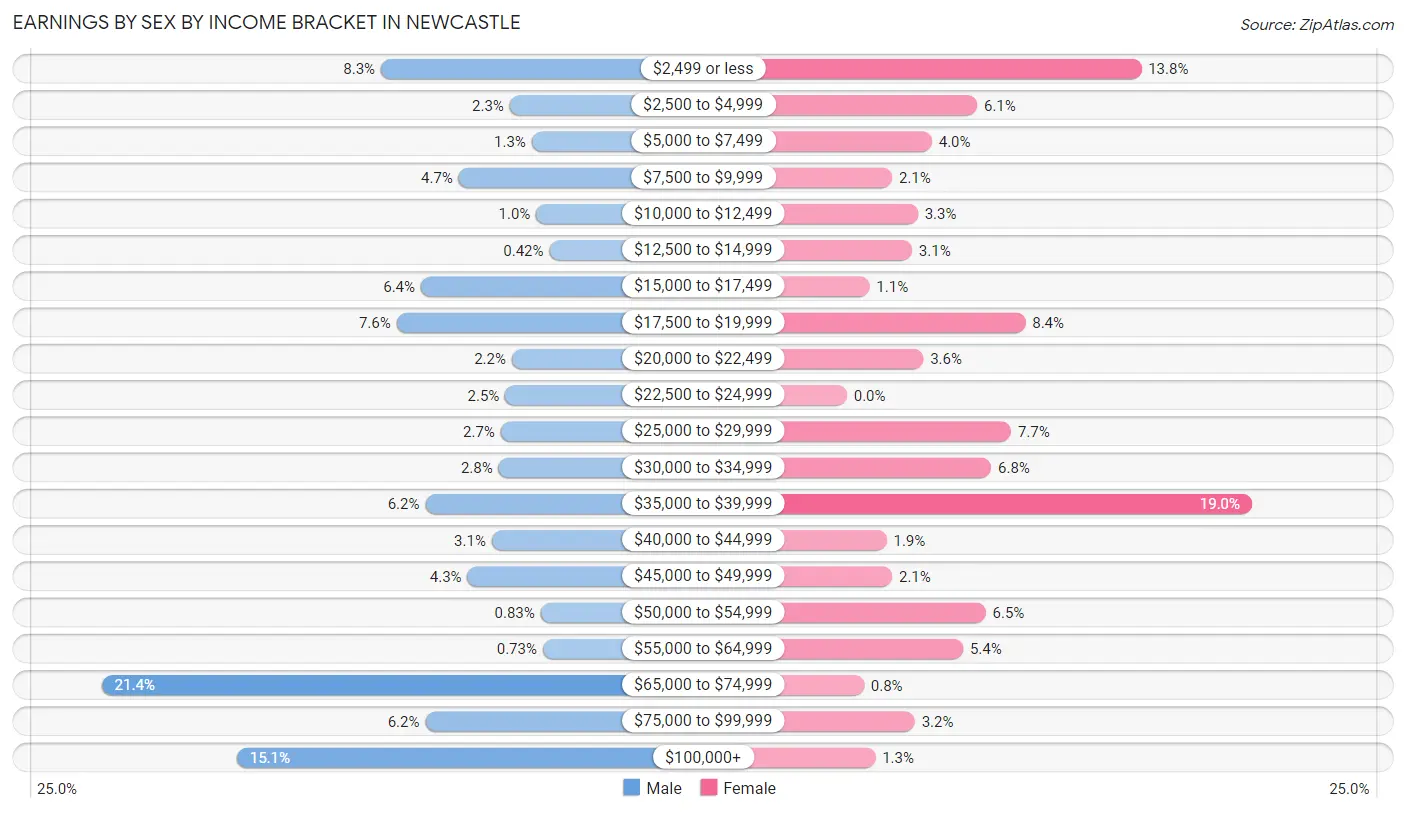
Earnings by Sex by Income Bracket in Newcastle
The most common earnings brackets in Newcastle are $65,000 to $74,999 for men (206 | 21.4%) and $35,000 to $39,999 for women (143 | 19.0%).
| Income | Male | Female |
| $2,499 or less | 80 (8.3%) | 104 (13.8%) |
| $2,500 to $4,999 | 22 (2.3%) | 46 (6.1%) |
| $5,000 to $7,499 | 12 (1.3%) | 30 (4.0%) |
| $7,500 to $9,999 | 45 (4.7%) | 16 (2.1%) |
| $10,000 to $12,499 | 10 (1.0%) | 25 (3.3%) |
| $12,500 to $14,999 | 4 (0.4%) | 23 (3.0%) |
| $15,000 to $17,499 | 62 (6.4%) | 8 (1.1%) |
| $17,500 to $19,999 | 73 (7.6%) | 63 (8.4%) |
| $20,000 to $22,499 | 21 (2.2%) | 27 (3.6%) |
| $22,500 to $24,999 | 24 (2.5%) | 0 (0.0%) |
| $25,000 to $29,999 | 26 (2.7%) | 58 (7.7%) |
| $30,000 to $34,999 | 27 (2.8%) | 51 (6.8%) |
| $35,000 to $39,999 | 60 (6.2%) | 143 (19.0%) |
| $40,000 to $44,999 | 30 (3.1%) | 14 (1.9%) |
| $45,000 to $49,999 | 41 (4.3%) | 16 (2.1%) |
| $50,000 to $54,999 | 8 (0.8%) | 49 (6.5%) |
| $55,000 to $64,999 | 7 (0.7%) | 41 (5.4%) |
| $65,000 to $74,999 | 206 (21.4%) | 6 (0.8%) |
| $75,000 to $99,999 | 60 (6.2%) | 24 (3.2%) |
| $100,000+ | 145 (15.1%) | 10 (1.3%) |
| Total | 963 (100.0%) | 754 (100.0%) |
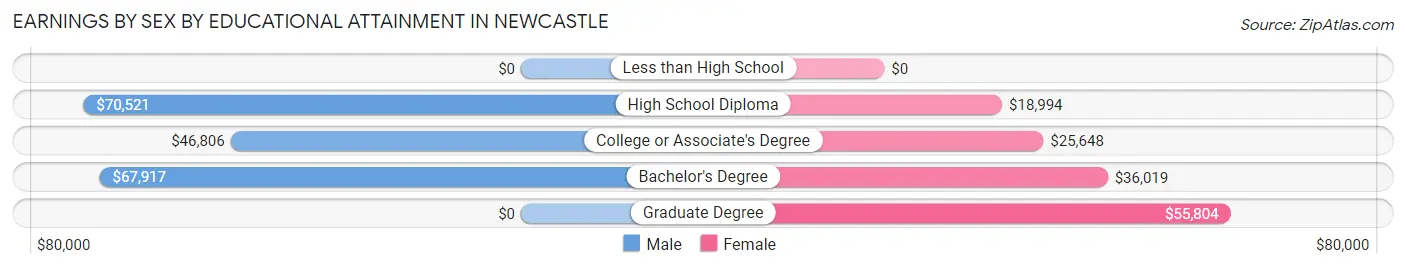
Earnings by Sex by Educational Attainment in Newcastle
Average earnings in Newcastle are $65,464 for men and $32,833 for women, a difference of 49.8%. Men with an educational attainment of high school diploma enjoy the highest average annual earnings of $70,521, while those with college or associate's degree education earn the least with $46,806. Women with an educational attainment of graduate degree earn the most with the average annual earnings of $55,804, while those with high school diploma education have the smallest earnings of $18,994.
| Educational Attainment | Male Income | Female Income |
| Less than High School | - | - |
| High School Diploma | $70,521 | $18,994 |
| College or Associate's Degree | $46,806 | $25,648 |
| Bachelor's Degree | $67,917 | $36,019 |
| Graduate Degree | - | - |
| Total | $65,464 | $32,833 |
Family Income in Newcastle
Family Income Brackets in Newcastle
According to the Newcastle family income data, there are 182 families falling into the $50,000 to $74,999 income range, which is the most common income bracket and makes up 26.2% of all families.
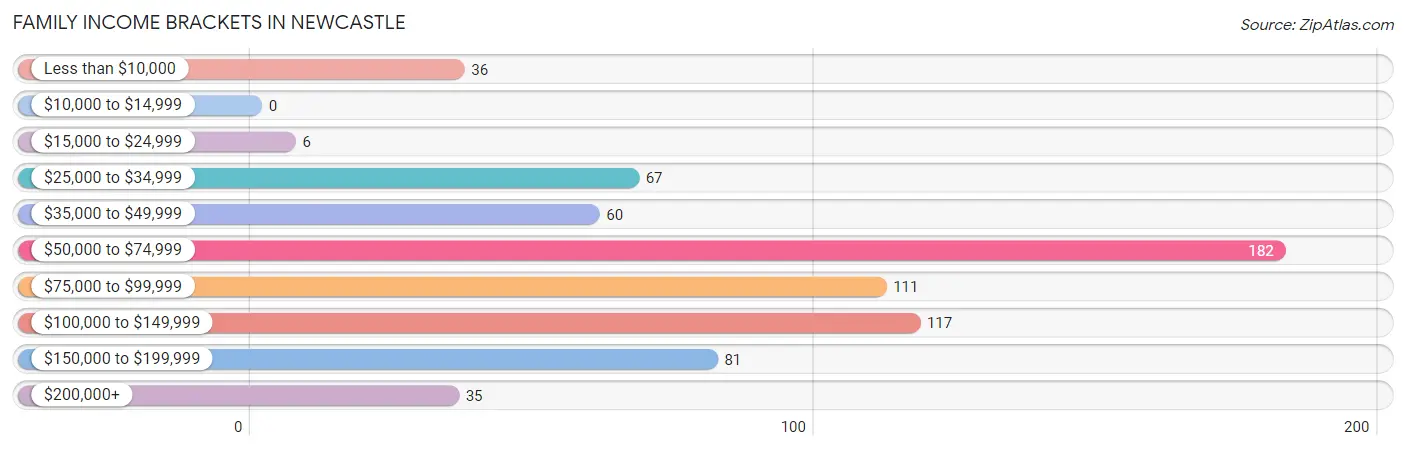
| Income Bracket | # Families | % Families |
| Less than $10,000 | 36 | 5.2% |
| $10,000 to $14,999 | 0 | 0.0% |
| $15,000 to $24,999 | 6 | 0.9% |
| $25,000 to $34,999 | 67 | 9.6% |
| $35,000 to $49,999 | 60 | 8.6% |
| $50,000 to $74,999 | 182 | 26.2% |
| $75,000 to $99,999 | 111 | 16.0% |
| $100,000 to $149,999 | 117 | 16.8% |
| $150,000 to $199,999 | 81 | 11.7% |
| $200,000+ | 35 | 5.0% |
Family Income by Famaliy Size in Newcastle
4-person families (114 | 16.4%) account for the highest median family income in Newcastle with $140,741 per family, while 2-person families (355 | 51.1%) have the highest median income of $36,794 per family member.
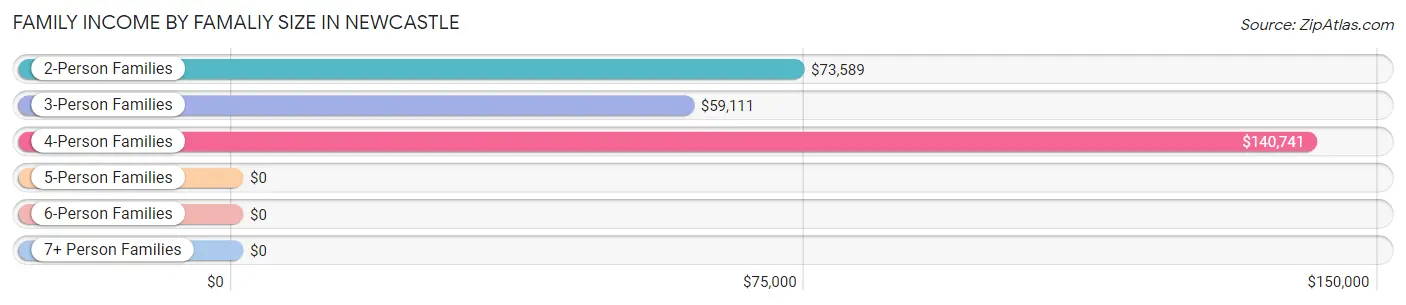
| Income Bracket | # Families | Median Income |
| 2-Person Families | 355 (51.1%) | $73,589 |
| 3-Person Families | 164 (23.6%) | $59,111 |
| 4-Person Families | 114 (16.4%) | $140,741 |
| 5-Person Families | 51 (7.3%) | $0 |
| 6-Person Families | 3 (0.4%) | $0 |
| 7+ Person Families | 8 (1.1%) | $0 |
| Total | 695 (100.0%) | $74,718 |
Family Income by Number of Earners in Newcastle
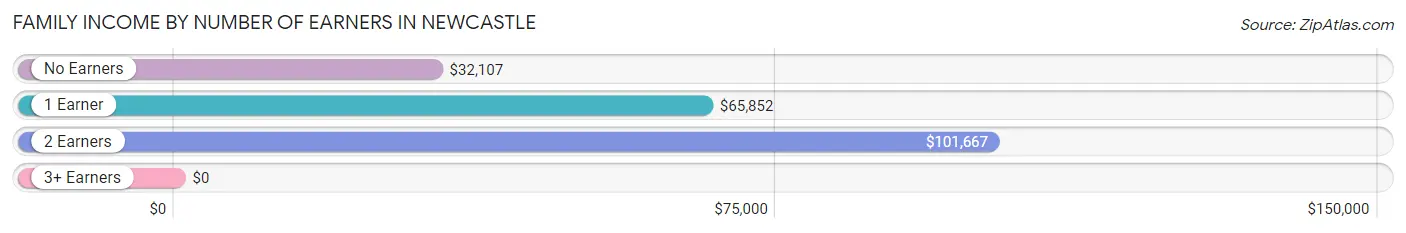
| Number of Earners | # Families | Median Income |
| No Earners | 131 (18.9%) | $32,107 |
| 1 Earner | 209 (30.1%) | $65,852 |
| 2 Earners | 322 (46.3%) | $101,667 |
| 3+ Earners | 33 (4.8%) | $0 |
| Total | 695 (100.0%) | $74,718 |
Household Income in Newcastle
Household Income Brackets in Newcastle
With 223 households falling in the category, the $100,000 to $149,999 income range is the most frequent in Newcastle, accounting for 21.7% of all households. In contrast, only 25 households (2.4%) fall into the $10,000 to $14,999 income bracket, making it the least populous group.
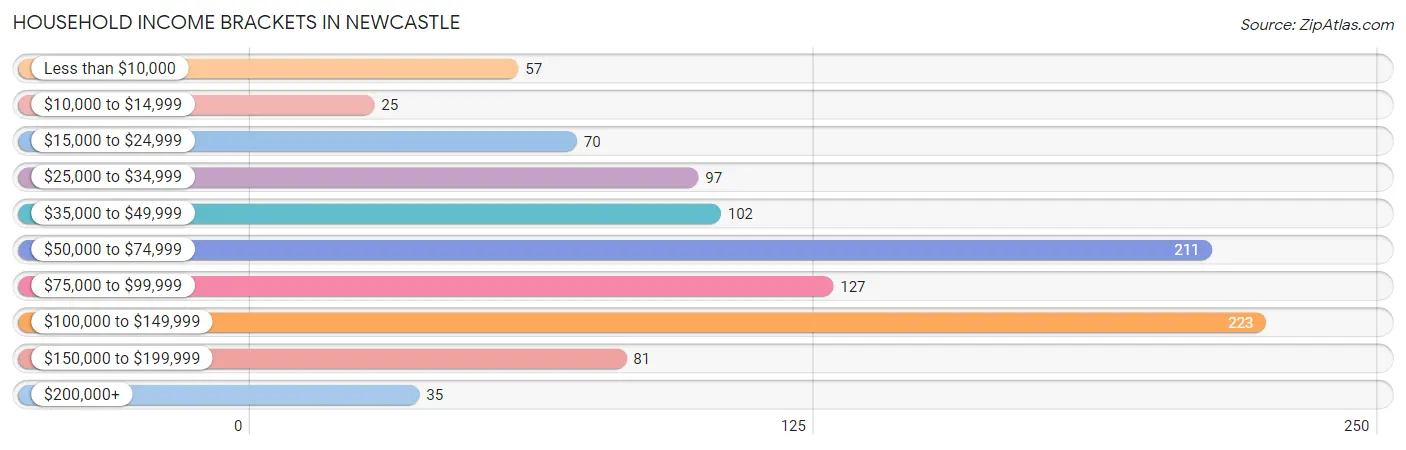
| Income Bracket | # Households | % Households |
| Less than $10,000 | 57 | 5.5% |
| $10,000 to $14,999 | 25 | 2.4% |
| $15,000 to $24,999 | 70 | 6.8% |
| $25,000 to $34,999 | 97 | 9.4% |
| $35,000 to $49,999 | 102 | 9.9% |
| $50,000 to $74,999 | 211 | 20.5% |
| $75,000 to $99,999 | 127 | 12.4% |
| $100,000 to $149,999 | 223 | 21.7% |
| $150,000 to $199,999 | 81 | 7.9% |
| $200,000+ | 35 | 3.4% |
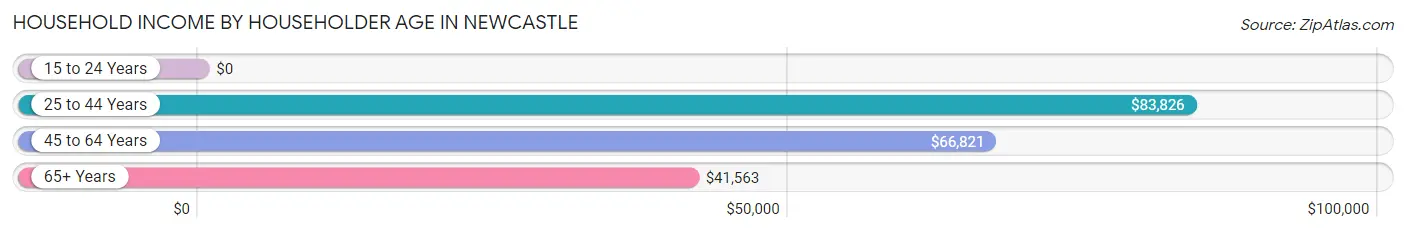
Household Income by Householder Age in Newcastle
The median household income in Newcastle is $71,597, with the highest median household income of $83,826 found in the 25 to 44 years age bracket for the primary householder. A total of 409 households (39.8%) fall into this category. Meanwhile, the 15 to 24 years age bracket for the primary householder has the lowest median household income of $0, with 28 households (2.7%) in this group.
| Income Bracket | # Households | Median Income |
| 15 to 24 Years | 28 (2.7%) | $0 |
| 25 to 44 Years | 409 (39.8%) | $83,826 |
| 45 to 64 Years | 317 (30.8%) | $66,821 |
| 65+ Years | 274 (26.7%) | $41,563 |
| Total | 1,028 (100.0%) | $71,597 |
Poverty in Newcastle
Income Below Poverty by Sex and Age in Newcastle
With 13.3% poverty level for males and 7.3% for females among the residents of Newcastle, 16 and 17 year old males and 75 year old and over females are the most vulnerable to poverty, with 58 males (63.7%) and 34 females (27.4%) in their respective age groups living below the poverty level.
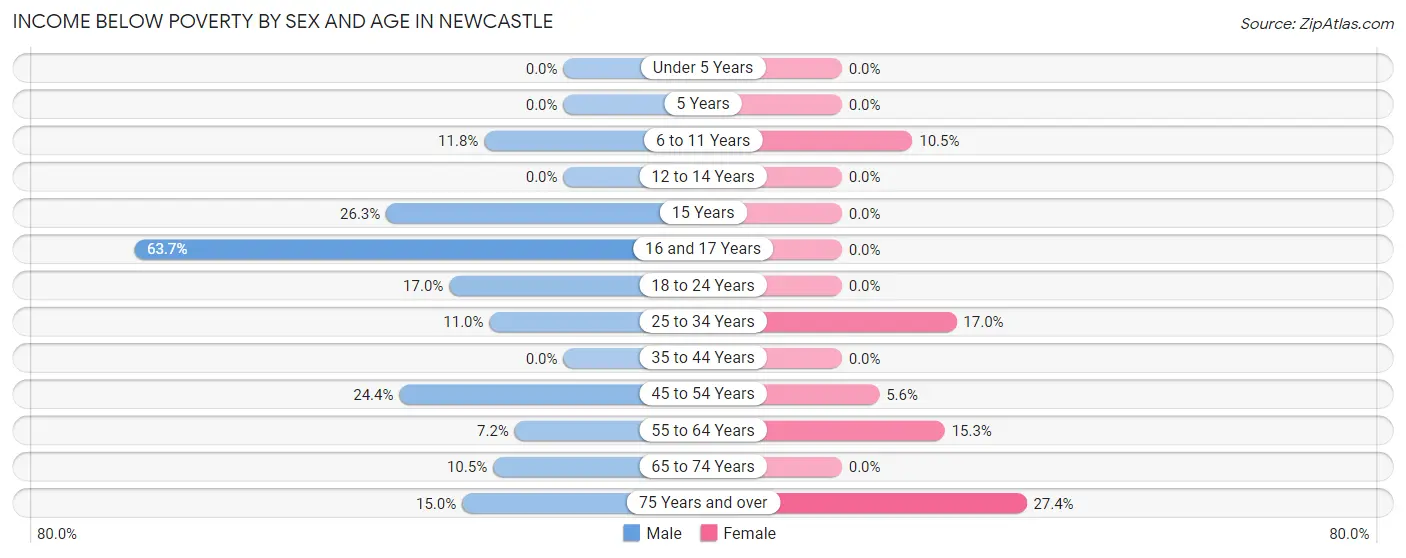
| Age Bracket | Male | Female |
| Under 5 Years | 0 (0.0%) | 0 (0.0%) |
| 5 Years | 0 (0.0%) | 0 (0.0%) |
| 6 to 11 Years | 16 (11.8%) | 9 (10.5%) |
| 12 to 14 Years | 0 (0.0%) | 0 (0.0%) |
| 15 Years | 10 (26.3%) | 0 (0.0%) |
| 16 and 17 Years | 58 (63.7%) | 0 (0.0%) |
| 18 to 24 Years | 39 (17.0%) | 0 (0.0%) |
| 25 to 34 Years | 21 (11.0%) | 32 (17.0%) |
| 35 to 44 Years | 0 (0.0%) | 0 (0.0%) |
| 45 to 54 Years | 19 (24.4%) | 8 (5.6%) |
| 55 to 64 Years | 12 (7.2%) | 22 (15.3%) |
| 65 to 74 Years | 7 (10.4%) | 0 (0.0%) |
| 75 Years and over | 17 (15.0%) | 34 (27.4%) |
| Total | 199 (13.3%) | 105 (7.3%) |
Income Above Poverty by Sex and Age in Newcastle
According to the poverty statistics in Newcastle, males aged under 5 years and females aged under 5 years are the age groups that are most secure financially, with 100.0% of males and 100.0% of females in these age groups living above the poverty line.
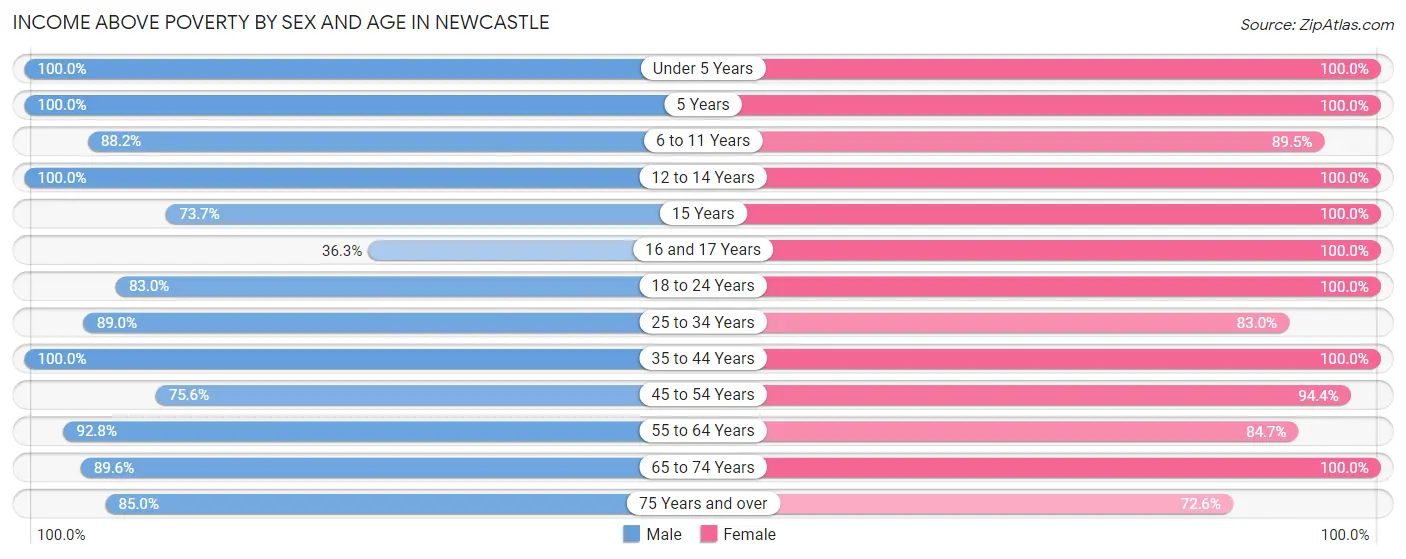
| Age Bracket | Male | Female |
| Under 5 Years | 117 (100.0%) | 10 (100.0%) |
| 5 Years | 21 (100.0%) | 4 (100.0%) |
| 6 to 11 Years | 120 (88.2%) | 77 (89.5%) |
| 12 to 14 Years | 18 (100.0%) | 68 (100.0%) |
| 15 Years | 28 (73.7%) | 63 (100.0%) |
| 16 and 17 Years | 33 (36.3%) | 31 (100.0%) |
| 18 to 24 Years | 191 (83.0%) | 146 (100.0%) |
| 25 to 34 Years | 170 (89.0%) | 156 (83.0%) |
| 35 to 44 Years | 228 (100.0%) | 247 (100.0%) |
| 45 to 54 Years | 59 (75.6%) | 136 (94.4%) |
| 55 to 64 Years | 154 (92.8%) | 122 (84.7%) |
| 65 to 74 Years | 60 (89.5%) | 175 (100.0%) |
| 75 Years and over | 96 (85.0%) | 90 (72.6%) |
| Total | 1,295 (86.7%) | 1,325 (92.7%) |
Income Below Poverty Among Married-Couple Families in Newcastle
The poverty statistics for married-couple families in Newcastle show that 13.2% or 63 of the total 476 families live below the poverty line. Families with 3 or 4 children have the highest poverty rate of 38.9%, comprising of 21 families. On the other hand, families with 1 or 2 children have the lowest poverty rate of 4.4%, which includes 6 families.
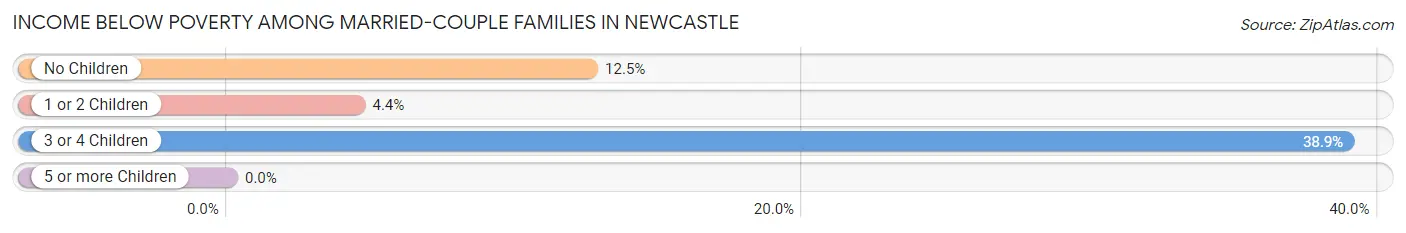
| Children | Above Poverty | Below Poverty |
| No Children | 251 (87.5%) | 36 (12.5%) |
| 1 or 2 Children | 129 (95.6%) | 6 (4.4%) |
| 3 or 4 Children | 33 (61.1%) | 21 (38.9%) |
| 5 or more Children | 0 (0.0%) | 0 (0.0%) |
| Total | 413 (86.8%) | 63 (13.2%) |
Income Below Poverty Among Single-Parent Households in Newcastle
| Children | Single Father | Single Mother |
| No Children | 0 (0.0%) | 0 (0.0%) |
| 1 or 2 Children | 0 (0.0%) | 0 (0.0%) |
| 3 or 4 Children | 0 (0.0%) | 0 (0.0%) |
| 5 or more Children | 0 (0.0%) | 0 (0.0%) |
| Total | 0 (0.0%) | 0 (0.0%) |
Income Below Poverty Among Married-Couple vs Single-Parent Households in Newcastle
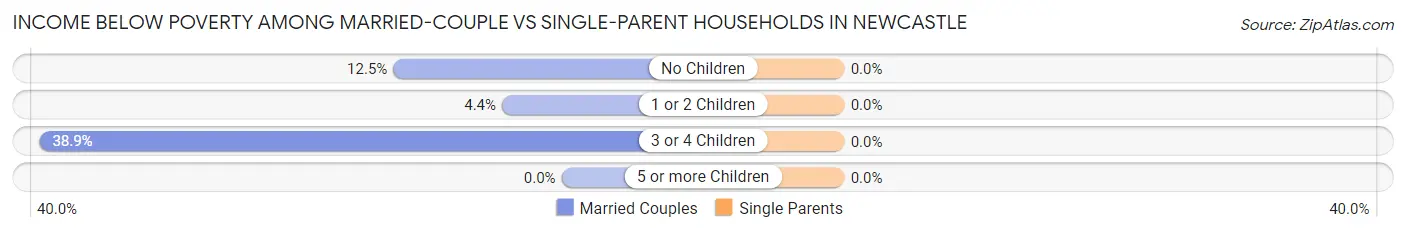
| Children | Married-Couple Families | Single-Parent Households |
| No Children | 36 (12.5%) | 0 (0.0%) |
| 1 or 2 Children | 6 (4.4%) | 0 (0.0%) |
| 3 or 4 Children | 21 (38.9%) | 0 (0.0%) |
| 5 or more Children | 0 (0.0%) | 0 (0.0%) |
| Total | 63 (13.2%) | 0 (0.0%) |
Race in Newcastle
The most populous races in Newcastle are White / Caucasian (2,952 | 87.3%), Two or more Races (224 | 6.6%), and Hispanic or Latino (205 | 6.1%).
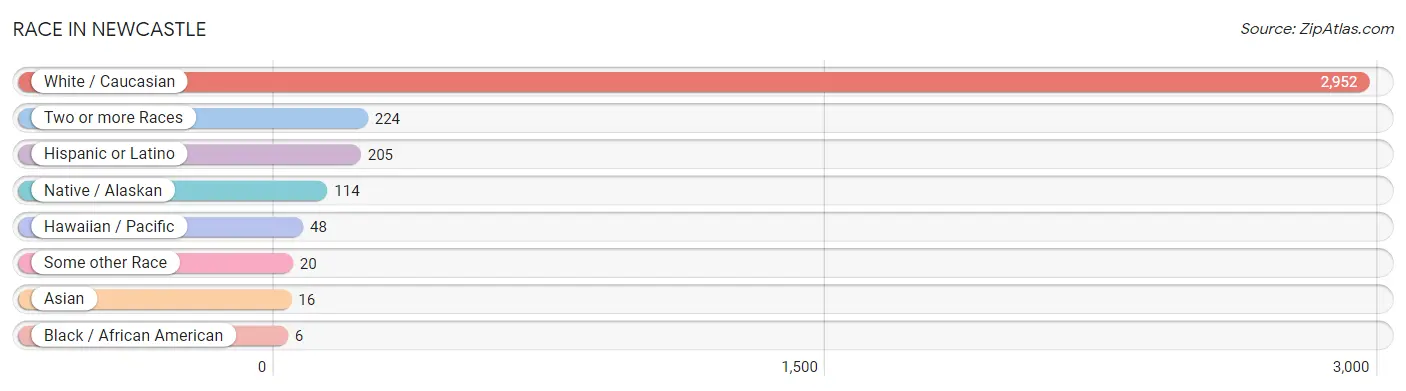
| Race | # Population | % Population |
| Asian | 16 | 0.5% |
| Black / African American | 6 | 0.2% |
| Hawaiian / Pacific | 48 | 1.4% |
| Hispanic or Latino | 205 | 6.1% |
| Native / Alaskan | 114 | 3.4% |
| White / Caucasian | 2,952 | 87.3% |
| Two or more Races | 224 | 6.6% |
| Some other Race | 20 | 0.6% |
| Total | 3,380 | 100.0% |
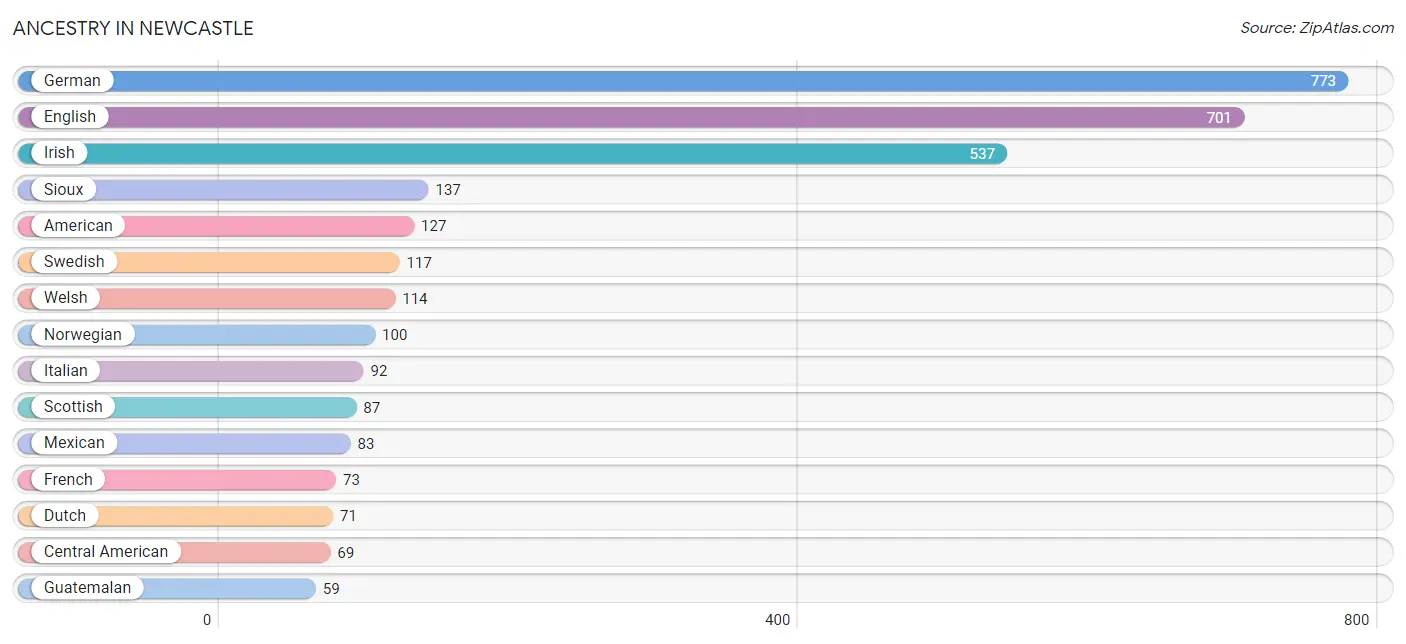
Ancestry in Newcastle
The most populous ancestries reported in Newcastle are German (773 | 22.9%), English (701 | 20.7%), Irish (537 | 15.9%), Sioux (137 | 4.1%), and American (127 | 3.8%), together accounting for 67.3% of all Newcastle residents.
| Ancestry | # Population | % Population |
| American | 127 | 3.8% |
| Basque | 2 | 0.1% |
| Bhutanese | 1 | 0.0% |
| British | 24 | 0.7% |
| Central American | 69 | 2.0% |
| Central American Indian | 51 | 1.5% |
| Cherokee | 4 | 0.1% |
| Crow | 2 | 0.1% |
| Czech | 11 | 0.3% |
| Czechoslovakian | 14 | 0.4% |
| Danish | 13 | 0.4% |
| Dutch | 71 | 2.1% |
| English | 701 | 20.7% |
| European | 55 | 1.6% |
| French | 73 | 2.2% |
| German | 773 | 22.9% |
| Greek | 5 | 0.2% |
| Guatemalan | 59 | 1.8% |
| Honduran | 1 | 0.0% |
| Icelander | 3 | 0.1% |
| Indian (Asian) | 15 | 0.4% |
| Irish | 537 | 15.9% |
| Italian | 92 | 2.7% |
| Korean | 58 | 1.7% |
| Luxembourger | 5 | 0.2% |
| Mexican | 83 | 2.5% |
| Mexican American Indian | 52 | 1.5% |
| Norwegian | 100 | 3.0% |
| Polish | 43 | 1.3% |
| Portuguese | 2 | 0.1% |
| Potawatomi | 18 | 0.5% |
| Puerto Rican | 1 | 0.0% |
| Russian | 49 | 1.5% |
| Salvadoran | 9 | 0.3% |
| Scandinavian | 30 | 0.9% |
| Scotch-Irish | 3 | 0.1% |
| Scottish | 87 | 2.6% |
| Shoshone | 4 | 0.1% |
| Sioux | 137 | 4.1% |
| Spanish | 37 | 1.1% |
| Swedish | 117 | 3.5% |
| Swiss | 11 | 0.3% |
| Welsh | 114 | 3.4% | View All 43 Rows |
Immigrants in Newcastle
The most numerous immigrant groups reported in Newcastle came from Canada (19 | 0.6%), Asia (15 | 0.4%), Eastern Asia (15 | 0.4%), Korea (15 | 0.4%), and Central America (11 | 0.3%), together accounting for 2.2% of all Newcastle residents.
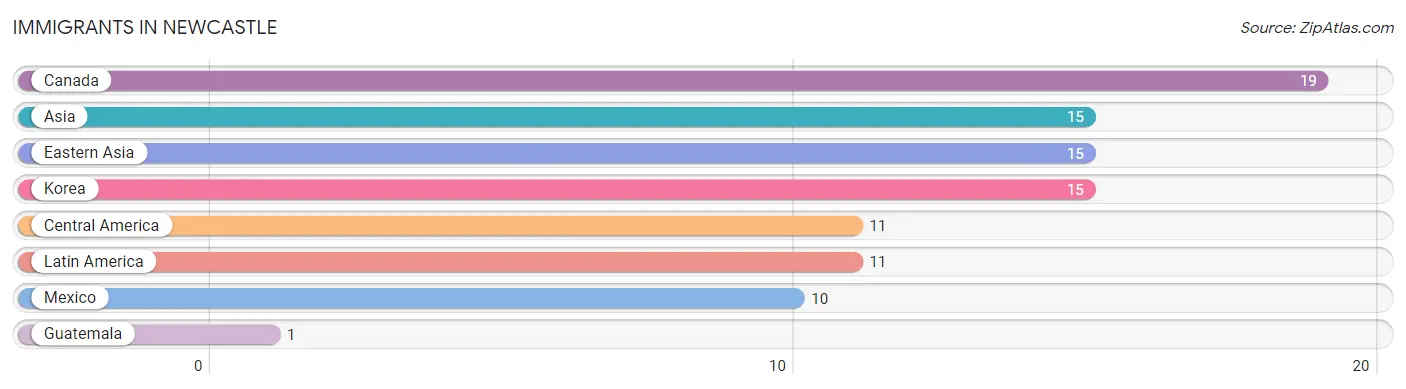
| Immigration Origin | # Population | % Population |
| Asia | 15 | 0.4% |
| Canada | 19 | 0.6% |
| Central America | 11 | 0.3% |
| Eastern Asia | 15 | 0.4% |
| Guatemala | 1 | 0.0% |
| Korea | 15 | 0.4% |
| Latin America | 11 | 0.3% |
| Mexico | 10 | 0.3% | View All 8 Rows |
Sex and Age in Newcastle
Sex and Age in Newcastle
The most populous age groups in Newcastle are 15 to 19 Years (225 | 12.2%) for men and 15 to 19 Years (148 | 9.6%) for women.
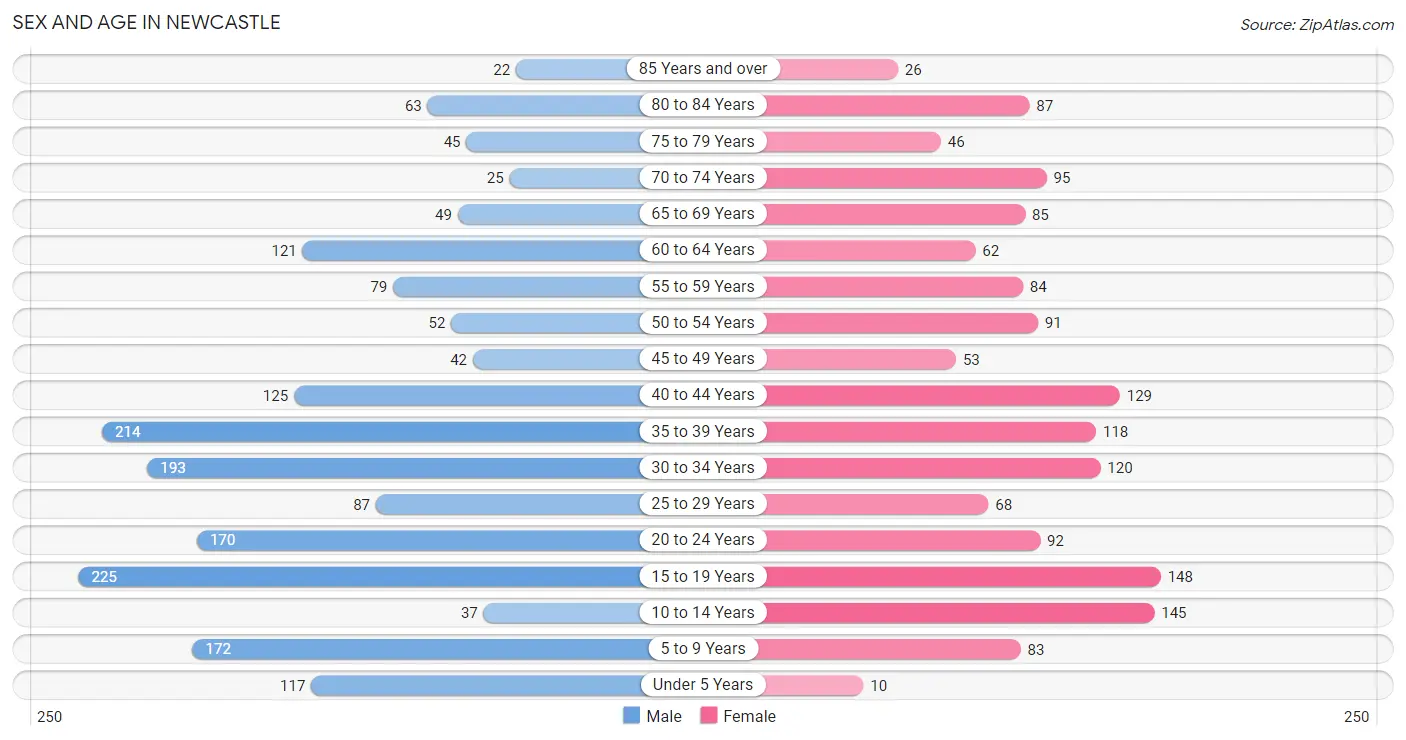
| Age Bracket | Male | Female |
| Under 5 Years | 117 (6.4%) | 10 (0.6%) |
| 5 to 9 Years | 172 (9.4%) | 83 (5.4%) |
| 10 to 14 Years | 37 (2.0%) | 145 (9.4%) |
| 15 to 19 Years | 225 (12.2%) | 148 (9.6%) |
| 20 to 24 Years | 170 (9.2%) | 92 (6.0%) |
| 25 to 29 Years | 87 (4.7%) | 68 (4.4%) |
| 30 to 34 Years | 193 (10.5%) | 120 (7.8%) |
| 35 to 39 Years | 214 (11.6%) | 118 (7.6%) |
| 40 to 44 Years | 125 (6.8%) | 129 (8.4%) |
| 45 to 49 Years | 42 (2.3%) | 53 (3.4%) |
| 50 to 54 Years | 52 (2.8%) | 91 (5.9%) |
| 55 to 59 Years | 79 (4.3%) | 84 (5.4%) |
| 60 to 64 Years | 121 (6.6%) | 62 (4.0%) |
| 65 to 69 Years | 49 (2.7%) | 85 (5.5%) |
| 70 to 74 Years | 25 (1.4%) | 95 (6.2%) |
| 75 to 79 Years | 45 (2.5%) | 46 (3.0%) |
| 80 to 84 Years | 63 (3.4%) | 87 (5.6%) |
| 85 Years and over | 22 (1.2%) | 26 (1.7%) |
| Total | 1,838 (100.0%) | 1,542 (100.0%) |
Families and Households in Newcastle
Median Family Size in Newcastle
The median family size in Newcastle is 3.40 persons per family, with single female/mother families (165 | 23.7%) accounting for the largest median family size of 3.96 persons per family. On the other hand, single male/father families (54 | 7.8%) represent the smallest median family size with 3.04 persons per family.
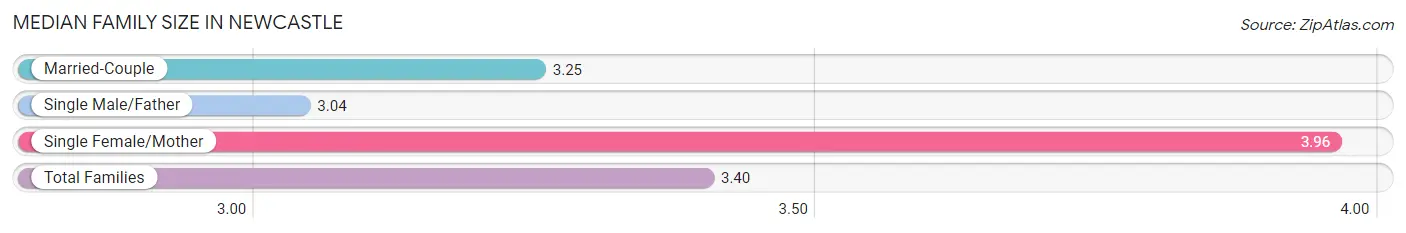
| Family Type | # Families | Family Size |
| Married-Couple | 476 (68.5%) | 3.25 |
| Single Male/Father | 54 (7.8%) | 3.04 |
| Single Female/Mother | 165 (23.7%) | 3.96 |
| Total Families | 695 (100.0%) | 3.40 |
Median Household Size in Newcastle
The median household size in Newcastle is 2.95 persons per household, with single female/mother households (165 | 16.1%) accounting for the largest median household size of 4.83 persons per household. non-family households (333 | 32.4%) represent the smallest median household size with 1.27 persons per household.
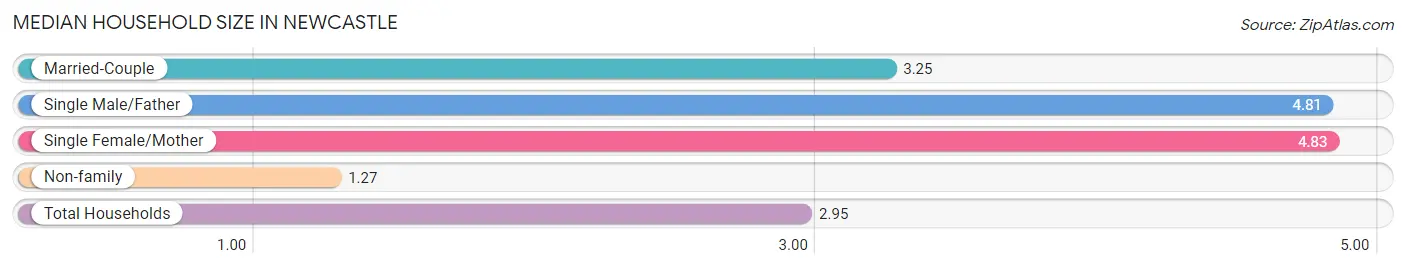
| Household Type | # Households | Household Size |
| Married-Couple | 476 (46.3%) | 3.25 |
| Single Male/Father | 54 (5.2%) | 4.81 |
| Single Female/Mother | 165 (16.1%) | 4.83 |
| Non-family | 333 (32.4%) | 1.27 |
| Total Households | 1,028 (100.0%) | 2.95 |
Household Size by Marriage Status in Newcastle
Out of a total of 1,028 households in Newcastle, 695 (67.6%) are family households, while 333 (32.4%) are nonfamily households. The most numerous type of family households are 2-person households, comprising 334, and the most common type of nonfamily households are 1-person households, comprising 259.
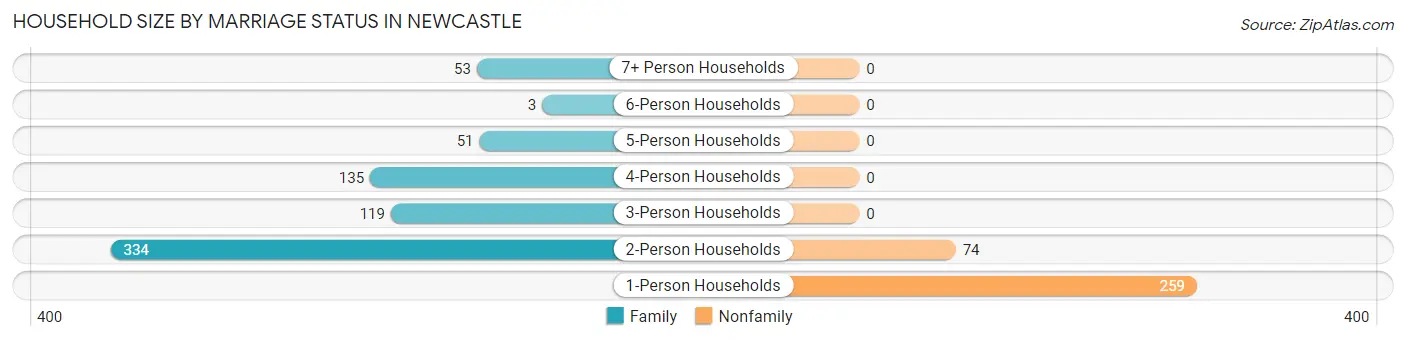
| Household Size | Family Households | Nonfamily Households |
| 1-Person Households | - | 259 (25.2%) |
| 2-Person Households | 334 (32.5%) | 74 (7.2%) |
| 3-Person Households | 119 (11.6%) | 0 (0.0%) |
| 4-Person Households | 135 (13.1%) | 0 (0.0%) |
| 5-Person Households | 51 (5.0%) | 0 (0.0%) |
| 6-Person Households | 3 (0.3%) | 0 (0.0%) |
| 7+ Person Households | 53 (5.2%) | 0 (0.0%) |
| Total | 695 (67.6%) | 333 (32.4%) |
Female Fertility in Newcastle
Fertility by Age in Newcastle
Average fertility rate in Newcastle is 57.0 births per 1,000 women. Women in the age bracket of 20 to 34 years have the highest fertility rate with 150.0 births per 1,000 women. Women in the age bracket of 20 to 34 years acount for 100.0% of all women with births.
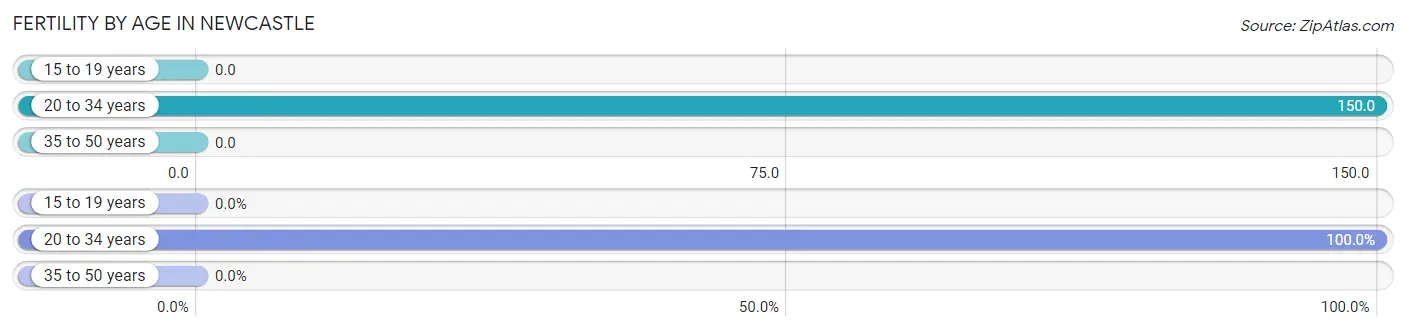
| Age Bracket | Women with Births | Births / 1,000 Women |
| 15 to 19 years | 0 (0.0%) | 0.0 |
| 20 to 34 years | 42 (100.0%) | 150.0 |
| 35 to 50 years | 0 (0.0%) | 0.0 |
| Total | 42 (100.0%) | 57.0 |
Fertility by Age by Marriage Status in Newcastle
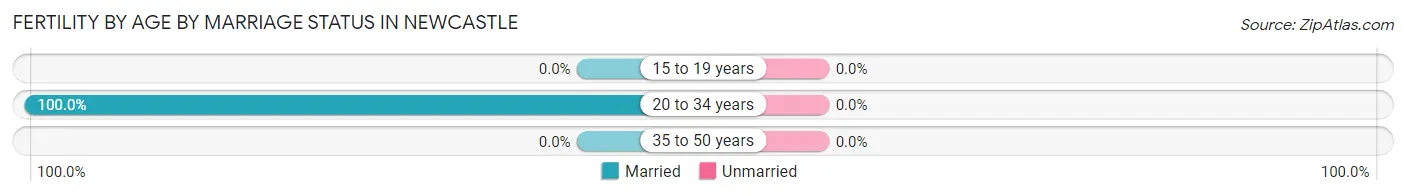
| Age Bracket | Married | Unmarried |
| 15 to 19 years | 0 (0.0%) | 0 (0.0%) |
| 20 to 34 years | 42 (100.0%) | 0 (0.0%) |
| 35 to 50 years | 0 (0.0%) | 0 (0.0%) |
| Total | 42 (100.0%) | 0 (0.0%) |
Fertility by Education in Newcastle
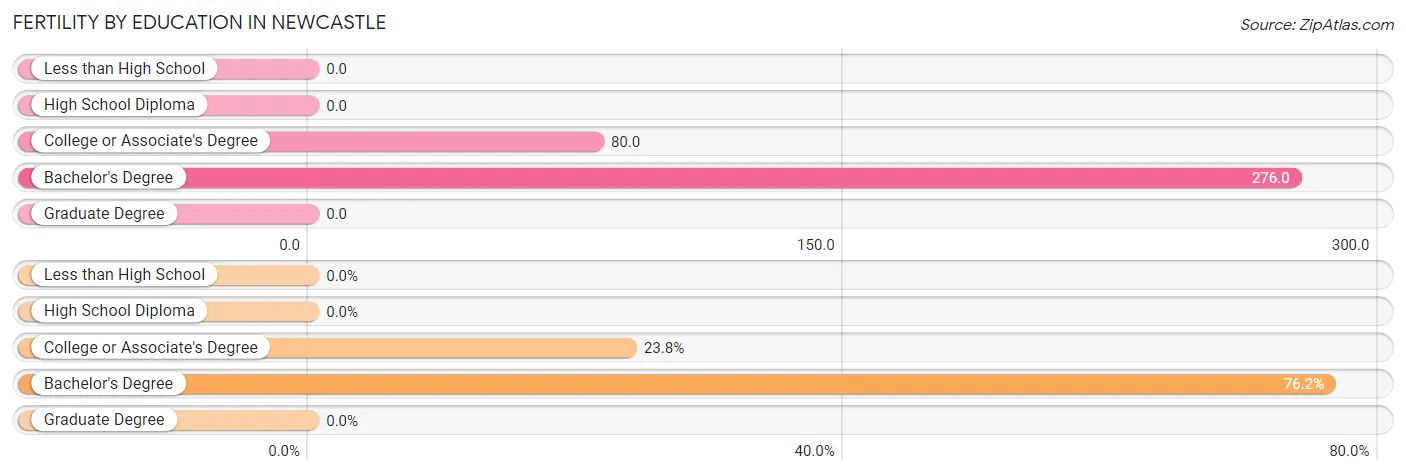
| Educational Attainment | Women with Births | Births / 1,000 Women |
| Less than High School | 0 (0.0%) | 0.0 |
| High School Diploma | 0 (0.0%) | 0.0 |
| College or Associate's Degree | 10 (23.8%) | 80.0 |
| Bachelor's Degree | 32 (76.2%) | 276.0 |
| Graduate Degree | 0 (0.0%) | 0.0 |
| Total | 42 (100.0%) | 57.0 |
Fertility by Education by Marriage Status in Newcastle
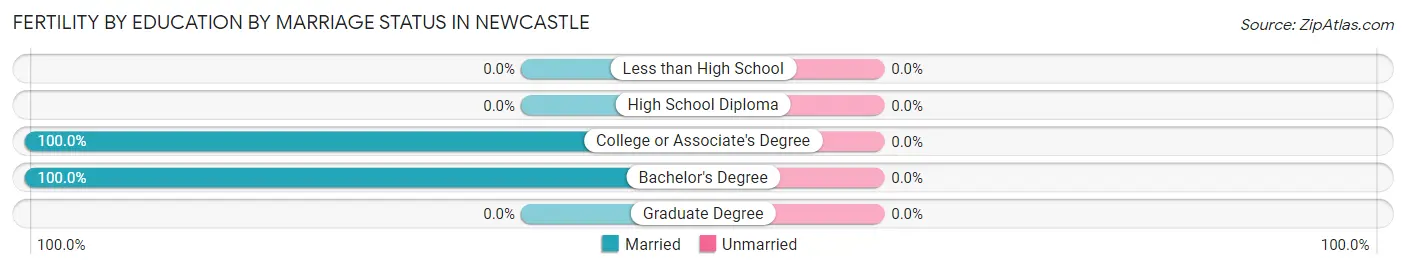
| Educational Attainment | Married | Unmarried |
| Less than High School | 0 (0.0%) | 0 (0.0%) |
| High School Diploma | 0 (0.0%) | 0 (0.0%) |
| College or Associate's Degree | 10 (100.0%) | 0 (0.0%) |
| Bachelor's Degree | 32 (100.0%) | 0 (0.0%) |
| Graduate Degree | 0 (0.0%) | 0 (0.0%) |
| Total | 42 (100.0%) | 0 (0.0%) |
Employment Characteristics in Newcastle
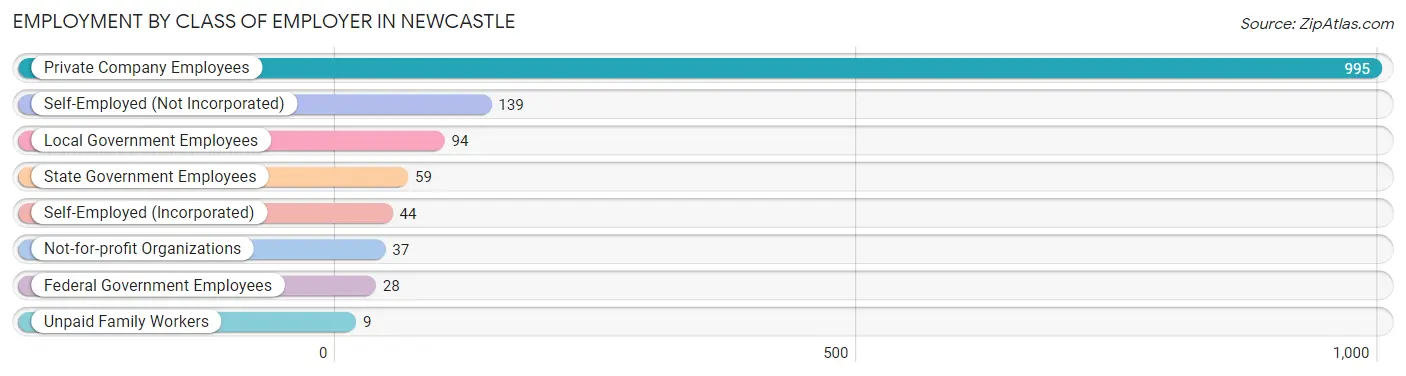
Employment by Class of Employer in Newcastle
Among the 1,405 employed individuals in Newcastle, private company employees (995 | 70.8%), self-employed (not incorporated) (139 | 9.9%), and local government employees (94 | 6.7%) make up the most common classes of employment.
| Employer Class | # Employees | % Employees |
| Private Company Employees | 995 | 70.8% |
| Self-Employed (Incorporated) | 44 | 3.1% |
| Self-Employed (Not Incorporated) | 139 | 9.9% |
| Not-for-profit Organizations | 37 | 2.6% |
| Local Government Employees | 94 | 6.7% |
| State Government Employees | 59 | 4.2% |
| Federal Government Employees | 28 | 2.0% |
| Unpaid Family Workers | 9 | 0.6% |
| Total | 1,405 | 100.0% |
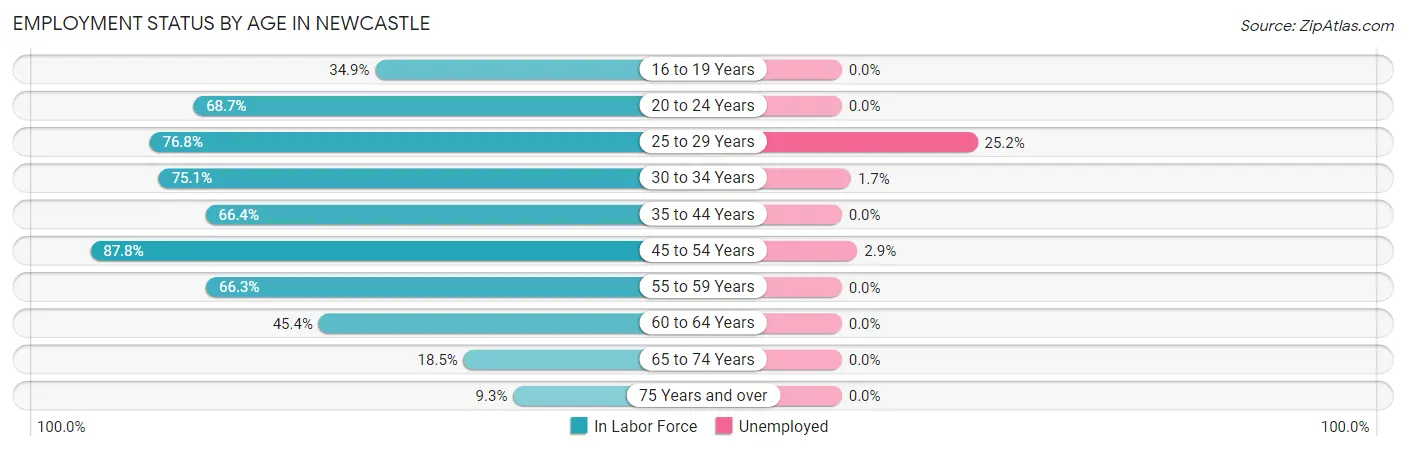
Employment Status by Age in Newcastle
According to the labor force statistics for Newcastle, out of the total population over 16 years of age (2,715), 55.0% or 1,493 individuals are in the labor force, with 2.7% or 40 of them unemployed. The age group with the highest labor force participation rate is 45 to 54 years, with 87.8% or 209 individuals in the labor force. Within the labor force, the 25 to 29 years age range has the highest percentage of unemployed individuals, with 25.2% or 30 of them being unemployed.
| Age Bracket | In Labor Force | Unemployed |
| 16 to 19 Years | 95 (34.9%) | 0 (0.0%) |
| 20 to 24 Years | 180 (68.7%) | 0 (0.0%) |
| 25 to 29 Years | 119 (76.8%) | 30 (25.2%) |
| 30 to 34 Years | 235 (75.1%) | 4 (1.7%) |
| 35 to 44 Years | 389 (66.4%) | 0 (0.0%) |
| 45 to 54 Years | 209 (87.8%) | 6 (2.9%) |
| 55 to 59 Years | 108 (66.3%) | 0 (0.0%) |
| 60 to 64 Years | 83 (45.4%) | 0 (0.0%) |
| 65 to 74 Years | 47 (18.5%) | 0 (0.0%) |
| 75 Years and over | 27 (9.3%) | 0 (0.0%) |
| Total | 1,493 (55.0%) | 40 (2.7%) |
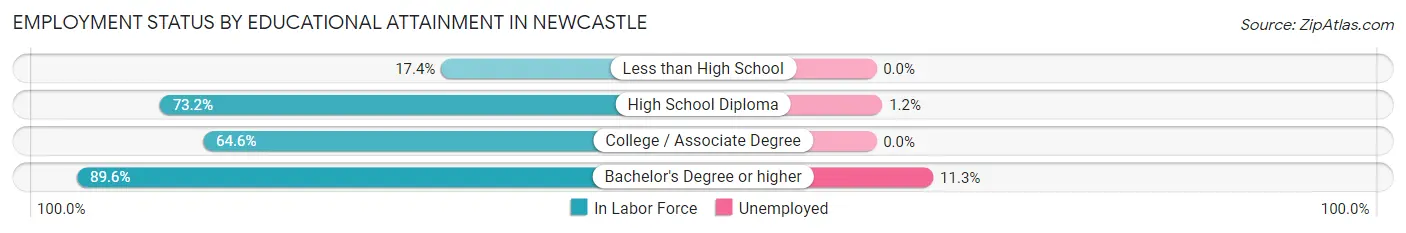
Employment Status by Educational Attainment in Newcastle
According to labor force statistics for Newcastle, 69.8% of individuals (1,143) out of the total population between 25 and 64 years of age (1,638) are in the labor force, with 3.5% or 40 of them being unemployed. The group with the highest labor force participation rate are those with the educational attainment of bachelor's degree or higher, with 89.6% or 302 individuals in the labor force. Within the labor force, individuals with bachelor's degree or higher education have the highest percentage of unemployment, with 11.3% or 34 of them being unemployed.
| Educational Attainment | In Labor Force | Unemployed |
| Less than High School | 21 (17.4%) | 0 (0.0%) |
| High School Diploma | 494 (73.2%) | 8 (1.2%) |
| College / Associate Degree | 326 (64.6%) | 0 (0.0%) |
| Bachelor's Degree or higher | 302 (89.6%) | 38 (11.3%) |
| Total | 1,143 (69.8%) | 57 (3.5%) |
Employment Occupations by Sex in Newcastle
Management, Business, Science and Arts Occupations
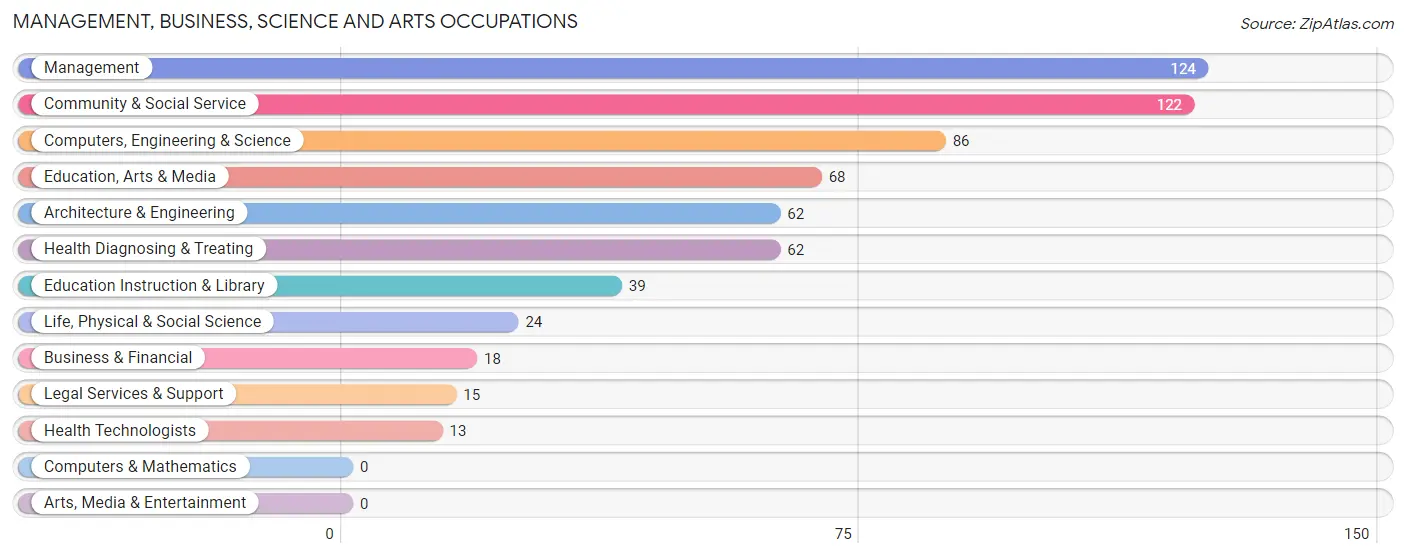
The most common Management, Business, Science and Arts occupations in Newcastle are Management (124 | 8.5%), Community & Social Service (122 | 8.4%), Computers, Engineering & Science (86 | 5.9%), Education, Arts & Media (68 | 4.7%), and Architecture & Engineering (62 | 4.3%).
Management, Business, Science and Arts Occupations by Sex
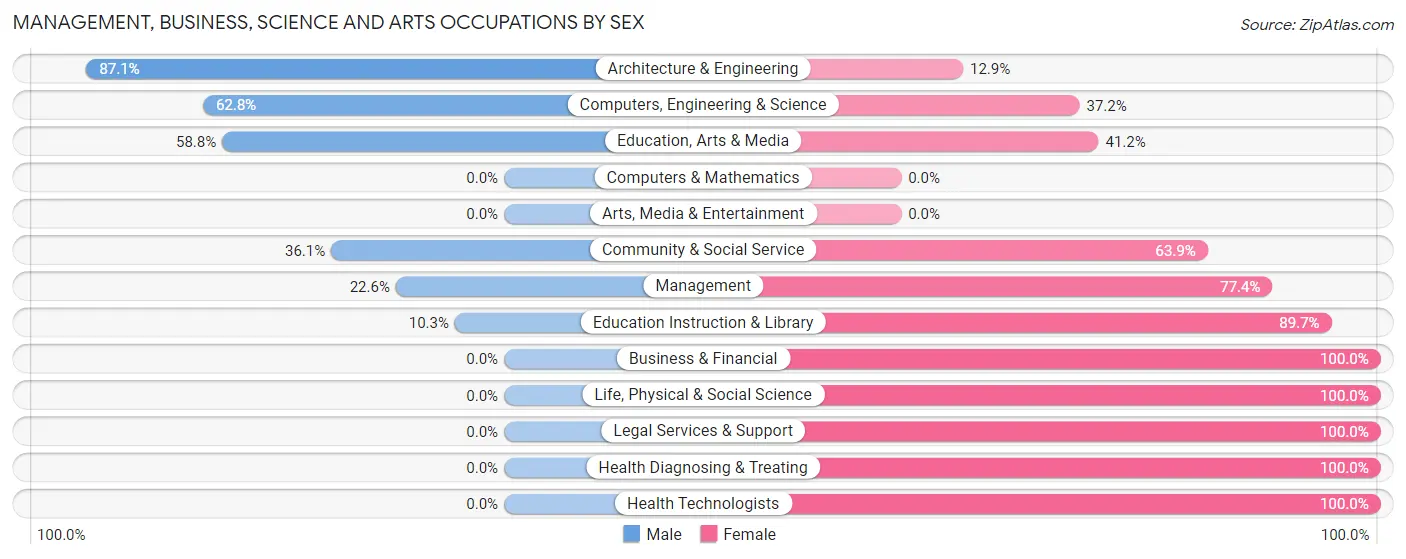
Within the Management, Business, Science and Arts occupations in Newcastle, the most male-oriented occupations are Architecture & Engineering (87.1%), Computers, Engineering & Science (62.8%), and Education, Arts & Media (58.8%), while the most female-oriented occupations are Business & Financial (100.0%), Life, Physical & Social Science (100.0%), and Legal Services & Support (100.0%).
| Occupation | Male | Female |
| Management | 28 (22.6%) | 96 (77.4%) |
| Business & Financial | 0 (0.0%) | 18 (100.0%) |
| Computers, Engineering & Science | 54 (62.8%) | 32 (37.2%) |
| Computers & Mathematics | 0 (0.0%) | 0 (0.0%) |
| Architecture & Engineering | 54 (87.1%) | 8 (12.9%) |
| Life, Physical & Social Science | 0 (0.0%) | 24 (100.0%) |
| Community & Social Service | 44 (36.1%) | 78 (63.9%) |
| Education, Arts & Media | 40 (58.8%) | 28 (41.2%) |
| Legal Services & Support | 0 (0.0%) | 15 (100.0%) |
| Education Instruction & Library | 4 (10.3%) | 35 (89.7%) |
| Arts, Media & Entertainment | 0 (0.0%) | 0 (0.0%) |
| Health Diagnosing & Treating | 0 (0.0%) | 62 (100.0%) |
| Health Technologists | 0 (0.0%) | 13 (100.0%) |
| Total (Category) | 126 (30.6%) | 286 (69.4%) |
| Total (Overall) | 803 (55.3%) | 649 (44.7%) |
Services Occupations
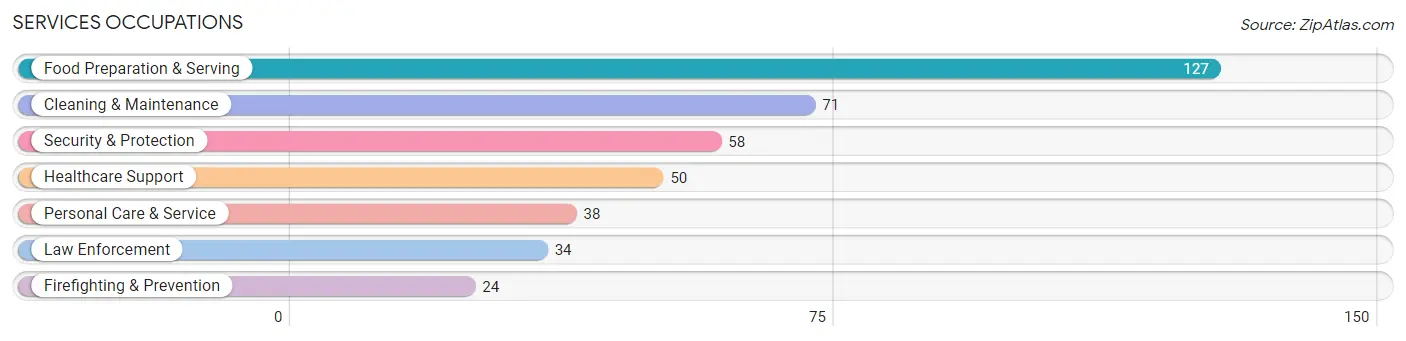
The most common Services occupations in Newcastle are Food Preparation & Serving (127 | 8.7%), Cleaning & Maintenance (71 | 4.9%), Security & Protection (58 | 4.0%), Healthcare Support (50 | 3.4%), and Personal Care & Service (38 | 2.6%).
Services Occupations by Sex
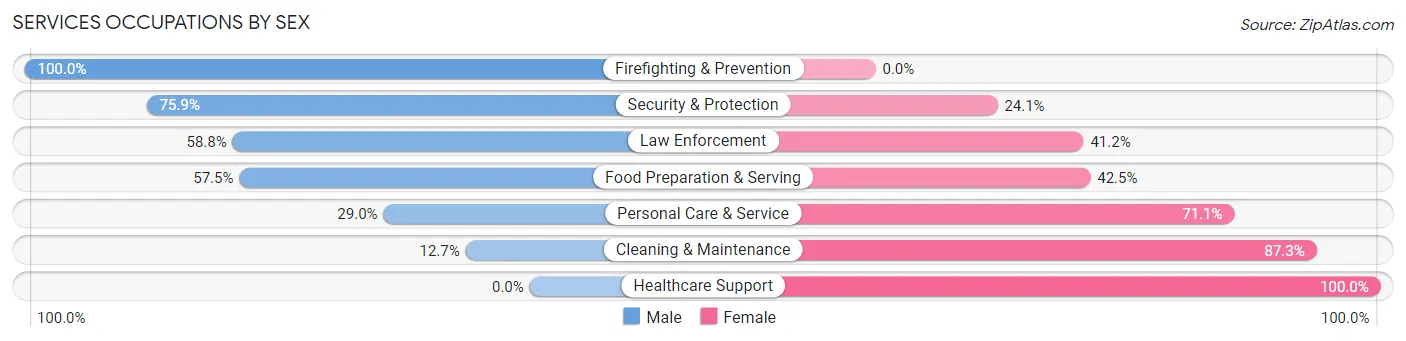
Within the Services occupations in Newcastle, the most male-oriented occupations are Firefighting & Prevention (100.0%), Security & Protection (75.9%), and Law Enforcement (58.8%), while the most female-oriented occupations are Healthcare Support (100.0%), Cleaning & Maintenance (87.3%), and Personal Care & Service (71.1%).
| Occupation | Male | Female |
| Healthcare Support | 0 (0.0%) | 50 (100.0%) |
| Security & Protection | 44 (75.9%) | 14 (24.1%) |
| Firefighting & Prevention | 24 (100.0%) | 0 (0.0%) |
| Law Enforcement | 20 (58.8%) | 14 (41.2%) |
| Food Preparation & Serving | 73 (57.5%) | 54 (42.5%) |
| Cleaning & Maintenance | 9 (12.7%) | 62 (87.3%) |
| Personal Care & Service | 11 (28.9%) | 27 (71.1%) |
| Total (Category) | 137 (39.8%) | 207 (60.2%) |
| Total (Overall) | 803 (55.3%) | 649 (44.7%) |
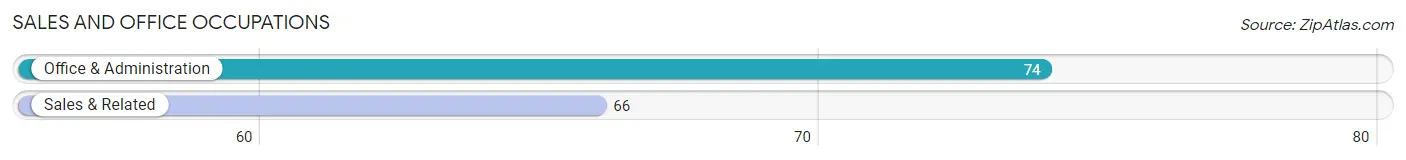
Sales and Office Occupations
The most common Sales and Office occupations in Newcastle are Office & Administration (74 | 5.1%), and Sales & Related (66 | 4.5%).
Sales and Office Occupations by Sex
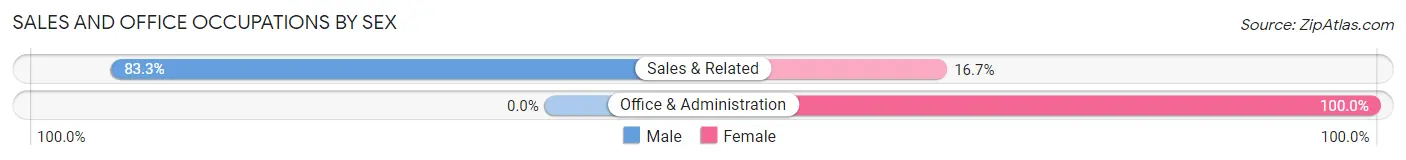
| Occupation | Male | Female |
| Sales & Related | 55 (83.3%) | 11 (16.7%) |
| Office & Administration | 0 (0.0%) | 74 (100.0%) |
| Total (Category) | 55 (39.3%) | 85 (60.7%) |
| Total (Overall) | 803 (55.3%) | 649 (44.7%) |
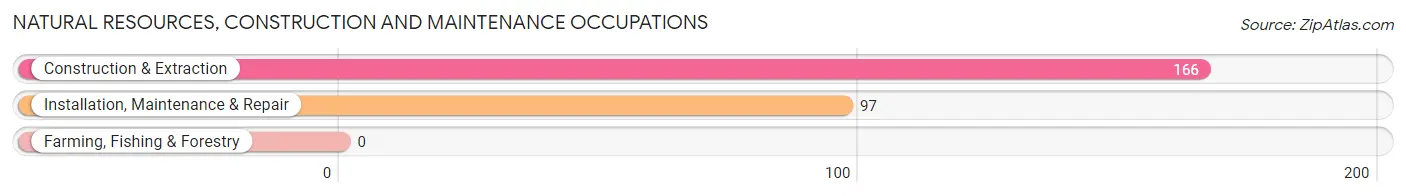
Natural Resources, Construction and Maintenance Occupations
The most common Natural Resources, Construction and Maintenance occupations in Newcastle are Construction & Extraction (166 | 11.4%), and Installation, Maintenance & Repair (97 | 6.7%).
Natural Resources, Construction and Maintenance Occupations by Sex
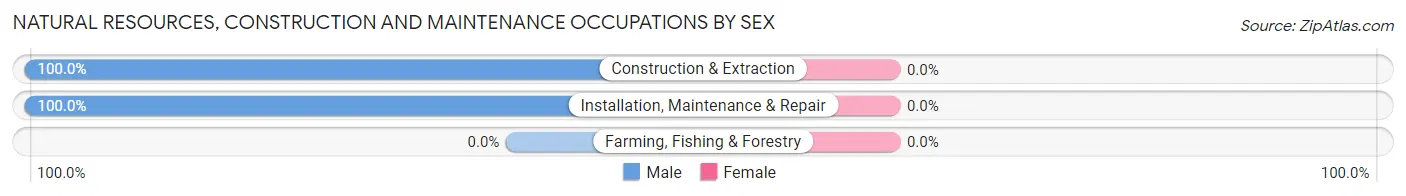
| Occupation | Male | Female |
| Farming, Fishing & Forestry | 0 (0.0%) | 0 (0.0%) |
| Construction & Extraction | 166 (100.0%) | 0 (0.0%) |
| Installation, Maintenance & Repair | 97 (100.0%) | 0 (0.0%) |
| Total (Category) | 263 (100.0%) | 0 (0.0%) |
| Total (Overall) | 803 (55.3%) | 649 (44.7%) |
Production, Transportation and Moving Occupations
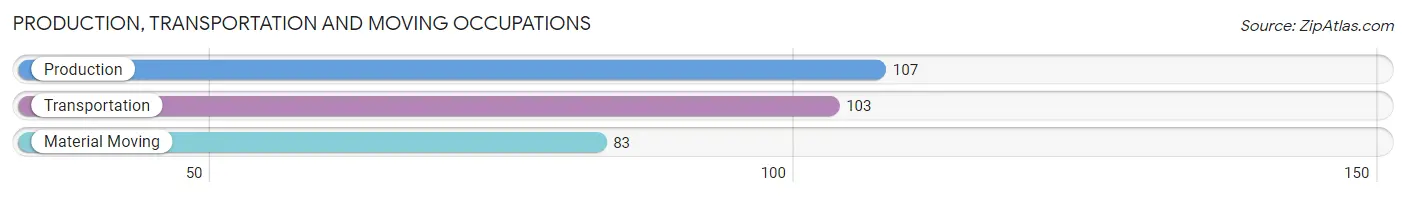
The most common Production, Transportation and Moving occupations in Newcastle are Production (107 | 7.4%), Transportation (103 | 7.1%), and Material Moving (83 | 5.7%).
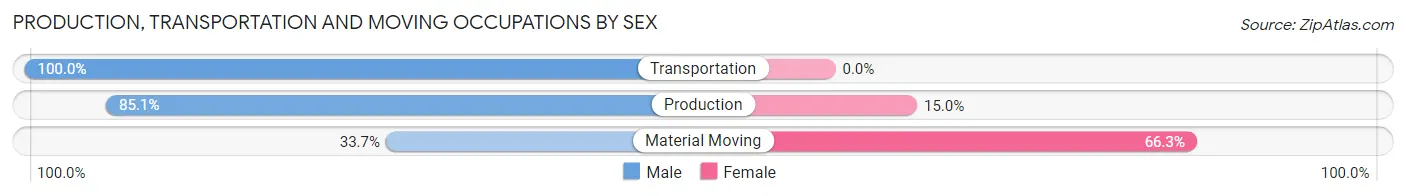
Production, Transportation and Moving Occupations by Sex
| Occupation | Male | Female |
| Production | 91 (85.1%) | 16 (14.9%) |
| Transportation | 103 (100.0%) | 0 (0.0%) |
| Material Moving | 28 (33.7%) | 55 (66.3%) |
| Total (Category) | 222 (75.8%) | 71 (24.2%) |
| Total (Overall) | 803 (55.3%) | 649 (44.7%) |
Employment Industries by Sex in Newcastle
Employment Industries in Newcastle
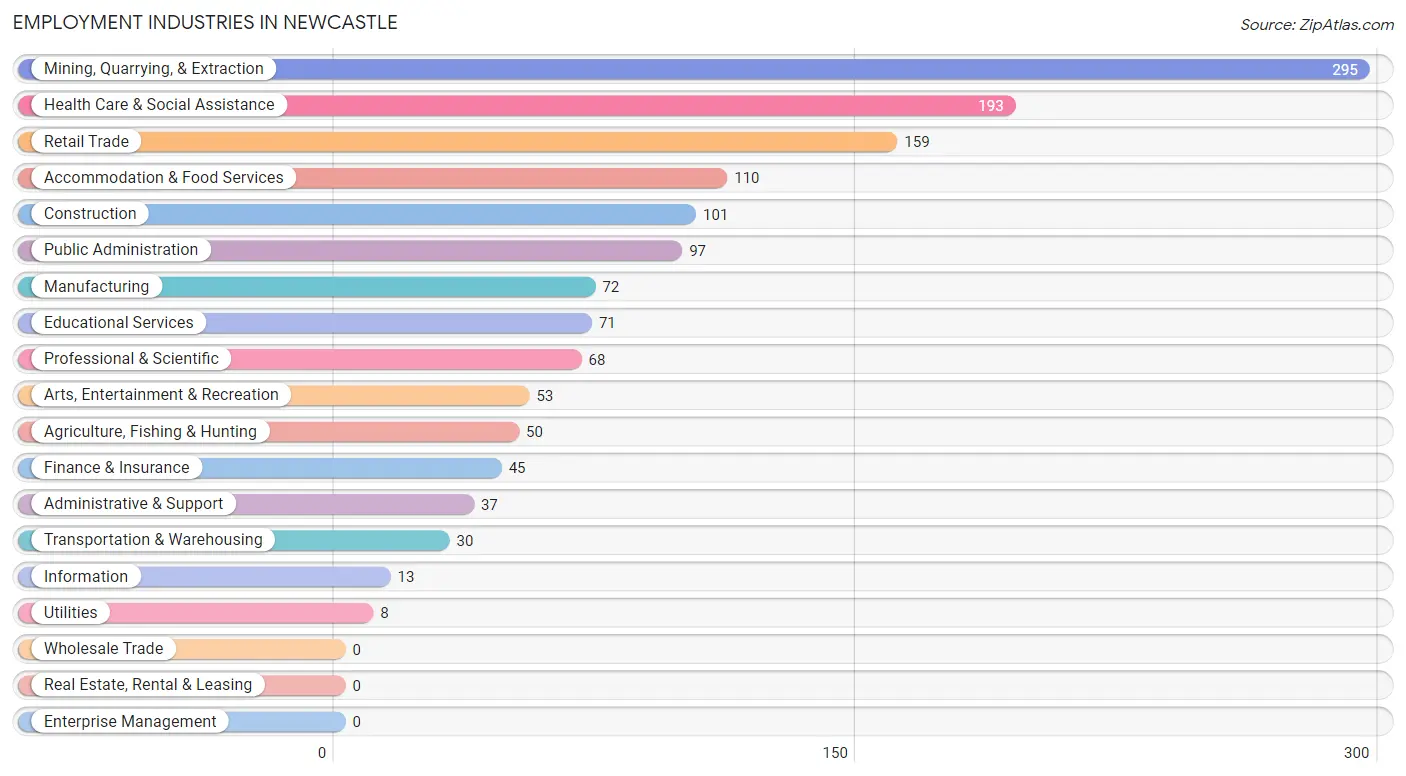
The major employment industries in Newcastle include Mining, Quarrying, & Extraction (295 | 20.3%), Health Care & Social Assistance (193 | 13.3%), Retail Trade (159 | 11.0%), Accommodation & Food Services (110 | 7.6%), and Construction (101 | 7.0%).
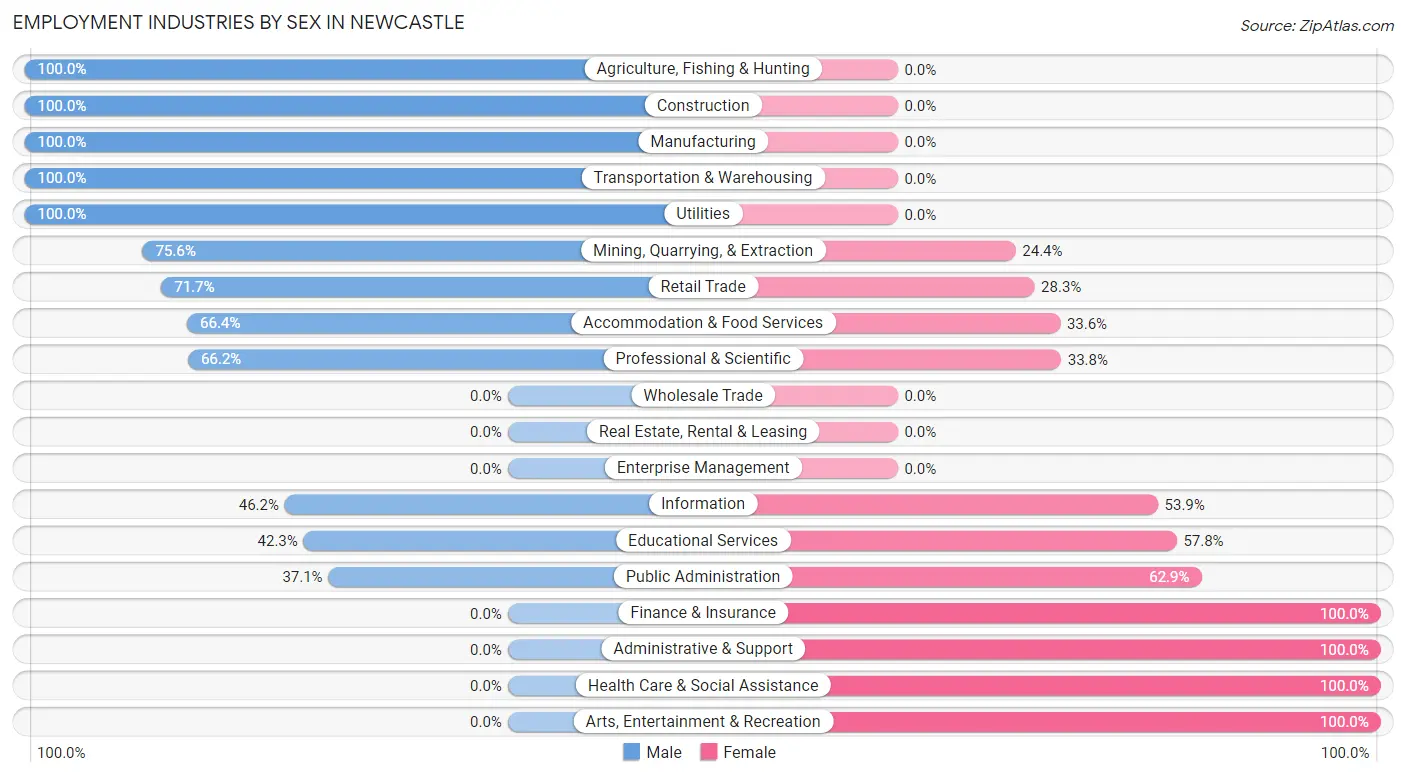
Employment Industries by Sex in Newcastle
The Newcastle industries that see more men than women are Agriculture, Fishing & Hunting (100.0%), Construction (100.0%), and Manufacturing (100.0%), whereas the industries that tend to have a higher number of women are Finance & Insurance (100.0%), Administrative & Support (100.0%), and Health Care & Social Assistance (100.0%).
| Industry | Male | Female |
| Agriculture, Fishing & Hunting | 50 (100.0%) | 0 (0.0%) |
| Mining, Quarrying, & Extraction | 223 (75.6%) | 72 (24.4%) |
| Construction | 101 (100.0%) | 0 (0.0%) |
| Manufacturing | 72 (100.0%) | 0 (0.0%) |
| Wholesale Trade | 0 (0.0%) | 0 (0.0%) |
| Retail Trade | 114 (71.7%) | 45 (28.3%) |
| Transportation & Warehousing | 30 (100.0%) | 0 (0.0%) |
| Utilities | 8 (100.0%) | 0 (0.0%) |
| Information | 6 (46.2%) | 7 (53.8%) |
| Finance & Insurance | 0 (0.0%) | 45 (100.0%) |
| Real Estate, Rental & Leasing | 0 (0.0%) | 0 (0.0%) |
| Professional & Scientific | 45 (66.2%) | 23 (33.8%) |
| Enterprise Management | 0 (0.0%) | 0 (0.0%) |
| Administrative & Support | 0 (0.0%) | 37 (100.0%) |
| Educational Services | 30 (42.2%) | 41 (57.8%) |
| Health Care & Social Assistance | 0 (0.0%) | 193 (100.0%) |
| Arts, Entertainment & Recreation | 0 (0.0%) | 53 (100.0%) |
| Accommodation & Food Services | 73 (66.4%) | 37 (33.6%) |
| Public Administration | 36 (37.1%) | 61 (62.9%) |
| Total | 803 (55.3%) | 649 (44.7%) |
Education in Newcastle
School Enrollment in Newcastle
The most common levels of schooling among the 857 students in Newcastle are high school (326 | 38.0%), elementary school (169 | 19.7%), and middle school (160 | 18.7%).
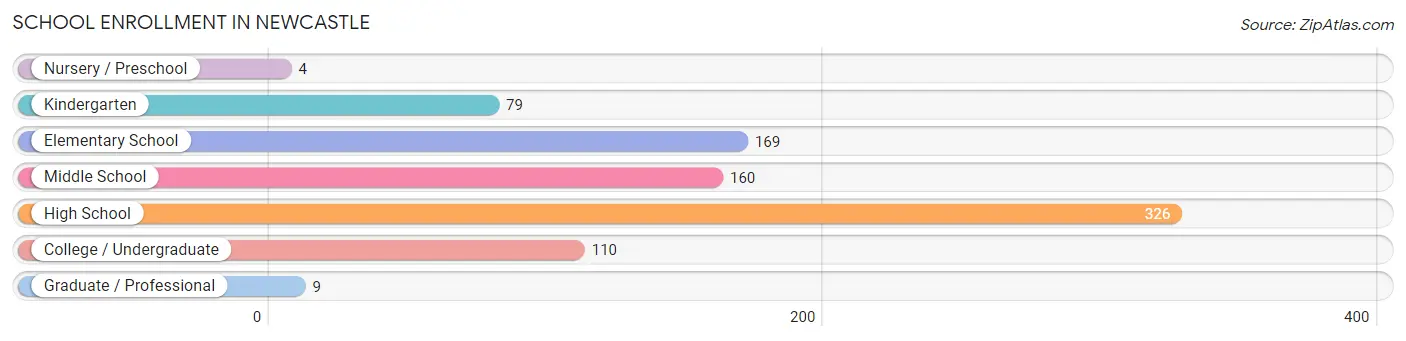
| School Level | # Students | % Students |
| Nursery / Preschool | 4 | 0.5% |
| Kindergarten | 79 | 9.2% |
| Elementary School | 169 | 19.7% |
| Middle School | 160 | 18.7% |
| High School | 326 | 38.0% |
| College / Undergraduate | 110 | 12.8% |
| Graduate / Professional | 9 | 1.1% |
| Total | 857 | 100.0% |
School Enrollment by Age by Funding Source in Newcastle
Out of a total of 857 students who are enrolled in schools in Newcastle, 29 (3.4%) attend a private institution, while the remaining 828 (96.6%) are enrolled in public schools. The age group of 25 to 34 year olds has the highest likelihood of being enrolled in private schools, with 10 (16.1% in the age bracket) enrolled. Conversely, the age group of 5 to 9 year old has the lowest likelihood of being enrolled in a private school, with 238 (100.0% in the age bracket) attending a public institution.
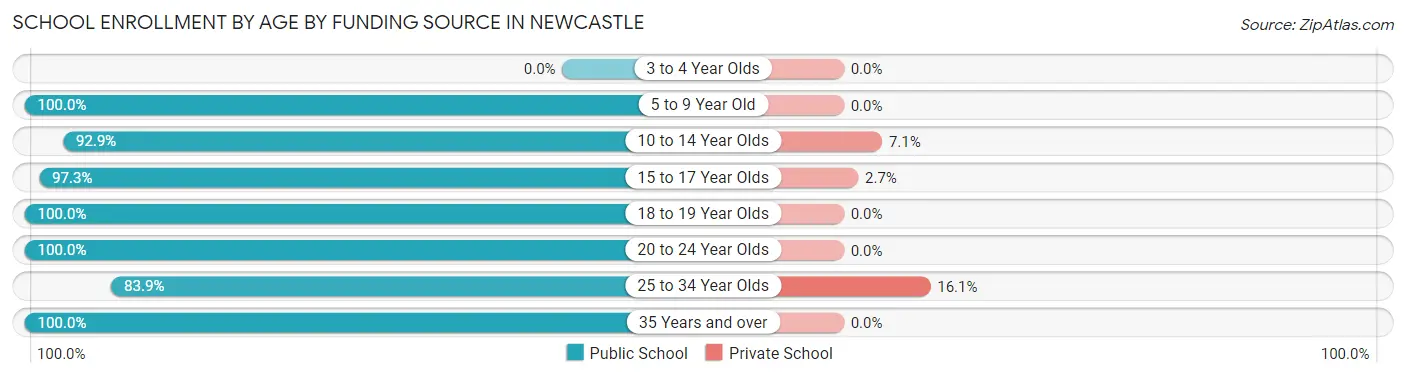
| Age Bracket | Public School | Private School |
| 3 to 4 Year Olds | 0 (0.0%) | 0 (0.0%) |
| 5 to 9 Year Old | 238 (100.0%) | 0 (0.0%) |
| 10 to 14 Year Olds | 169 (92.9%) | 13 (7.1%) |
| 15 to 17 Year Olds | 217 (97.3%) | 6 (2.7%) |
| 18 to 19 Year Olds | 102 (100.0%) | 0 (0.0%) |
| 20 to 24 Year Olds | 3 (100.0%) | 0 (0.0%) |
| 25 to 34 Year Olds | 52 (83.9%) | 10 (16.1%) |
| 35 Years and over | 47 (100.0%) | 0 (0.0%) |
| Total | 828 (96.6%) | 29 (3.4%) |
Educational Attainment by Field of Study in Newcastle
Education (103 | 22.2%), business (67 | 14.4%), liberal arts & history (55 | 11.8%), communications (49 | 10.6%), and social sciences (37 | 8.0%) are the most common fields of study among 464 individuals in Newcastle who have obtained a bachelor's degree or higher.
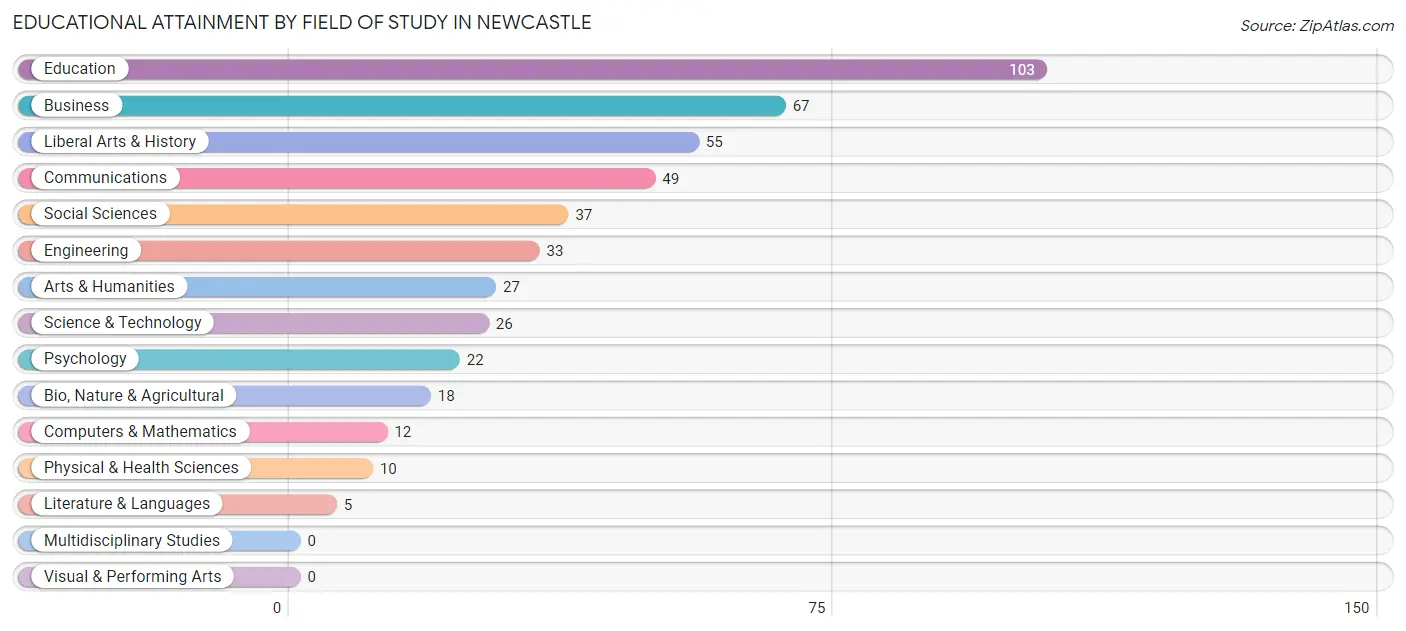
| Field of Study | # Graduates | % Graduates |
| Computers & Mathematics | 12 | 2.6% |
| Bio, Nature & Agricultural | 18 | 3.9% |
| Physical & Health Sciences | 10 | 2.2% |
| Psychology | 22 | 4.7% |
| Social Sciences | 37 | 8.0% |
| Engineering | 33 | 7.1% |
| Multidisciplinary Studies | 0 | 0.0% |
| Science & Technology | 26 | 5.6% |
| Business | 67 | 14.4% |
| Education | 103 | 22.2% |
| Literature & Languages | 5 | 1.1% |
| Liberal Arts & History | 55 | 11.8% |
| Visual & Performing Arts | 0 | 0.0% |
| Communications | 49 | 10.6% |
| Arts & Humanities | 27 | 5.8% |
| Total | 464 | 100.0% |
Transportation & Commute in Newcastle
Vehicle Availability by Sex in Newcastle
The most prevalent vehicle ownership categories in Newcastle are males with 2 vehicles (330, accounting for 41.6%) and females with 2 vehicles (316, making up 53.9%).
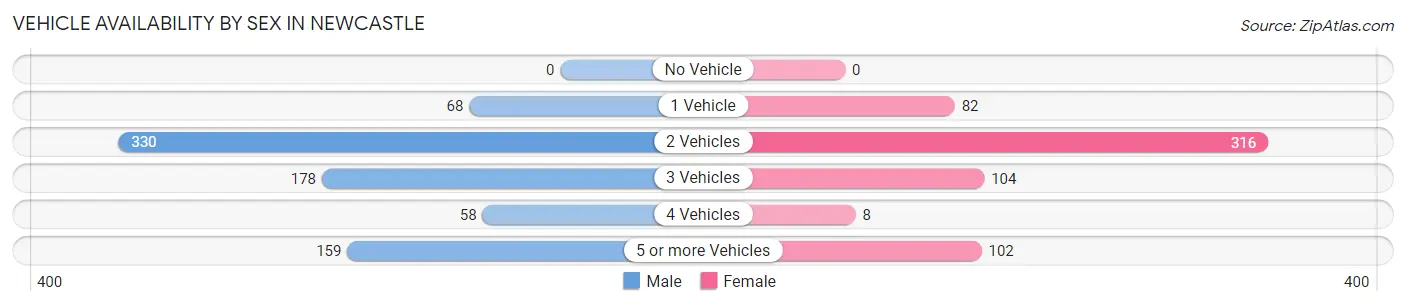
| Vehicles Available | Male | Female |
| No Vehicle | 0 (0.0%) | 0 (0.0%) |
| 1 Vehicle | 68 (8.6%) | 82 (13.4%) |
| 2 Vehicles | 330 (41.6%) | 316 (51.6%) |
| 3 Vehicles | 178 (22.5%) | 104 (17.0%) |
| 4 Vehicles | 58 (7.3%) | 8 (1.3%) |
| 5 or more Vehicles | 159 (20.1%) | 102 (16.7%) |
| Total | 793 (100.0%) | 612 (100.0%) |
Commute Time in Newcastle
The most frequently occuring commute durations in Newcastle are 5 to 9 minutes (464 commuters, 33.8%), less than 5 minutes (270 commuters, 19.7%), and 10 to 14 minutes (210 commuters, 15.3%).
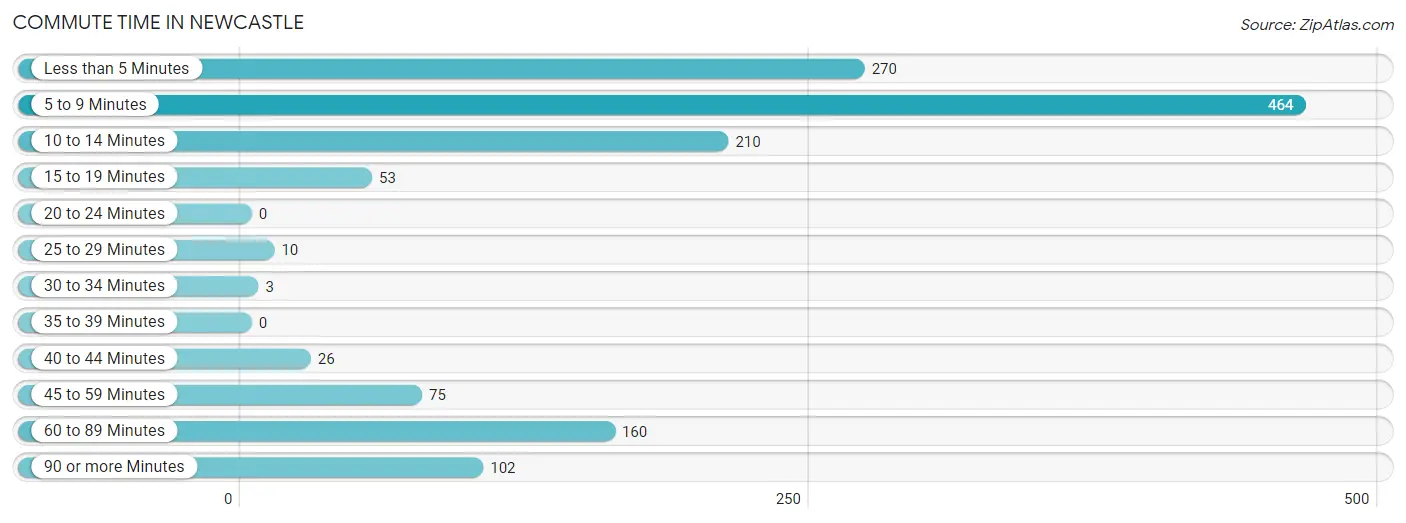
| Commute Time | # Commuters | % Commuters |
| Less than 5 Minutes | 270 | 19.7% |
| 5 to 9 Minutes | 464 | 33.8% |
| 10 to 14 Minutes | 210 | 15.3% |
| 15 to 19 Minutes | 53 | 3.9% |
| 20 to 24 Minutes | 0 | 0.0% |
| 25 to 29 Minutes | 10 | 0.7% |
| 30 to 34 Minutes | 3 | 0.2% |
| 35 to 39 Minutes | 0 | 0.0% |
| 40 to 44 Minutes | 26 | 1.9% |
| 45 to 59 Minutes | 75 | 5.5% |
| 60 to 89 Minutes | 160 | 11.7% |
| 90 or more Minutes | 102 | 7.4% |
Commute Time by Sex in Newcastle
The most common commute times in Newcastle are 5 to 9 minutes (267 commuters, 35.1%) for males and 5 to 9 minutes (197 commuters, 32.2%) for females.
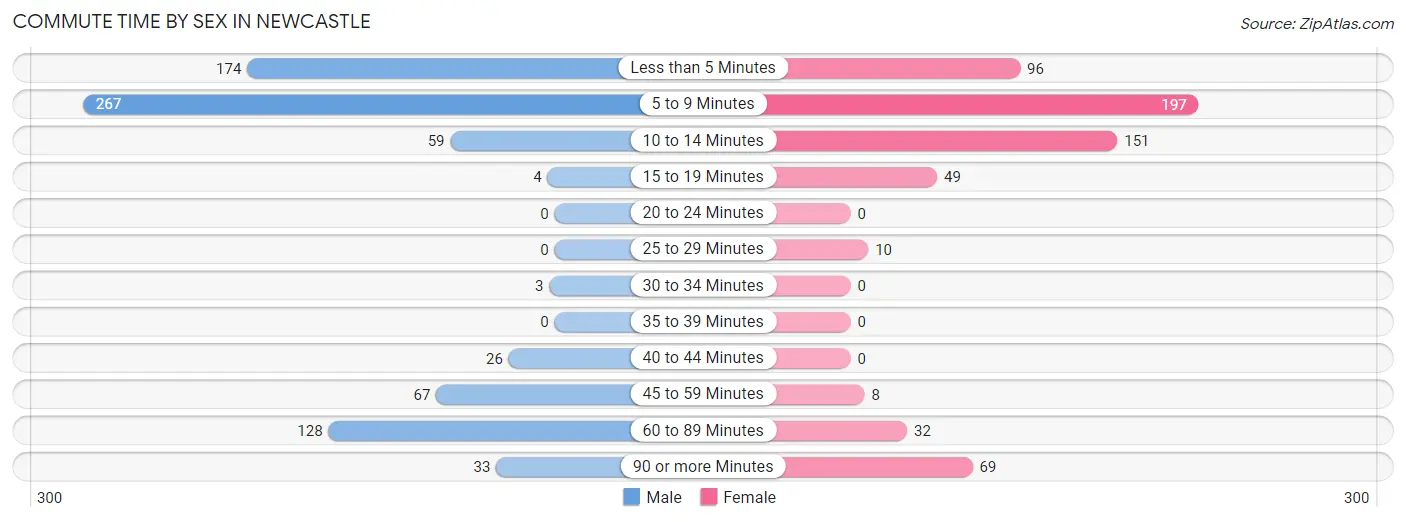
| Commute Time | Male | Female |
| Less than 5 Minutes | 174 (22.9%) | 96 (15.7%) |
| 5 to 9 Minutes | 267 (35.1%) | 197 (32.2%) |
| 10 to 14 Minutes | 59 (7.7%) | 151 (24.7%) |
| 15 to 19 Minutes | 4 (0.5%) | 49 (8.0%) |
| 20 to 24 Minutes | 0 (0.0%) | 0 (0.0%) |
| 25 to 29 Minutes | 0 (0.0%) | 10 (1.6%) |
| 30 to 34 Minutes | 3 (0.4%) | 0 (0.0%) |
| 35 to 39 Minutes | 0 (0.0%) | 0 (0.0%) |
| 40 to 44 Minutes | 26 (3.4%) | 0 (0.0%) |
| 45 to 59 Minutes | 67 (8.8%) | 8 (1.3%) |
| 60 to 89 Minutes | 128 (16.8%) | 32 (5.2%) |
| 90 or more Minutes | 33 (4.3%) | 69 (11.3%) |
Time of Departure to Work by Sex in Newcastle
The most frequent times of departure to work in Newcastle are 4:00 PM to 11:59 PM (137, 18.0%) for males and 7:30 AM to 7:59 AM (140, 22.9%) for females.
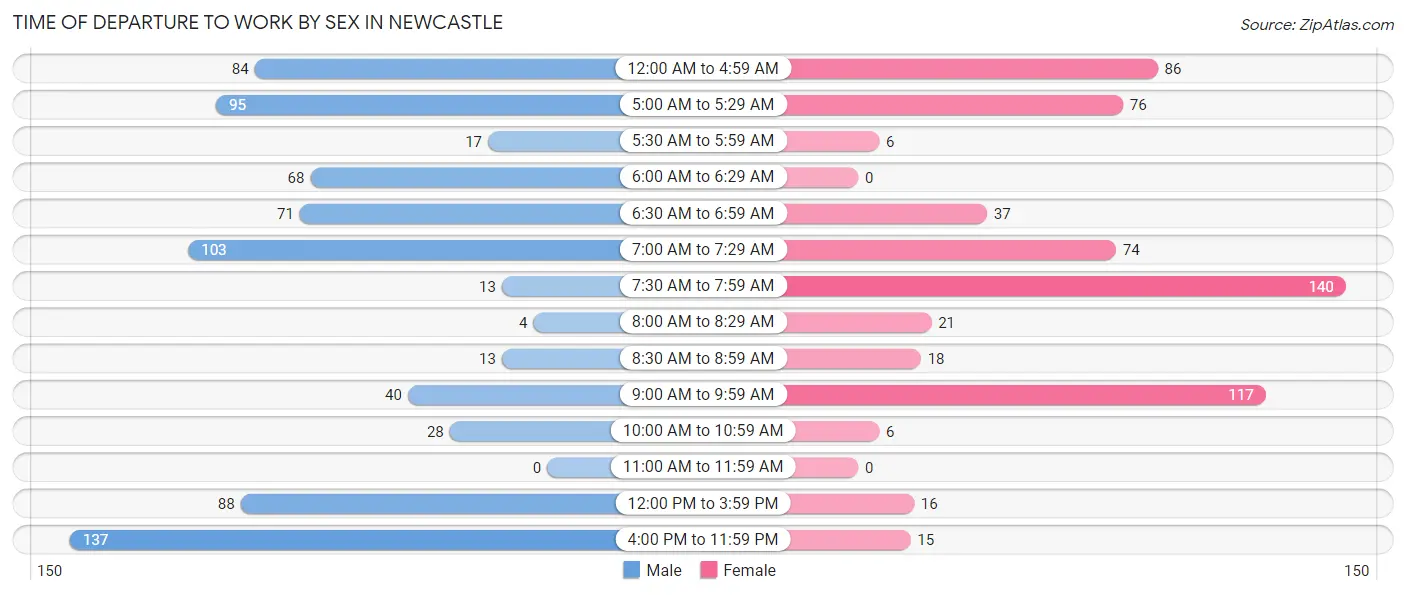
| Time of Departure | Male | Female |
| 12:00 AM to 4:59 AM | 84 (11.0%) | 86 (14.1%) |
| 5:00 AM to 5:29 AM | 95 (12.5%) | 76 (12.4%) |
| 5:30 AM to 5:59 AM | 17 (2.2%) | 6 (1.0%) |
| 6:00 AM to 6:29 AM | 68 (8.9%) | 0 (0.0%) |
| 6:30 AM to 6:59 AM | 71 (9.3%) | 37 (6.0%) |
| 7:00 AM to 7:29 AM | 103 (13.5%) | 74 (12.1%) |
| 7:30 AM to 7:59 AM | 13 (1.7%) | 140 (22.9%) |
| 8:00 AM to 8:29 AM | 4 (0.5%) | 21 (3.4%) |
| 8:30 AM to 8:59 AM | 13 (1.7%) | 18 (2.9%) |
| 9:00 AM to 9:59 AM | 40 (5.3%) | 117 (19.1%) |
| 10:00 AM to 10:59 AM | 28 (3.7%) | 6 (1.0%) |
| 11:00 AM to 11:59 AM | 0 (0.0%) | 0 (0.0%) |
| 12:00 PM to 3:59 PM | 88 (11.6%) | 16 (2.6%) |
| 4:00 PM to 11:59 PM | 137 (18.0%) | 15 (2.5%) |
| Total | 761 (100.0%) | 612 (100.0%) |
Housing Occupancy in Newcastle
Occupancy by Ownership in Newcastle
Of the total 1,028 dwellings in Newcastle, owner-occupied units account for 891 (86.7%), while renter-occupied units make up 137 (13.3%).
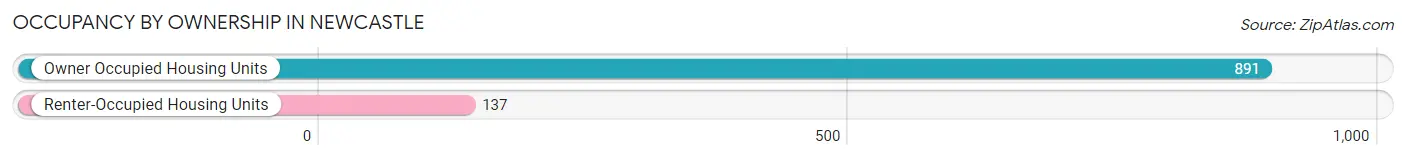
| Occupancy | # Housing Units | % Housing Units |
| Owner Occupied Housing Units | 891 | 86.7% |
| Renter-Occupied Housing Units | 137 | 13.3% |
| Total Occupied Housing Units | 1,028 | 100.0% |
Occupancy by Household Size in Newcastle
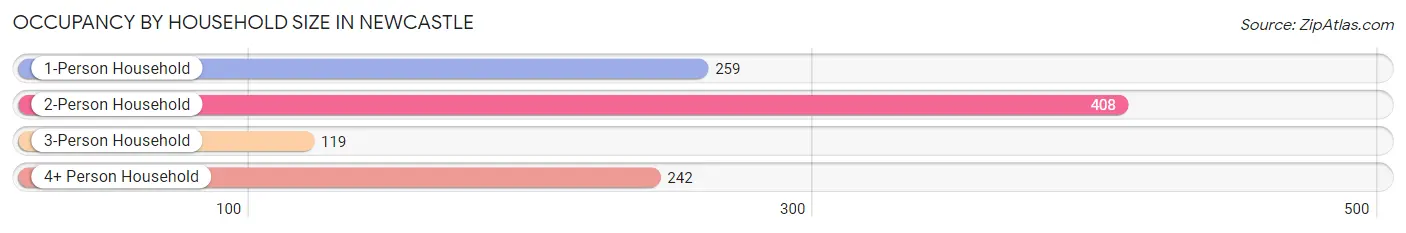
| Household Size | # Housing Units | % Housing Units |
| 1-Person Household | 259 | 25.2% |
| 2-Person Household | 408 | 39.7% |
| 3-Person Household | 119 | 11.6% |
| 4+ Person Household | 242 | 23.5% |
| Total Housing Units | 1,028 | 100.0% |
Occupancy by Ownership by Household Size in Newcastle
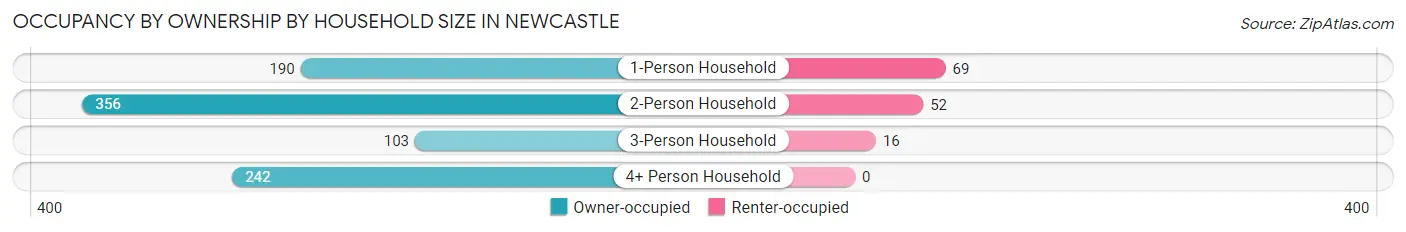
| Household Size | Owner-occupied | Renter-occupied |
| 1-Person Household | 190 (73.4%) | 69 (26.6%) |
| 2-Person Household | 356 (87.3%) | 52 (12.8%) |
| 3-Person Household | 103 (86.6%) | 16 (13.5%) |
| 4+ Person Household | 242 (100.0%) | 0 (0.0%) |
| Total Housing Units | 891 (86.7%) | 137 (13.3%) |
Occupancy by Educational Attainment in Newcastle
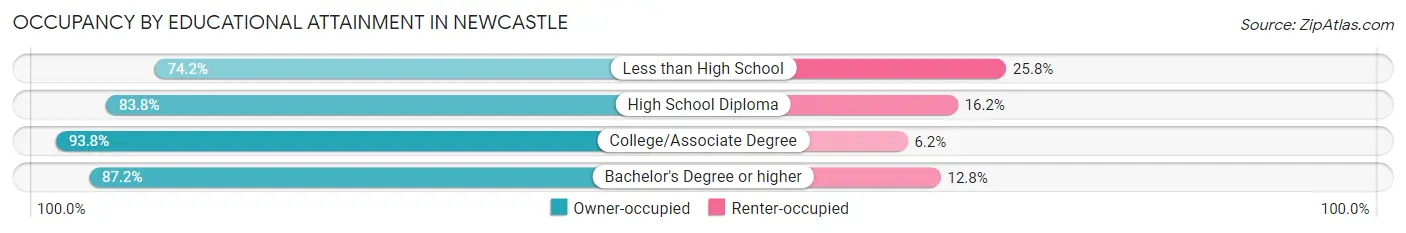
| Household Size | Owner-occupied | Renter-occupied |
| Less than High School | 72 (74.2%) | 25 (25.8%) |
| High School Diploma | 301 (83.8%) | 58 (16.2%) |
| College/Associate Degree | 272 (93.8%) | 18 (6.2%) |
| Bachelor's Degree or higher | 246 (87.2%) | 36 (12.8%) |
Occupancy by Age of Householder in Newcastle
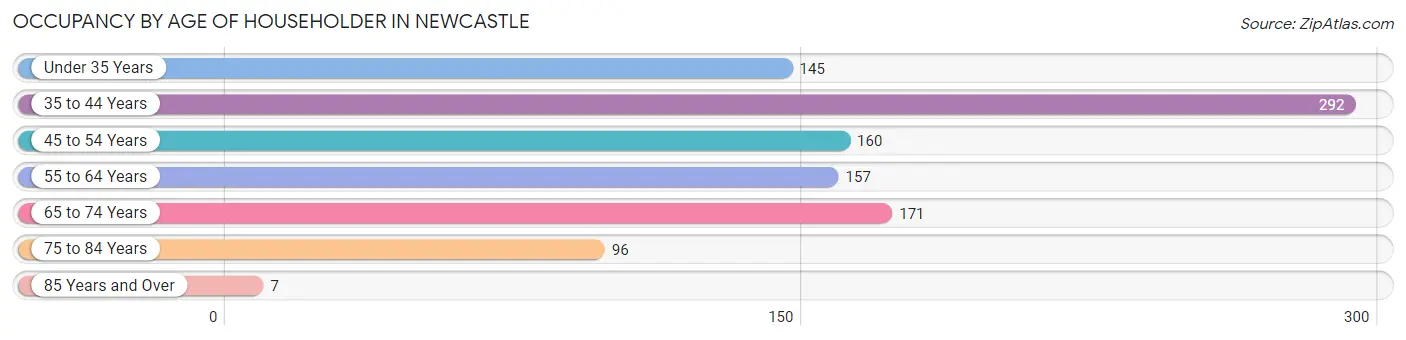
| Age Bracket | # Households | % Households |
| Under 35 Years | 145 | 14.1% |
| 35 to 44 Years | 292 | 28.4% |
| 45 to 54 Years | 160 | 15.6% |
| 55 to 64 Years | 157 | 15.3% |
| 65 to 74 Years | 171 | 16.6% |
| 75 to 84 Years | 96 | 9.3% |
| 85 Years and Over | 7 | 0.7% |
| Total | 1,028 | 100.0% |
Housing Finances in Newcastle
Median Income by Occupancy in Newcastle
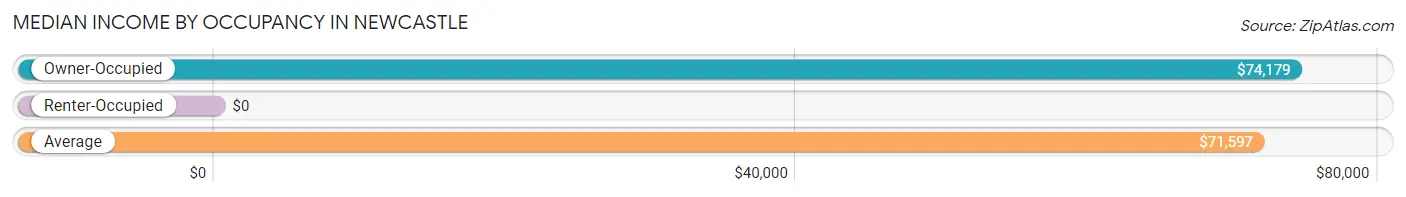
| Occupancy Type | # Households | Median Income |
| Owner-Occupied | 891 (86.7%) | $74,179 |
| Renter-Occupied | 137 (13.3%) | $0 |
| Average | 1,028 (100.0%) | $71,597 |
Occupancy by Householder Income Bracket in Newcastle
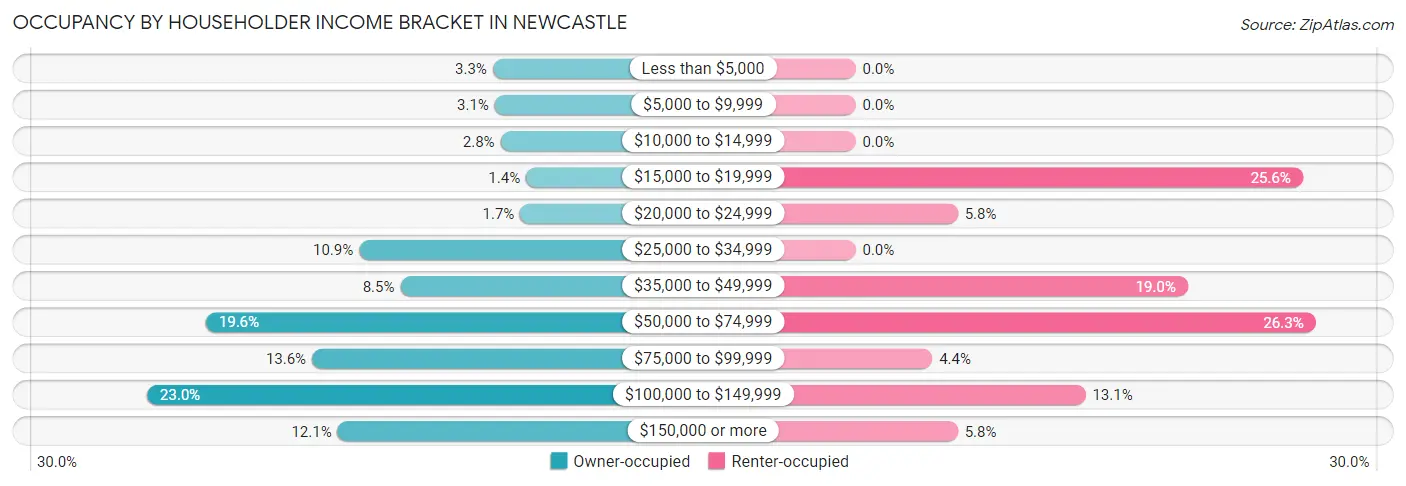
| Income Bracket | Owner-occupied | Renter-occupied |
| Less than $5,000 | 29 (3.3%) | 0 (0.0%) |
| $5,000 to $9,999 | 28 (3.1%) | 0 (0.0%) |
| $10,000 to $14,999 | 25 (2.8%) | 0 (0.0%) |
| $15,000 to $19,999 | 12 (1.3%) | 35 (25.6%) |
| $20,000 to $24,999 | 15 (1.7%) | 8 (5.8%) |
| $25,000 to $34,999 | 97 (10.9%) | 0 (0.0%) |
| $35,000 to $49,999 | 76 (8.5%) | 26 (19.0%) |
| $50,000 to $74,999 | 175 (19.6%) | 36 (26.3%) |
| $75,000 to $99,999 | 121 (13.6%) | 6 (4.4%) |
| $100,000 to $149,999 | 205 (23.0%) | 18 (13.1%) |
| $150,000 or more | 108 (12.1%) | 8 (5.8%) |
| Total | 891 (100.0%) | 137 (100.0%) |
Monthly Housing Cost Tiers in Newcastle
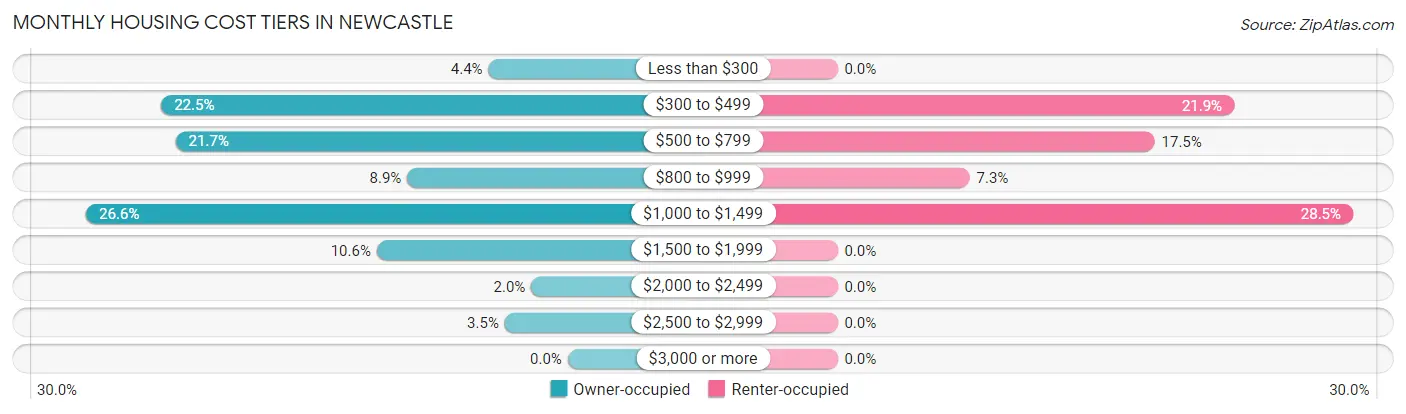
| Monthly Cost | Owner-occupied | Renter-occupied |
| Less than $300 | 39 (4.4%) | 0 (0.0%) |
| $300 to $499 | 200 (22.5%) | 30 (21.9%) |
| $500 to $799 | 193 (21.7%) | 24 (17.5%) |
| $800 to $999 | 79 (8.9%) | 10 (7.3%) |
| $1,000 to $1,499 | 237 (26.6%) | 39 (28.5%) |
| $1,500 to $1,999 | 94 (10.5%) | 0 (0.0%) |
| $2,000 to $2,499 | 18 (2.0%) | 0 (0.0%) |
| $2,500 to $2,999 | 31 (3.5%) | 0 (0.0%) |
| $3,000 or more | 0 (0.0%) | 0 (0.0%) |
| Total | 891 (100.0%) | 137 (100.0%) |
Physical Housing Characteristics in Newcastle
Housing Structures in Newcastle
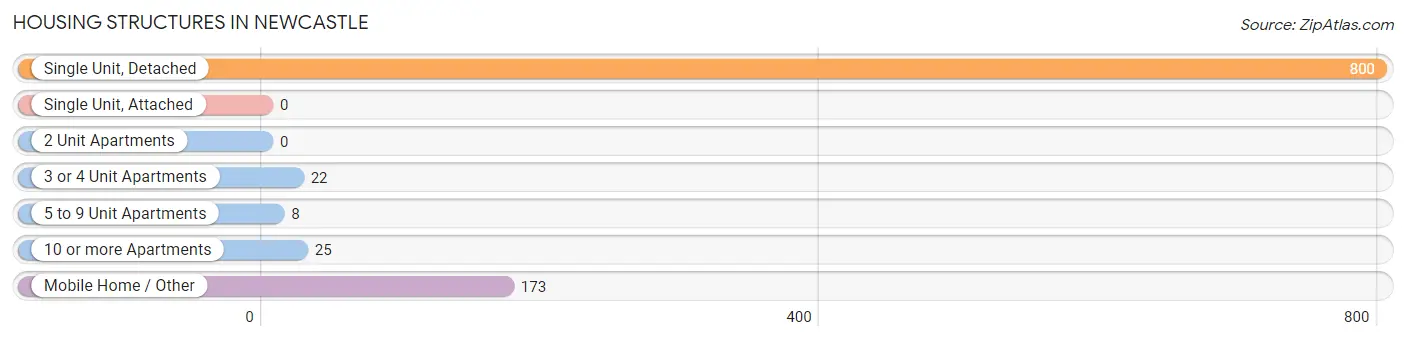
| Structure Type | # Housing Units | % Housing Units |
| Single Unit, Detached | 800 | 77.8% |
| Single Unit, Attached | 0 | 0.0% |
| 2 Unit Apartments | 0 | 0.0% |
| 3 or 4 Unit Apartments | 22 | 2.1% |
| 5 to 9 Unit Apartments | 8 | 0.8% |
| 10 or more Apartments | 25 | 2.4% |
| Mobile Home / Other | 173 | 16.8% |
| Total | 1,028 | 100.0% |
Housing Structures by Occupancy in Newcastle

| Structure Type | Owner-occupied | Renter-occupied |
| Single Unit, Detached | 718 (89.7%) | 82 (10.2%) |
| Single Unit, Attached | 0 (0.0%) | 0 (0.0%) |
| 2 Unit Apartments | 0 (0.0%) | 0 (0.0%) |
| 3 or 4 Unit Apartments | 0 (0.0%) | 22 (100.0%) |
| 5 to 9 Unit Apartments | 0 (0.0%) | 8 (100.0%) |
| 10 or more Apartments | 0 (0.0%) | 25 (100.0%) |
| Mobile Home / Other | 173 (100.0%) | 0 (0.0%) |
| Total | 891 (86.7%) | 137 (13.3%) |
Housing Structures by Number of Rooms in Newcastle
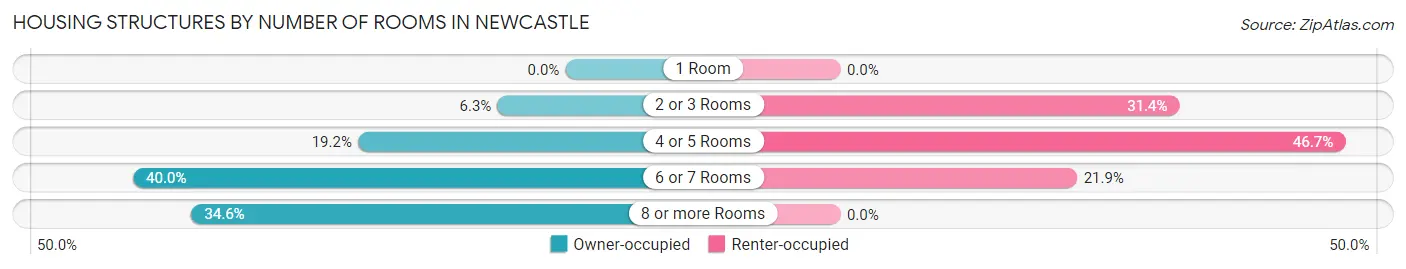
| Number of Rooms | Owner-occupied | Renter-occupied |
| 1 Room | 0 (0.0%) | 0 (0.0%) |
| 2 or 3 Rooms | 56 (6.3%) | 43 (31.4%) |
| 4 or 5 Rooms | 171 (19.2%) | 64 (46.7%) |
| 6 or 7 Rooms | 356 (40.0%) | 30 (21.9%) |
| 8 or more Rooms | 308 (34.6%) | 0 (0.0%) |
| Total | 891 (100.0%) | 137 (100.0%) |
Housing Structure by Heating Type in Newcastle
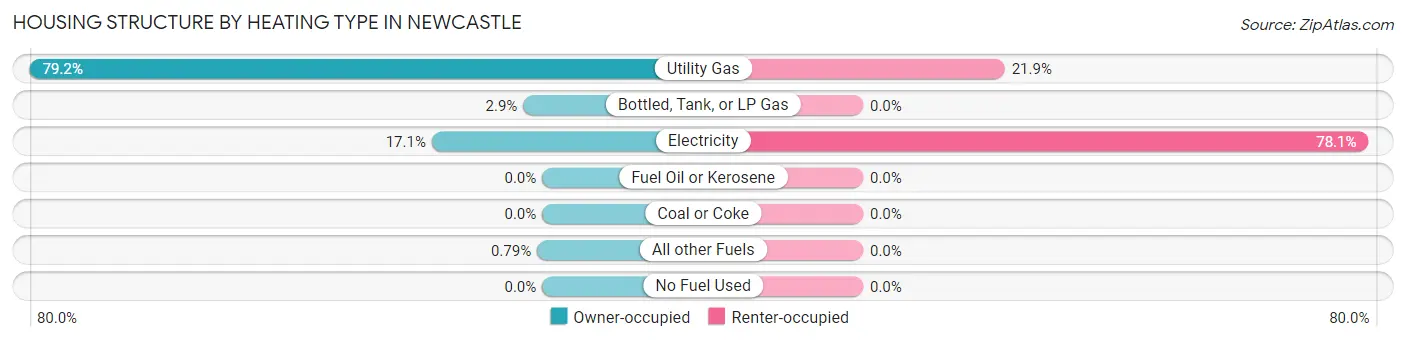
| Heating Type | Owner-occupied | Renter-occupied |
| Utility Gas | 706 (79.2%) | 30 (21.9%) |
| Bottled, Tank, or LP Gas | 26 (2.9%) | 0 (0.0%) |
| Electricity | 152 (17.1%) | 107 (78.1%) |
| Fuel Oil or Kerosene | 0 (0.0%) | 0 (0.0%) |
| Coal or Coke | 0 (0.0%) | 0 (0.0%) |
| All other Fuels | 7 (0.8%) | 0 (0.0%) |
| No Fuel Used | 0 (0.0%) | 0 (0.0%) |
| Total | 891 (100.0%) | 137 (100.0%) |
Household Vehicle Usage in Newcastle
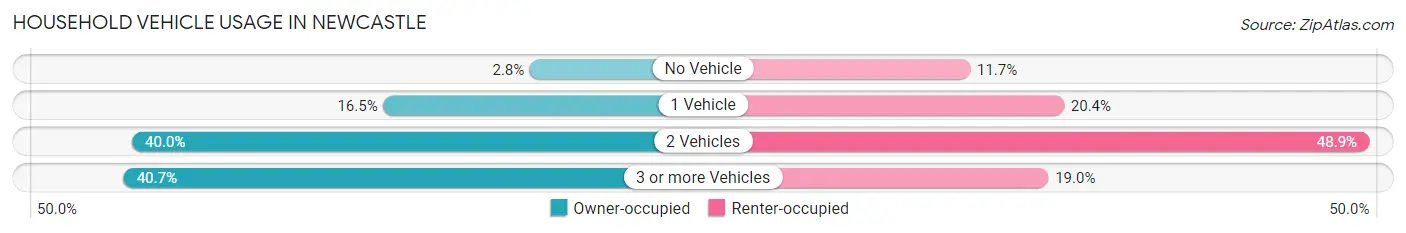
| Vehicles per Household | Owner-occupied | Renter-occupied |
| No Vehicle | 25 (2.8%) | 16 (11.7%) |
| 1 Vehicle | 147 (16.5%) | 28 (20.4%) |
| 2 Vehicles | 356 (40.0%) | 67 (48.9%) |
| 3 or more Vehicles | 363 (40.7%) | 26 (19.0%) |
| Total | 891 (100.0%) | 137 (100.0%) |
Real Estate & Mortgages in Newcastle
Real Estate and Mortgage Overview in Newcastle
| Characteristic | Without Mortgage | With Mortgage |
| Housing Units | 519 | 372 |
| Median Property Value | $190,800 | $167,900 |
| Median Household Income | $65,028 | $35 |
| Monthly Housing Costs | $515 | $0 |
| Real Estate Taxes | $1,158 | $9 |
Property Value by Mortgage Status in Newcastle
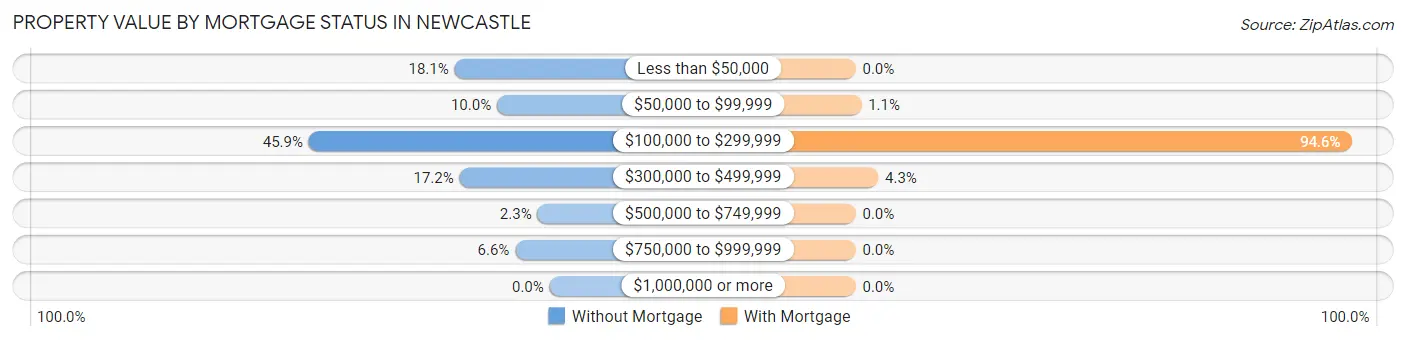
| Property Value | Without Mortgage | With Mortgage |
| Less than $50,000 | 94 (18.1%) | 0 (0.0%) |
| $50,000 to $99,999 | 52 (10.0%) | 4 (1.1%) |
| $100,000 to $299,999 | 238 (45.9%) | 352 (94.6%) |
| $300,000 to $499,999 | 89 (17.2%) | 16 (4.3%) |
| $500,000 to $749,999 | 12 (2.3%) | 0 (0.0%) |
| $750,000 to $999,999 | 34 (6.6%) | 0 (0.0%) |
| $1,000,000 or more | 0 (0.0%) | 0 (0.0%) |
| Total | 519 (100.0%) | 372 (100.0%) |
Household Income by Mortgage Status in Newcastle
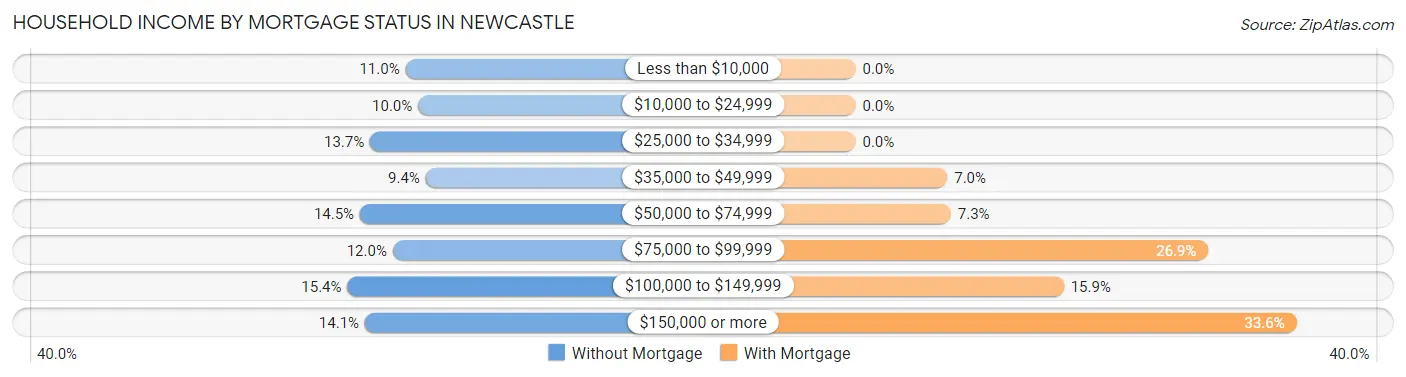
| Household Income | Without Mortgage | With Mortgage |
| Less than $10,000 | 57 (11.0%) | 0 (0.0%) |
| $10,000 to $24,999 | 52 (10.0%) | 0 (0.0%) |
| $25,000 to $34,999 | 71 (13.7%) | 0 (0.0%) |
| $35,000 to $49,999 | 49 (9.4%) | 26 (7.0%) |
| $50,000 to $74,999 | 75 (14.4%) | 27 (7.3%) |
| $75,000 to $99,999 | 62 (11.9%) | 100 (26.9%) |
| $100,000 to $149,999 | 80 (15.4%) | 59 (15.9%) |
| $150,000 or more | 73 (14.1%) | 125 (33.6%) |
| Total | 519 (100.0%) | 372 (100.0%) |
Property Value to Household Income Ratio in Newcastle
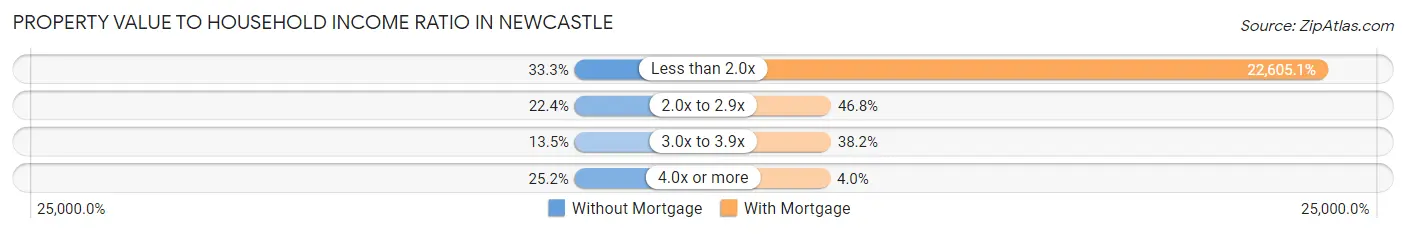
| Value-to-Income Ratio | Without Mortgage | With Mortgage |
| Less than 2.0x | 173 (33.3%) | 84,091 (22,605.1%) |
| 2.0x to 2.9x | 116 (22.4%) | 174 (46.8%) |
| 3.0x to 3.9x | 70 (13.5%) | 142 (38.2%) |
| 4.0x or more | 131 (25.2%) | 15 (4.0%) |
| Total | 519 (100.0%) | 372 (100.0%) |
Real Estate Taxes by Mortgage Status in Newcastle
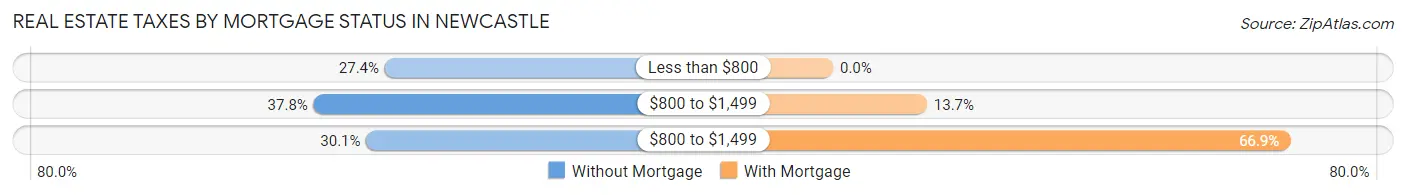
| Property Taxes | Without Mortgage | With Mortgage |
| Less than $800 | 142 (27.4%) | 0 (0.0%) |
| $800 to $1,499 | 196 (37.8%) | 51 (13.7%) |
| $800 to $1,499 | 156 (30.1%) | 249 (66.9%) |
| Total | 519 (100.0%) | 372 (100.0%) |
Health & Disability in Newcastle
Health Insurance Coverage by Age in Newcastle
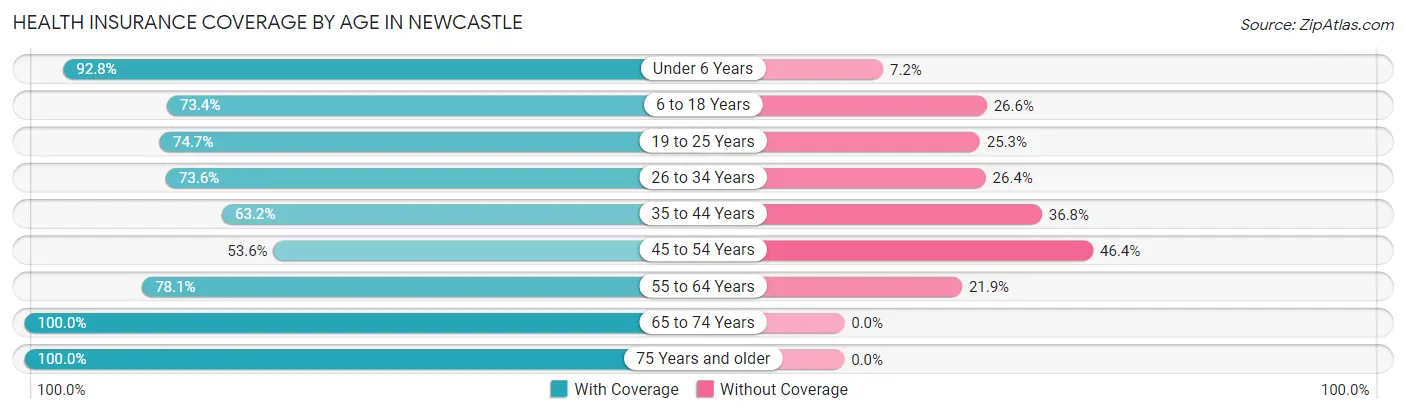
| Age Bracket | With Coverage | Without Coverage |
| Under 6 Years | 141 (92.8%) | 11 (7.2%) |
| 6 to 18 Years | 506 (73.4%) | 183 (26.6%) |
| 19 to 25 Years | 263 (74.7%) | 89 (25.3%) |
| 26 to 34 Years | 257 (73.6%) | 92 (26.4%) |
| 35 to 44 Years | 300 (63.2%) | 175 (36.8%) |
| 45 to 54 Years | 119 (53.6%) | 103 (46.4%) |
| 55 to 64 Years | 242 (78.1%) | 68 (21.9%) |
| 65 to 74 Years | 242 (100.0%) | 0 (0.0%) |
| 75 Years and older | 237 (100.0%) | 0 (0.0%) |
| Total | 2,307 (76.2%) | 721 (23.8%) |
Health Insurance Coverage by Citizenship Status in Newcastle
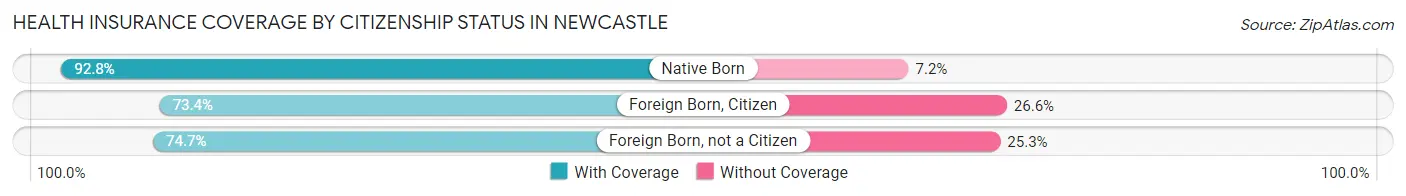
| Citizenship Status | With Coverage | Without Coverage |
| Native Born | 141 (92.8%) | 11 (7.2%) |
| Foreign Born, Citizen | 506 (73.4%) | 183 (26.6%) |
| Foreign Born, not a Citizen | 263 (74.7%) | 89 (25.3%) |
Health Insurance Coverage by Household Income in Newcastle
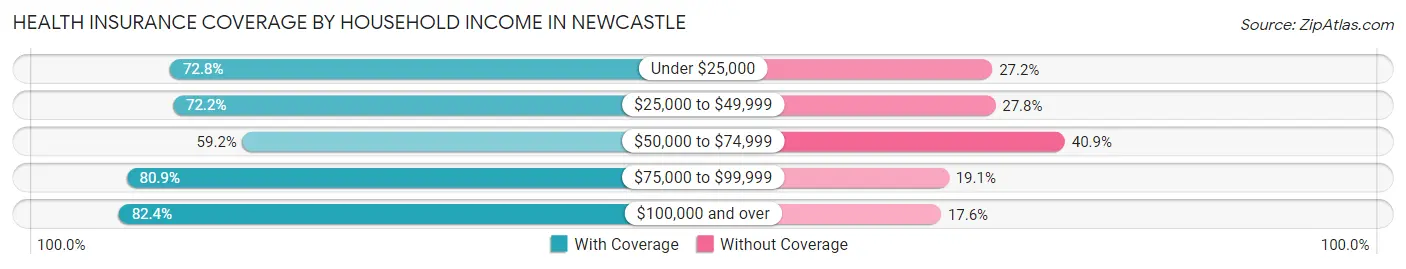
| Household Income | With Coverage | Without Coverage |
| Under $25,000 | 187 (72.8%) | 70 (27.2%) |
| $25,000 to $49,999 | 301 (72.2%) | 116 (27.8%) |
| $50,000 to $74,999 | 291 (59.2%) | 201 (40.8%) |
| $75,000 to $99,999 | 305 (80.9%) | 72 (19.1%) |
| $100,000 and over | 1,223 (82.4%) | 262 (17.6%) |
Public vs Private Health Insurance Coverage by Age in Newcastle
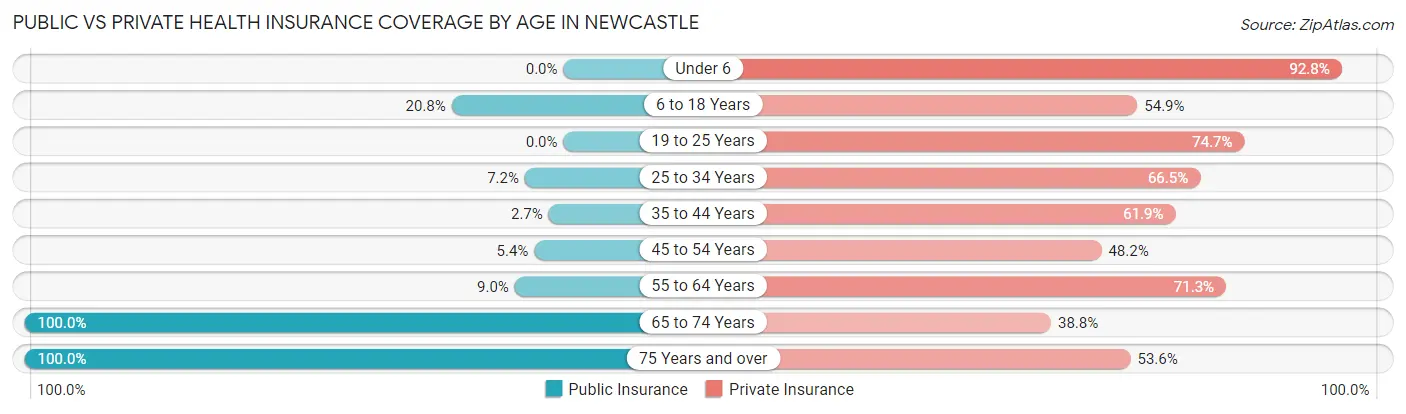
| Age Bracket | Public Insurance | Private Insurance |
| Under 6 | 0 (0.0%) | 141 (92.8%) |
| 6 to 18 Years | 143 (20.7%) | 378 (54.9%) |
| 19 to 25 Years | 0 (0.0%) | 263 (74.7%) |
| 25 to 34 Years | 25 (7.2%) | 232 (66.5%) |
| 35 to 44 Years | 13 (2.7%) | 294 (61.9%) |
| 45 to 54 Years | 12 (5.4%) | 107 (48.2%) |
| 55 to 64 Years | 28 (9.0%) | 221 (71.3%) |
| 65 to 74 Years | 242 (100.0%) | 94 (38.8%) |
| 75 Years and over | 237 (100.0%) | 127 (53.6%) |
| Total | 700 (23.1%) | 1,857 (61.3%) |
Disability Status by Sex by Age in Newcastle
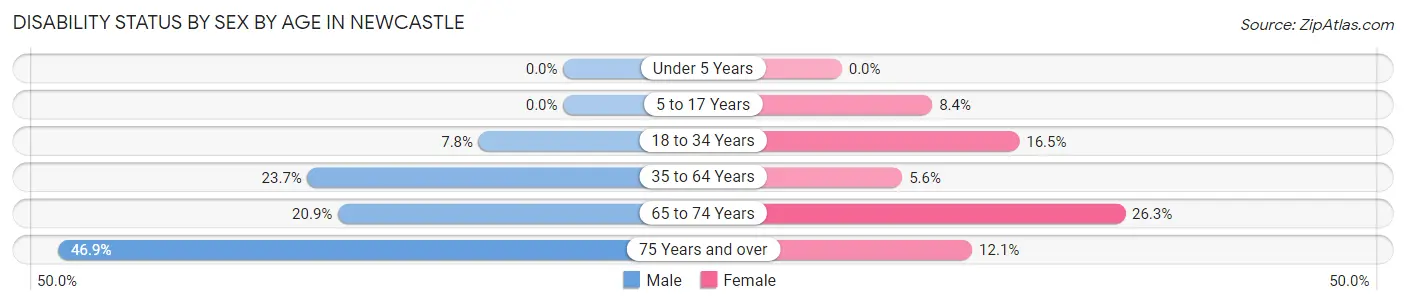
| Age Bracket | Male | Female |
| Under 5 Years | 0 (0.0%) | 0 (0.0%) |
| 5 to 17 Years | 0 (0.0%) | 27 (8.4%) |
| 18 to 34 Years | 33 (7.8%) | 55 (16.5%) |
| 35 to 64 Years | 112 (23.7%) | 30 (5.6%) |
| 65 to 74 Years | 14 (20.9%) | 46 (26.3%) |
| 75 Years and over | 53 (46.9%) | 15 (12.1%) |
Disability Class by Sex by Age in Newcastle
Disability Class: Hearing Difficulty
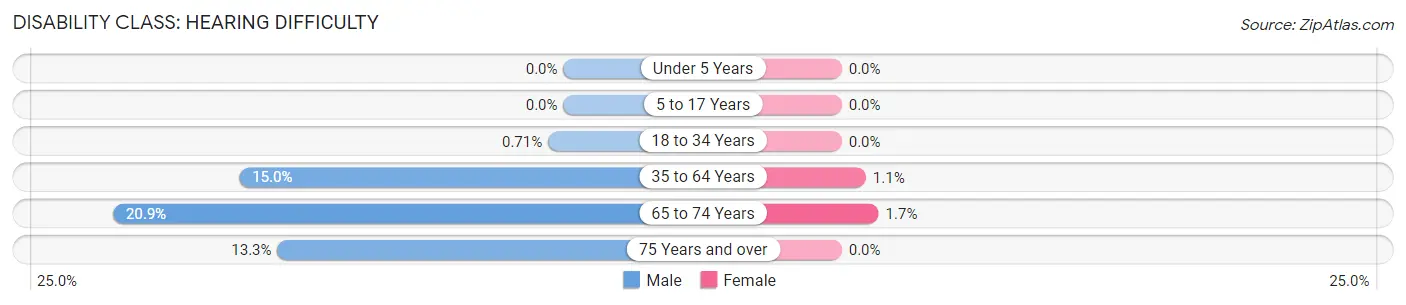
| Age Bracket | Male | Female |
| Under 5 Years | 0 (0.0%) | 0 (0.0%) |
| 5 to 17 Years | 0 (0.0%) | 0 (0.0%) |
| 18 to 34 Years | 3 (0.7%) | 0 (0.0%) |
| 35 to 64 Years | 71 (15.0%) | 6 (1.1%) |
| 65 to 74 Years | 14 (20.9%) | 3 (1.7%) |
| 75 Years and over | 15 (13.3%) | 0 (0.0%) |
Disability Class: Vision Difficulty
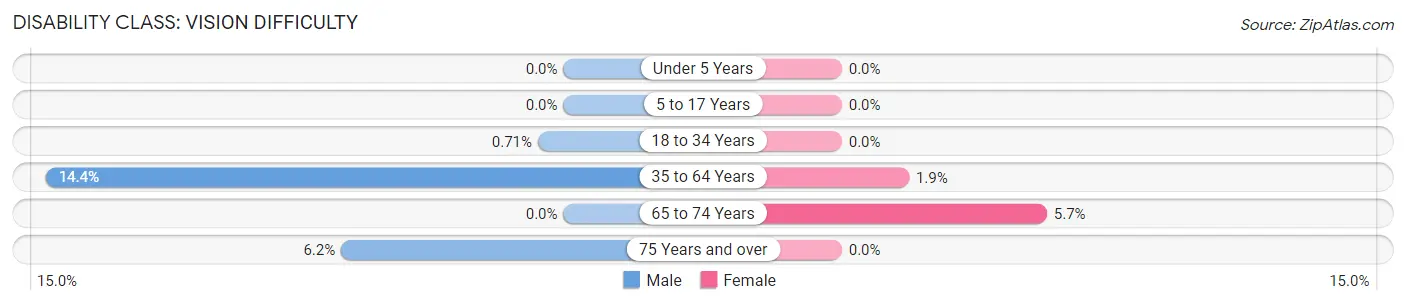
| Age Bracket | Male | Female |
| Under 5 Years | 0 (0.0%) | 0 (0.0%) |
| 5 to 17 Years | 0 (0.0%) | 0 (0.0%) |
| 18 to 34 Years | 3 (0.7%) | 0 (0.0%) |
| 35 to 64 Years | 68 (14.4%) | 10 (1.9%) |
| 65 to 74 Years | 0 (0.0%) | 10 (5.7%) |
| 75 Years and over | 7 (6.2%) | 0 (0.0%) |
Disability Class: Cognitive Difficulty
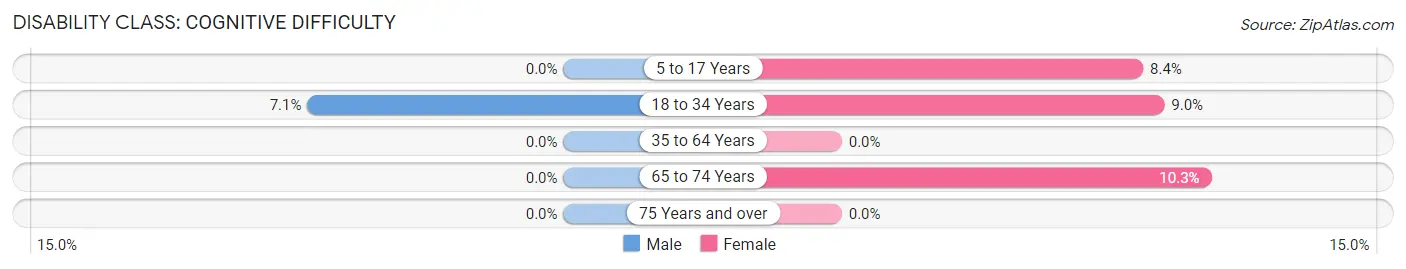
| Age Bracket | Male | Female |
| 5 to 17 Years | 0 (0.0%) | 27 (8.4%) |
| 18 to 34 Years | 30 (7.1%) | 30 (9.0%) |
| 35 to 64 Years | 0 (0.0%) | 0 (0.0%) |
| 65 to 74 Years | 0 (0.0%) | 18 (10.3%) |
| 75 Years and over | 0 (0.0%) | 0 (0.0%) |
Disability Class: Ambulatory Difficulty
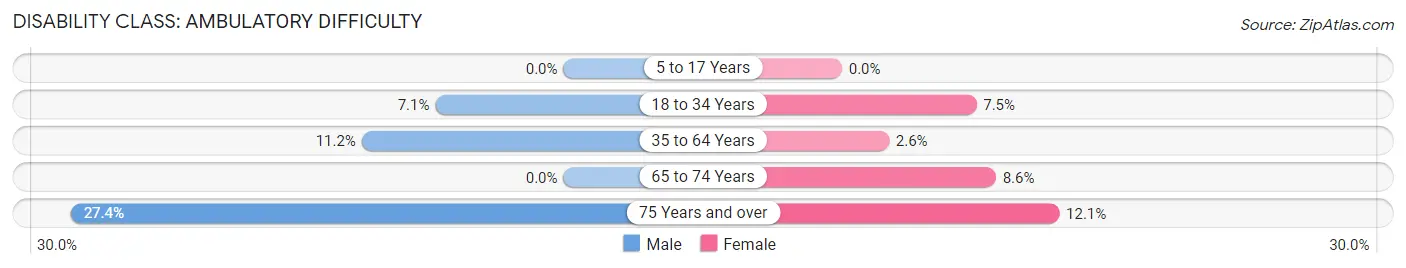
| Age Bracket | Male | Female |
| 5 to 17 Years | 0 (0.0%) | 0 (0.0%) |
| 18 to 34 Years | 30 (7.1%) | 25 (7.5%) |
| 35 to 64 Years | 53 (11.2%) | 14 (2.6%) |
| 65 to 74 Years | 0 (0.0%) | 15 (8.6%) |
| 75 Years and over | 31 (27.4%) | 15 (12.1%) |
Disability Class: Self-Care Difficulty
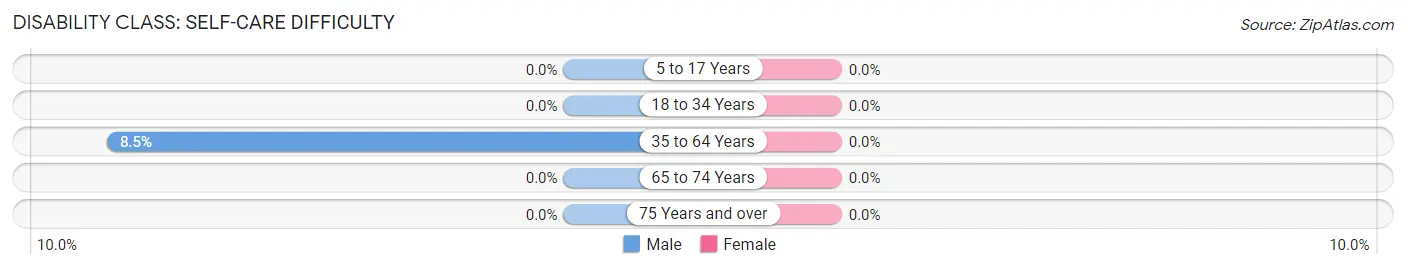
| Age Bracket | Male | Female |
| 5 to 17 Years | 0 (0.0%) | 0 (0.0%) |
| 18 to 34 Years | 0 (0.0%) | 0 (0.0%) |
| 35 to 64 Years | 40 (8.5%) | 0 (0.0%) |
| 65 to 74 Years | 0 (0.0%) | 0 (0.0%) |
| 75 Years and over | 0 (0.0%) | 0 (0.0%) |
Technology Access in Newcastle
Computing Device Access in Newcastle
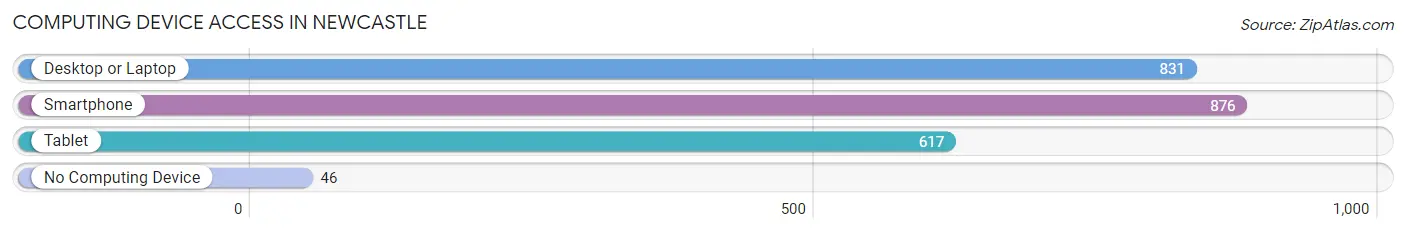
| Device Type | # Households | % Households |
| Desktop or Laptop | 831 | 80.8% |
| Smartphone | 876 | 85.2% |
| Tablet | 617 | 60.0% |
| No Computing Device | 46 | 4.5% |
| Total | 1,028 | 100.0% |
Internet Access in Newcastle
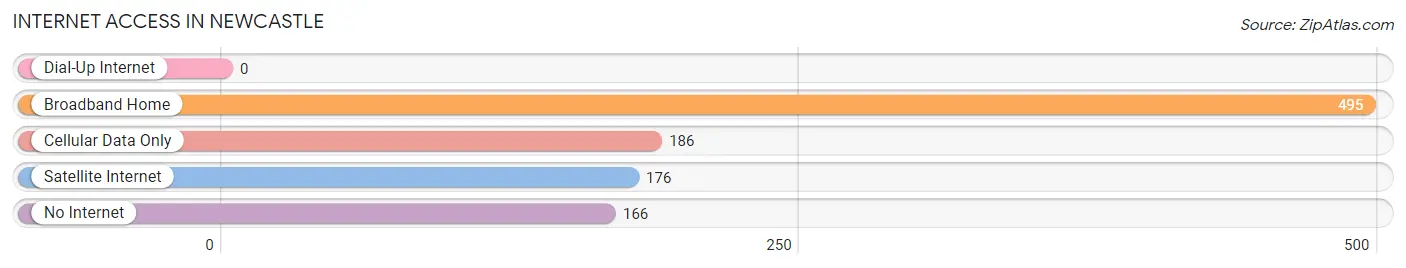
| Internet Type | # Households | % Households |
| Dial-Up Internet | 0 | 0.0% |
| Broadband Home | 495 | 48.1% |
| Cellular Data Only | 186 | 18.1% |
| Satellite Internet | 176 | 17.1% |
| No Internet | 166 | 16.2% |
| Total | 1,028 | 100.0% |
Newcastle Summary
Newcastle is a small town located in Weston County, Wyoming, United States. It is situated in the northeastern corner of the state, near the South Dakota border. The town was founded in 1892 and has a population of approximately 3,000 people.
Geography
Newcastle is located in the Black Hills region of Wyoming, at the intersection of Interstate 90 and US Highway 85. The town is situated in a valley surrounded by the Black Hills, which are part of the Rocky Mountains. The town is located at an elevation of 4,890 feet (1,490 m). The climate is semi-arid, with hot summers and cold winters.
Economy
The economy of Newcastle is largely based on agriculture and tourism. The town is home to several large ranches, which produce beef, sheep, and hay. The town is also a popular tourist destination, with visitors coming to enjoy the scenery and outdoor activities such as fishing, hunting, and camping.
Demographics
As of the 2010 census, the population of Newcastle was 3,068. The racial makeup of the town was 95.3% White, 0.3% African American, 0.7% Native American, 0.3% Asian, 0.1% Pacific Islander, 1.2% from other races, and 2.3% from two or more races. Hispanic or Latino of any race were 4.2% of the population.
The median income for a household in the town was $37,917, and the median income for a family was $45,000. Males had a median income of $31,250 versus $20,000 for females. The per capita income for the town was $17,845. About 8.3% of families and 11.2% of the population were below the poverty line, including 14.3% of those under age 18 and 8.2% of those age 65 or over.
History
Newcastle was founded in 1892 by a group of settlers from Nebraska. The town was named after Newcastle, Nebraska, the hometown of the settlers. The town quickly grew, and by 1900 it had a population of over 1,000 people.
In the early 1900s, Newcastle was a bustling town with several businesses, including a bank, a hotel, a newspaper, and a movie theater. The town was also home to several churches, including the First Presbyterian Church, which was founded in 1902.
In the 1920s, Newcastle experienced a period of economic decline. The Great Depression hit the town hard, and many businesses closed. The town was able to recover in the 1940s, when the nearby coal mines began to produce coal for the war effort.
In the 1950s, Newcastle experienced a period of growth. The town was home to several new businesses, including a hospital, a library, and a shopping center. The town also experienced a population boom, with the population reaching over 3,000 by the end of the decade.
Today, Newcastle is a small but vibrant town. The town is home to several businesses, including a grocery store, a hardware store, and a restaurant. The town is also home to several churches, including the First Presbyterian Church, which is still active today. The town is also a popular tourist destination, with visitors coming to enjoy the scenery and outdoor activities.
Common Questions
What is Per Capita Income in Newcastle?
Per Capita income in Newcastle is $30,038.
What is the Median Family Income in Newcastle?
Median Family Income in Newcastle is $74,718.
What is the Median Household income in Newcastle?
Median Household Income in Newcastle is $71,597.
What is Income or Wage Gap in Newcastle?
Income or Wage Gap in Newcastle is 34.4%.
Women in Newcastle earn 65.6 cents for every dollar earned by a man.
What is Family Income Deficit in Newcastle?
Family Income Deficit in Newcastle is $9,757.
Families that are below poverty line in Newcastle earn $9,757 less on average than the poverty threshold level.
What is Inequality or Gini Index in Newcastle?
Inequality or Gini Index in Newcastle is 0.43.
What is the Total Population of Newcastle?
Total Population of Newcastle is 3,380.
What is the Total Male Population of Newcastle?
Total Male Population of Newcastle is 1,838.
What is the Total Female Population of Newcastle?
Total Female Population of Newcastle is 1,542.
What is the Ratio of Males per 100 Females in Newcastle?
There are 119.20 Males per 100 Females in Newcastle.
What is the Ratio of Females per 100 Males in Newcastle?
There are 83.90 Females per 100 Males in Newcastle.
What is the Median Population Age in Newcastle?
Median Population Age in Newcastle is 35.3 Years.
What is the Average Family Size in Newcastle
Average Family Size in Newcastle is 3.4 People.
What is the Average Household Size in Newcastle
Average Household Size in Newcastle is 3.0 People.
How Large is the Labor Force in Newcastle?
There are 1,493 People in the Labor Forcein in Newcastle.
What is the Percentage of People in the Labor Force in Newcastle?
55.0% of People are in the Labor Force in Newcastle.
What is the Unemployment Rate in Newcastle?
Unemployment Rate in Newcastle is 2.7%.