Green River, WY Map & Demographics
Green River Map
Green River Overview
$40,037
PER CAPITA INCOME
$99,022
AVG FAMILY INCOME
$83,497
AVG HOUSEHOLD INCOME
55.2%
WAGE / INCOME GAP [ % ]
44.8¢/ $1
WAGE / INCOME GAP [ $ ]
0.41
INEQUALITY / GINI INDEX
11,772
TOTAL POPULATION
5,949
MALE POPULATION
5,823
FEMALE POPULATION
102.16
MALES / 100 FEMALES
97.88
FEMALES / 100 MALES
37.8
MEDIAN AGE
3.2
AVG FAMILY SIZE
2.6
AVG HOUSEHOLD SIZE
5,694
LABOR FORCE [ PEOPLE ]
64.4%
PERCENT IN LABOR FORCE
6.1%
UNEMPLOYMENT RATE
Green River Zip Codes
Green River Area Codes
Income in Green River
Income Overview in Green River
Per Capita Income in Green River is $40,037, while median incomes of families and households are $99,022 and $83,497 respectively.
| Characteristic | Number | Measure |
| Per Capita Income | 11,772 | $40,037 |
| Median Family Income | 3,084 | $99,022 |
| Mean Family Income | 3,084 | $116,105 |
| Median Household Income | 4,431 | $83,497 |
| Mean Household Income | 4,431 | $102,064 |
| Income Deficit | 3,084 | $0 |
| Wage / Income Gap (%) | 11,772 | 55.20% |
| Wage / Income Gap ($) | 11,772 | 44.80¢ per $1 |
| Gini / Inequality Index | 11,772 | 0.41 |
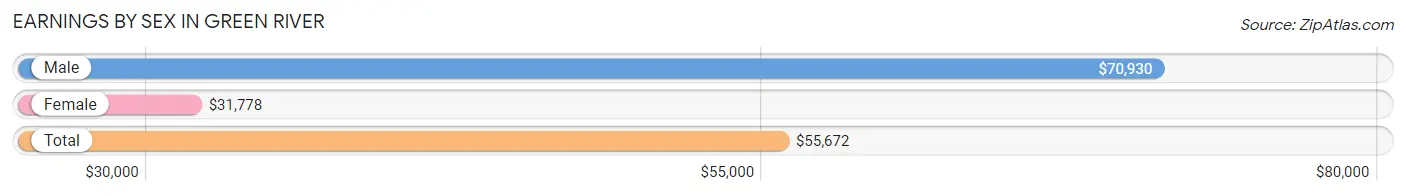
Earnings by Sex in Green River
Average Earnings in Green River are $55,672, $70,930 for men and $31,778 for women, a difference of 55.2%.
| Sex | Number | Average Earnings |
| Male | 3,289 (54.8%) | $70,930 |
| Female | 2,716 (45.2%) | $31,778 |
| Total | 6,005 (100.0%) | $55,672 |
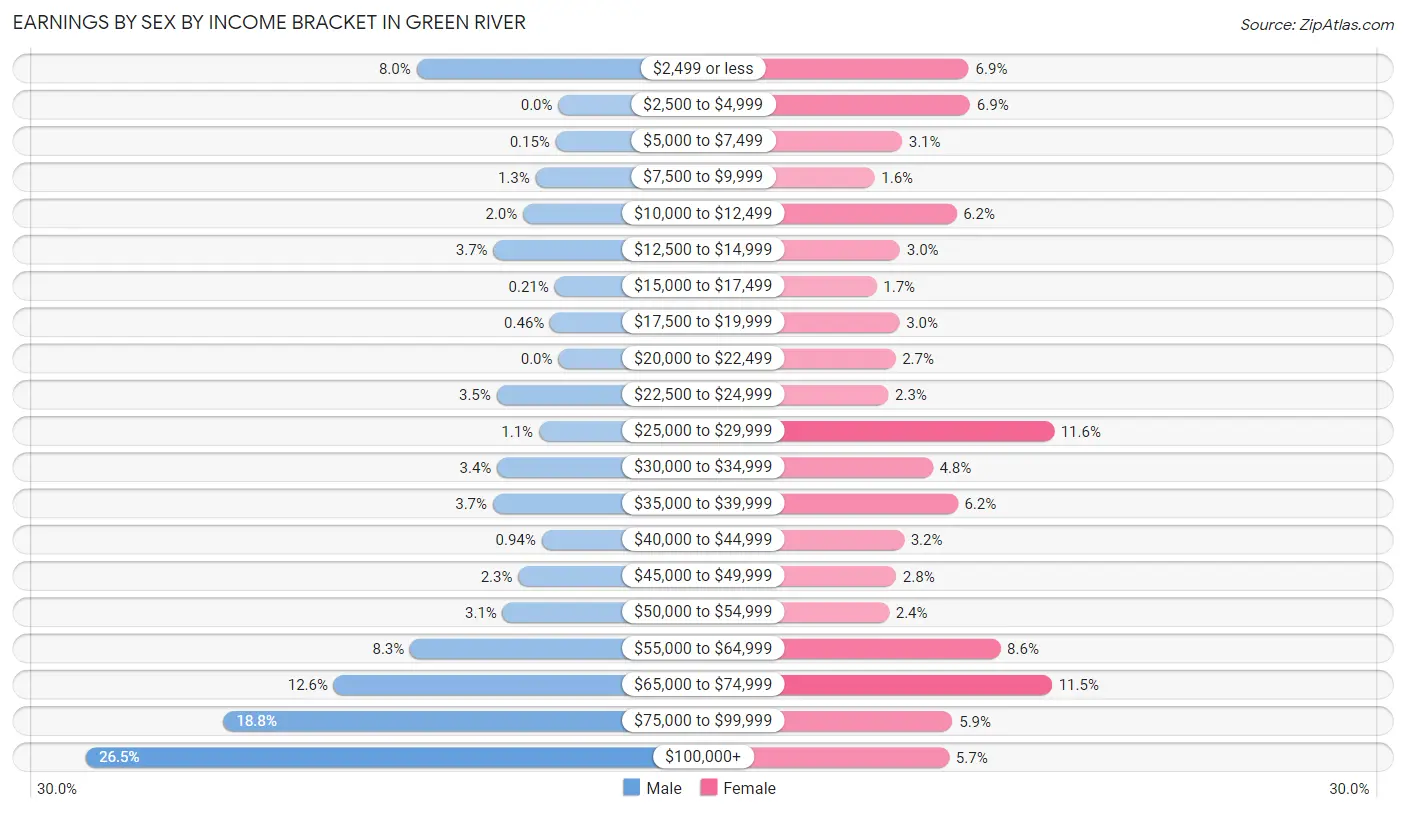
Earnings by Sex by Income Bracket in Green River
The most common earnings brackets in Green River are $100,000+ for men (873 | 26.5%) and $25,000 to $29,999 for women (316 | 11.6%).
| Income | Male | Female |
| $2,499 or less | 262 (8.0%) | 186 (6.9%) |
| $2,500 to $4,999 | 0 (0.0%) | 188 (6.9%) |
| $5,000 to $7,499 | 5 (0.2%) | 84 (3.1%) |
| $7,500 to $9,999 | 42 (1.3%) | 42 (1.5%) |
| $10,000 to $12,499 | 65 (2.0%) | 167 (6.1%) |
| $12,500 to $14,999 | 120 (3.6%) | 81 (3.0%) |
| $15,000 to $17,499 | 7 (0.2%) | 45 (1.7%) |
| $17,500 to $19,999 | 15 (0.5%) | 80 (2.9%) |
| $20,000 to $22,499 | 0 (0.0%) | 74 (2.7%) |
| $22,500 to $24,999 | 114 (3.5%) | 63 (2.3%) |
| $25,000 to $29,999 | 36 (1.1%) | 316 (11.6%) |
| $30,000 to $34,999 | 113 (3.4%) | 131 (4.8%) |
| $35,000 to $39,999 | 121 (3.7%) | 169 (6.2%) |
| $40,000 to $44,999 | 31 (0.9%) | 87 (3.2%) |
| $45,000 to $49,999 | 74 (2.2%) | 75 (2.8%) |
| $50,000 to $54,999 | 103 (3.1%) | 64 (2.4%) |
| $55,000 to $64,999 | 274 (8.3%) | 234 (8.6%) |
| $65,000 to $74,999 | 415 (12.6%) | 313 (11.5%) |
| $75,000 to $99,999 | 619 (18.8%) | 161 (5.9%) |
| $100,000+ | 873 (26.5%) | 156 (5.7%) |
| Total | 3,289 (100.0%) | 2,716 (100.0%) |
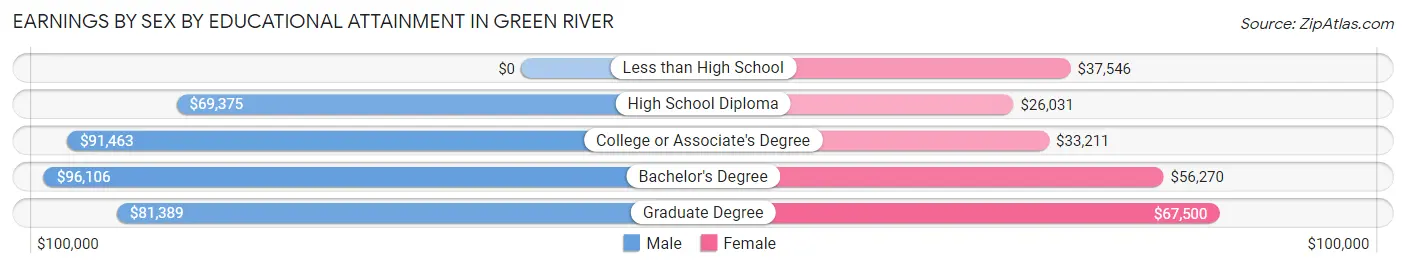
Earnings by Sex by Educational Attainment in Green River
Average earnings in Green River are $80,822 for men and $38,253 for women, a difference of 52.7%. Men with an educational attainment of bachelor's degree enjoy the highest average annual earnings of $96,106, while those with high school diploma education earn the least with $69,375. Women with an educational attainment of graduate degree earn the most with the average annual earnings of $67,500, while those with high school diploma education have the smallest earnings of $26,031.
| Educational Attainment | Male Income | Female Income |
| Less than High School | - | - |
| High School Diploma | $69,375 | $26,031 |
| College or Associate's Degree | $91,463 | $33,211 |
| Bachelor's Degree | $96,106 | $56,270 |
| Graduate Degree | $81,389 | $67,500 |
| Total | $80,822 | $38,253 |
Family Income in Green River
Family Income Brackets in Green River
According to the Green River family income data, there are 765 families falling into the $100,000 to $149,999 income range, which is the most common income bracket and makes up 24.8% of all families. Conversely, the $10,000 to $14,999 income bracket is the least frequent group with only 9 families (0.3%) belonging to this category.
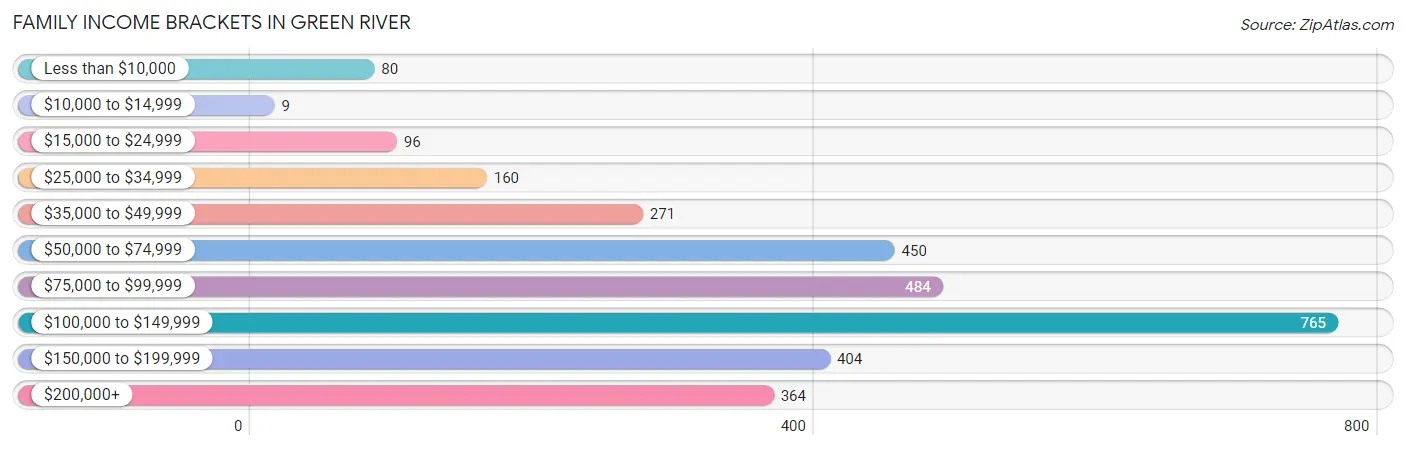
| Income Bracket | # Families | % Families |
| Less than $10,000 | 80 | 2.6% |
| $10,000 to $14,999 | 9 | 0.3% |
| $15,000 to $24,999 | 96 | 3.1% |
| $25,000 to $34,999 | 160 | 5.2% |
| $35,000 to $49,999 | 271 | 8.8% |
| $50,000 to $74,999 | 450 | 14.6% |
| $75,000 to $99,999 | 484 | 15.7% |
| $100,000 to $149,999 | 765 | 24.8% |
| $150,000 to $199,999 | 404 | 13.1% |
| $200,000+ | 364 | 11.8% |
Family Income by Famaliy Size in Green River
4-person families (674 | 21.8%) account for the highest median family income in Green River with $122,984 per family, while 2-person families (1,442 | 46.8%) have the highest median income of $44,542 per family member.
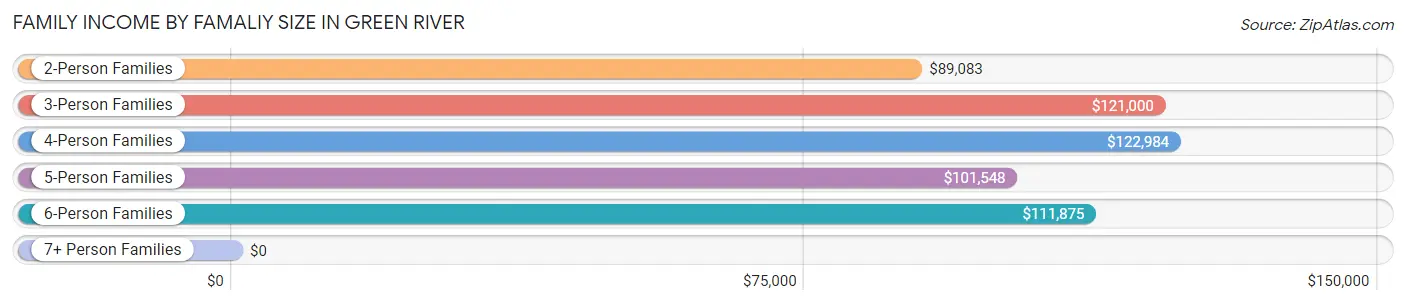
| Income Bracket | # Families | Median Income |
| 2-Person Families | 1,442 (46.8%) | $89,083 |
| 3-Person Families | 486 (15.8%) | $121,000 |
| 4-Person Families | 674 (21.8%) | $122,984 |
| 5-Person Families | 322 (10.4%) | $101,548 |
| 6-Person Families | 86 (2.8%) | $111,875 |
| 7+ Person Families | 74 (2.4%) | $0 |
| Total | 3,084 (100.0%) | $99,022 |
Family Income by Number of Earners in Green River
The median family income in Green River is $99,022, with families comprising 3+ earners (295) having the highest median family income of $183,990, while families with no earners (387) have the lowest median family income of $57,917, accounting for 9.6% and 12.6% of families, respectively.
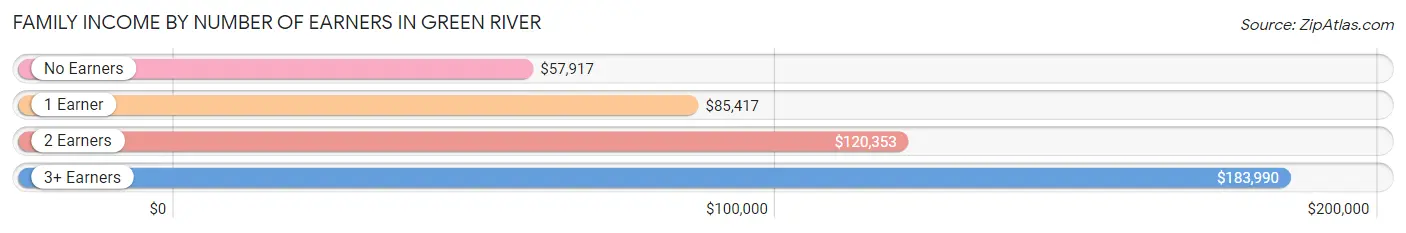
| Number of Earners | # Families | Median Income |
| No Earners | 387 (12.6%) | $57,917 |
| 1 Earner | 1,131 (36.7%) | $85,417 |
| 2 Earners | 1,271 (41.2%) | $120,353 |
| 3+ Earners | 295 (9.6%) | $183,990 |
| Total | 3,084 (100.0%) | $99,022 |
Household Income in Green River
Household Income Brackets in Green River
With 842 households falling in the category, the $100,000 to $149,999 income range is the most frequent in Green River, accounting for 19.0% of all households. In contrast, only 27 households (0.6%) fall into the $10,000 to $14,999 income bracket, making it the least populous group.
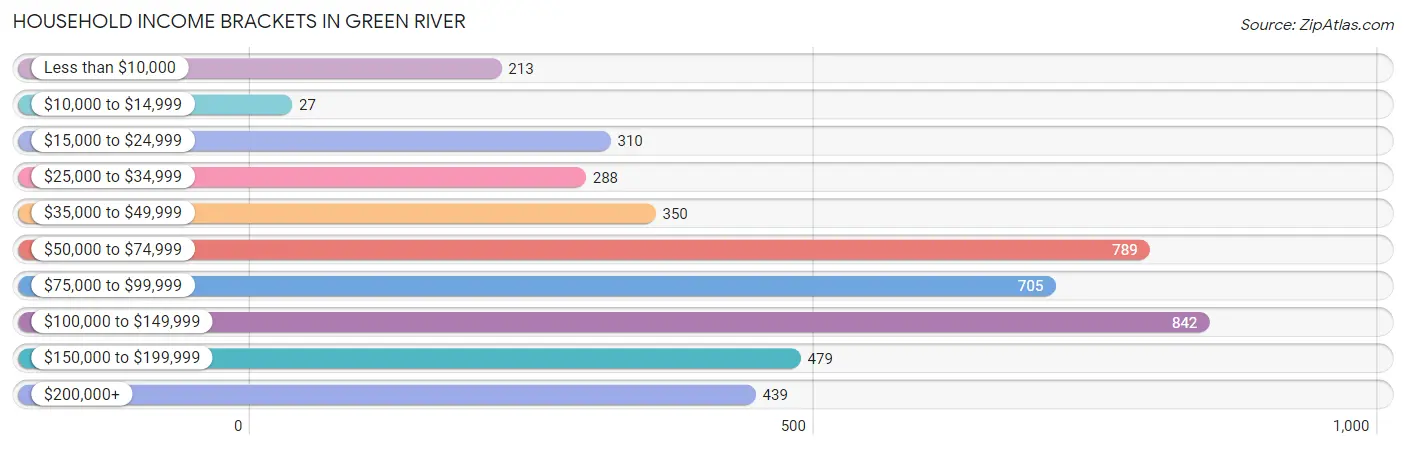
| Income Bracket | # Households | % Households |
| Less than $10,000 | 213 | 4.8% |
| $10,000 to $14,999 | 27 | 0.6% |
| $15,000 to $24,999 | 310 | 7.0% |
| $25,000 to $34,999 | 288 | 6.5% |
| $35,000 to $49,999 | 350 | 7.9% |
| $50,000 to $74,999 | 789 | 17.8% |
| $75,000 to $99,999 | 705 | 15.9% |
| $100,000 to $149,999 | 842 | 19.0% |
| $150,000 to $199,999 | 479 | 10.8% |
| $200,000+ | 439 | 9.9% |
Household Income by Householder Age in Green River
The median household income in Green River is $83,497, with the highest median household income of $105,270 found in the 45 to 64 years age bracket for the primary householder. A total of 1,744 households (39.4%) fall into this category. Meanwhile, the 15 to 24 years age bracket for the primary householder has the lowest median household income of $0, with 71 households (1.6%) in this group.
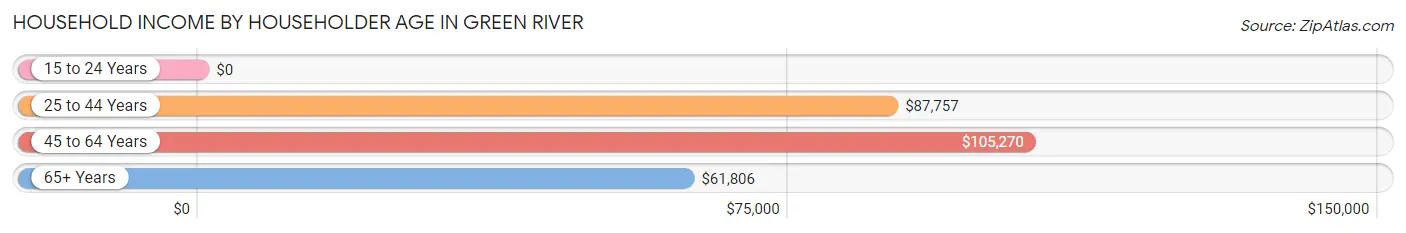
| Income Bracket | # Households | Median Income |
| 15 to 24 Years | 71 (1.6%) | $0 |
| 25 to 44 Years | 1,561 (35.2%) | $87,757 |
| 45 to 64 Years | 1,744 (39.4%) | $105,270 |
| 65+ Years | 1,055 (23.8%) | $61,806 |
| Total | 4,431 (100.0%) | $83,497 |
Poverty in Green River
Income Below Poverty by Sex and Age in Green River
With 6.1% poverty level for males and 9.3% for females among the residents of Green River, 5 year old males and 18 to 24 year old females are the most vulnerable to poverty, with 78 males (47.0%) and 85 females (18.9%) in their respective age groups living below the poverty level.
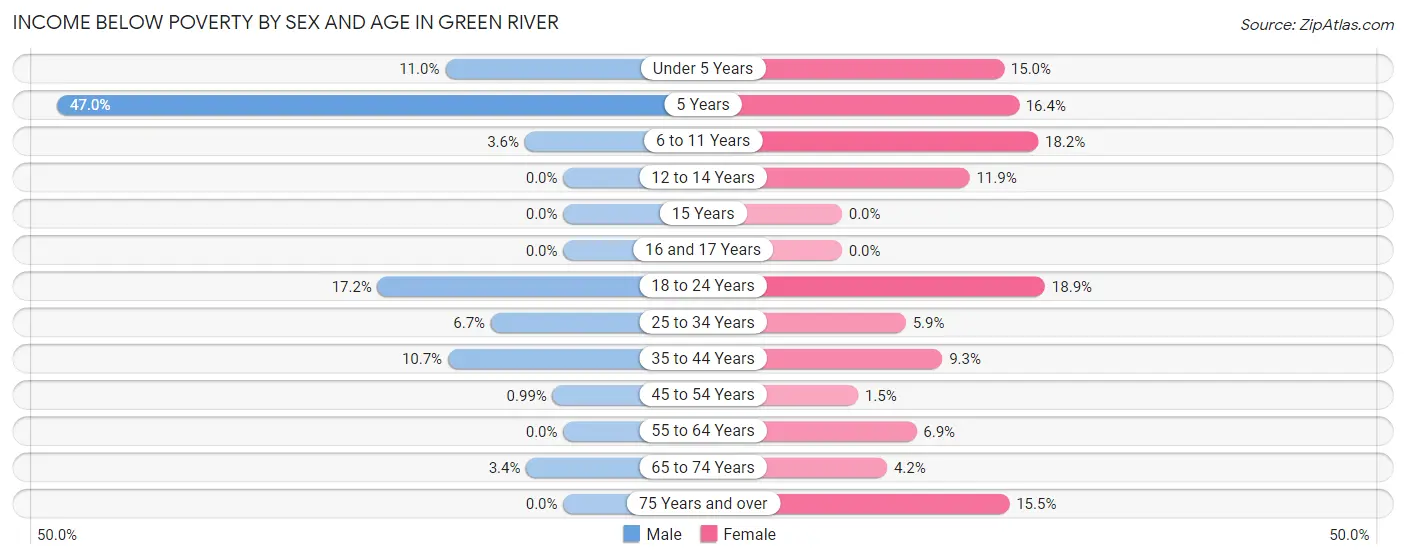
| Age Bracket | Male | Female |
| Under 5 Years | 50 (11.0%) | 37 (15.0%) |
| 5 Years | 78 (47.0%) | 11 (16.4%) |
| 6 to 11 Years | 20 (3.6%) | 100 (18.2%) |
| 12 to 14 Years | 0 (0.0%) | 52 (11.8%) |
| 15 Years | 0 (0.0%) | 0 (0.0%) |
| 16 and 17 Years | 0 (0.0%) | 0 (0.0%) |
| 18 to 24 Years | 51 (17.2%) | 85 (18.9%) |
| 25 to 34 Years | 48 (6.7%) | 41 (5.9%) |
| 35 to 44 Years | 85 (10.7%) | 81 (9.3%) |
| 45 to 54 Years | 7 (1.0%) | 11 (1.5%) |
| 55 to 64 Years | 0 (0.0%) | 49 (6.9%) |
| 65 to 74 Years | 23 (3.4%) | 19 (4.2%) |
| 75 Years and over | 0 (0.0%) | 55 (15.5%) |
| Total | 362 (6.1%) | 541 (9.3%) |
Income Above Poverty by Sex and Age in Green River
According to the poverty statistics in Green River, males aged 12 to 14 years and females aged 15 years are the age groups that are most secure financially, with 100.0% of males and 100.0% of females in these age groups living above the poverty line.
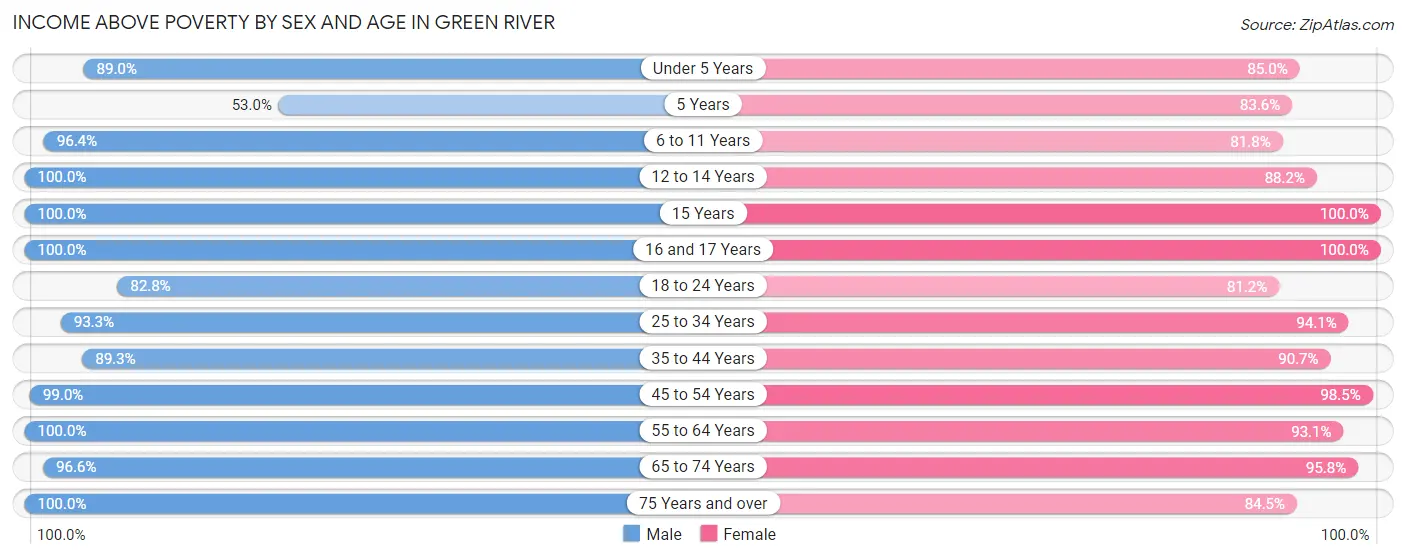
| Age Bracket | Male | Female |
| Under 5 Years | 406 (89.0%) | 209 (85.0%) |
| 5 Years | 88 (53.0%) | 56 (83.6%) |
| 6 to 11 Years | 539 (96.4%) | 449 (81.8%) |
| 12 to 14 Years | 248 (100.0%) | 387 (88.1%) |
| 15 Years | 117 (100.0%) | 64 (100.0%) |
| 16 and 17 Years | 235 (100.0%) | 158 (100.0%) |
| 18 to 24 Years | 245 (82.8%) | 366 (81.1%) |
| 25 to 34 Years | 666 (93.3%) | 650 (94.1%) |
| 35 to 44 Years | 709 (89.3%) | 788 (90.7%) |
| 45 to 54 Years | 698 (99.0%) | 724 (98.5%) |
| 55 to 64 Years | 740 (100.0%) | 659 (93.1%) |
| 65 to 74 Years | 646 (96.6%) | 434 (95.8%) |
| 75 Years and over | 204 (100.0%) | 299 (84.5%) |
| Total | 5,541 (93.9%) | 5,243 (90.6%) |
Income Below Poverty Among Married-Couple Families in Green River
The poverty statistics for married-couple families in Green River show that 3.2% or 82 of the total 2,604 families live below the poverty line. Families with 5 or more children have the highest poverty rate of 48.6%, comprising of 36 families. On the other hand, families with 1 or 2 children have the lowest poverty rate of 0.0%, which includes 0 families.
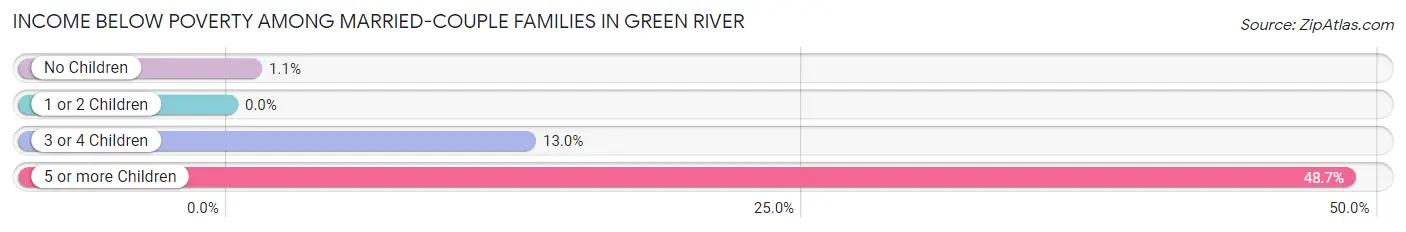
| Children | Above Poverty | Below Poverty |
| No Children | 1,411 (99.0%) | 15 (1.1%) |
| 1 or 2 Children | 865 (100.0%) | 0 (0.0%) |
| 3 or 4 Children | 208 (87.0%) | 31 (13.0%) |
| 5 or more Children | 38 (51.3%) | 36 (48.6%) |
| Total | 2,522 (96.9%) | 82 (3.2%) |
Income Below Poverty Among Single-Parent Households in Green River
According to the poverty data in Green River, 16.0% or 17 single-father households and 11.8% or 44 single-mother households are living below the poverty line. Among single-father households, those with 3 or 4 children have the highest poverty rate, with 10 households (23.3%) experiencing poverty. Likewise, among single-mother households, those with 1 or 2 children have the highest poverty rate, with 37 households (18.4%) falling below the poverty line.
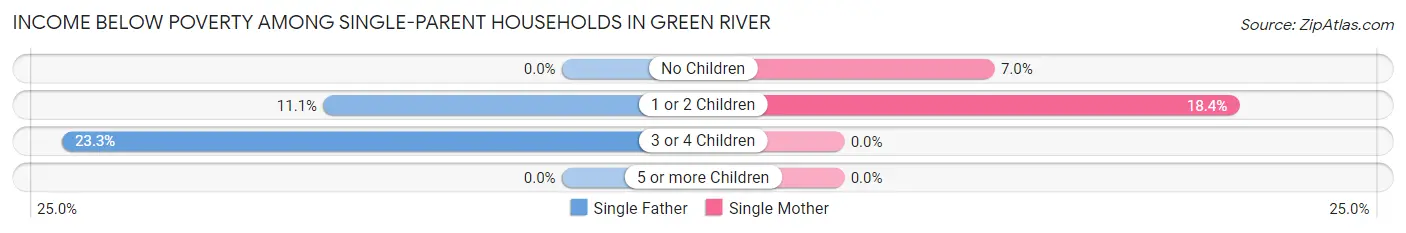
| Children | Single Father | Single Mother |
| No Children | 0 (0.0%) | 7 (7.0%) |
| 1 or 2 Children | 7 (11.1%) | 37 (18.4%) |
| 3 or 4 Children | 10 (23.3%) | 0 (0.0%) |
| 5 or more Children | 0 (0.0%) | 0 (0.0%) |
| Total | 17 (16.0%) | 44 (11.8%) |
Income Below Poverty Among Married-Couple vs Single-Parent Households in Green River
The poverty data for Green River shows that 82 of the married-couple family households (3.2%) and 61 of the single-parent households (12.7%) are living below the poverty level. Within the married-couple family households, those with 5 or more children have the highest poverty rate, with 36 households (48.6%) falling below the poverty line. Among the single-parent households, those with 1 or 2 children have the highest poverty rate, with 44 household (16.7%) living below poverty.
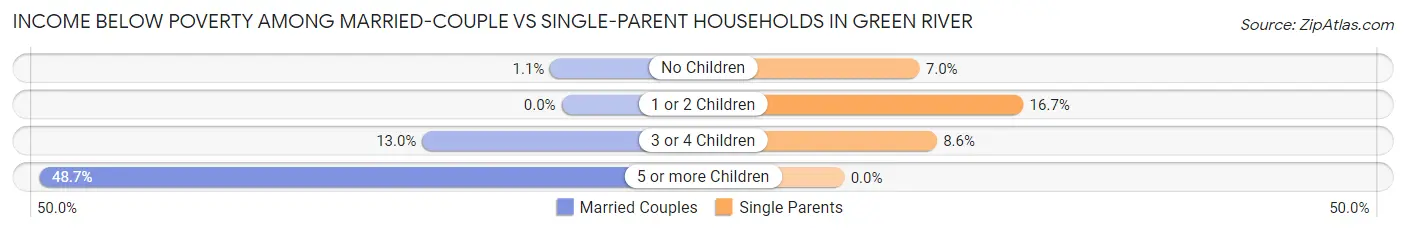
| Children | Married-Couple Families | Single-Parent Households |
| No Children | 15 (1.1%) | 7 (7.0%) |
| 1 or 2 Children | 0 (0.0%) | 44 (16.7%) |
| 3 or 4 Children | 31 (13.0%) | 10 (8.6%) |
| 5 or more Children | 36 (48.6%) | 0 (0.0%) |
| Total | 82 (3.2%) | 61 (12.7%) |
Race in Green River
The most populous races in Green River are White / Caucasian (10,222 | 86.8%), Hispanic or Latino (1,714 | 14.6%), and Two or more Races (982 | 8.3%).
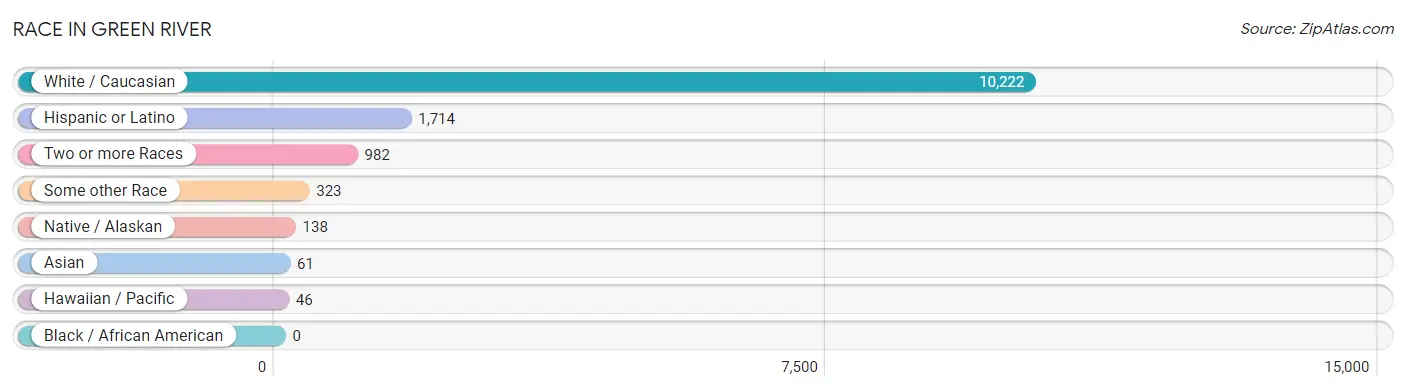
| Race | # Population | % Population |
| Asian | 61 | 0.5% |
| Black / African American | 0 | 0.0% |
| Hawaiian / Pacific | 46 | 0.4% |
| Hispanic or Latino | 1,714 | 14.6% |
| Native / Alaskan | 138 | 1.2% |
| White / Caucasian | 10,222 | 86.8% |
| Two or more Races | 982 | 8.3% |
| Some other Race | 323 | 2.7% |
| Total | 11,772 | 100.0% |
Ancestry in Green River
The most populous ancestries reported in Green River are English (2,283 | 19.4%), German (1,637 | 13.9%), Mexican (1,275 | 10.8%), American (917 | 7.8%), and Irish (778 | 6.6%), together accounting for 58.5% of all Green River residents.
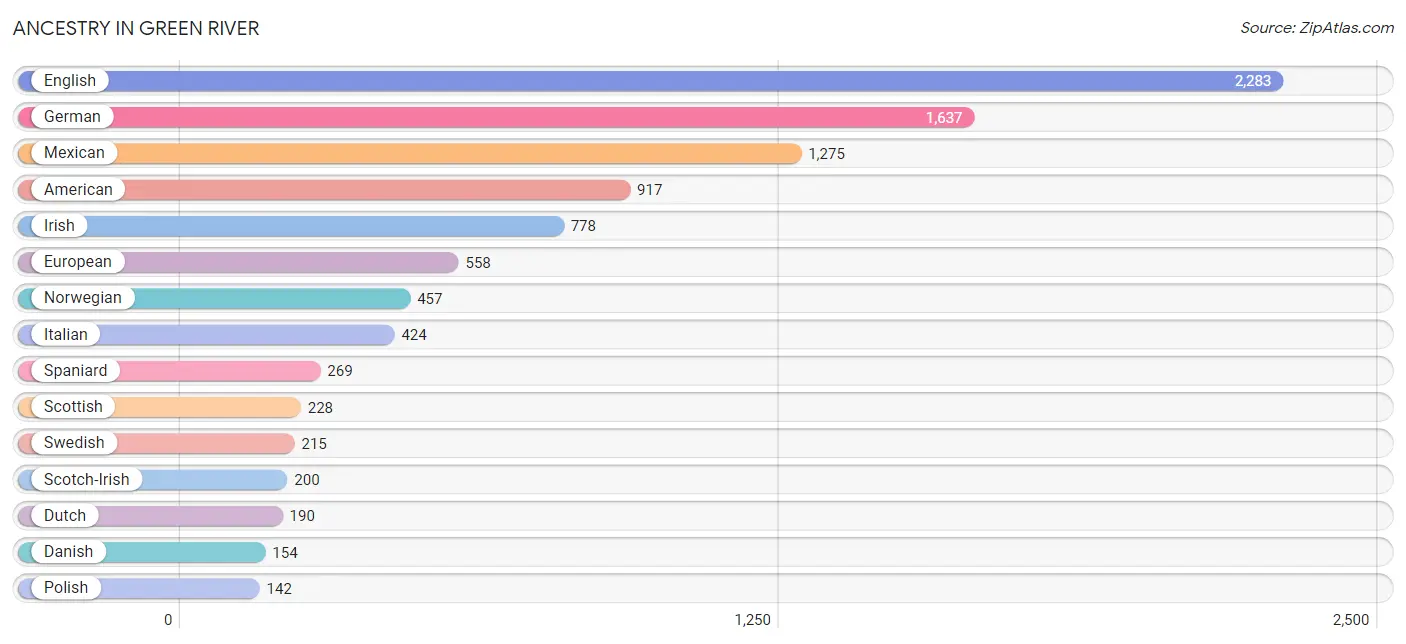
| Ancestry | # Population | % Population |
| American | 917 | 7.8% |
| Arab | 14 | 0.1% |
| Armenian | 31 | 0.3% |
| Basque | 37 | 0.3% |
| Blackfeet | 12 | 0.1% |
| British | 118 | 1.0% |
| Canadian | 51 | 0.4% |
| Cherokee | 78 | 0.7% |
| Chippewa | 7 | 0.1% |
| Choctaw | 31 | 0.3% |
| Cree | 21 | 0.2% |
| Creek | 8 | 0.1% |
| Czech | 16 | 0.1% |
| Czechoslovakian | 11 | 0.1% |
| Danish | 154 | 1.3% |
| Dutch | 190 | 1.6% |
| Eastern European | 18 | 0.2% |
| English | 2,283 | 19.4% |
| European | 558 | 4.7% |
| Finnish | 18 | 0.2% |
| French | 128 | 1.1% |
| German | 1,637 | 13.9% |
| Greek | 71 | 0.6% |
| Hungarian | 9 | 0.1% |
| Iranian | 46 | 0.4% |
| Irish | 778 | 6.6% |
| Italian | 424 | 3.6% |
| Korean | 39 | 0.3% |
| Mexican | 1,275 | 10.8% |
| Mexican American Indian | 43 | 0.4% |
| Native Hawaiian | 133 | 1.1% |
| Navajo | 99 | 0.8% |
| Norwegian | 457 | 3.9% |
| Pennsylvania German | 14 | 0.1% |
| Polish | 142 | 1.2% |
| Portuguese | 29 | 0.3% |
| Russian | 9 | 0.1% |
| Scandinavian | 119 | 1.0% |
| Scotch-Irish | 200 | 1.7% |
| Scottish | 228 | 1.9% |
| Slovak | 6 | 0.1% |
| Spaniard | 269 | 2.3% |
| Spanish | 66 | 0.6% |
| Swedish | 215 | 1.8% |
| Swiss | 37 | 0.3% |
| Thai | 47 | 0.4% |
| Ukrainian | 9 | 0.1% |
| Welsh | 120 | 1.0% |
| Yugoslavian | 103 | 0.9% | View All 49 Rows |
Immigrants in Green River
The most numerous immigrant groups reported in Green River came from Latin America (203 | 1.7%), Central America (198 | 1.7%), Mexico (198 | 1.7%), Europe (102 | 0.9%), and Asia (101 | 0.9%), together accounting for 6.8% of all Green River residents.
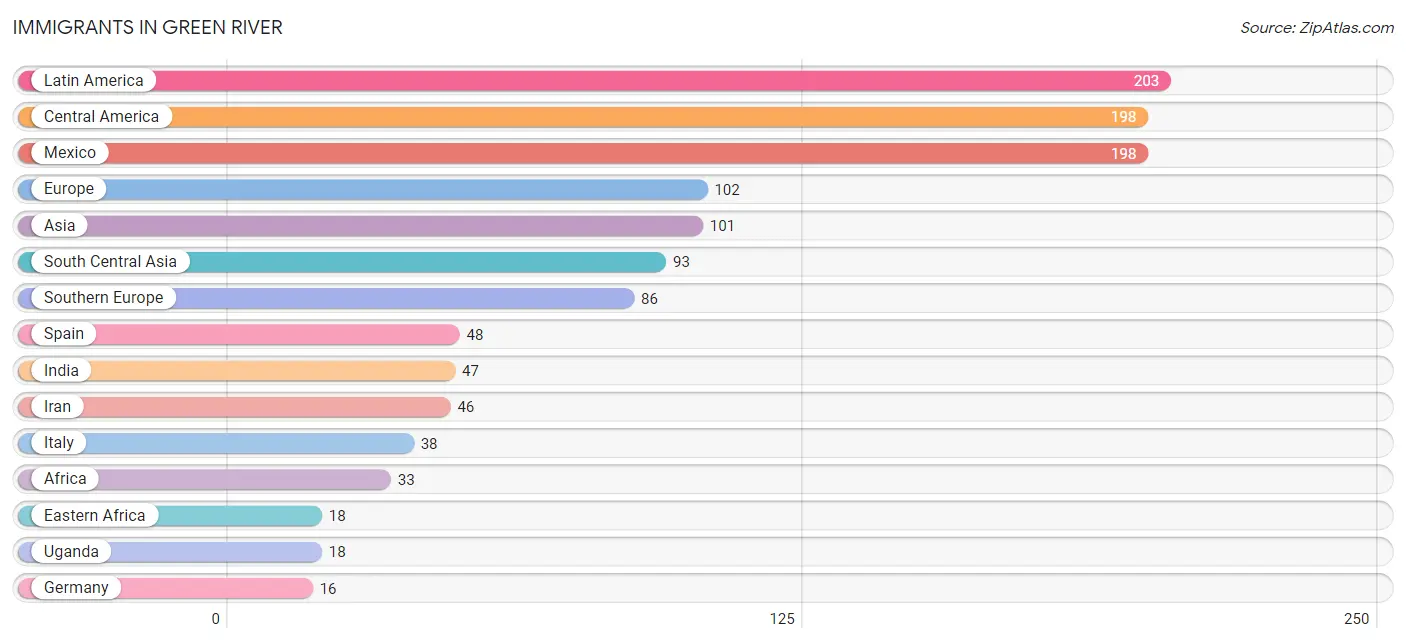
| Immigration Origin | # Population | % Population |
| Africa | 33 | 0.3% |
| Asia | 101 | 0.9% |
| Brazil | 5 | 0.0% |
| Central America | 198 | 1.7% |
| Eastern Africa | 18 | 0.2% |
| Europe | 102 | 0.9% |
| Germany | 16 | 0.1% |
| India | 47 | 0.4% |
| Iran | 46 | 0.4% |
| Italy | 38 | 0.3% |
| Latin America | 203 | 1.7% |
| Mexico | 198 | 1.7% |
| Morocco | 15 | 0.1% |
| Northern Africa | 15 | 0.1% |
| Philippines | 8 | 0.1% |
| South America | 5 | 0.0% |
| South Central Asia | 93 | 0.8% |
| South Eastern Asia | 8 | 0.1% |
| Southern Europe | 86 | 0.7% |
| Spain | 48 | 0.4% |
| Uganda | 18 | 0.2% |
| Western Europe | 16 | 0.1% | View All 22 Rows |
Sex and Age in Green River
Sex and Age in Green River
The most populous age groups in Green River are 10 to 14 Years (515 | 8.7%) for men and 10 to 14 Years (563 | 9.7%) for women.
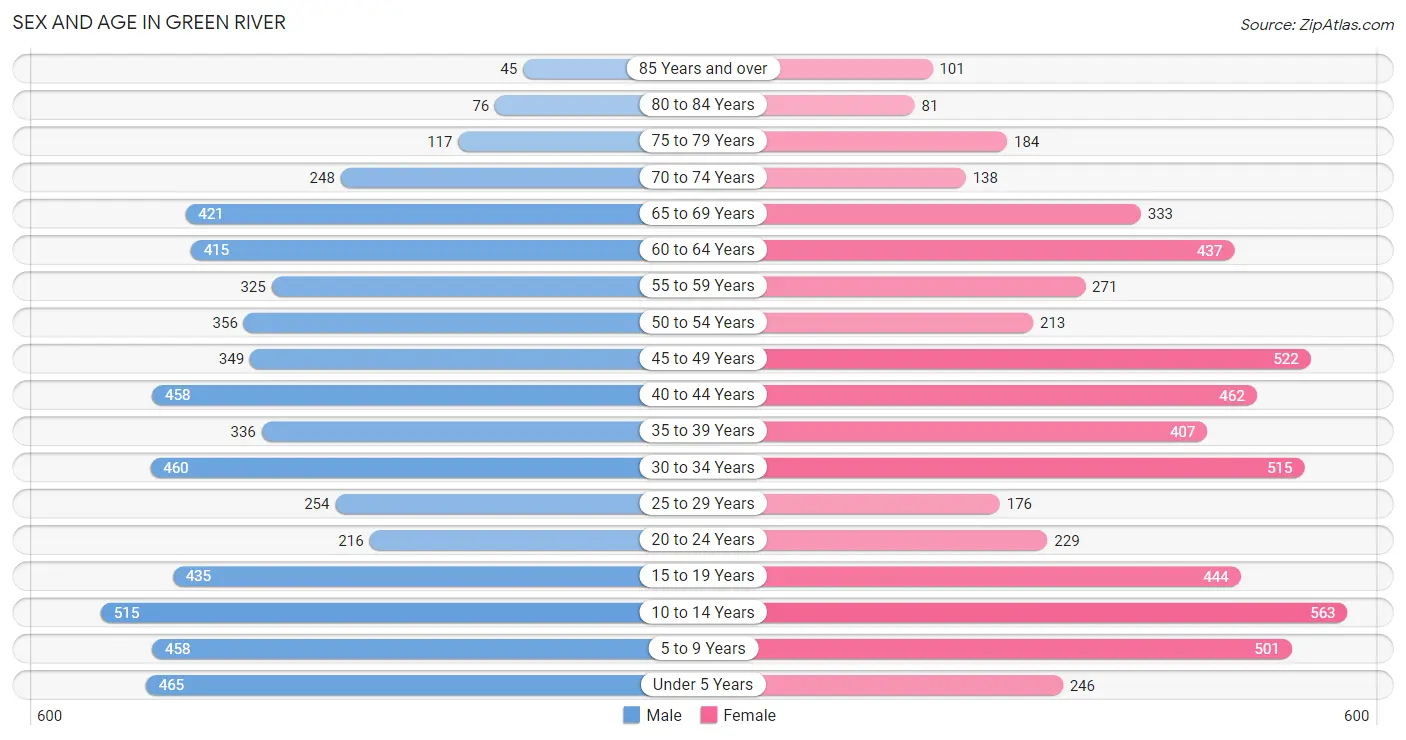
| Age Bracket | Male | Female |
| Under 5 Years | 465 (7.8%) | 246 (4.2%) |
| 5 to 9 Years | 458 (7.7%) | 501 (8.6%) |
| 10 to 14 Years | 515 (8.7%) | 563 (9.7%) |
| 15 to 19 Years | 435 (7.3%) | 444 (7.6%) |
| 20 to 24 Years | 216 (3.6%) | 229 (3.9%) |
| 25 to 29 Years | 254 (4.3%) | 176 (3.0%) |
| 30 to 34 Years | 460 (7.7%) | 515 (8.8%) |
| 35 to 39 Years | 336 (5.7%) | 407 (7.0%) |
| 40 to 44 Years | 458 (7.7%) | 462 (7.9%) |
| 45 to 49 Years | 349 (5.9%) | 522 (9.0%) |
| 50 to 54 Years | 356 (6.0%) | 213 (3.7%) |
| 55 to 59 Years | 325 (5.5%) | 271 (4.6%) |
| 60 to 64 Years | 415 (7.0%) | 437 (7.5%) |
| 65 to 69 Years | 421 (7.1%) | 333 (5.7%) |
| 70 to 74 Years | 248 (4.2%) | 138 (2.4%) |
| 75 to 79 Years | 117 (2.0%) | 184 (3.2%) |
| 80 to 84 Years | 76 (1.3%) | 81 (1.4%) |
| 85 Years and over | 45 (0.8%) | 101 (1.7%) |
| Total | 5,949 (100.0%) | 5,823 (100.0%) |
Families and Households in Green River
Median Family Size in Green River
The median family size in Green River is 3.22 persons per family, with single male/father families (106 | 3.4%) accounting for the largest median family size of 3.61 persons per family. On the other hand, single female/mother families (374 | 12.1%) represent the smallest median family size with 2.80 persons per family.
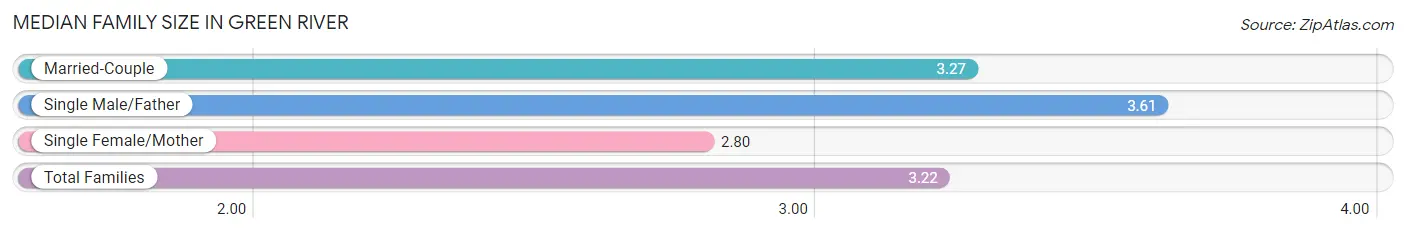
| Family Type | # Families | Family Size |
| Married-Couple | 2,604 (84.4%) | 3.27 |
| Single Male/Father | 106 (3.4%) | 3.61 |
| Single Female/Mother | 374 (12.1%) | 2.80 |
| Total Families | 3,084 (100.0%) | 3.22 |
Median Household Size in Green River
The median household size in Green River is 2.64 persons per household, with single male/father households (106 | 2.4%) accounting for the largest median household size of 4.3 persons per household. non-family households (1,347 | 30.4%) represent the smallest median household size with 1.15 persons per household.
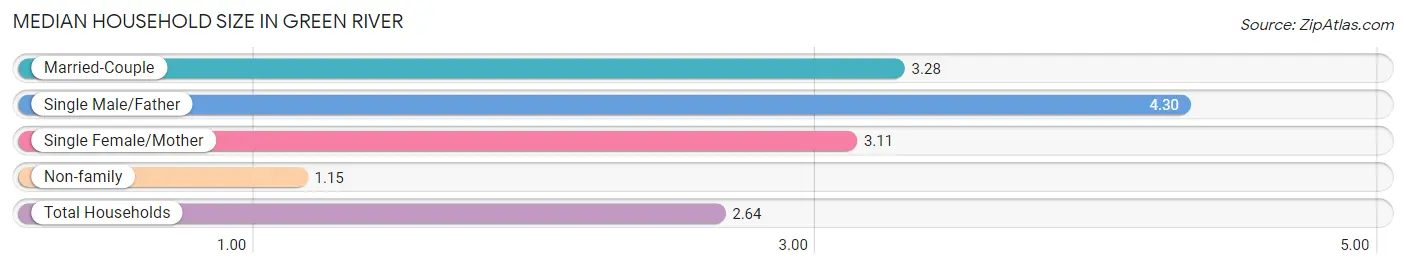
| Household Type | # Households | Household Size |
| Married-Couple | 2,604 (58.8%) | 3.28 |
| Single Male/Father | 106 (2.4%) | 4.30 |
| Single Female/Mother | 374 (8.4%) | 3.11 |
| Non-family | 1,347 (30.4%) | 1.15 |
| Total Households | 4,431 (100.0%) | 2.64 |
Household Size by Marriage Status in Green River
Out of a total of 4,431 households in Green River, 3,084 (69.6%) are family households, while 1,347 (30.4%) are nonfamily households. The most numerous type of family households are 2-person households, comprising 1,376, and the most common type of nonfamily households are 1-person households, comprising 1,168.
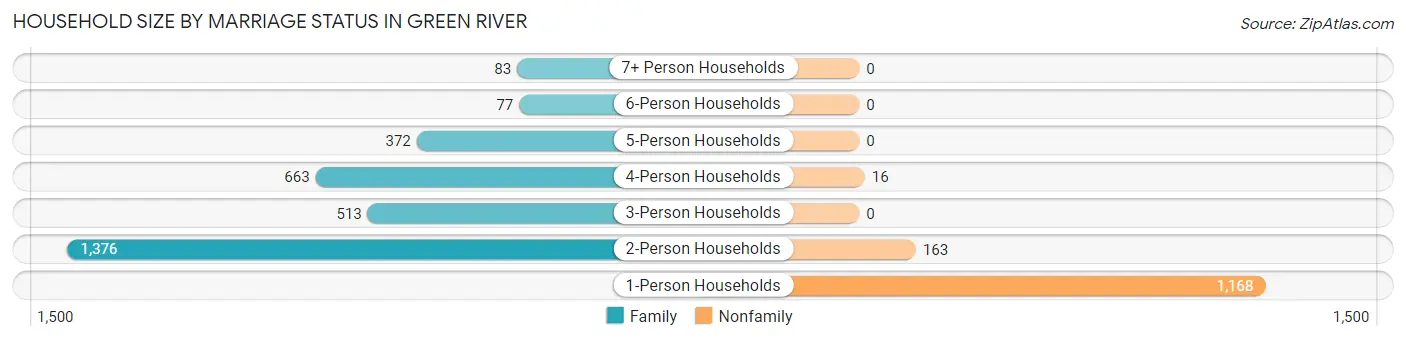
| Household Size | Family Households | Nonfamily Households |
| 1-Person Households | - | 1,168 (26.4%) |
| 2-Person Households | 1,376 (31.0%) | 163 (3.7%) |
| 3-Person Households | 513 (11.6%) | 0 (0.0%) |
| 4-Person Households | 663 (15.0%) | 16 (0.4%) |
| 5-Person Households | 372 (8.4%) | 0 (0.0%) |
| 6-Person Households | 77 (1.7%) | 0 (0.0%) |
| 7+ Person Households | 83 (1.9%) | 0 (0.0%) |
| Total | 3,084 (69.6%) | 1,347 (30.4%) |
Female Fertility in Green River
Fertility by Age in Green River
Average fertility rate in Green River is 48.0 births per 1,000 women. Women in the age bracket of 20 to 34 years have the highest fertility rate with 127.0 births per 1,000 women. Women in the age bracket of 20 to 34 years acount for 88.0% of all women with births.
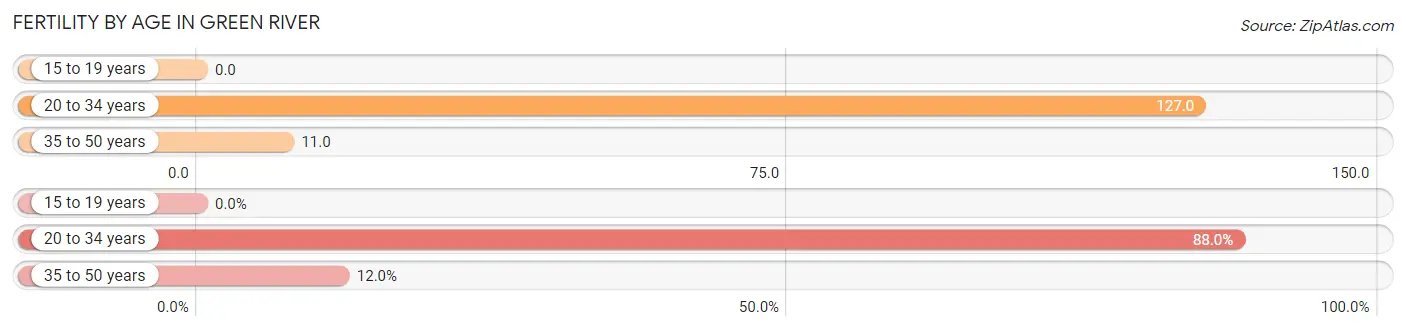
| Age Bracket | Women with Births | Births / 1,000 Women |
| 15 to 19 years | 0 (0.0%) | 0.0 |
| 20 to 34 years | 117 (88.0%) | 127.0 |
| 35 to 50 years | 16 (12.0%) | 11.0 |
| Total | 133 (100.0%) | 48.0 |
Fertility by Age by Marriage Status in Green River
96.2% of women with births (133) in Green River are married. The highest percentage of unmarried women with births falls into 35 to 50 years age bracket with 31.2% of them unmarried at the time of birth, while the lowest percentage of unmarried women with births belong to 20 to 34 years age bracket with 0.0% of them unmarried.
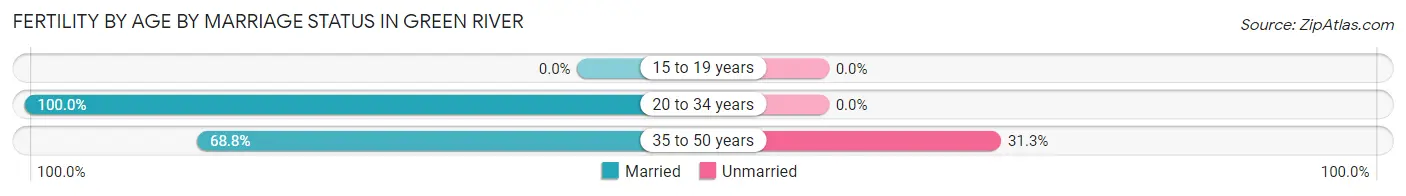
| Age Bracket | Married | Unmarried |
| 15 to 19 years | 0 (0.0%) | 0 (0.0%) |
| 20 to 34 years | 117 (100.0%) | 0 (0.0%) |
| 35 to 50 years | 11 (68.8%) | 5 (31.2%) |
| Total | 128 (96.2%) | 5 (3.8%) |
Fertility by Education in Green River
Average fertility rate in Green River is 48.0 births per 1,000 women. Women with the education attainment of graduate degree have the highest fertility rate of 104.0 births per 1,000 women, while women with the education attainment of college or associate's degree have the lowest fertility at 27.0 births per 1,000 women. Women with the education attainment of high school diploma represent 31.6% of all women with births.
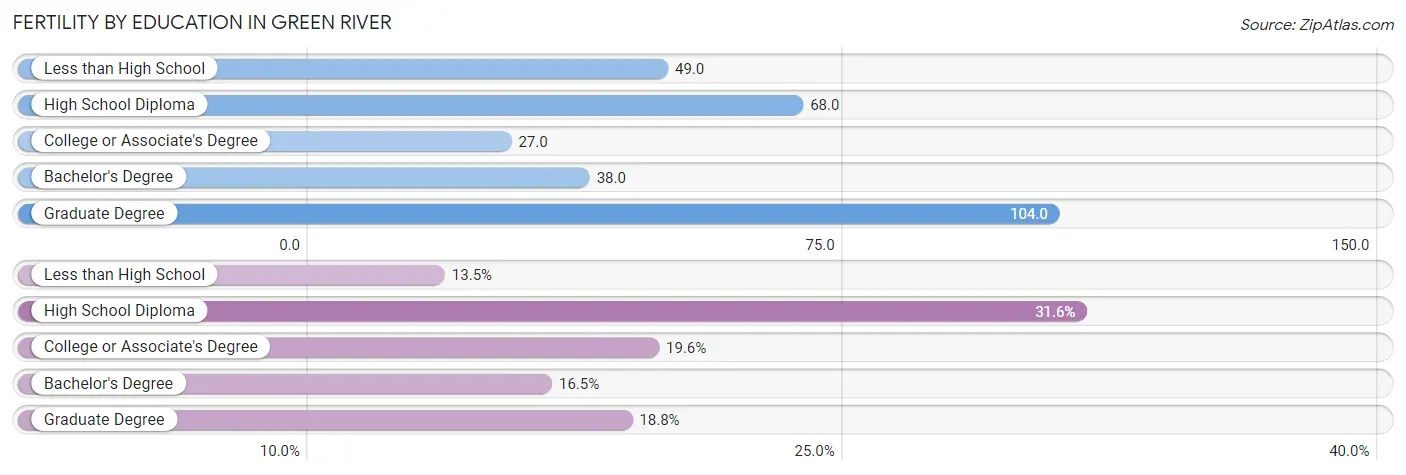
| Educational Attainment | Women with Births | Births / 1,000 Women |
| Less than High School | 18 (13.5%) | 49.0 |
| High School Diploma | 42 (31.6%) | 68.0 |
| College or Associate's Degree | 26 (19.6%) | 27.0 |
| Bachelor's Degree | 22 (16.5%) | 38.0 |
| Graduate Degree | 25 (18.8%) | 104.0 |
| Total | 133 (100.0%) | 48.0 |
Fertility by Education by Marriage Status in Green River
3.8% of women with births in Green River are unmarried. Women with the educational attainment of less than high school are most likely to be married with 100.0% of them married at childbirth, while women with the educational attainment of bachelor's degree are least likely to be married with 22.7% of them unmarried at childbirth.
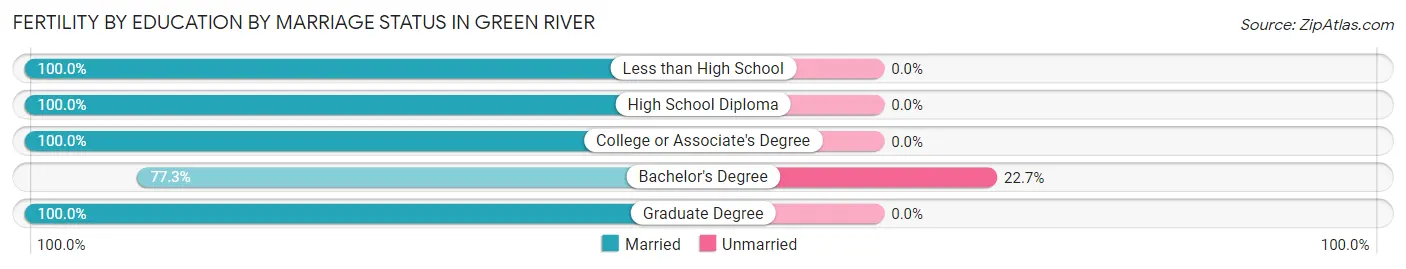
| Educational Attainment | Married | Unmarried |
| Less than High School | 18 (100.0%) | 0 (0.0%) |
| High School Diploma | 42 (100.0%) | 0 (0.0%) |
| College or Associate's Degree | 26 (100.0%) | 0 (0.0%) |
| Bachelor's Degree | 17 (77.3%) | 5 (22.7%) |
| Graduate Degree | 25 (100.0%) | 0 (0.0%) |
| Total | 128 (96.2%) | 5 (3.8%) |
Employment Characteristics in Green River
Employment by Class of Employer in Green River
Among the 5,297 employed individuals in Green River, private company employees (3,765 | 71.1%), local government employees (525 | 9.9%), and not-for-profit organizations (329 | 6.2%) make up the most common classes of employment.
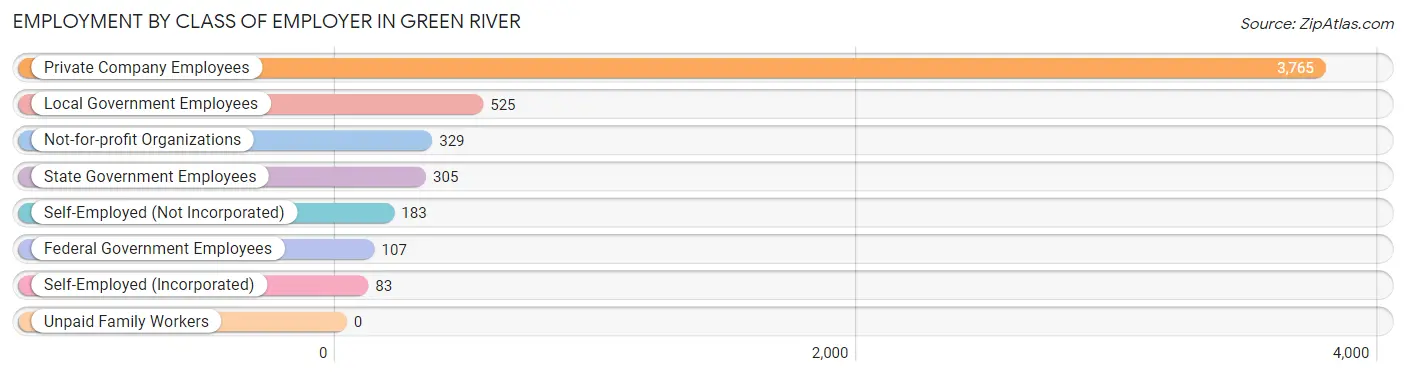
| Employer Class | # Employees | % Employees |
| Private Company Employees | 3,765 | 71.1% |
| Self-Employed (Incorporated) | 83 | 1.6% |
| Self-Employed (Not Incorporated) | 183 | 3.5% |
| Not-for-profit Organizations | 329 | 6.2% |
| Local Government Employees | 525 | 9.9% |
| State Government Employees | 305 | 5.8% |
| Federal Government Employees | 107 | 2.0% |
| Unpaid Family Workers | 0 | 0.0% |
| Total | 5,297 | 100.0% |
Employment Status by Age in Green River
According to the labor force statistics for Green River, out of the total population over 16 years of age (8,841), 64.4% or 5,694 individuals are in the labor force, with 6.1% or 347 of them unemployed. The age group with the highest labor force participation rate is 25 to 29 years, with 95.6% or 411 individuals in the labor force. Within the labor force, the 16 to 19 years age range has the highest percentage of unemployed individuals, with 37.1% or 124 of them being unemployed.
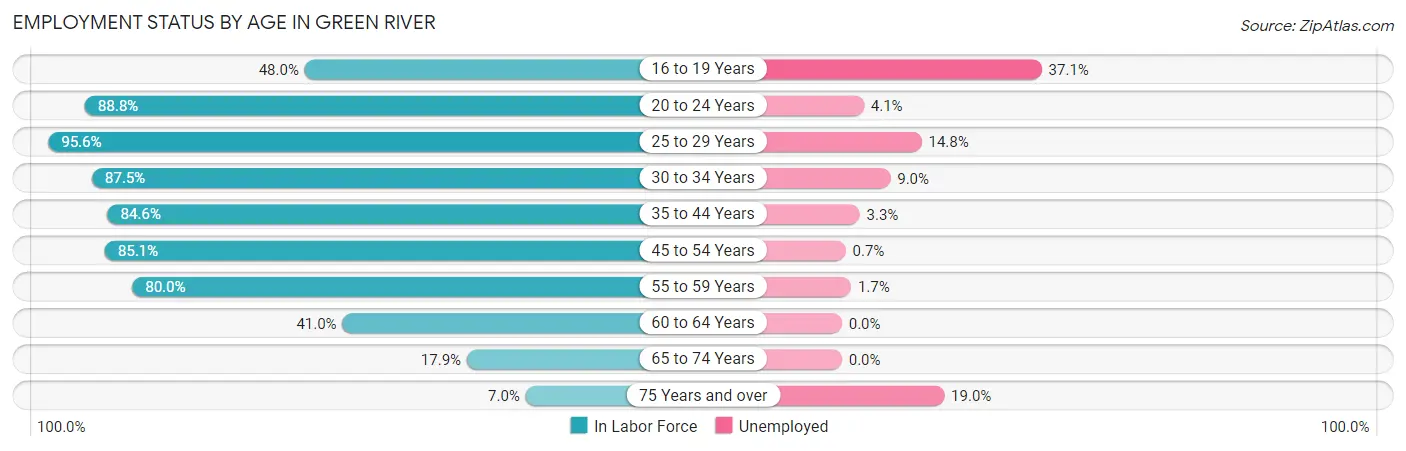
| Age Bracket | In Labor Force | Unemployed |
| 16 to 19 Years | 334 (48.0%) | 124 (37.1%) |
| 20 to 24 Years | 395 (88.8%) | 16 (4.1%) |
| 25 to 29 Years | 411 (95.6%) | 61 (14.8%) |
| 30 to 34 Years | 853 (87.5%) | 77 (9.0%) |
| 35 to 44 Years | 1,407 (84.6%) | 46 (3.3%) |
| 45 to 54 Years | 1,225 (85.1%) | 9 (0.7%) |
| 55 to 59 Years | 477 (80.0%) | 8 (1.7%) |
| 60 to 64 Years | 349 (41.0%) | 0 (0.0%) |
| 65 to 74 Years | 204 (17.9%) | 0 (0.0%) |
| 75 Years and over | 42 (7.0%) | 8 (19.0%) |
| Total | 5,694 (64.4%) | 347 (6.1%) |
Employment Status by Educational Attainment in Green River
According to labor force statistics for Green River, 79.3% of individuals (4,723) out of the total population between 25 and 64 years of age (5,956) are in the labor force, with 4.2% or 198 of them being unemployed. The group with the highest labor force participation rate are those with the educational attainment of less than high school, with 88.8% or 142 individuals in the labor force. Within the labor force, individuals with high school diploma education have the highest percentage of unemployment, with 12.3% or 131 of them being unemployed.
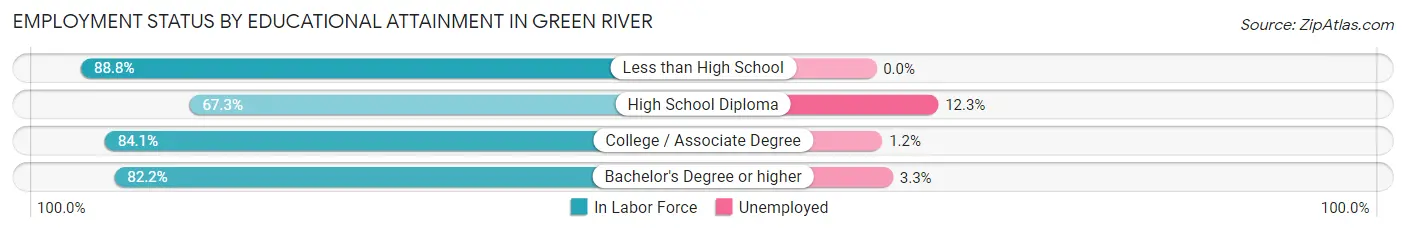
| Educational Attainment | In Labor Force | Unemployed |
| Less than High School | 142 (88.8%) | 0 (0.0%) |
| High School Diploma | 1,065 (67.3%) | 195 (12.3%) |
| College / Associate Degree | 2,254 (84.1%) | 32 (1.2%) |
| Bachelor's Degree or higher | 1,261 (82.2%) | 51 (3.3%) |
| Total | 4,723 (79.3%) | 250 (4.2%) |
Employment Occupations by Sex in Green River
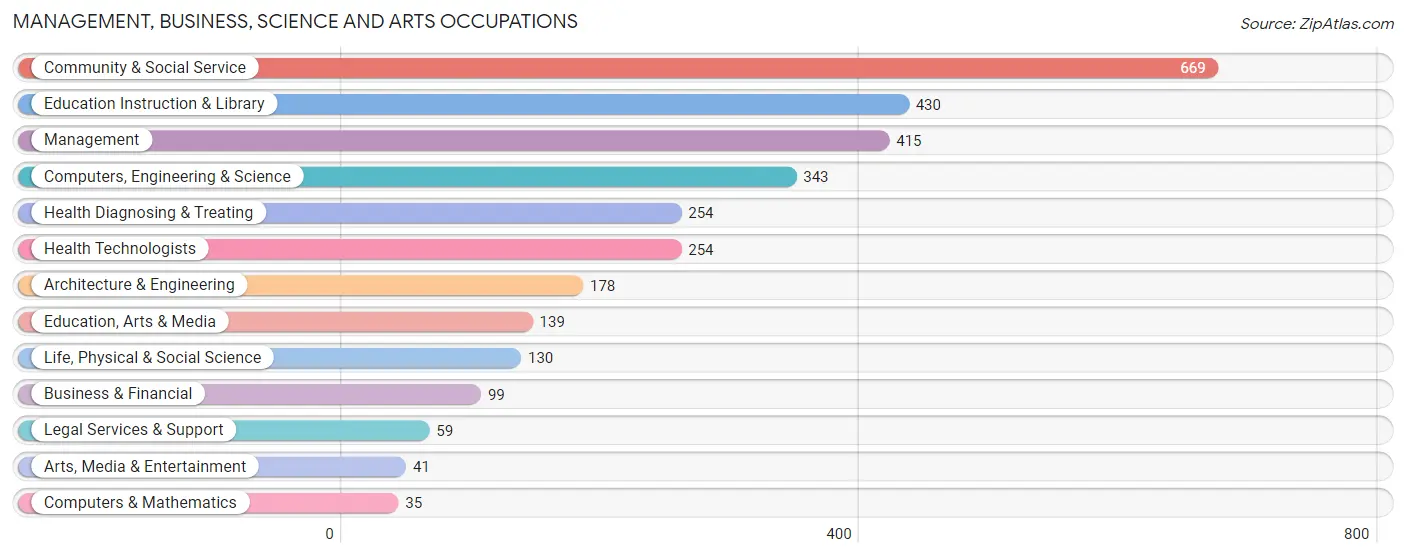
Management, Business, Science and Arts Occupations
The most common Management, Business, Science and Arts occupations in Green River are Community & Social Service (669 | 12.5%), Education Instruction & Library (430 | 8.1%), Management (415 | 7.8%), Computers, Engineering & Science (343 | 6.4%), and Health Diagnosing & Treating (254 | 4.8%).
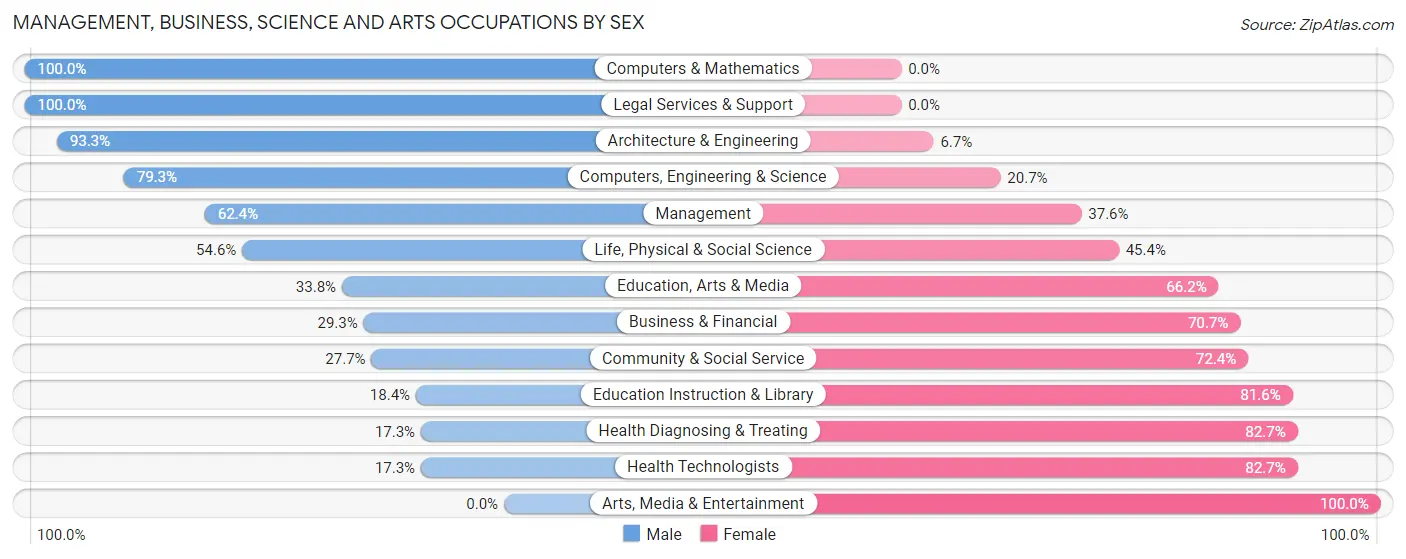
Management, Business, Science and Arts Occupations by Sex
Within the Management, Business, Science and Arts occupations in Green River, the most male-oriented occupations are Computers & Mathematics (100.0%), Legal Services & Support (100.0%), and Architecture & Engineering (93.3%), while the most female-oriented occupations are Arts, Media & Entertainment (100.0%), Health Diagnosing & Treating (82.7%), and Health Technologists (82.7%).
| Occupation | Male | Female |
| Management | 259 (62.4%) | 156 (37.6%) |
| Business & Financial | 29 (29.3%) | 70 (70.7%) |
| Computers, Engineering & Science | 272 (79.3%) | 71 (20.7%) |
| Computers & Mathematics | 35 (100.0%) | 0 (0.0%) |
| Architecture & Engineering | 166 (93.3%) | 12 (6.7%) |
| Life, Physical & Social Science | 71 (54.6%) | 59 (45.4%) |
| Community & Social Service | 185 (27.7%) | 484 (72.4%) |
| Education, Arts & Media | 47 (33.8%) | 92 (66.2%) |
| Legal Services & Support | 59 (100.0%) | 0 (0.0%) |
| Education Instruction & Library | 79 (18.4%) | 351 (81.6%) |
| Arts, Media & Entertainment | 0 (0.0%) | 41 (100.0%) |
| Health Diagnosing & Treating | 44 (17.3%) | 210 (82.7%) |
| Health Technologists | 44 (17.3%) | 210 (82.7%) |
| Total (Category) | 789 (44.3%) | 991 (55.7%) |
| Total (Overall) | 2,853 (53.4%) | 2,491 (46.6%) |
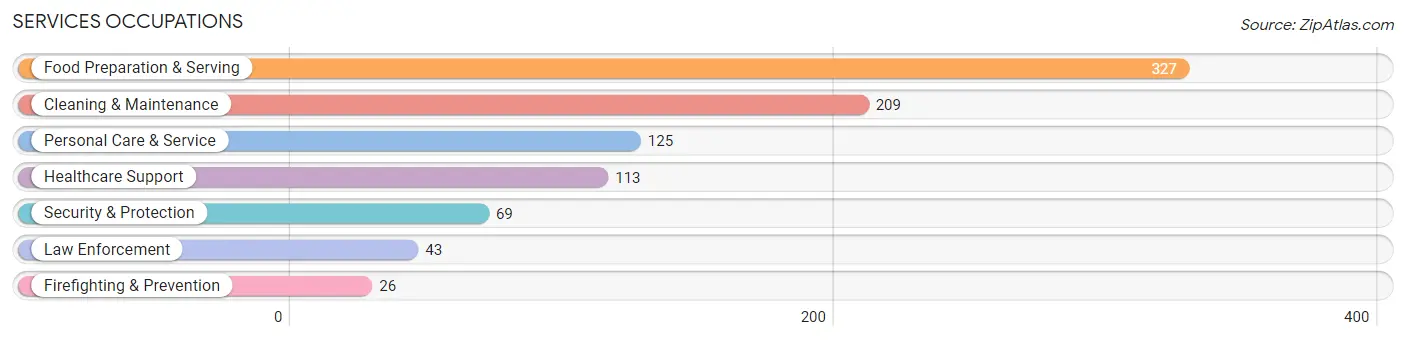
Services Occupations
The most common Services occupations in Green River are Food Preparation & Serving (327 | 6.1%), Cleaning & Maintenance (209 | 3.9%), Personal Care & Service (125 | 2.3%), Healthcare Support (113 | 2.1%), and Security & Protection (69 | 1.3%).
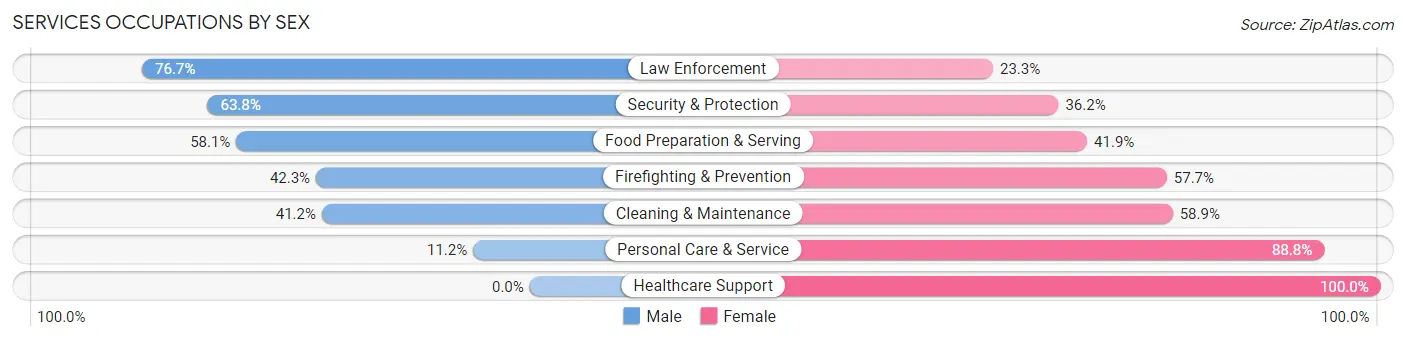
Services Occupations by Sex
Within the Services occupations in Green River, the most male-oriented occupations are Law Enforcement (76.7%), Security & Protection (63.8%), and Food Preparation & Serving (58.1%), while the most female-oriented occupations are Healthcare Support (100.0%), Personal Care & Service (88.8%), and Cleaning & Maintenance (58.9%).
| Occupation | Male | Female |
| Healthcare Support | 0 (0.0%) | 113 (100.0%) |
| Security & Protection | 44 (63.8%) | 25 (36.2%) |
| Firefighting & Prevention | 11 (42.3%) | 15 (57.7%) |
| Law Enforcement | 33 (76.7%) | 10 (23.3%) |
| Food Preparation & Serving | 190 (58.1%) | 137 (41.9%) |
| Cleaning & Maintenance | 86 (41.1%) | 123 (58.9%) |
| Personal Care & Service | 14 (11.2%) | 111 (88.8%) |
| Total (Category) | 334 (39.6%) | 509 (60.4%) |
| Total (Overall) | 2,853 (53.4%) | 2,491 (46.6%) |
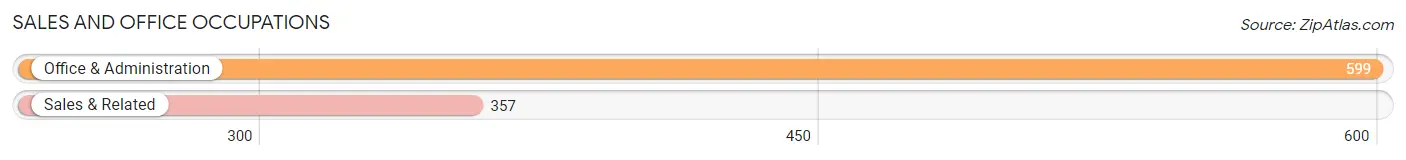
Sales and Office Occupations
The most common Sales and Office occupations in Green River are Office & Administration (599 | 11.2%), and Sales & Related (357 | 6.7%).
Sales and Office Occupations by Sex
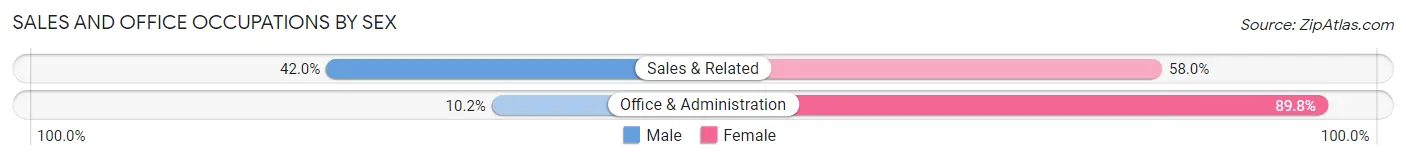
| Occupation | Male | Female |
| Sales & Related | 150 (42.0%) | 207 (58.0%) |
| Office & Administration | 61 (10.2%) | 538 (89.8%) |
| Total (Category) | 211 (22.1%) | 745 (77.9%) |
| Total (Overall) | 2,853 (53.4%) | 2,491 (46.6%) |
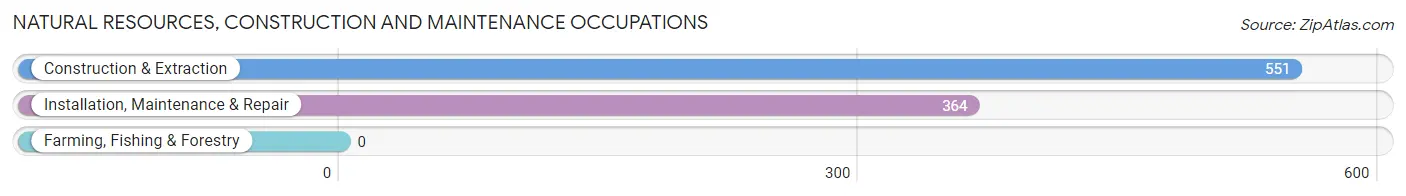
Natural Resources, Construction and Maintenance Occupations
The most common Natural Resources, Construction and Maintenance occupations in Green River are Construction & Extraction (551 | 10.3%), and Installation, Maintenance & Repair (364 | 6.8%).
Natural Resources, Construction and Maintenance Occupations by Sex
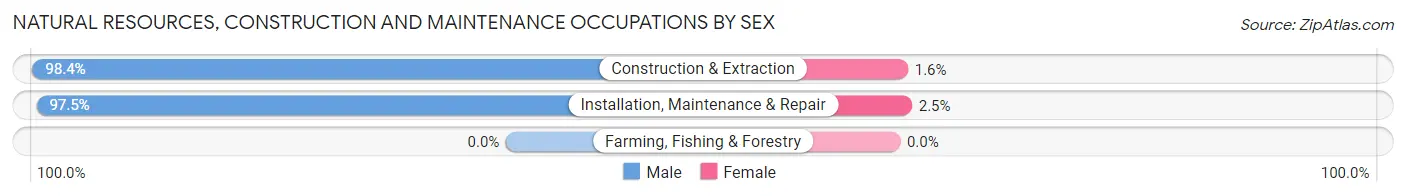
| Occupation | Male | Female |
| Farming, Fishing & Forestry | 0 (0.0%) | 0 (0.0%) |
| Construction & Extraction | 542 (98.4%) | 9 (1.6%) |
| Installation, Maintenance & Repair | 355 (97.5%) | 9 (2.5%) |
| Total (Category) | 897 (98.0%) | 18 (2.0%) |
| Total (Overall) | 2,853 (53.4%) | 2,491 (46.6%) |
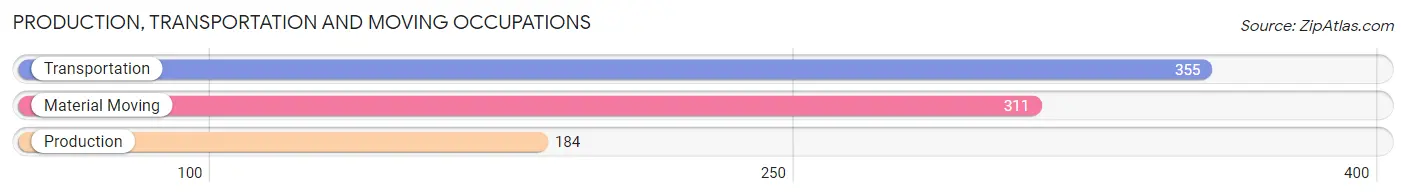
Production, Transportation and Moving Occupations
The most common Production, Transportation and Moving occupations in Green River are Transportation (355 | 6.6%), Material Moving (311 | 5.8%), and Production (184 | 3.4%).
Production, Transportation and Moving Occupations by Sex
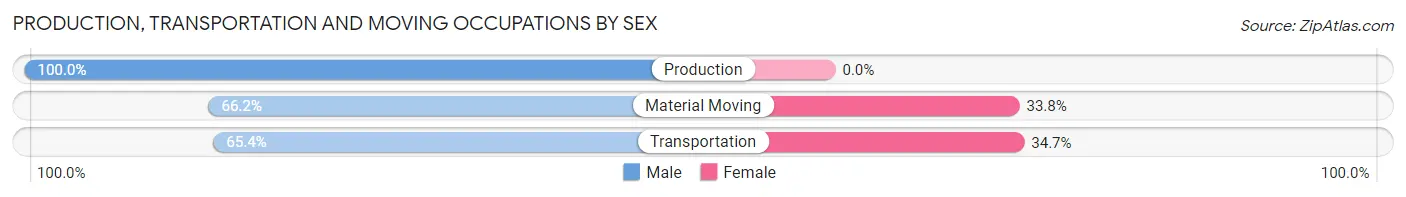
| Occupation | Male | Female |
| Production | 184 (100.0%) | 0 (0.0%) |
| Transportation | 232 (65.3%) | 123 (34.6%) |
| Material Moving | 206 (66.2%) | 105 (33.8%) |
| Total (Category) | 622 (73.2%) | 228 (26.8%) |
| Total (Overall) | 2,853 (53.4%) | 2,491 (46.6%) |
Employment Industries by Sex in Green River
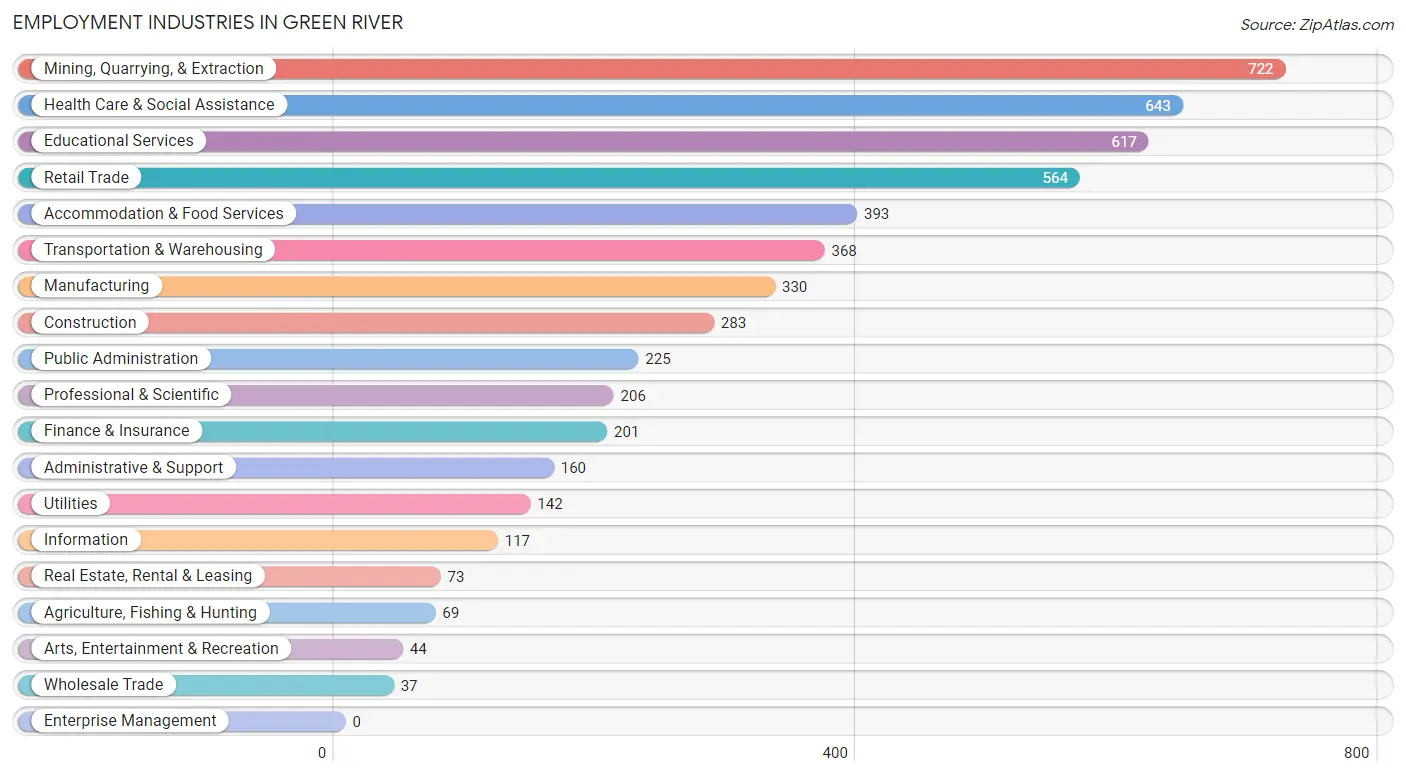
Employment Industries in Green River
The major employment industries in Green River include Mining, Quarrying, & Extraction (722 | 13.5%), Health Care & Social Assistance (643 | 12.0%), Educational Services (617 | 11.6%), Retail Trade (564 | 10.5%), and Accommodation & Food Services (393 | 7.3%).
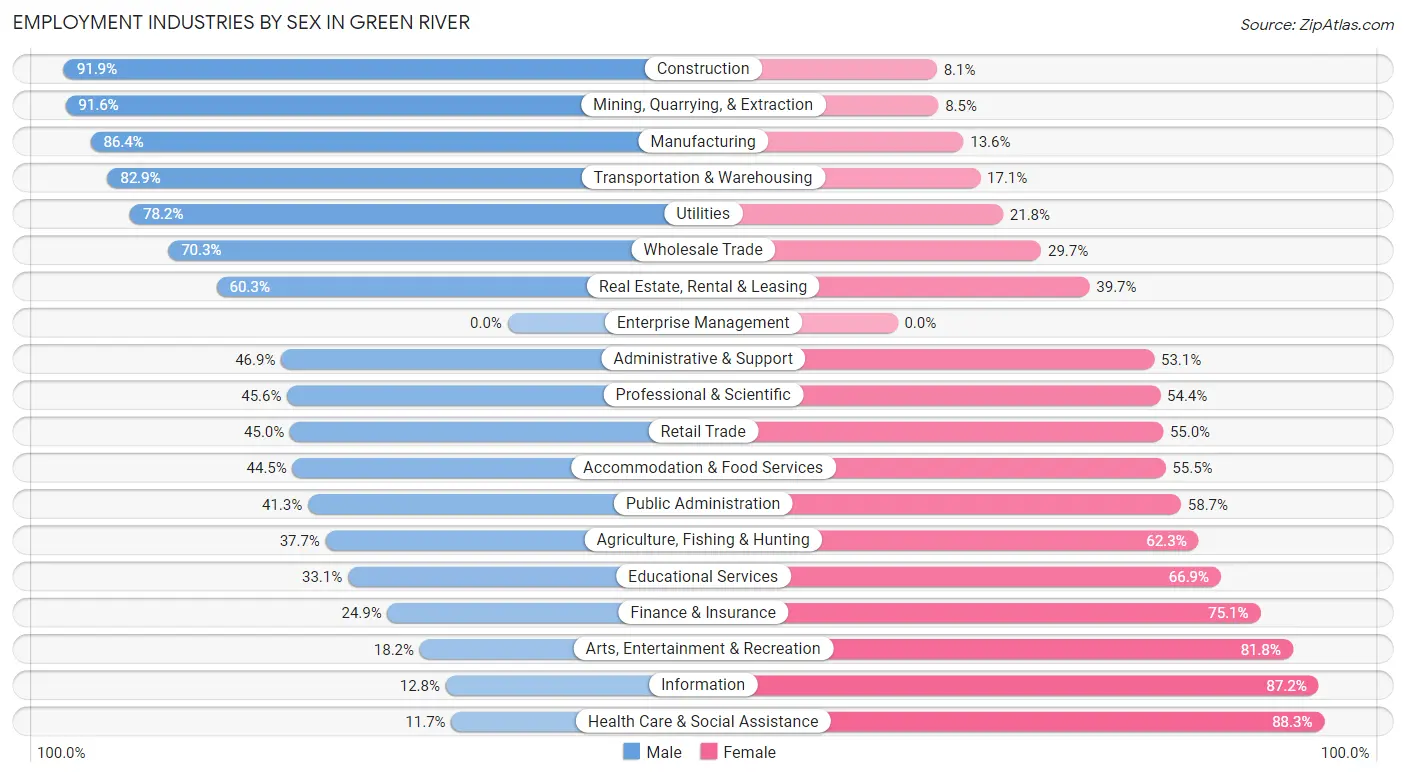
Employment Industries by Sex in Green River
The Green River industries that see more men than women are Construction (91.9%), Mining, Quarrying, & Extraction (91.5%), and Manufacturing (86.4%), whereas the industries that tend to have a higher number of women are Health Care & Social Assistance (88.3%), Information (87.2%), and Arts, Entertainment & Recreation (81.8%).
| Industry | Male | Female |
| Agriculture, Fishing & Hunting | 26 (37.7%) | 43 (62.3%) |
| Mining, Quarrying, & Extraction | 661 (91.5%) | 61 (8.5%) |
| Construction | 260 (91.9%) | 23 (8.1%) |
| Manufacturing | 285 (86.4%) | 45 (13.6%) |
| Wholesale Trade | 26 (70.3%) | 11 (29.7%) |
| Retail Trade | 254 (45.0%) | 310 (55.0%) |
| Transportation & Warehousing | 305 (82.9%) | 63 (17.1%) |
| Utilities | 111 (78.2%) | 31 (21.8%) |
| Information | 15 (12.8%) | 102 (87.2%) |
| Finance & Insurance | 50 (24.9%) | 151 (75.1%) |
| Real Estate, Rental & Leasing | 44 (60.3%) | 29 (39.7%) |
| Professional & Scientific | 94 (45.6%) | 112 (54.4%) |
| Enterprise Management | 0 (0.0%) | 0 (0.0%) |
| Administrative & Support | 75 (46.9%) | 85 (53.1%) |
| Educational Services | 204 (33.1%) | 413 (66.9%) |
| Health Care & Social Assistance | 75 (11.7%) | 568 (88.3%) |
| Arts, Entertainment & Recreation | 8 (18.2%) | 36 (81.8%) |
| Accommodation & Food Services | 175 (44.5%) | 218 (55.5%) |
| Public Administration | 93 (41.3%) | 132 (58.7%) |
| Total | 2,853 (53.4%) | 2,491 (46.6%) |
Education in Green River
School Enrollment in Green River
The most common levels of schooling among the 3,347 students in Green River are high school (803 | 24.0%), middle school (786 | 23.5%), and elementary school (706 | 21.1%).
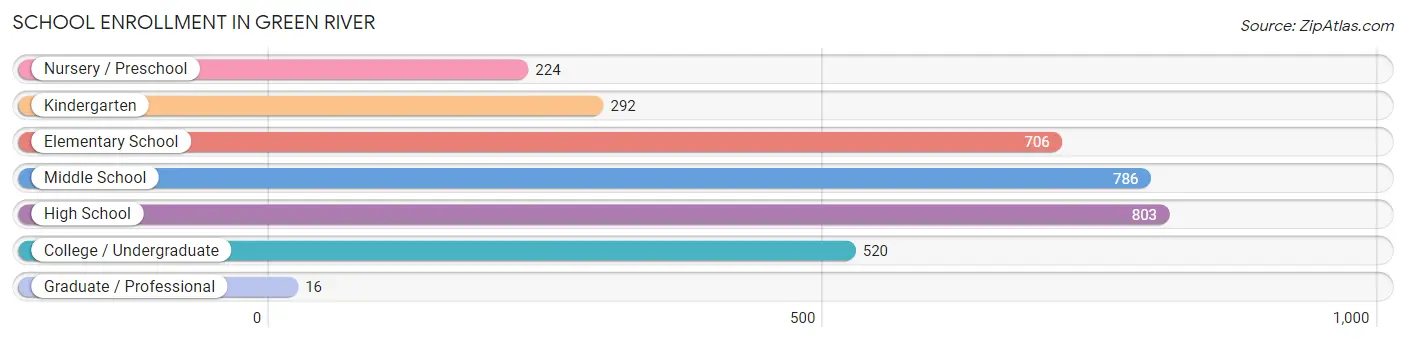
| School Level | # Students | % Students |
| Nursery / Preschool | 224 | 6.7% |
| Kindergarten | 292 | 8.7% |
| Elementary School | 706 | 21.1% |
| Middle School | 786 | 23.5% |
| High School | 803 | 24.0% |
| College / Undergraduate | 520 | 15.5% |
| Graduate / Professional | 16 | 0.5% |
| Total | 3,347 | 100.0% |
School Enrollment by Age by Funding Source in Green River
Out of a total of 3,347 students who are enrolled in schools in Green River, 204 (6.1%) attend a private institution, while the remaining 3,143 (93.9%) are enrolled in public schools. The age group of 3 to 4 year olds has the highest likelihood of being enrolled in private schools, with 76 (36.0% in the age bracket) enrolled. Conversely, the age group of 15 to 17 year olds has the lowest likelihood of being enrolled in a private school, with 577 (100.0% in the age bracket) attending a public institution.
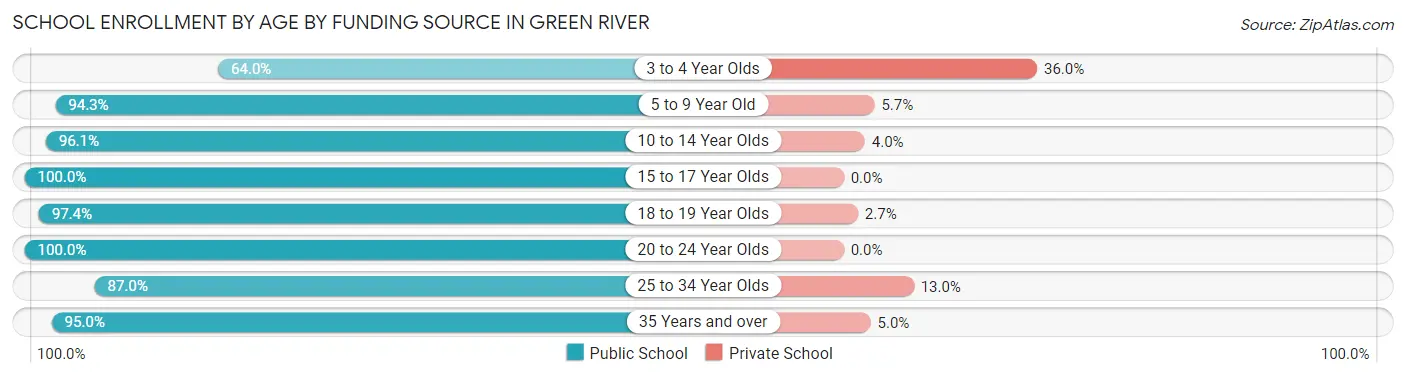
| Age Bracket | Public School | Private School |
| 3 to 4 Year Olds | 135 (64.0%) | 76 (36.0%) |
| 5 to 9 Year Old | 887 (94.3%) | 54 (5.7%) |
| 10 to 14 Year Olds | 899 (96.1%) | 37 (4.0%) |
| 15 to 17 Year Olds | 577 (100.0%) | 0 (0.0%) |
| 18 to 19 Year Olds | 220 (97.4%) | 6 (2.6%) |
| 20 to 24 Year Olds | 76 (100.0%) | 0 (0.0%) |
| 25 to 34 Year Olds | 140 (87.0%) | 21 (13.0%) |
| 35 Years and over | 208 (95.0%) | 11 (5.0%) |
| Total | 3,143 (93.9%) | 204 (6.1%) |
Educational Attainment by Field of Study in Green River
Education (399 | 21.8%), psychology (186 | 10.2%), engineering (177 | 9.7%), liberal arts & history (161 | 8.8%), and social sciences (160 | 8.7%) are the most common fields of study among 1,828 individuals in Green River who have obtained a bachelor's degree or higher.
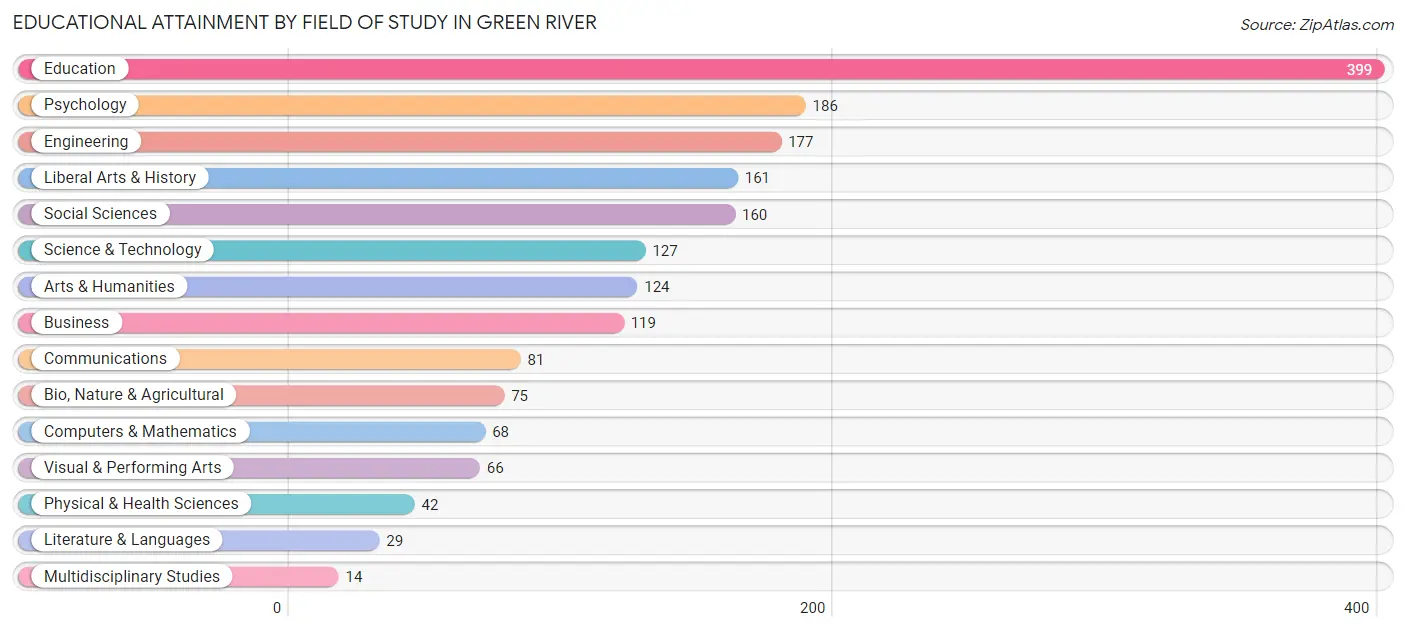
| Field of Study | # Graduates | % Graduates |
| Computers & Mathematics | 68 | 3.7% |
| Bio, Nature & Agricultural | 75 | 4.1% |
| Physical & Health Sciences | 42 | 2.3% |
| Psychology | 186 | 10.2% |
| Social Sciences | 160 | 8.7% |
| Engineering | 177 | 9.7% |
| Multidisciplinary Studies | 14 | 0.8% |
| Science & Technology | 127 | 7.0% |
| Business | 119 | 6.5% |
| Education | 399 | 21.8% |
| Literature & Languages | 29 | 1.6% |
| Liberal Arts & History | 161 | 8.8% |
| Visual & Performing Arts | 66 | 3.6% |
| Communications | 81 | 4.4% |
| Arts & Humanities | 124 | 6.8% |
| Total | 1,828 | 100.0% |
Transportation & Commute in Green River
Vehicle Availability by Sex in Green River
The most prevalent vehicle ownership categories in Green River are males with 3 vehicles (1,037, accounting for 36.3%) and females with 3 vehicles (880, making up 42.5%).
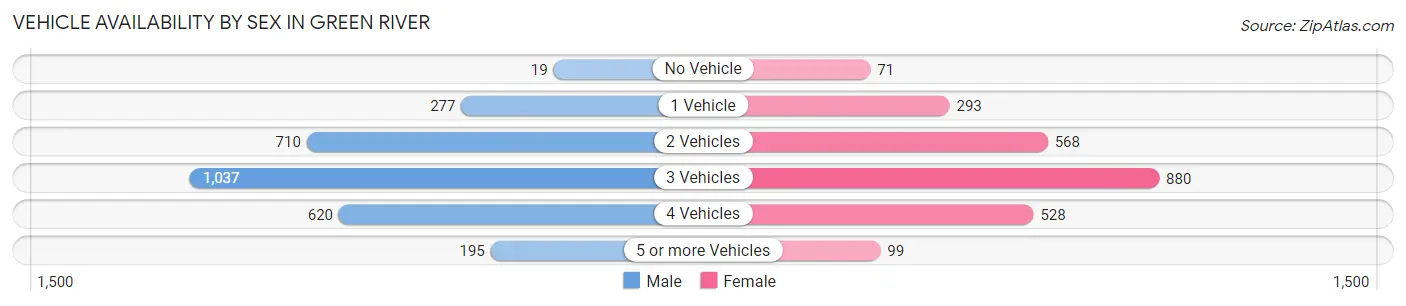
| Vehicles Available | Male | Female |
| No Vehicle | 19 (0.7%) | 71 (2.9%) |
| 1 Vehicle | 277 (9.7%) | 293 (12.0%) |
| 2 Vehicles | 710 (24.8%) | 568 (23.3%) |
| 3 Vehicles | 1,037 (36.3%) | 880 (36.1%) |
| 4 Vehicles | 620 (21.7%) | 528 (21.6%) |
| 5 or more Vehicles | 195 (6.8%) | 99 (4.1%) |
| Total | 2,858 (100.0%) | 2,439 (100.0%) |
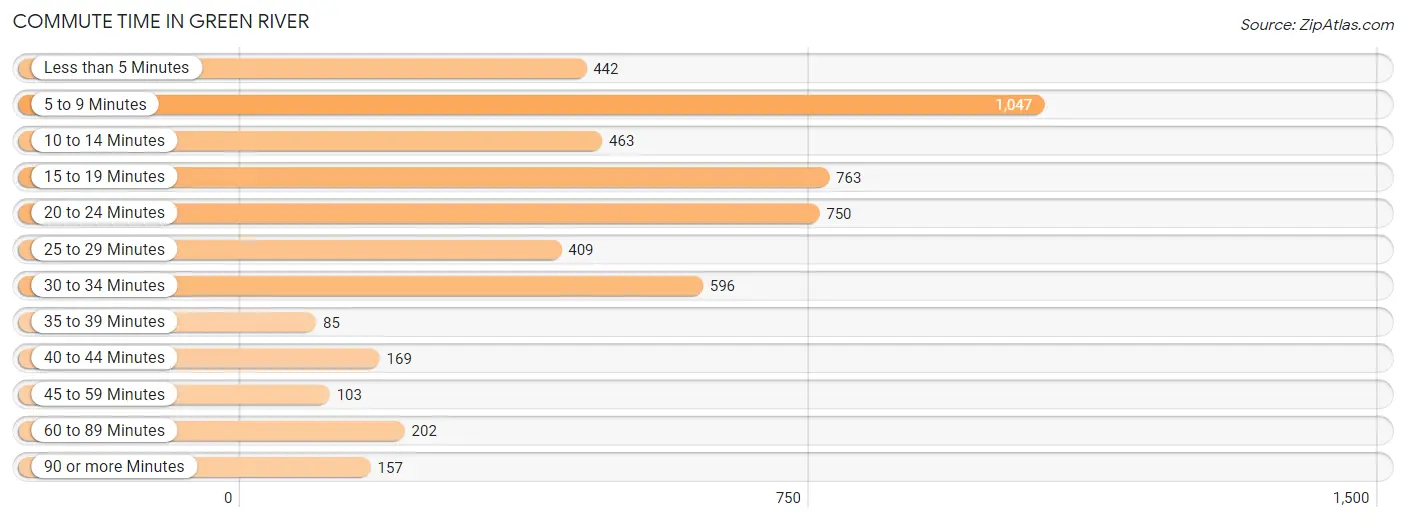
Commute Time in Green River
The most frequently occuring commute durations in Green River are 5 to 9 minutes (1,047 commuters, 20.2%), 15 to 19 minutes (763 commuters, 14.7%), and 20 to 24 minutes (750 commuters, 14.5%).
| Commute Time | # Commuters | % Commuters |
| Less than 5 Minutes | 442 | 8.5% |
| 5 to 9 Minutes | 1,047 | 20.2% |
| 10 to 14 Minutes | 463 | 8.9% |
| 15 to 19 Minutes | 763 | 14.7% |
| 20 to 24 Minutes | 750 | 14.5% |
| 25 to 29 Minutes | 409 | 7.9% |
| 30 to 34 Minutes | 596 | 11.5% |
| 35 to 39 Minutes | 85 | 1.6% |
| 40 to 44 Minutes | 169 | 3.3% |
| 45 to 59 Minutes | 103 | 2.0% |
| 60 to 89 Minutes | 202 | 3.9% |
| 90 or more Minutes | 157 | 3.0% |
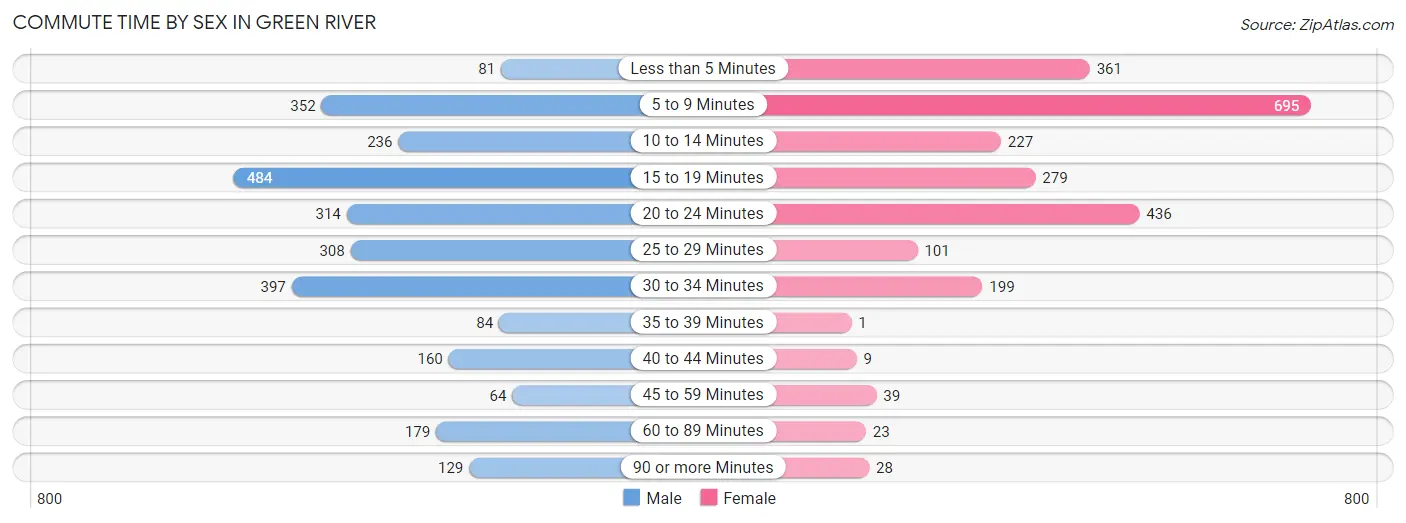
Commute Time by Sex in Green River
The most common commute times in Green River are 15 to 19 minutes (484 commuters, 17.4%) for males and 5 to 9 minutes (695 commuters, 29.0%) for females.
| Commute Time | Male | Female |
| Less than 5 Minutes | 81 (2.9%) | 361 (15.0%) |
| 5 to 9 Minutes | 352 (12.6%) | 695 (29.0%) |
| 10 to 14 Minutes | 236 (8.5%) | 227 (9.5%) |
| 15 to 19 Minutes | 484 (17.4%) | 279 (11.6%) |
| 20 to 24 Minutes | 314 (11.3%) | 436 (18.2%) |
| 25 to 29 Minutes | 308 (11.1%) | 101 (4.2%) |
| 30 to 34 Minutes | 397 (14.2%) | 199 (8.3%) |
| 35 to 39 Minutes | 84 (3.0%) | 1 (0.0%) |
| 40 to 44 Minutes | 160 (5.7%) | 9 (0.4%) |
| 45 to 59 Minutes | 64 (2.3%) | 39 (1.6%) |
| 60 to 89 Minutes | 179 (6.4%) | 23 (1.0%) |
| 90 or more Minutes | 129 (4.6%) | 28 (1.2%) |
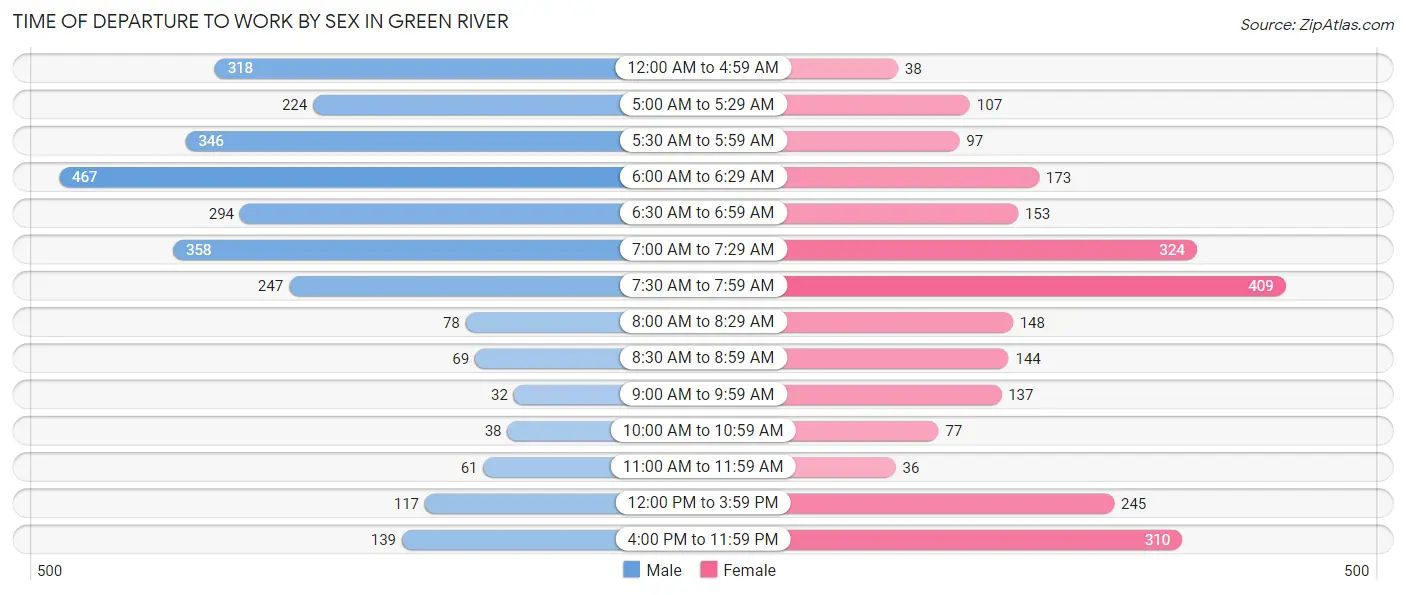
Time of Departure to Work by Sex in Green River
The most frequent times of departure to work in Green River are 6:00 AM to 6:29 AM (467, 16.8%) for males and 7:30 AM to 7:59 AM (409, 17.1%) for females.
| Time of Departure | Male | Female |
| 12:00 AM to 4:59 AM | 318 (11.4%) | 38 (1.6%) |
| 5:00 AM to 5:29 AM | 224 (8.0%) | 107 (4.5%) |
| 5:30 AM to 5:59 AM | 346 (12.4%) | 97 (4.1%) |
| 6:00 AM to 6:29 AM | 467 (16.8%) | 173 (7.2%) |
| 6:30 AM to 6:59 AM | 294 (10.5%) | 153 (6.4%) |
| 7:00 AM to 7:29 AM | 358 (12.8%) | 324 (13.5%) |
| 7:30 AM to 7:59 AM | 247 (8.9%) | 409 (17.1%) |
| 8:00 AM to 8:29 AM | 78 (2.8%) | 148 (6.2%) |
| 8:30 AM to 8:59 AM | 69 (2.5%) | 144 (6.0%) |
| 9:00 AM to 9:59 AM | 32 (1.1%) | 137 (5.7%) |
| 10:00 AM to 10:59 AM | 38 (1.4%) | 77 (3.2%) |
| 11:00 AM to 11:59 AM | 61 (2.2%) | 36 (1.5%) |
| 12:00 PM to 3:59 PM | 117 (4.2%) | 245 (10.2%) |
| 4:00 PM to 11:59 PM | 139 (5.0%) | 310 (12.9%) |
| Total | 2,788 (100.0%) | 2,398 (100.0%) |
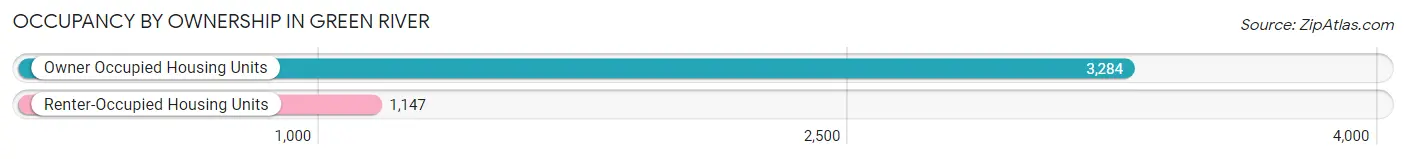
Housing Occupancy in Green River
Occupancy by Ownership in Green River
Of the total 4,431 dwellings in Green River, owner-occupied units account for 3,284 (74.1%), while renter-occupied units make up 1,147 (25.9%).
| Occupancy | # Housing Units | % Housing Units |
| Owner Occupied Housing Units | 3,284 | 74.1% |
| Renter-Occupied Housing Units | 1,147 | 25.9% |
| Total Occupied Housing Units | 4,431 | 100.0% |
Occupancy by Household Size in Green River
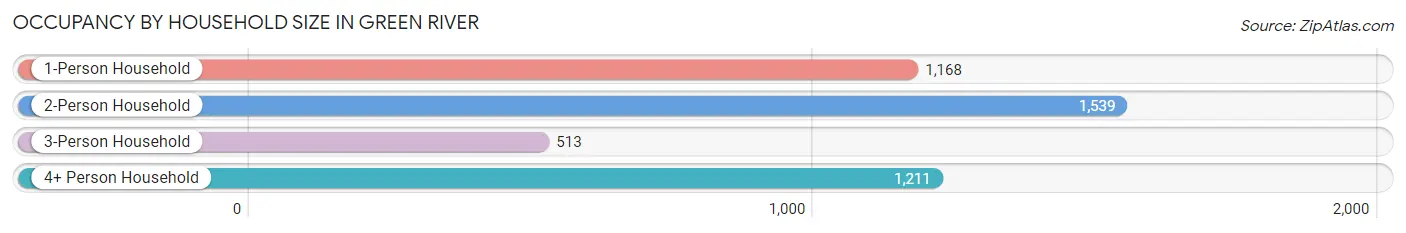
| Household Size | # Housing Units | % Housing Units |
| 1-Person Household | 1,168 | 26.4% |
| 2-Person Household | 1,539 | 34.7% |
| 3-Person Household | 513 | 11.6% |
| 4+ Person Household | 1,211 | 27.3% |
| Total Housing Units | 4,431 | 100.0% |
Occupancy by Ownership by Household Size in Green River
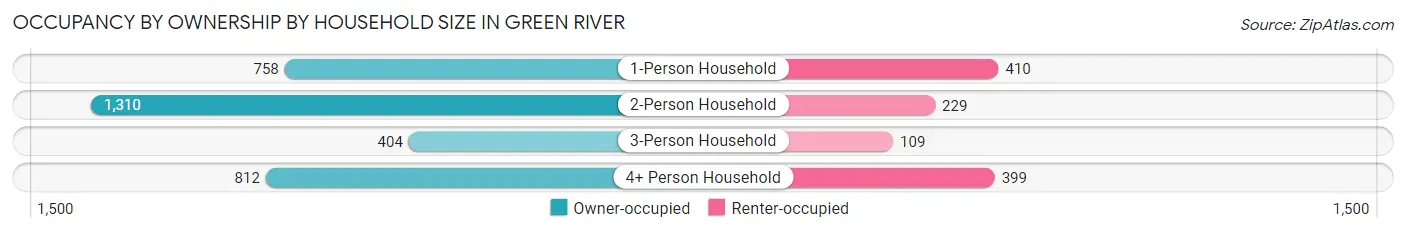
| Household Size | Owner-occupied | Renter-occupied |
| 1-Person Household | 758 (64.9%) | 410 (35.1%) |
| 2-Person Household | 1,310 (85.1%) | 229 (14.9%) |
| 3-Person Household | 404 (78.7%) | 109 (21.2%) |
| 4+ Person Household | 812 (67.0%) | 399 (33.0%) |
| Total Housing Units | 3,284 (74.1%) | 1,147 (25.9%) |
Occupancy by Educational Attainment in Green River
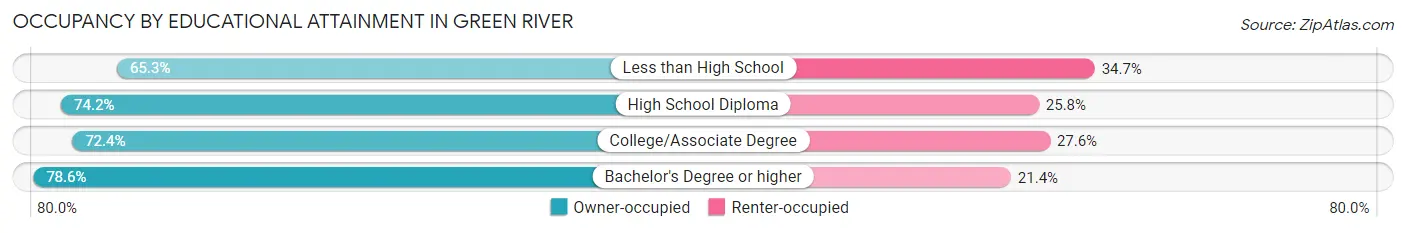
| Household Size | Owner-occupied | Renter-occupied |
| Less than High School | 115 (65.3%) | 61 (34.7%) |
| High School Diploma | 946 (74.2%) | 329 (25.8%) |
| College/Associate Degree | 1,406 (72.4%) | 535 (27.6%) |
| Bachelor's Degree or higher | 817 (78.6%) | 222 (21.4%) |
Occupancy by Age of Householder in Green River

| Age Bracket | # Households | % Households |
| Under 35 Years | 769 | 17.3% |
| 35 to 44 Years | 863 | 19.5% |
| 45 to 54 Years | 865 | 19.5% |
| 55 to 64 Years | 879 | 19.8% |
| 65 to 74 Years | 659 | 14.9% |
| 75 to 84 Years | 309 | 7.0% |
| 85 Years and Over | 87 | 2.0% |
| Total | 4,431 | 100.0% |
Housing Finances in Green River
Median Income by Occupancy in Green River
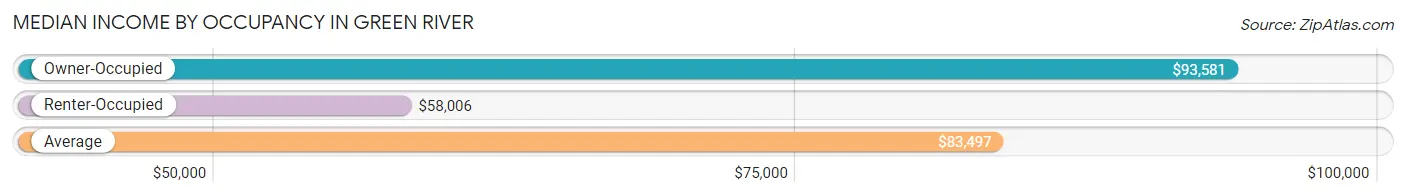
| Occupancy Type | # Households | Median Income |
| Owner-Occupied | 3,284 (74.1%) | $93,581 |
| Renter-Occupied | 1,147 (25.9%) | $58,006 |
| Average | 4,431 (100.0%) | $83,497 |
Occupancy by Householder Income Bracket in Green River
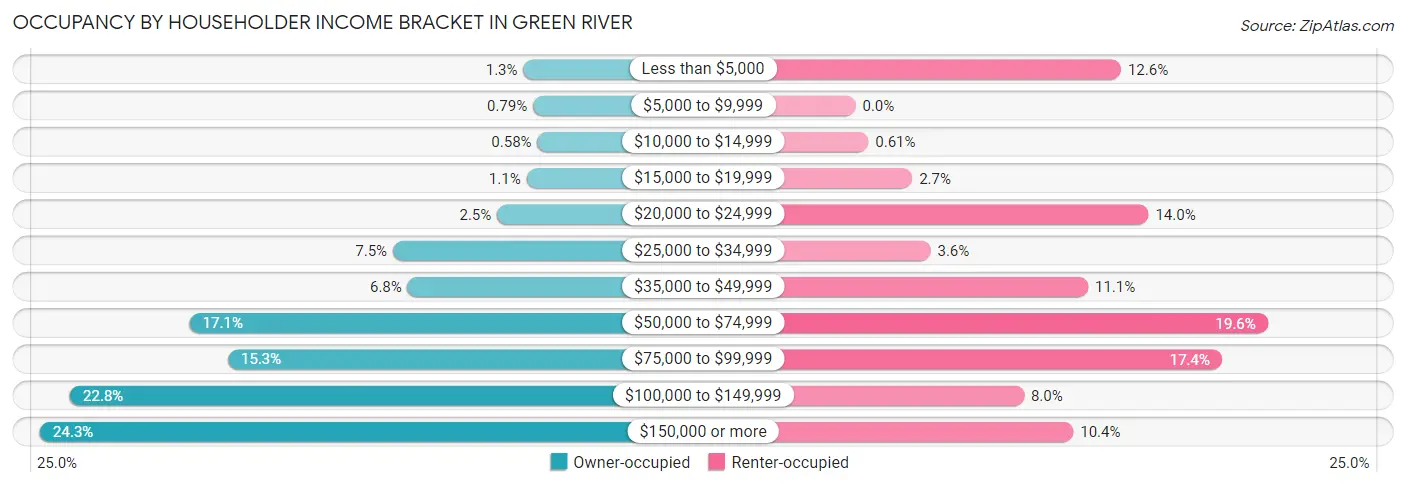
| Income Bracket | Owner-occupied | Renter-occupied |
| Less than $5,000 | 41 (1.3%) | 145 (12.6%) |
| $5,000 to $9,999 | 26 (0.8%) | 0 (0.0%) |
| $10,000 to $14,999 | 19 (0.6%) | 7 (0.6%) |
| $15,000 to $19,999 | 36 (1.1%) | 31 (2.7%) |
| $20,000 to $24,999 | 82 (2.5%) | 160 (14.0%) |
| $25,000 to $34,999 | 245 (7.5%) | 41 (3.6%) |
| $35,000 to $49,999 | 222 (6.8%) | 127 (11.1%) |
| $50,000 to $74,999 | 563 (17.1%) | 225 (19.6%) |
| $75,000 to $99,999 | 503 (15.3%) | 200 (17.4%) |
| $100,000 to $149,999 | 750 (22.8%) | 92 (8.0%) |
| $150,000 or more | 797 (24.3%) | 119 (10.4%) |
| Total | 3,284 (100.0%) | 1,147 (100.0%) |
Monthly Housing Cost Tiers in Green River
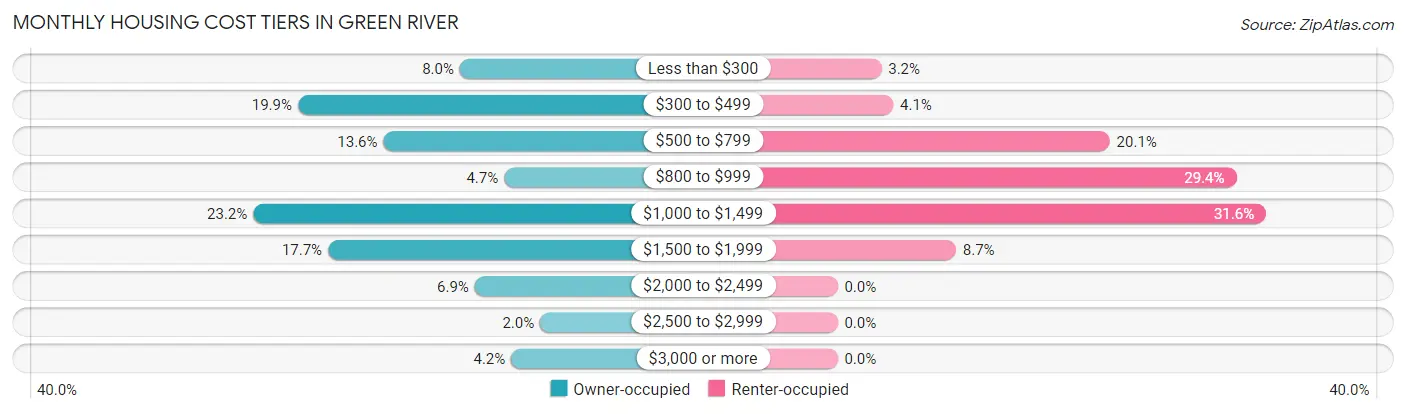
| Monthly Cost | Owner-occupied | Renter-occupied |
| Less than $300 | 261 (8.0%) | 37 (3.2%) |
| $300 to $499 | 653 (19.9%) | 47 (4.1%) |
| $500 to $799 | 446 (13.6%) | 230 (20.1%) |
| $800 to $999 | 154 (4.7%) | 337 (29.4%) |
| $1,000 to $1,499 | 761 (23.2%) | 362 (31.6%) |
| $1,500 to $1,999 | 580 (17.7%) | 100 (8.7%) |
| $2,000 to $2,499 | 225 (6.9%) | 0 (0.0%) |
| $2,500 to $2,999 | 67 (2.0%) | 0 (0.0%) |
| $3,000 or more | 137 (4.2%) | 0 (0.0%) |
| Total | 3,284 (100.0%) | 1,147 (100.0%) |
Physical Housing Characteristics in Green River
Housing Structures in Green River
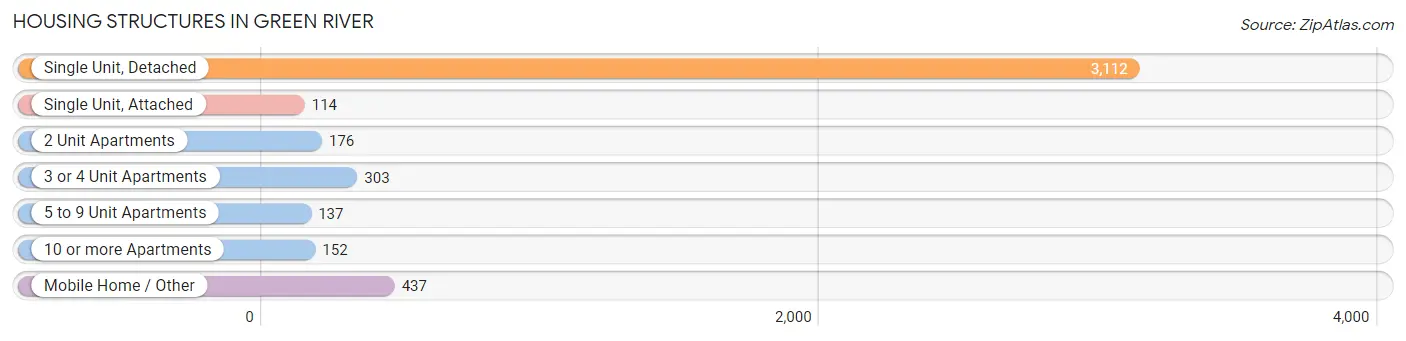
| Structure Type | # Housing Units | % Housing Units |
| Single Unit, Detached | 3,112 | 70.2% |
| Single Unit, Attached | 114 | 2.6% |
| 2 Unit Apartments | 176 | 4.0% |
| 3 or 4 Unit Apartments | 303 | 6.8% |
| 5 to 9 Unit Apartments | 137 | 3.1% |
| 10 or more Apartments | 152 | 3.4% |
| Mobile Home / Other | 437 | 9.9% |
| Total | 4,431 | 100.0% |
Housing Structures by Occupancy in Green River
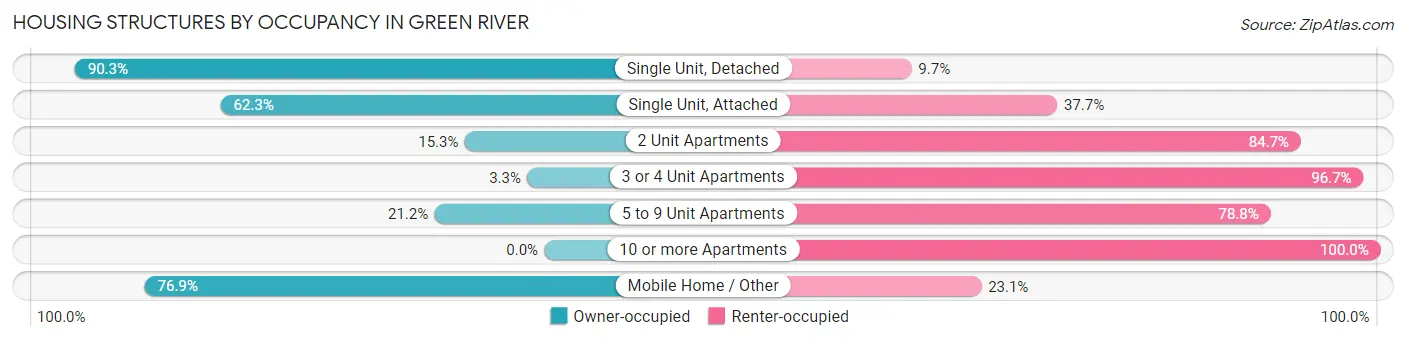
| Structure Type | Owner-occupied | Renter-occupied |
| Single Unit, Detached | 2,811 (90.3%) | 301 (9.7%) |
| Single Unit, Attached | 71 (62.3%) | 43 (37.7%) |
| 2 Unit Apartments | 27 (15.3%) | 149 (84.7%) |
| 3 or 4 Unit Apartments | 10 (3.3%) | 293 (96.7%) |
| 5 to 9 Unit Apartments | 29 (21.2%) | 108 (78.8%) |
| 10 or more Apartments | 0 (0.0%) | 152 (100.0%) |
| Mobile Home / Other | 336 (76.9%) | 101 (23.1%) |
| Total | 3,284 (74.1%) | 1,147 (25.9%) |
Housing Structures by Number of Rooms in Green River
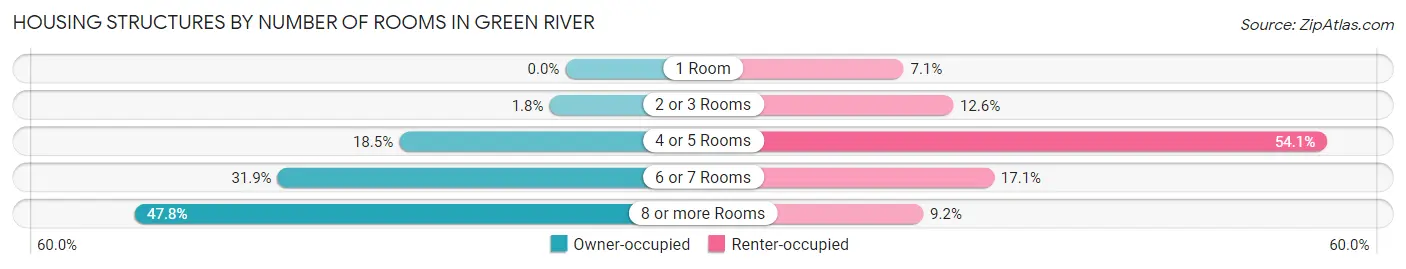
| Number of Rooms | Owner-occupied | Renter-occupied |
| 1 Room | 0 (0.0%) | 81 (7.1%) |
| 2 or 3 Rooms | 58 (1.8%) | 144 (12.6%) |
| 4 or 5 Rooms | 606 (18.4%) | 620 (54.0%) |
| 6 or 7 Rooms | 1,049 (31.9%) | 196 (17.1%) |
| 8 or more Rooms | 1,571 (47.8%) | 106 (9.2%) |
| Total | 3,284 (100.0%) | 1,147 (100.0%) |
Housing Structure by Heating Type in Green River
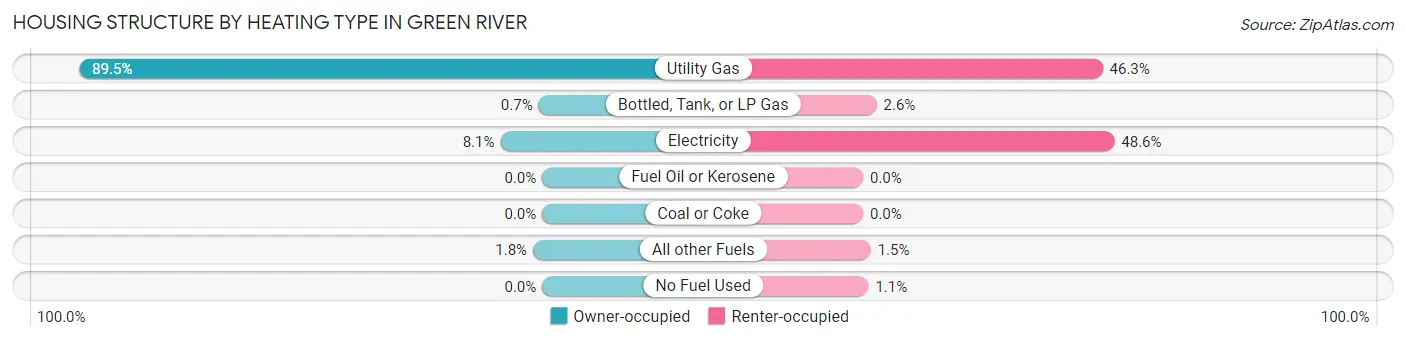
| Heating Type | Owner-occupied | Renter-occupied |
| Utility Gas | 2,938 (89.5%) | 531 (46.3%) |
| Bottled, Tank, or LP Gas | 23 (0.7%) | 30 (2.6%) |
| Electricity | 265 (8.1%) | 557 (48.6%) |
| Fuel Oil or Kerosene | 0 (0.0%) | 0 (0.0%) |
| Coal or Coke | 0 (0.0%) | 0 (0.0%) |
| All other Fuels | 58 (1.8%) | 17 (1.5%) |
| No Fuel Used | 0 (0.0%) | 12 (1.1%) |
| Total | 3,284 (100.0%) | 1,147 (100.0%) |
Household Vehicle Usage in Green River
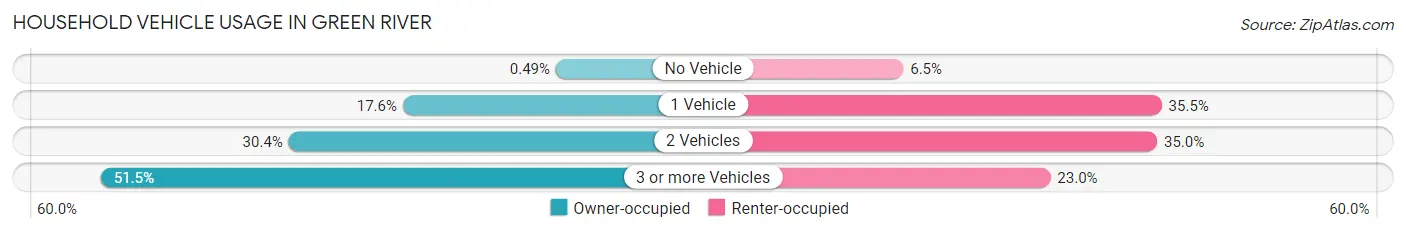
| Vehicles per Household | Owner-occupied | Renter-occupied |
| No Vehicle | 16 (0.5%) | 75 (6.5%) |
| 1 Vehicle | 579 (17.6%) | 407 (35.5%) |
| 2 Vehicles | 999 (30.4%) | 401 (35.0%) |
| 3 or more Vehicles | 1,690 (51.5%) | 264 (23.0%) |
| Total | 3,284 (100.0%) | 1,147 (100.0%) |
Real Estate & Mortgages in Green River
Real Estate and Mortgage Overview in Green River
| Characteristic | Without Mortgage | With Mortgage |
| Housing Units | 1,362 | 1,922 |
| Median Property Value | $221,800 | $262,200 |
| Median Household Income | $69,423 | $596 |
| Monthly Housing Costs | $434 | $128 |
| Real Estate Taxes | $1,287 | $42 |
Property Value by Mortgage Status in Green River
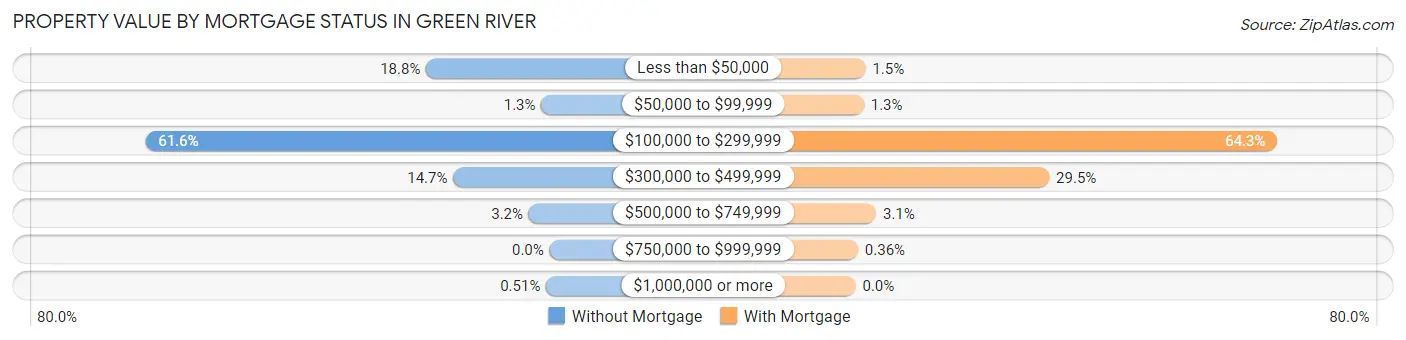
| Property Value | Without Mortgage | With Mortgage |
| Less than $50,000 | 256 (18.8%) | 29 (1.5%) |
| $50,000 to $99,999 | 17 (1.3%) | 24 (1.3%) |
| $100,000 to $299,999 | 839 (61.6%) | 1,235 (64.3%) |
| $300,000 to $499,999 | 200 (14.7%) | 567 (29.5%) |
| $500,000 to $749,999 | 43 (3.2%) | 60 (3.1%) |
| $750,000 to $999,999 | 0 (0.0%) | 7 (0.4%) |
| $1,000,000 or more | 7 (0.5%) | 0 (0.0%) |
| Total | 1,362 (100.0%) | 1,922 (100.0%) |
Household Income by Mortgage Status in Green River
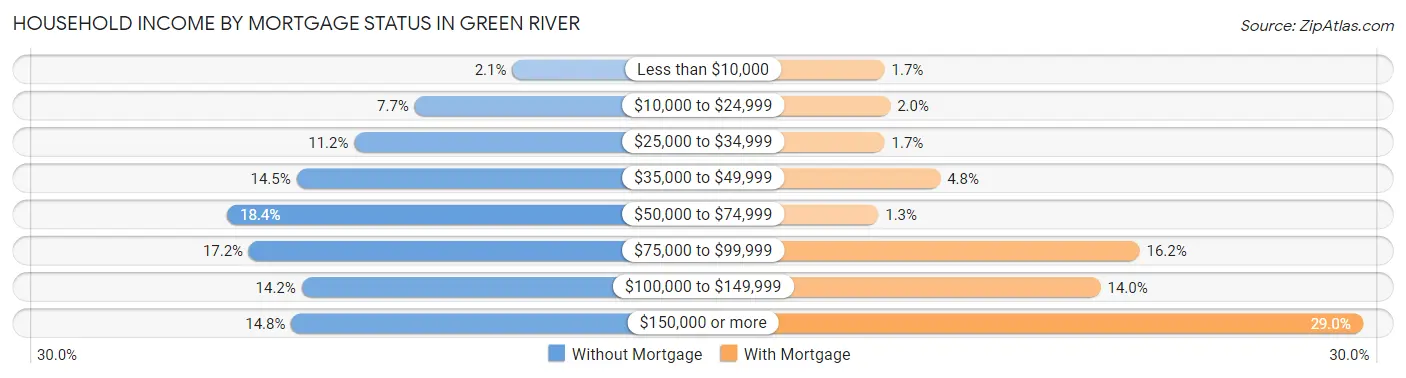
| Household Income | Without Mortgage | With Mortgage |
| Less than $10,000 | 29 (2.1%) | 32 (1.7%) |
| $10,000 to $24,999 | 105 (7.7%) | 38 (2.0%) |
| $25,000 to $34,999 | 152 (11.2%) | 32 (1.7%) |
| $35,000 to $49,999 | 197 (14.5%) | 93 (4.8%) |
| $50,000 to $74,999 | 251 (18.4%) | 25 (1.3%) |
| $75,000 to $99,999 | 234 (17.2%) | 312 (16.2%) |
| $100,000 to $149,999 | 193 (14.2%) | 269 (14.0%) |
| $150,000 or more | 201 (14.8%) | 557 (29.0%) |
| Total | 1,362 (100.0%) | 1,922 (100.0%) |
Property Value to Household Income Ratio in Green River
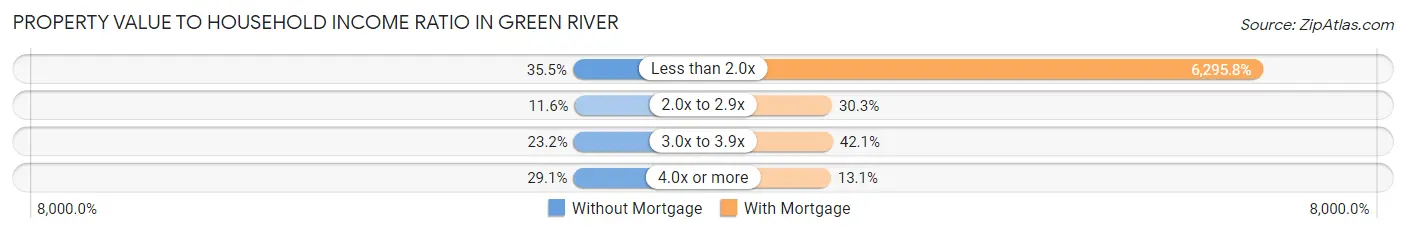
| Value-to-Income Ratio | Without Mortgage | With Mortgage |
| Less than 2.0x | 484 (35.5%) | 121,006 (6,295.8%) |
| 2.0x to 2.9x | 158 (11.6%) | 583 (30.3%) |
| 3.0x to 3.9x | 316 (23.2%) | 810 (42.1%) |
| 4.0x or more | 396 (29.1%) | 252 (13.1%) |
| Total | 1,362 (100.0%) | 1,922 (100.0%) |
Real Estate Taxes by Mortgage Status in Green River
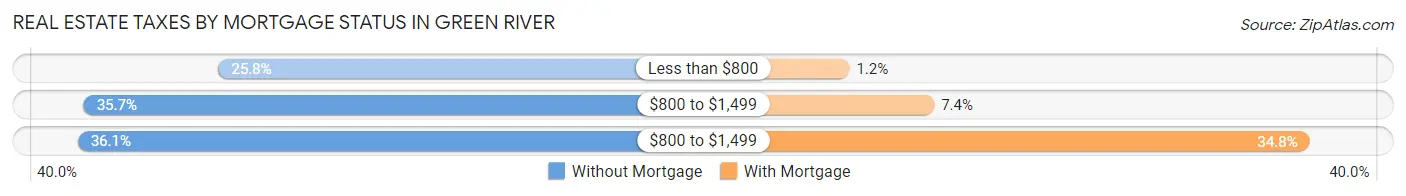
| Property Taxes | Without Mortgage | With Mortgage |
| Less than $800 | 352 (25.8%) | 23 (1.2%) |
| $800 to $1,499 | 486 (35.7%) | 142 (7.4%) |
| $800 to $1,499 | 492 (36.1%) | 669 (34.8%) |
| Total | 1,362 (100.0%) | 1,922 (100.0%) |
Health & Disability in Green River
Health Insurance Coverage by Age in Green River
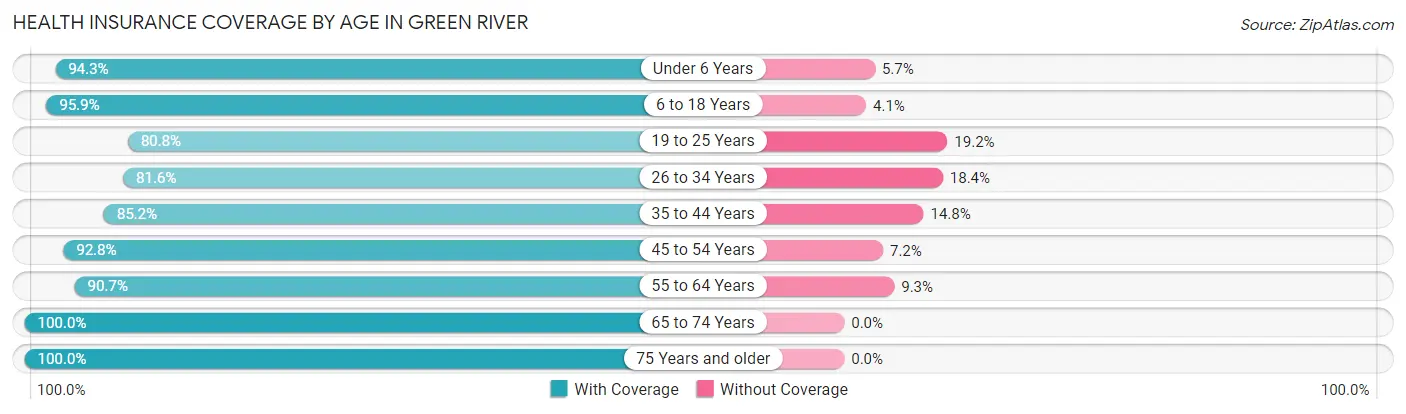
| Age Bracket | With Coverage | Without Coverage |
| Under 6 Years | 890 (94.3%) | 54 (5.7%) |
| 6 to 18 Years | 2,482 (95.9%) | 105 (4.1%) |
| 19 to 25 Years | 563 (80.8%) | 134 (19.2%) |
| 26 to 34 Years | 1,017 (81.6%) | 229 (18.4%) |
| 35 to 44 Years | 1,413 (85.2%) | 245 (14.8%) |
| 45 to 54 Years | 1,336 (92.8%) | 104 (7.2%) |
| 55 to 64 Years | 1,313 (90.7%) | 135 (9.3%) |
| 65 to 74 Years | 1,122 (100.0%) | 0 (0.0%) |
| 75 Years and older | 558 (100.0%) | 0 (0.0%) |
| Total | 10,694 (91.4%) | 1,006 (8.6%) |
Health Insurance Coverage by Citizenship Status in Green River
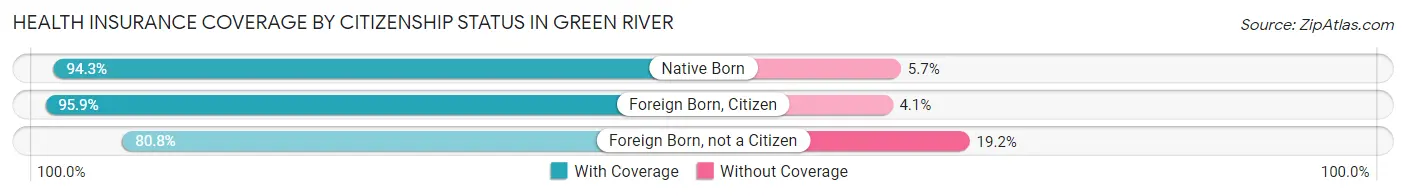
| Citizenship Status | With Coverage | Without Coverage |
| Native Born | 890 (94.3%) | 54 (5.7%) |
| Foreign Born, Citizen | 2,482 (95.9%) | 105 (4.1%) |
| Foreign Born, not a Citizen | 563 (80.8%) | 134 (19.2%) |
Health Insurance Coverage by Household Income in Green River
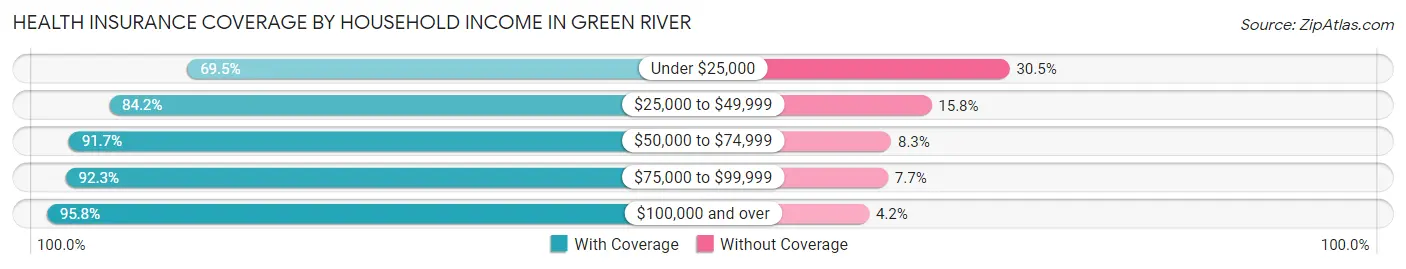
| Household Income | With Coverage | Without Coverage |
| Under $25,000 | 609 (69.5%) | 267 (30.5%) |
| $25,000 to $49,999 | 1,057 (84.2%) | 199 (15.8%) |
| $50,000 to $74,999 | 1,637 (91.7%) | 148 (8.3%) |
| $75,000 to $99,999 | 1,761 (92.3%) | 147 (7.7%) |
| $100,000 and over | 5,630 (95.8%) | 245 (4.2%) |
Public vs Private Health Insurance Coverage by Age in Green River
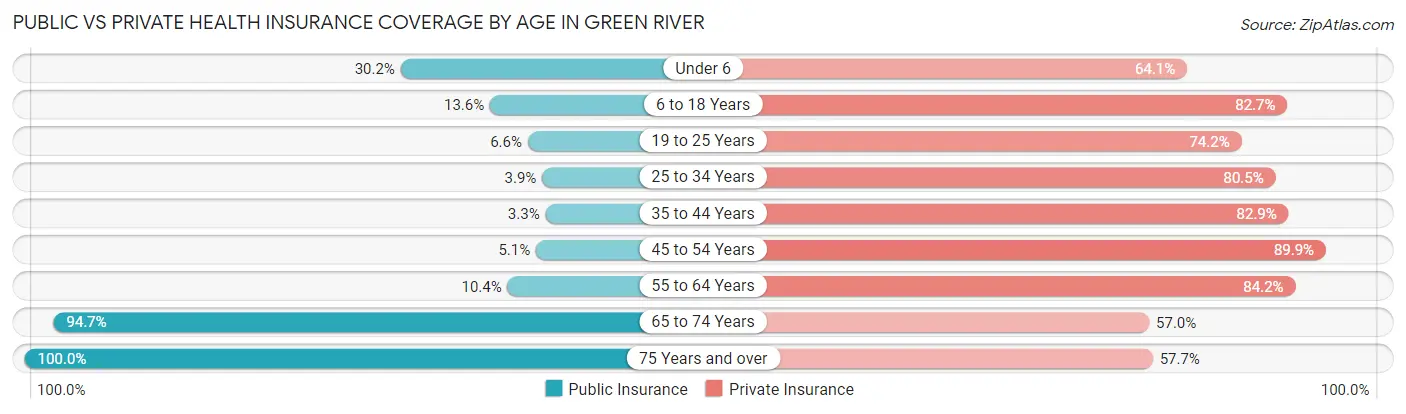
| Age Bracket | Public Insurance | Private Insurance |
| Under 6 | 285 (30.2%) | 605 (64.1%) |
| 6 to 18 Years | 352 (13.6%) | 2,139 (82.7%) |
| 19 to 25 Years | 46 (6.6%) | 517 (74.2%) |
| 25 to 34 Years | 49 (3.9%) | 1,003 (80.5%) |
| 35 to 44 Years | 55 (3.3%) | 1,375 (82.9%) |
| 45 to 54 Years | 73 (5.1%) | 1,294 (89.9%) |
| 55 to 64 Years | 150 (10.4%) | 1,219 (84.2%) |
| 65 to 74 Years | 1,062 (94.7%) | 640 (57.0%) |
| 75 Years and over | 558 (100.0%) | 322 (57.7%) |
| Total | 2,630 (22.5%) | 9,114 (77.9%) |
Disability Status by Sex by Age in Green River
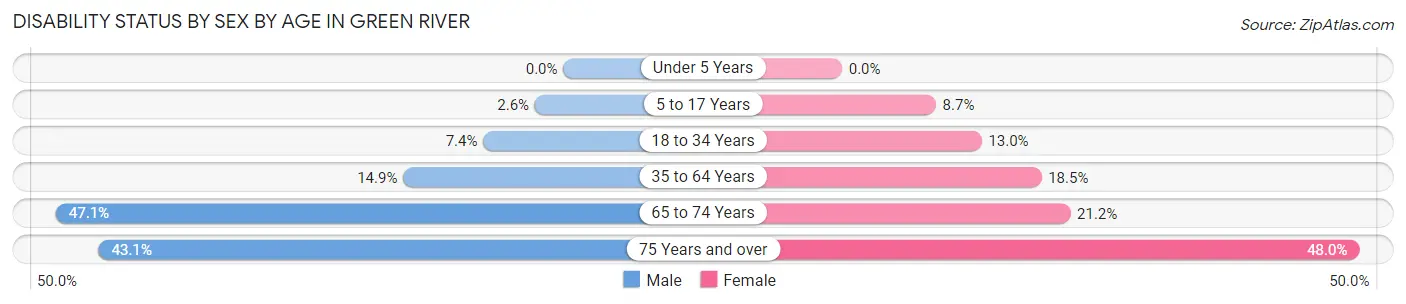
| Age Bracket | Male | Female |
| Under 5 Years | 0 (0.0%) | 0 (0.0%) |
| 5 to 17 Years | 35 (2.6%) | 112 (8.7%) |
| 18 to 34 Years | 75 (7.4%) | 148 (13.0%) |
| 35 to 64 Years | 332 (14.9%) | 428 (18.5%) |
| 65 to 74 Years | 315 (47.1%) | 96 (21.2%) |
| 75 Years and over | 88 (43.1%) | 170 (48.0%) |
Disability Class by Sex by Age in Green River
Disability Class: Hearing Difficulty
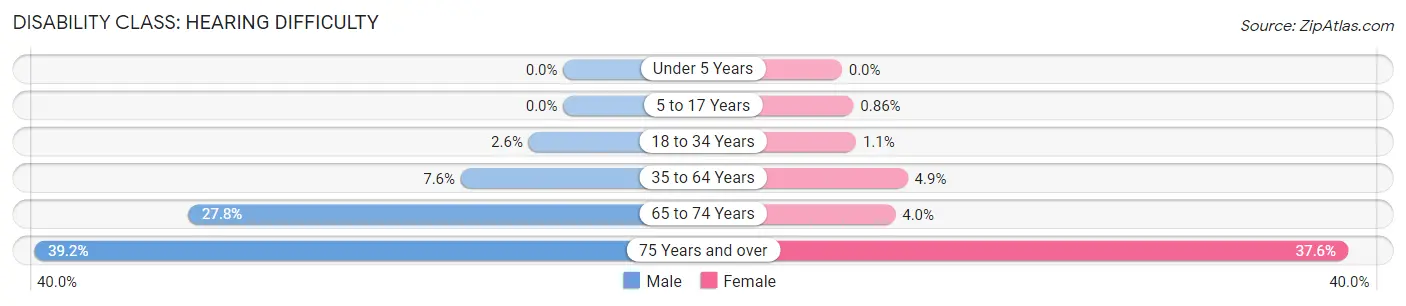
| Age Bracket | Male | Female |
| Under 5 Years | 0 (0.0%) | 0 (0.0%) |
| 5 to 17 Years | 0 (0.0%) | 11 (0.9%) |
| 18 to 34 Years | 26 (2.6%) | 12 (1.1%) |
| 35 to 64 Years | 170 (7.6%) | 113 (4.9%) |
| 65 to 74 Years | 186 (27.8%) | 18 (4.0%) |
| 75 Years and over | 80 (39.2%) | 133 (37.6%) |
Disability Class: Vision Difficulty
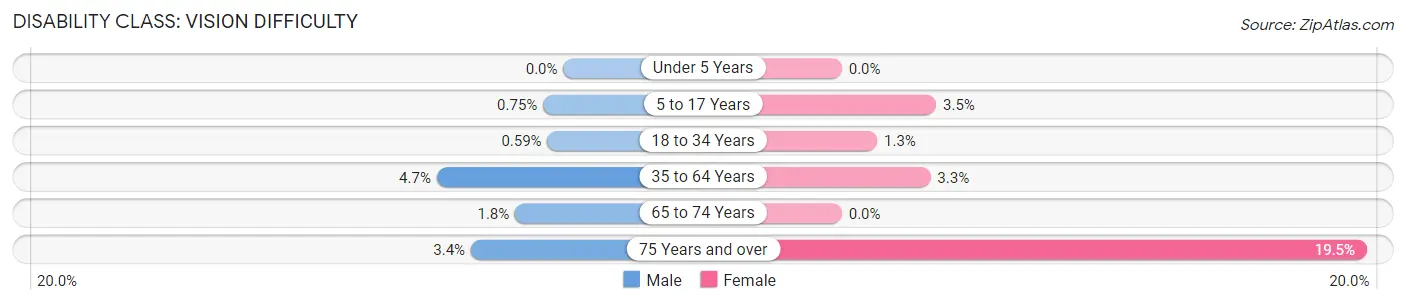
| Age Bracket | Male | Female |
| Under 5 Years | 0 (0.0%) | 0 (0.0%) |
| 5 to 17 Years | 10 (0.7%) | 45 (3.5%) |
| 18 to 34 Years | 6 (0.6%) | 15 (1.3%) |
| 35 to 64 Years | 105 (4.7%) | 76 (3.3%) |
| 65 to 74 Years | 12 (1.8%) | 0 (0.0%) |
| 75 Years and over | 7 (3.4%) | 69 (19.5%) |
Disability Class: Cognitive Difficulty
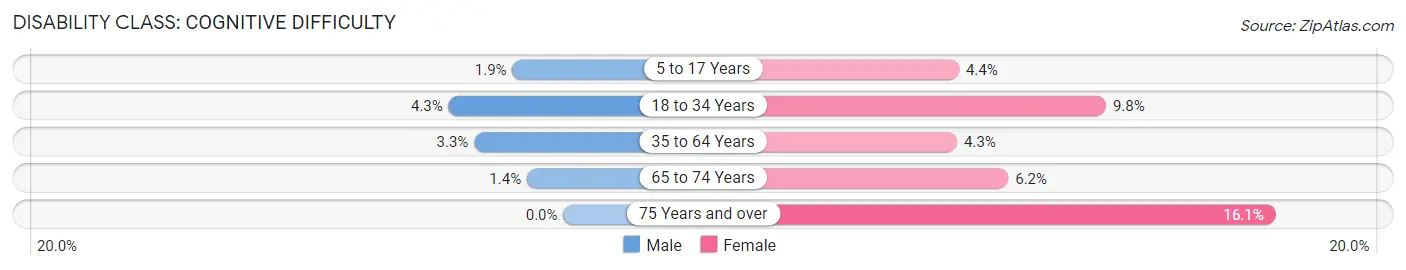
| Age Bracket | Male | Female |
| 5 to 17 Years | 25 (1.9%) | 56 (4.3%) |
| 18 to 34 Years | 43 (4.3%) | 112 (9.8%) |
| 35 to 64 Years | 74 (3.3%) | 99 (4.3%) |
| 65 to 74 Years | 9 (1.3%) | 28 (6.2%) |
| 75 Years and over | 0 (0.0%) | 57 (16.1%) |
Disability Class: Ambulatory Difficulty
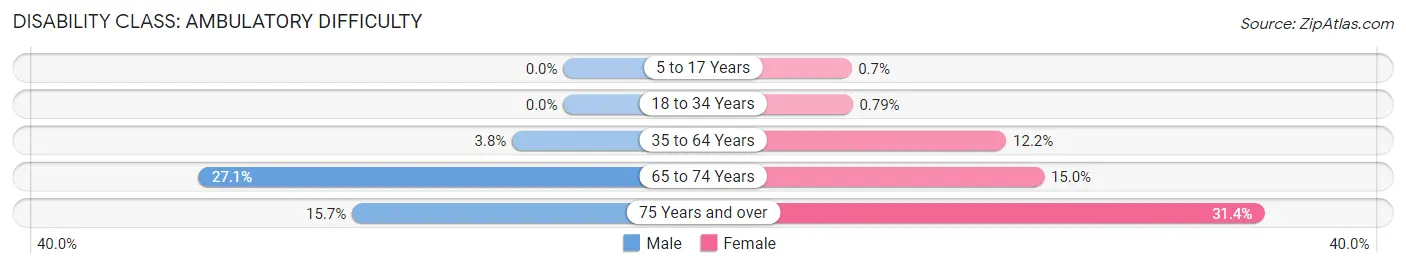
| Age Bracket | Male | Female |
| 5 to 17 Years | 0 (0.0%) | 9 (0.7%) |
| 18 to 34 Years | 0 (0.0%) | 9 (0.8%) |
| 35 to 64 Years | 85 (3.8%) | 282 (12.2%) |
| 65 to 74 Years | 181 (27.1%) | 68 (15.0%) |
| 75 Years and over | 32 (15.7%) | 111 (31.4%) |
Disability Class: Self-Care Difficulty
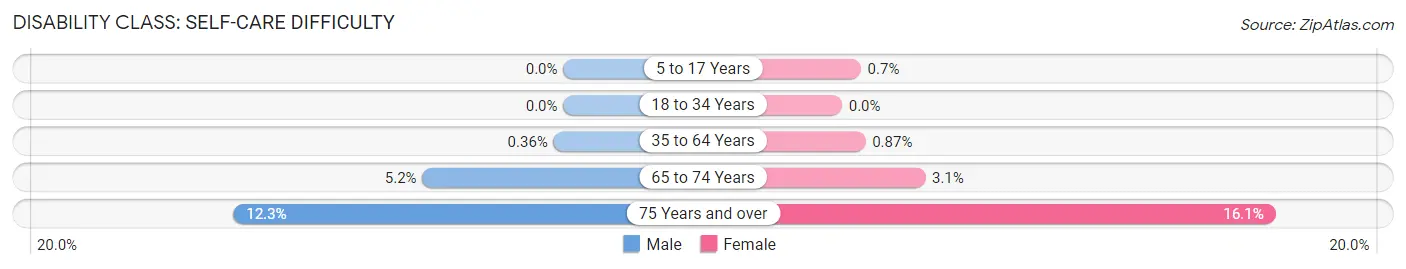
| Age Bracket | Male | Female |
| 5 to 17 Years | 0 (0.0%) | 9 (0.7%) |
| 18 to 34 Years | 0 (0.0%) | 0 (0.0%) |
| 35 to 64 Years | 8 (0.4%) | 20 (0.9%) |
| 65 to 74 Years | 35 (5.2%) | 14 (3.1%) |
| 75 Years and over | 25 (12.2%) | 57 (16.1%) |
Technology Access in Green River
Computing Device Access in Green River
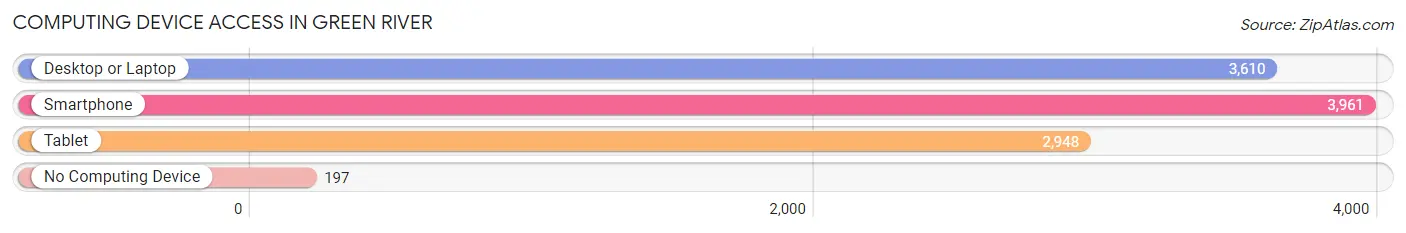
| Device Type | # Households | % Households |
| Desktop or Laptop | 3,610 | 81.5% |
| Smartphone | 3,961 | 89.4% |
| Tablet | 2,948 | 66.5% |
| No Computing Device | 197 | 4.4% |
| Total | 4,431 | 100.0% |
Internet Access in Green River
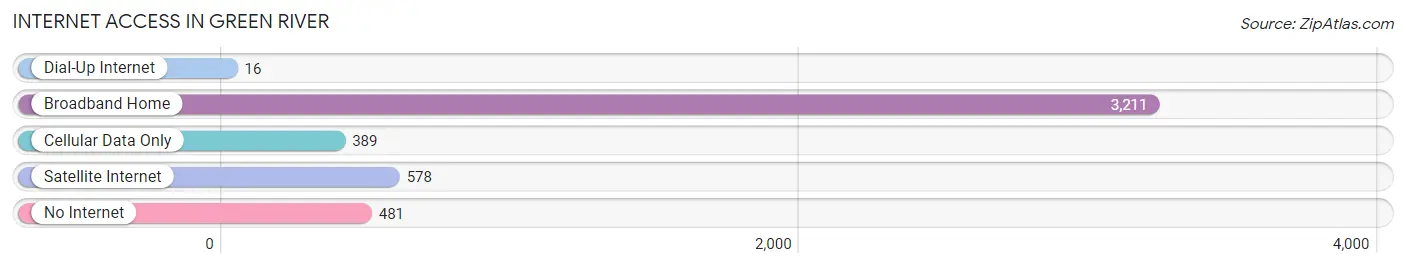
| Internet Type | # Households | % Households |
| Dial-Up Internet | 16 | 0.4% |
| Broadband Home | 3,211 | 72.5% |
| Cellular Data Only | 389 | 8.8% |
| Satellite Internet | 578 | 13.0% |
| No Internet | 481 | 10.9% |
| Total | 4,431 | 100.0% |
Green River Summary
Geography
Green River, Wyoming is located in the southwestern part of the state, in Sweetwater County. It is situated along the Green River, which is a tributary of the Colorado River. The city is located at an elevation of 5,945 feet (1,812 m) above sea level. The city is surrounded by the Red Desert to the north, the Uinta Mountains to the east, and the Wyoming Range to the west. The city is located at the intersection of Interstate 80 and U.S. Route 191.
The city has a total area of 8.2 square miles (21.2 km2), of which 8.1 square miles (21.0 km2) is land and 0.1 square miles (0.2 km2) is water. The city is located in a semi-arid climate, with hot summers and cold winters. The average annual precipitation is 8.5 inches (216 mm).
History
Green River was founded in 1868 as a trading post along the Green River. The city was named after the river, which was named by explorer John Wesley Powell in 1869. The city was incorporated in 1891.
In the late 19th century, the city was a major stop on the Union Pacific Railroad. The railroad brought in settlers and businesses, and the city grew rapidly. In the early 20th century, the city was a major hub for the oil and gas industry.
In the 1950s, the city was the site of a major uranium boom. The uranium industry brought in thousands of workers and helped to fuel the city's growth.
Economy
Green River's economy is largely based on the energy industry. The city is home to several oil and gas companies, as well as uranium mining and processing facilities. The city is also home to several manufacturing companies, including a large aluminum smelter.
The city is also a major transportation hub, with Interstate 80 and U.S. Route 191 running through the city. The city is served by the Green River Municipal Airport, which offers daily flights to Denver, Colorado.
Demographics
As of the 2010 census, the city had a population of 12,515. The racial makeup of the city was 87.3% White, 0.7% African American, 0.7% Native American, 0.7% Asian, 0.1% Pacific Islander, 8.2% from other races, and 2.3% from two or more races. Hispanic or Latino of any race were 16.2% of the population.
The median income for a household in the city was $41,945, and the median income for a family was $50,945. The per capita income for the city was $20,945. About 11.2% of families and 14.2% of the population were below the poverty line, including 19.2% of those under age 18 and 8.2% of those age 65 or over.
Green River is served by the Sweetwater County School District. The city is home to several schools, including Green River High School, Green River Middle School, and Green River Elementary School. The city is also home to Western Wyoming Community College.
Common Questions
What is Per Capita Income in Green River?
Per Capita income in Green River is $40,037.
What is the Median Family Income in Green River?
Median Family Income in Green River is $99,022.
What is the Median Household income in Green River?
Median Household Income in Green River is $83,497.
What is Income or Wage Gap in Green River?
Income or Wage Gap in Green River is 55.2%.
Women in Green River earn 44.8 cents for every dollar earned by a man.
What is Inequality or Gini Index in Green River?
Inequality or Gini Index in Green River is 0.41.
What is the Total Population of Green River?
Total Population of Green River is 11,772.
What is the Total Male Population of Green River?
Total Male Population of Green River is 5,949.
What is the Total Female Population of Green River?
Total Female Population of Green River is 5,823.
What is the Ratio of Males per 100 Females in Green River?
There are 102.16 Males per 100 Females in Green River.
What is the Ratio of Females per 100 Males in Green River?
There are 97.88 Females per 100 Males in Green River.
What is the Median Population Age in Green River?
Median Population Age in Green River is 37.8 Years.
What is the Average Family Size in Green River
Average Family Size in Green River is 3.2 People.
What is the Average Household Size in Green River
Average Household Size in Green River is 2.6 People.
How Large is the Labor Force in Green River?
There are 5,694 People in the Labor Forcein in Green River.
What is the Percentage of People in the Labor Force in Green River?
64.4% of People are in the Labor Force in Green River.
What is the Unemployment Rate in Green River?
Unemployment Rate in Green River is 6.1%.