Marbleton, WY Map & Demographics
Marbleton Map
Marbleton Overview
$25,053
PER CAPITA INCOME
$74,375
AVG FAMILY INCOME
$71,750
AVG HOUSEHOLD INCOME
56.1%
WAGE / INCOME GAP [ % ]
43.9¢/ $1
WAGE / INCOME GAP [ $ ]
0.36
INEQUALITY / GINI INDEX
1,187
TOTAL POPULATION
744
MALE POPULATION
443
FEMALE POPULATION
167.95
MALES / 100 FEMALES
59.54
FEMALES / 100 MALES
31.4
MEDIAN AGE
3.7
AVG FAMILY SIZE
3.3
AVG HOUSEHOLD SIZE
522
LABOR FORCE [ PEOPLE ]
56.6%
PERCENT IN LABOR FORCE
13.0%
UNEMPLOYMENT RATE
Income in Marbleton
Income Overview in Marbleton
Per Capita Income in Marbleton is $25,053, while median incomes of families and households are $74,375 and $71,750 respectively.
| Characteristic | Number | Measure |
| Per Capita Income | 1,187 | $25,053 |
| Median Family Income | 270 | $74,375 |
| Mean Family Income | 270 | $80,747 |
| Median Household Income | 359 | $71,750 |
| Mean Household Income | 359 | $75,667 |
| Income Deficit | 270 | $0 |
| Wage / Income Gap (%) | 1,187 | 56.08% |
| Wage / Income Gap ($) | 1,187 | 43.92¢ per $1 |
| Gini / Inequality Index | 1,187 | 0.36 |
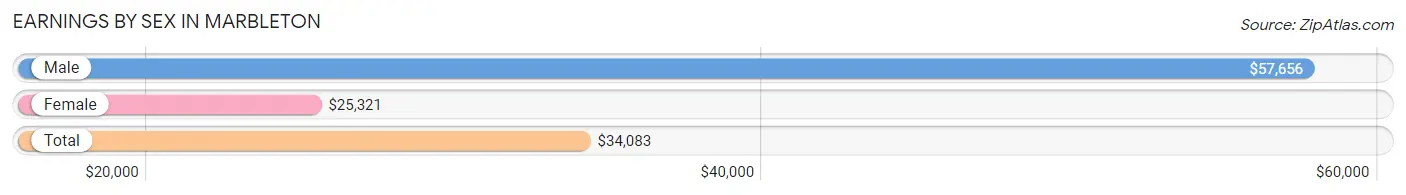
Earnings by Sex in Marbleton
Average Earnings in Marbleton are $34,083, $57,656 for men and $25,321 for women, a difference of 56.1%.
| Sex | Number | Average Earnings |
| Male | 306 (61.6%) | $57,656 |
| Female | 191 (38.4%) | $25,321 |
| Total | 497 (100.0%) | $34,083 |
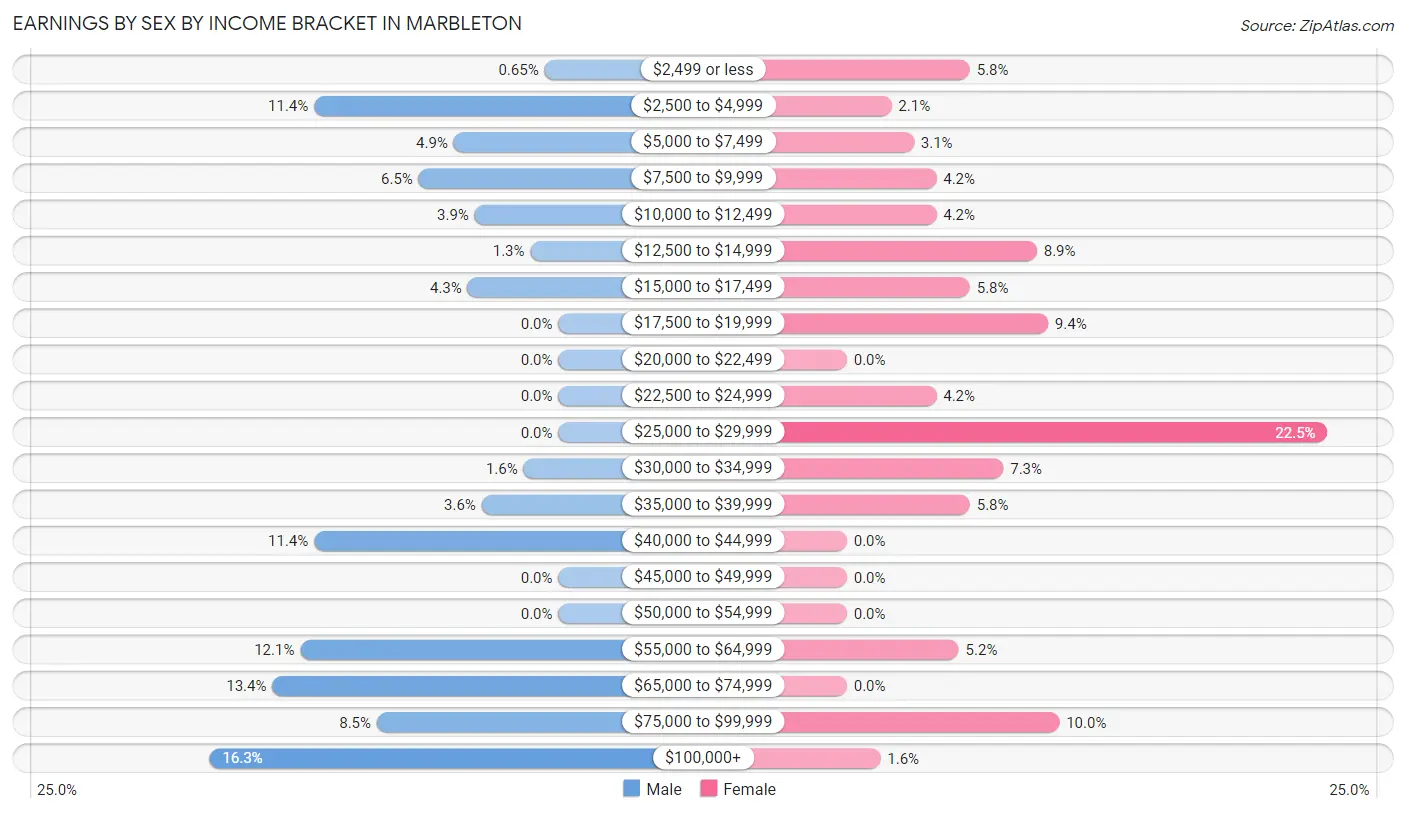
Earnings by Sex by Income Bracket in Marbleton
The most common earnings brackets in Marbleton are $100,000+ for men (50 | 16.3%) and $25,000 to $29,999 for women (43 | 22.5%).
| Income | Male | Female |
| $2,499 or less | 2 (0.6%) | 11 (5.8%) |
| $2,500 to $4,999 | 35 (11.4%) | 4 (2.1%) |
| $5,000 to $7,499 | 15 (4.9%) | 6 (3.1%) |
| $7,500 to $9,999 | 20 (6.5%) | 8 (4.2%) |
| $10,000 to $12,499 | 12 (3.9%) | 8 (4.2%) |
| $12,500 to $14,999 | 4 (1.3%) | 17 (8.9%) |
| $15,000 to $17,499 | 13 (4.3%) | 11 (5.8%) |
| $17,500 to $19,999 | 0 (0.0%) | 18 (9.4%) |
| $20,000 to $22,499 | 0 (0.0%) | 0 (0.0%) |
| $22,500 to $24,999 | 0 (0.0%) | 8 (4.2%) |
| $25,000 to $29,999 | 0 (0.0%) | 43 (22.5%) |
| $30,000 to $34,999 | 5 (1.6%) | 14 (7.3%) |
| $35,000 to $39,999 | 11 (3.6%) | 11 (5.8%) |
| $40,000 to $44,999 | 35 (11.4%) | 0 (0.0%) |
| $45,000 to $49,999 | 0 (0.0%) | 0 (0.0%) |
| $50,000 to $54,999 | 0 (0.0%) | 0 (0.0%) |
| $55,000 to $64,999 | 37 (12.1%) | 10 (5.2%) |
| $65,000 to $74,999 | 41 (13.4%) | 0 (0.0%) |
| $75,000 to $99,999 | 26 (8.5%) | 19 (10.0%) |
| $100,000+ | 50 (16.3%) | 3 (1.6%) |
| Total | 306 (100.0%) | 191 (100.0%) |
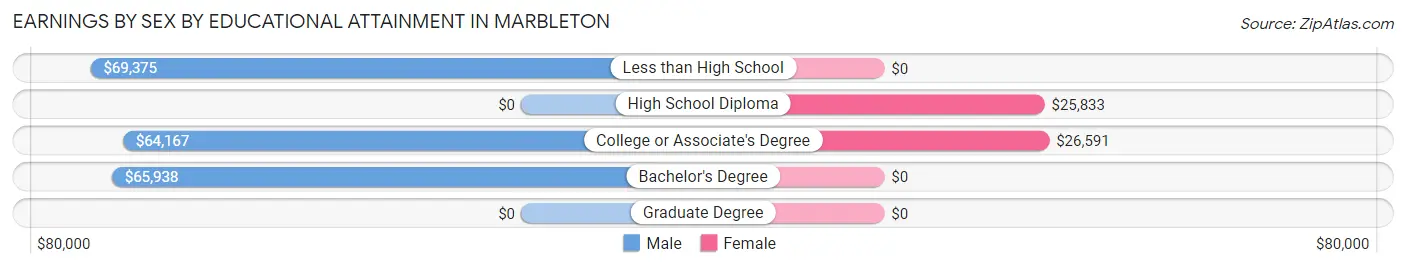
Earnings by Sex by Educational Attainment in Marbleton
Average earnings in Marbleton are $61,417 for men and $25,821 for women, a difference of 58.0%. Men with an educational attainment of less than high school enjoy the highest average annual earnings of $69,375, while those with college or associate's degree education earn the least with $64,167. Women with an educational attainment of college or associate's degree earn the most with the average annual earnings of $26,591, while those with high school diploma education have the smallest earnings of $25,833.
| Educational Attainment | Male Income | Female Income |
| Less than High School | $69,375 | $0 |
| High School Diploma | - | - |
| College or Associate's Degree | $64,167 | $26,591 |
| Bachelor's Degree | $65,938 | $0 |
| Graduate Degree | - | - |
| Total | $61,417 | $25,821 |
Family Income in Marbleton
Family Income Brackets in Marbleton
According to the Marbleton family income data, there are 78 families falling into the $100,000 to $149,999 income range, which is the most common income bracket and makes up 28.9% of all families.
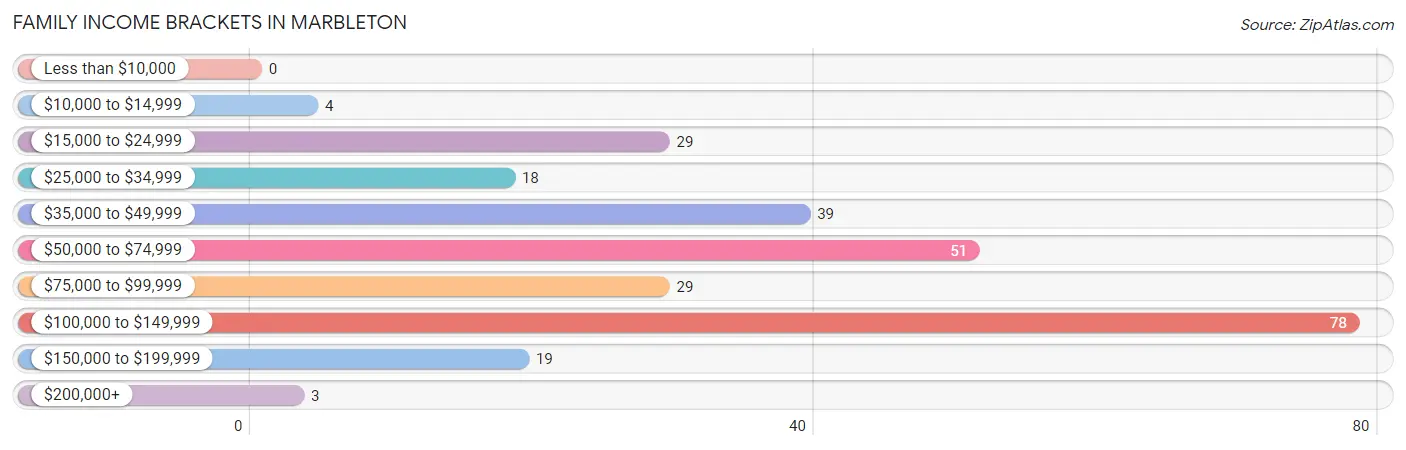
| Income Bracket | # Families | % Families |
| Less than $10,000 | 0 | 0.0% |
| $10,000 to $14,999 | 4 | 1.5% |
| $15,000 to $24,999 | 29 | 10.7% |
| $25,000 to $34,999 | 18 | 6.7% |
| $35,000 to $49,999 | 39 | 14.4% |
| $50,000 to $74,999 | 51 | 18.9% |
| $75,000 to $99,999 | 29 | 10.7% |
| $100,000 to $149,999 | 78 | 28.9% |
| $150,000 to $199,999 | 19 | 7.0% |
| $200,000+ | 3 | 1.1% |
Family Income by Famaliy Size in Marbleton
4-person families (41 | 15.2%) account for the highest median family income in Marbleton with $112,083 per family, while 2-person families (141 | 52.2%) have the highest median income of $29,427 per family member.
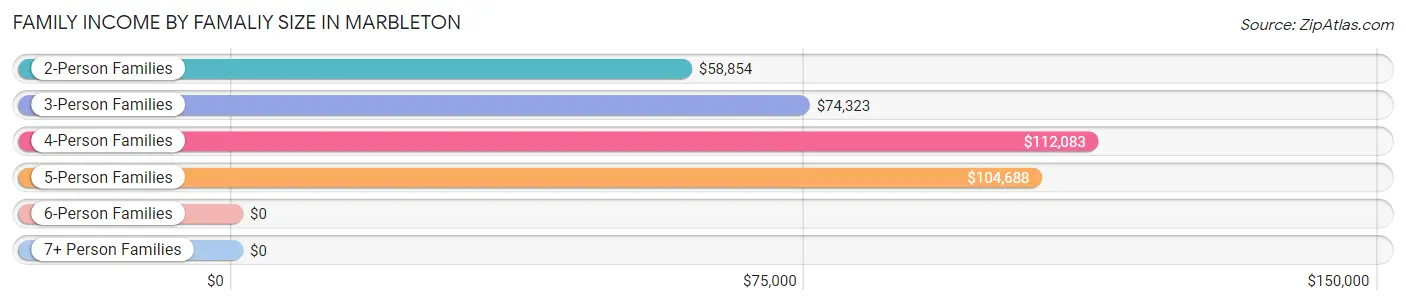
| Income Bracket | # Families | Median Income |
| 2-Person Families | 141 (52.2%) | $58,854 |
| 3-Person Families | 53 (19.6%) | $74,323 |
| 4-Person Families | 41 (15.2%) | $112,083 |
| 5-Person Families | 22 (8.2%) | $104,688 |
| 6-Person Families | 13 (4.8%) | $0 |
| 7+ Person Families | 0 (0.0%) | $0 |
| Total | 270 (100.0%) | $74,375 |
Family Income by Number of Earners in Marbleton
The median family income in Marbleton is $74,375, with families comprising 3+ earners (28) having the highest median family income of $175,208, while families with 1 earner (116) have the lowest median family income of $37,037, accounting for 10.4% and 43.0% of families, respectively.
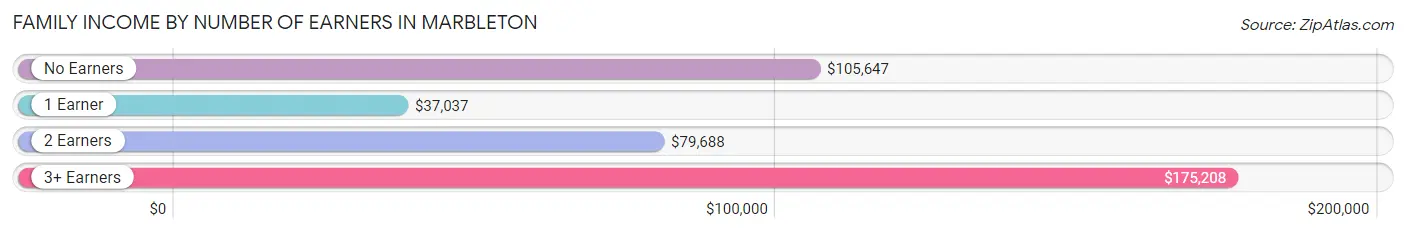
| Number of Earners | # Families | Median Income |
| No Earners | 51 (18.9%) | $105,647 |
| 1 Earner | 116 (43.0%) | $37,037 |
| 2 Earners | 75 (27.8%) | $79,688 |
| 3+ Earners | 28 (10.4%) | $175,208 |
| Total | 270 (100.0%) | $74,375 |
Household Income in Marbleton
Household Income Brackets in Marbleton
With 79 households falling in the category, the $100,000 to $149,999 income range is the most frequent in Marbleton, accounting for 22.0% of all households. In contrast, only 3 households (0.8%) fall into the $200,000+ income bracket, making it the least populous group.
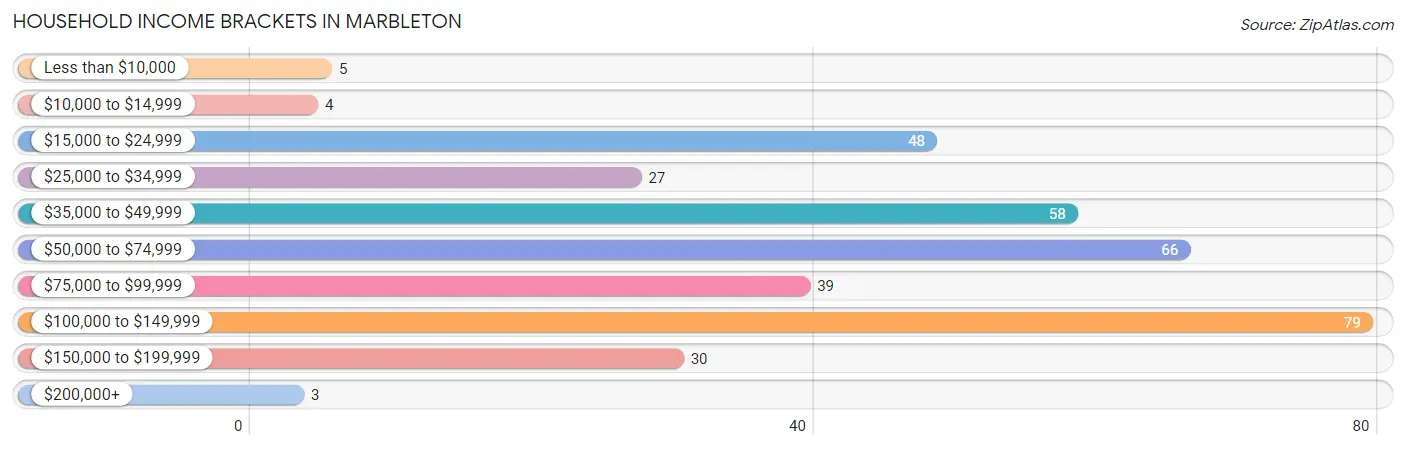
| Income Bracket | # Households | % Households |
| Less than $10,000 | 5 | 1.4% |
| $10,000 to $14,999 | 4 | 1.1% |
| $15,000 to $24,999 | 48 | 13.4% |
| $25,000 to $34,999 | 27 | 7.5% |
| $35,000 to $49,999 | 58 | 16.2% |
| $50,000 to $74,999 | 66 | 18.4% |
| $75,000 to $99,999 | 39 | 10.9% |
| $100,000 to $149,999 | 79 | 22.0% |
| $150,000 to $199,999 | 30 | 8.4% |
| $200,000+ | 3 | 0.8% |
Household Income by Householder Age in Marbleton
The median household income in Marbleton is $71,750, with the highest median household income of $74,479 found in the 25 to 44 years age bracket for the primary householder. A total of 134 households (37.3%) fall into this category. Meanwhile, the 15 to 24 years age bracket for the primary householder has the lowest median household income of $0, with 2 households (0.6%) in this group.
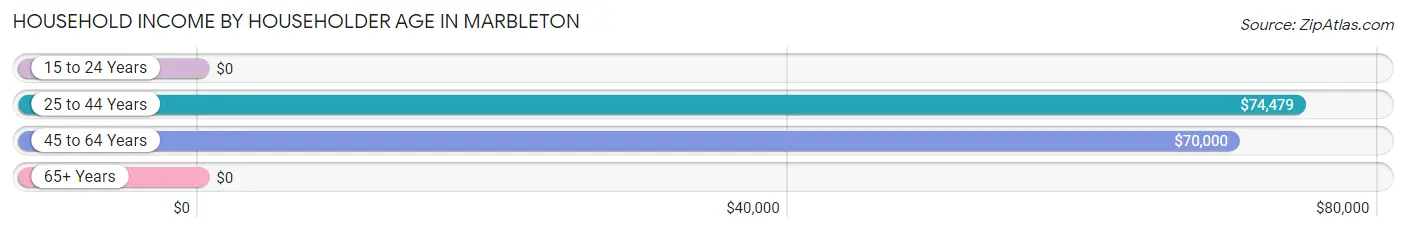
| Income Bracket | # Households | Median Income |
| 15 to 24 Years | 2 (0.6%) | $0 |
| 25 to 44 Years | 134 (37.3%) | $74,479 |
| 45 to 64 Years | 112 (31.2%) | $70,000 |
| 65+ Years | 111 (30.9%) | $0 |
| Total | 359 (100.0%) | $71,750 |
Poverty in Marbleton
Income Below Poverty by Sex and Age in Marbleton
With 26.1% poverty level for males and 15.2% for females among the residents of Marbleton, 18 to 24 year old males and 15 year old females are the most vulnerable to poverty, with 113 males (80.1%) and 4 females (100.0%) in their respective age groups living below the poverty level.
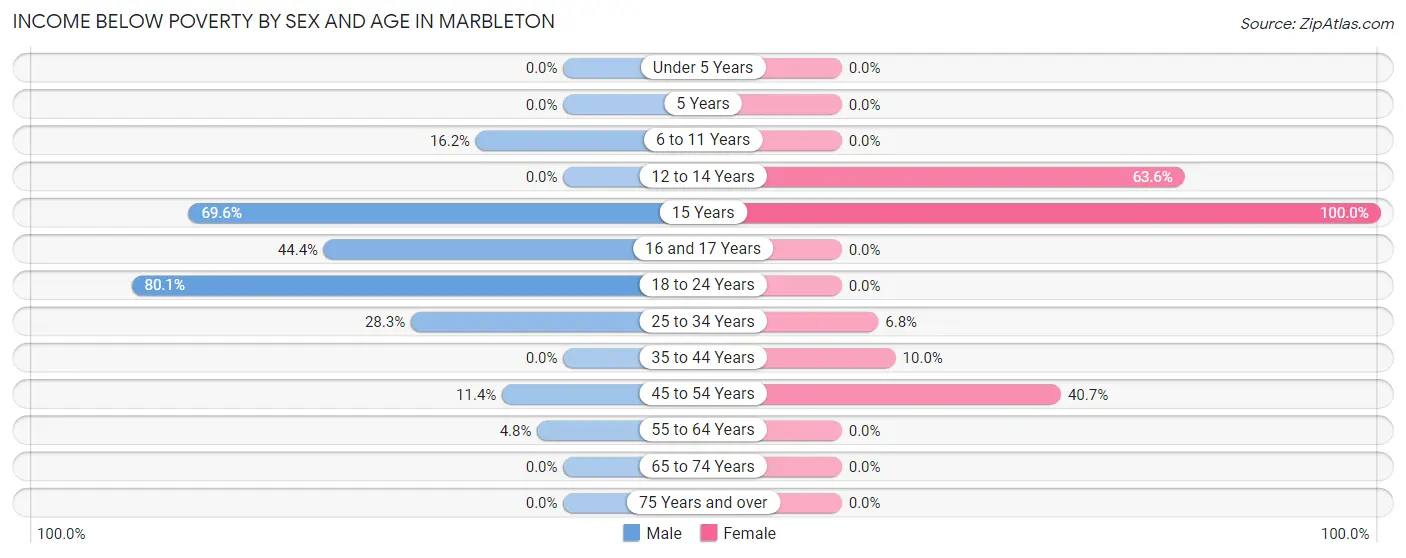
| Age Bracket | Male | Female |
| Under 5 Years | 0 (0.0%) | 0 (0.0%) |
| 5 Years | 0 (0.0%) | 0 (0.0%) |
| 6 to 11 Years | 6 (16.2%) | 0 (0.0%) |
| 12 to 14 Years | 0 (0.0%) | 28 (63.6%) |
| 15 Years | 16 (69.6%) | 4 (100.0%) |
| 16 and 17 Years | 20 (44.4%) | 0 (0.0%) |
| 18 to 24 Years | 113 (80.1%) | 0 (0.0%) |
| 25 to 34 Years | 28 (28.3%) | 4 (6.8%) |
| 35 to 44 Years | 0 (0.0%) | 6 (10.0%) |
| 45 to 54 Years | 5 (11.4%) | 24 (40.7%) |
| 55 to 64 Years | 3 (4.8%) | 0 (0.0%) |
| 65 to 74 Years | 0 (0.0%) | 0 (0.0%) |
| 75 Years and over | 0 (0.0%) | 0 (0.0%) |
| Total | 191 (26.1%) | 66 (15.2%) |
Income Above Poverty by Sex and Age in Marbleton
According to the poverty statistics in Marbleton, males aged under 5 years and females aged under 5 years are the age groups that are most secure financially, with 100.0% of males and 100.0% of females in these age groups living above the poverty line.
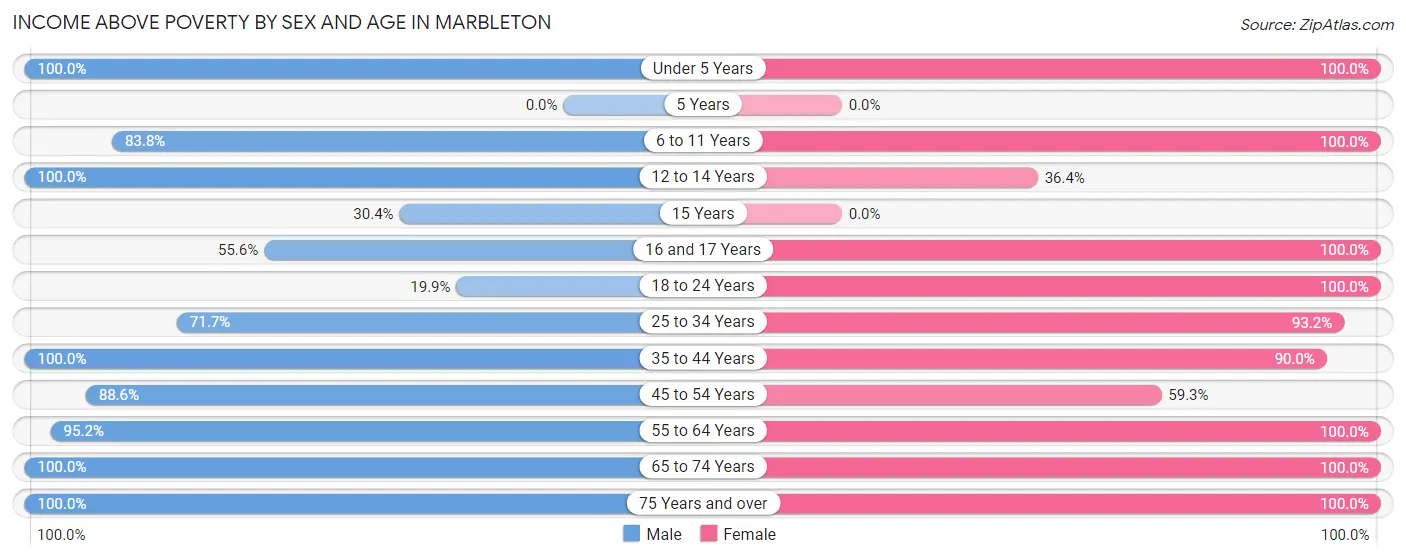
| Age Bracket | Male | Female |
| Under 5 Years | 27 (100.0%) | 18 (100.0%) |
| 5 Years | 0 (0.0%) | 0 (0.0%) |
| 6 to 11 Years | 31 (83.8%) | 31 (100.0%) |
| 12 to 14 Years | 61 (100.0%) | 16 (36.4%) |
| 15 Years | 7 (30.4%) | 0 (0.0%) |
| 16 and 17 Years | 25 (55.6%) | 12 (100.0%) |
| 18 to 24 Years | 28 (19.9%) | 11 (100.0%) |
| 25 to 34 Years | 71 (71.7%) | 55 (93.2%) |
| 35 to 44 Years | 75 (100.0%) | 54 (90.0%) |
| 45 to 54 Years | 39 (88.6%) | 35 (59.3%) |
| 55 to 64 Years | 59 (95.2%) | 14 (100.0%) |
| 65 to 74 Years | 66 (100.0%) | 111 (100.0%) |
| 75 Years and over | 52 (100.0%) | 12 (100.0%) |
| Total | 541 (73.9%) | 369 (84.8%) |
Income Below Poverty Among Married-Couple Families in Marbleton
The poverty statistics for married-couple families in Marbleton show that 2.0% or 4 of the total 204 families live below the poverty line. Families with no children have the highest poverty rate of 3.4%, comprising of 4 families. On the other hand, families with 1 or 2 children have the lowest poverty rate of 0.0%, which includes 0 families.
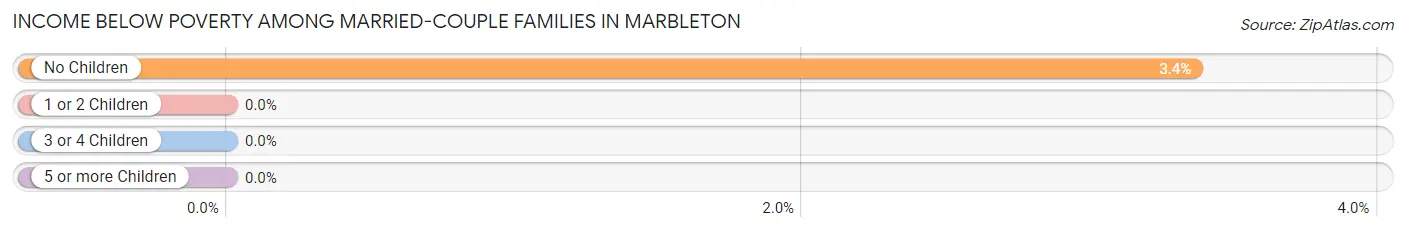
| Children | Above Poverty | Below Poverty |
| No Children | 115 (96.6%) | 4 (3.4%) |
| 1 or 2 Children | 77 (100.0%) | 0 (0.0%) |
| 3 or 4 Children | 8 (100.0%) | 0 (0.0%) |
| 5 or more Children | 0 (0.0%) | 0 (0.0%) |
| Total | 200 (98.0%) | 4 (2.0%) |
Income Below Poverty Among Single-Parent Households in Marbleton
According to the poverty data in Marbleton, 15.8% or 3 single-father households and 40.4% or 19 single-mother households are living below the poverty line. Among single-father households, those with 1 or 2 children have the highest poverty rate, with 3 households (37.5%) experiencing poverty. Likewise, among single-mother households, those with 3 or 4 children have the highest poverty rate, with 17 households (68.0%) falling below the poverty line.
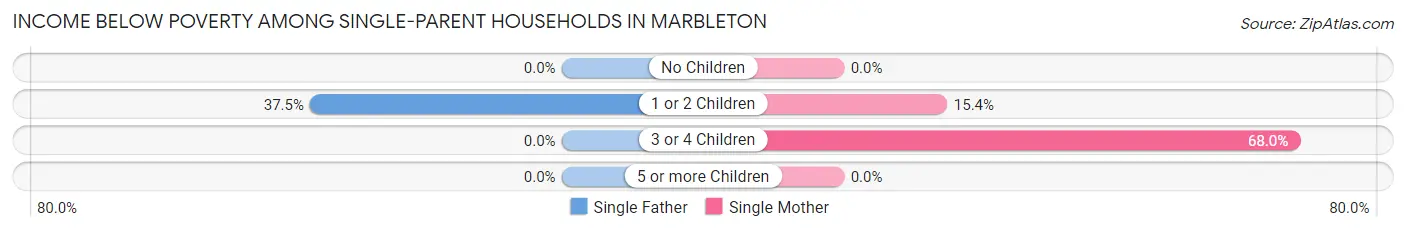
| Children | Single Father | Single Mother |
| No Children | 0 (0.0%) | 0 (0.0%) |
| 1 or 2 Children | 3 (37.5%) | 2 (15.4%) |
| 3 or 4 Children | 0 (0.0%) | 17 (68.0%) |
| 5 or more Children | 0 (0.0%) | 0 (0.0%) |
| Total | 3 (15.8%) | 19 (40.4%) |
Income Below Poverty Among Married-Couple vs Single-Parent Households in Marbleton
The poverty data for Marbleton shows that 4 of the married-couple family households (2.0%) and 22 of the single-parent households (33.3%) are living below the poverty level. Within the married-couple family households, those with no children have the highest poverty rate, with 4 households (3.4%) falling below the poverty line. Among the single-parent households, those with 3 or 4 children have the highest poverty rate, with 17 household (54.8%) living below poverty.
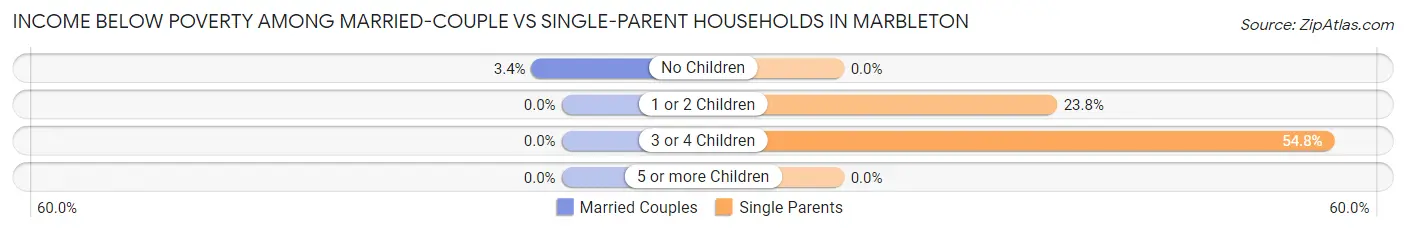
| Children | Married-Couple Families | Single-Parent Households |
| No Children | 4 (3.4%) | 0 (0.0%) |
| 1 or 2 Children | 0 (0.0%) | 5 (23.8%) |
| 3 or 4 Children | 0 (0.0%) | 17 (54.8%) |
| 5 or more Children | 0 (0.0%) | 0 (0.0%) |
| Total | 4 (2.0%) | 22 (33.3%) |
Race in Marbleton
The most populous races in Marbleton are White / Caucasian (1,133 | 95.5%), Hispanic or Latino (248 | 20.9%), and Two or more Races (54 | 4.5%).
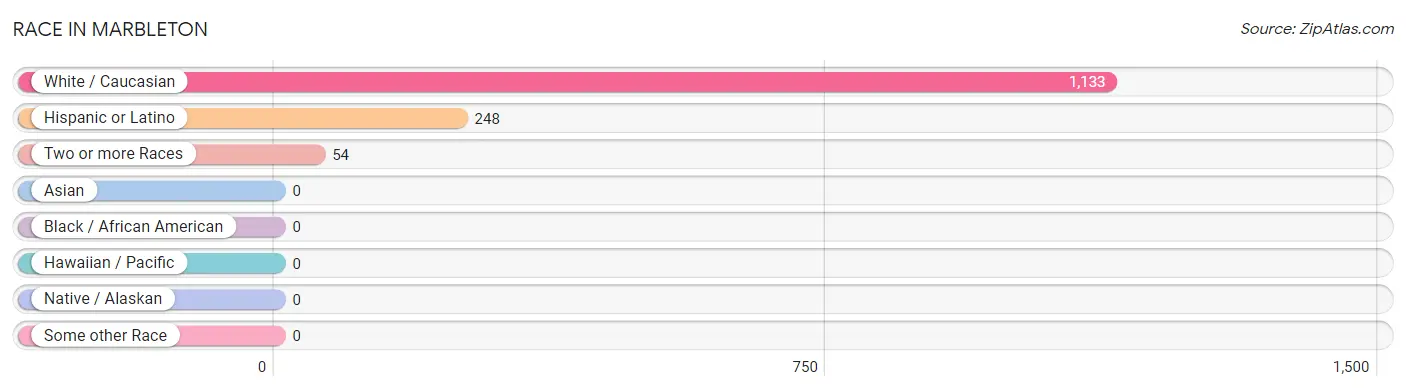
| Race | # Population | % Population |
| Asian | 0 | 0.0% |
| Black / African American | 0 | 0.0% |
| Hawaiian / Pacific | 0 | 0.0% |
| Hispanic or Latino | 248 | 20.9% |
| Native / Alaskan | 0 | 0.0% |
| White / Caucasian | 1,133 | 95.5% |
| Two or more Races | 54 | 4.5% |
| Some other Race | 0 | 0.0% |
| Total | 1,187 | 100.0% |
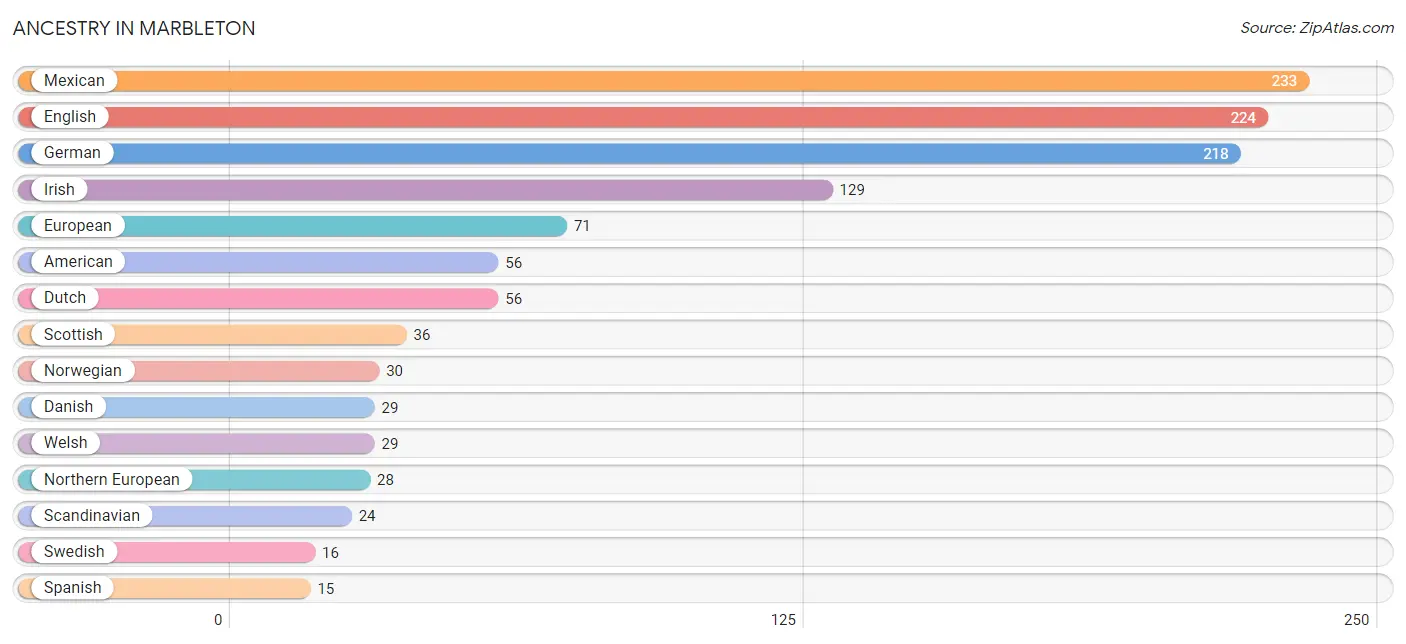
Ancestry in Marbleton
The most populous ancestries reported in Marbleton are Mexican (233 | 19.6%), English (224 | 18.9%), German (218 | 18.4%), Irish (129 | 10.9%), and European (71 | 6.0%), together accounting for 73.7% of all Marbleton residents.
| Ancestry | # Population | % Population |
| Alaskan Athabascan | 3 | 0.3% |
| American | 56 | 4.7% |
| Austrian | 3 | 0.3% |
| British | 6 | 0.5% |
| Canadian | 6 | 0.5% |
| Cherokee | 6 | 0.5% |
| Cheyenne | 5 | 0.4% |
| Czech | 4 | 0.3% |
| Danish | 29 | 2.4% |
| Dutch | 56 | 4.7% |
| English | 224 | 18.9% |
| European | 71 | 6.0% |
| Finnish | 4 | 0.3% |
| French | 14 | 1.2% |
| German | 218 | 18.4% |
| Irish | 129 | 10.9% |
| Italian | 4 | 0.3% |
| Mexican | 233 | 19.6% |
| Northern European | 28 | 2.4% |
| Norwegian | 30 | 2.5% |
| Polish | 11 | 0.9% |
| Scandinavian | 24 | 2.0% |
| Scottish | 36 | 3.0% |
| Spanish | 15 | 1.3% |
| Swedish | 16 | 1.3% |
| Welsh | 29 | 2.4% | View All 26 Rows |
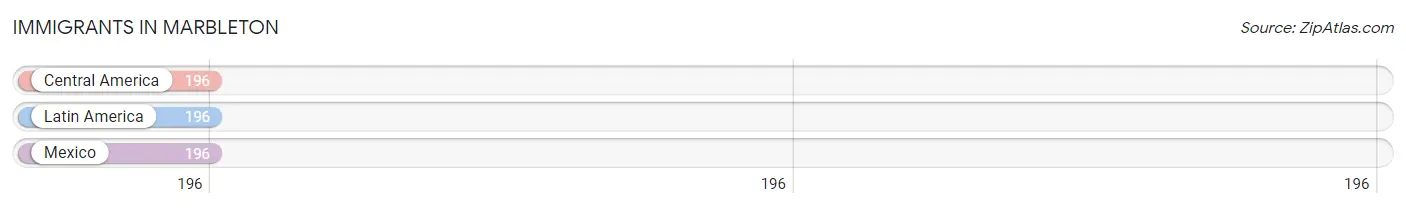
Immigrants in Marbleton
The most numerous immigrant groups reported in Marbleton came from Central America (196 | 16.5%), Latin America (196 | 16.5%), and Mexico (196 | 16.5%), together accounting for 49.5% of all Marbleton residents.
| Immigration Origin | # Population | % Population |
| Central America | 196 | 16.5% |
| Latin America | 196 | 16.5% |
| Mexico | 196 | 16.5% | View All 3 Rows |
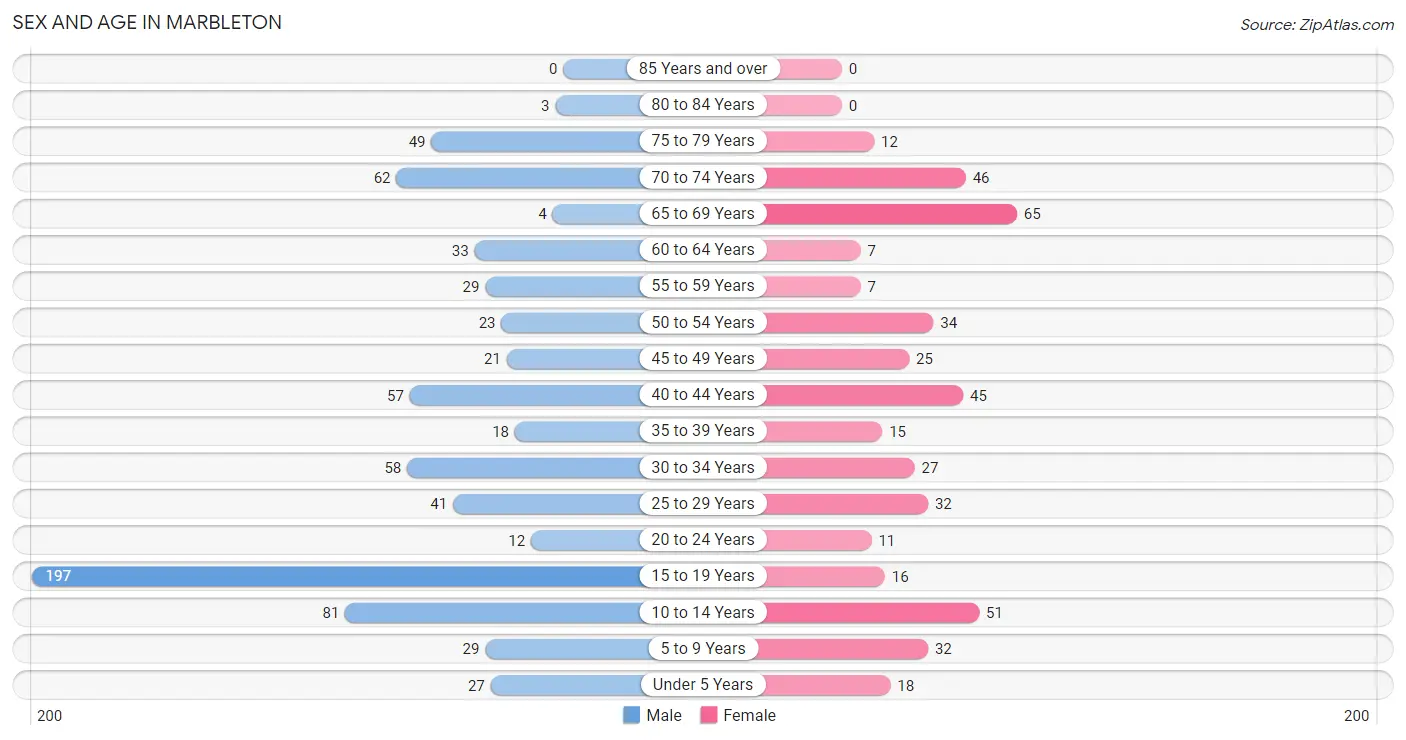
Sex and Age in Marbleton
Sex and Age in Marbleton
The most populous age groups in Marbleton are 15 to 19 Years (197 | 26.5%) for men and 65 to 69 Years (65 | 14.7%) for women.
| Age Bracket | Male | Female |
| Under 5 Years | 27 (3.6%) | 18 (4.1%) |
| 5 to 9 Years | 29 (3.9%) | 32 (7.2%) |
| 10 to 14 Years | 81 (10.9%) | 51 (11.5%) |
| 15 to 19 Years | 197 (26.5%) | 16 (3.6%) |
| 20 to 24 Years | 12 (1.6%) | 11 (2.5%) |
| 25 to 29 Years | 41 (5.5%) | 32 (7.2%) |
| 30 to 34 Years | 58 (7.8%) | 27 (6.1%) |
| 35 to 39 Years | 18 (2.4%) | 15 (3.4%) |
| 40 to 44 Years | 57 (7.7%) | 45 (10.2%) |
| 45 to 49 Years | 21 (2.8%) | 25 (5.6%) |
| 50 to 54 Years | 23 (3.1%) | 34 (7.7%) |
| 55 to 59 Years | 29 (3.9%) | 7 (1.6%) |
| 60 to 64 Years | 33 (4.4%) | 7 (1.6%) |
| 65 to 69 Years | 4 (0.5%) | 65 (14.7%) |
| 70 to 74 Years | 62 (8.3%) | 46 (10.4%) |
| 75 to 79 Years | 49 (6.6%) | 12 (2.7%) |
| 80 to 84 Years | 3 (0.4%) | 0 (0.0%) |
| 85 Years and over | 0 (0.0%) | 0 (0.0%) |
| Total | 744 (100.0%) | 443 (100.0%) |
Families and Households in Marbleton
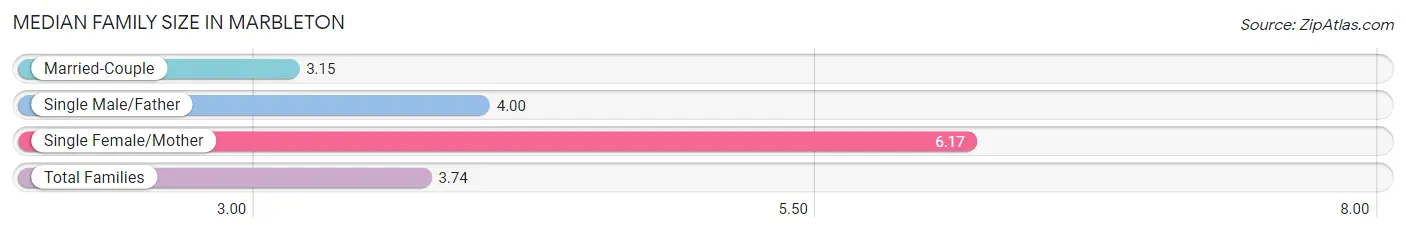
Median Family Size in Marbleton
The median family size in Marbleton is 3.74 persons per family, with single female/mother families (47 | 17.4%) accounting for the largest median family size of 6.17 persons per family. On the other hand, married-couple families (204 | 75.6%) represent the smallest median family size with 3.15 persons per family.
| Family Type | # Families | Family Size |
| Married-Couple | 204 (75.6%) | 3.15 |
| Single Male/Father | 19 (7.0%) | 4.00 |
| Single Female/Mother | 47 (17.4%) | 6.17 |
| Total Families | 270 (100.0%) | 3.74 |
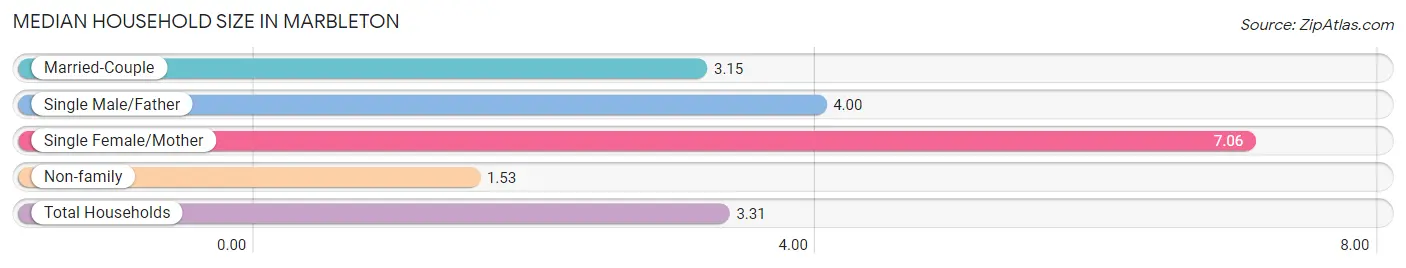
Median Household Size in Marbleton
The median household size in Marbleton is 3.31 persons per household, with single female/mother households (47 | 13.1%) accounting for the largest median household size of 7.06 persons per household. non-family households (89 | 24.8%) represent the smallest median household size with 1.53 persons per household.
| Household Type | # Households | Household Size |
| Married-Couple | 204 (56.8%) | 3.15 |
| Single Male/Father | 19 (5.3%) | 4.00 |
| Single Female/Mother | 47 (13.1%) | 7.06 |
| Non-family | 89 (24.8%) | 1.53 |
| Total Households | 359 (100.0%) | 3.31 |
Household Size by Marriage Status in Marbleton
Out of a total of 359 households in Marbleton, 270 (75.2%) are family households, while 89 (24.8%) are nonfamily households. The most numerous type of family households are 2-person households, comprising 130, and the most common type of nonfamily households are 1-person households, comprising 66.
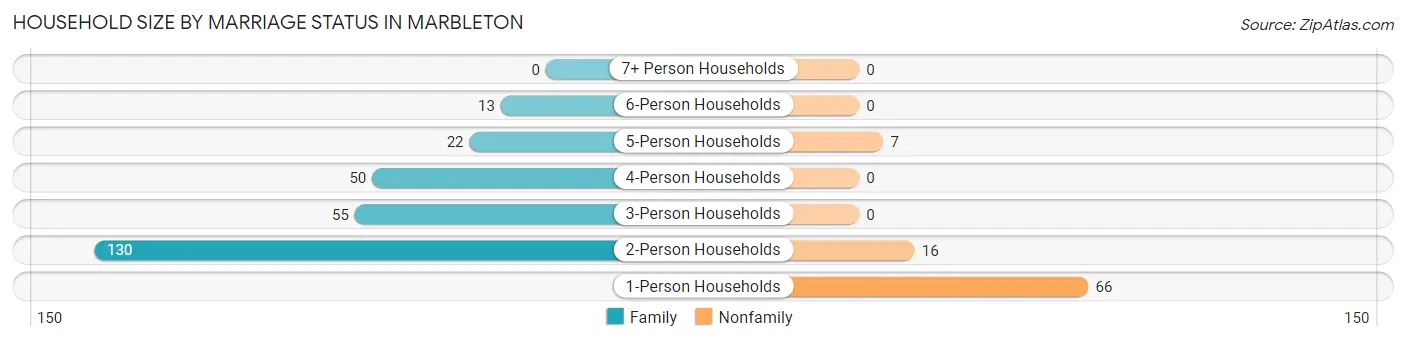
| Household Size | Family Households | Nonfamily Households |
| 1-Person Households | - | 66 (18.4%) |
| 2-Person Households | 130 (36.2%) | 16 (4.5%) |
| 3-Person Households | 55 (15.3%) | 0 (0.0%) |
| 4-Person Households | 50 (13.9%) | 0 (0.0%) |
| 5-Person Households | 22 (6.1%) | 7 (1.9%) |
| 6-Person Households | 13 (3.6%) | 0 (0.0%) |
| 7+ Person Households | 0 (0.0%) | 0 (0.0%) |
| Total | 270 (75.2%) | 89 (24.8%) |
Female Fertility in Marbleton
Fertility by Age in Marbleton
Average fertility rate in Marbleton is 37.0 births per 1,000 women. Women in the age bracket of 20 to 34 years have the highest fertility rate with 100.0 births per 1,000 women. Women in the age bracket of 20 to 34 years acount for 100.0% of all women with births.
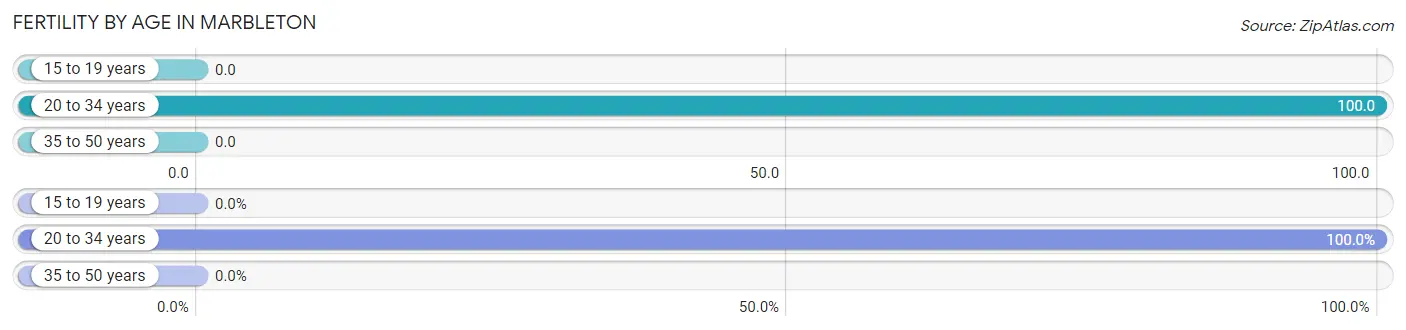
| Age Bracket | Women with Births | Births / 1,000 Women |
| 15 to 19 years | 0 (0.0%) | 0.0 |
| 20 to 34 years | 7 (100.0%) | 100.0 |
| 35 to 50 years | 0 (0.0%) | 0.0 |
| Total | 7 (100.0%) | 37.0 |
Fertility by Age by Marriage Status in Marbleton
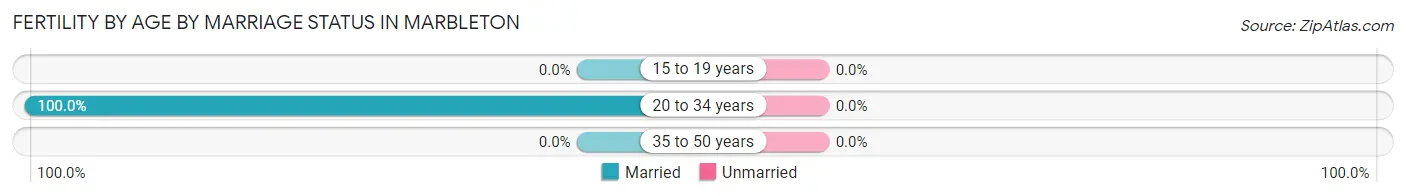
| Age Bracket | Married | Unmarried |
| 15 to 19 years | 0 (0.0%) | 0 (0.0%) |
| 20 to 34 years | 7 (100.0%) | 0 (0.0%) |
| 35 to 50 years | 0 (0.0%) | 0 (0.0%) |
| Total | 7 (100.0%) | 0 (0.0%) |
Fertility by Education in Marbleton
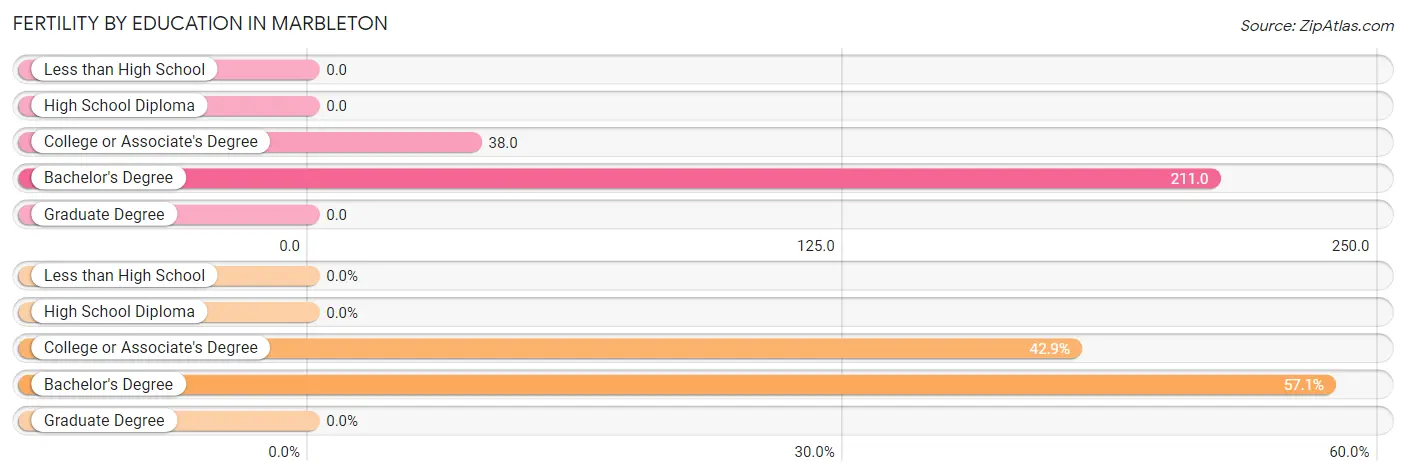
| Educational Attainment | Women with Births | Births / 1,000 Women |
| Less than High School | 0 (0.0%) | 0.0 |
| High School Diploma | 0 (0.0%) | 0.0 |
| College or Associate's Degree | 3 (42.9%) | 38.0 |
| Bachelor's Degree | 4 (57.1%) | 211.0 |
| Graduate Degree | 0 (0.0%) | 0.0 |
| Total | 7 (100.0%) | 37.0 |
Fertility by Education by Marriage Status in Marbleton
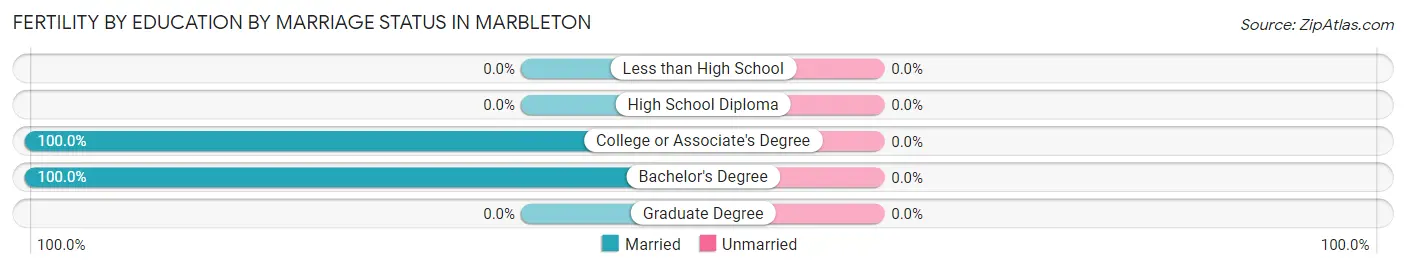
| Educational Attainment | Married | Unmarried |
| Less than High School | 0 (0.0%) | 0 (0.0%) |
| High School Diploma | 0 (0.0%) | 0 (0.0%) |
| College or Associate's Degree | 3 (100.0%) | 0 (0.0%) |
| Bachelor's Degree | 4 (100.0%) | 0 (0.0%) |
| Graduate Degree | 0 (0.0%) | 0 (0.0%) |
| Total | 7 (100.0%) | 0 (0.0%) |
Employment Characteristics in Marbleton
Employment by Class of Employer in Marbleton
Among the 454 employed individuals in Marbleton, private company employees (289 | 63.7%), local government employees (68 | 15.0%), and self-employed (incorporated) (42 | 9.2%) make up the most common classes of employment.
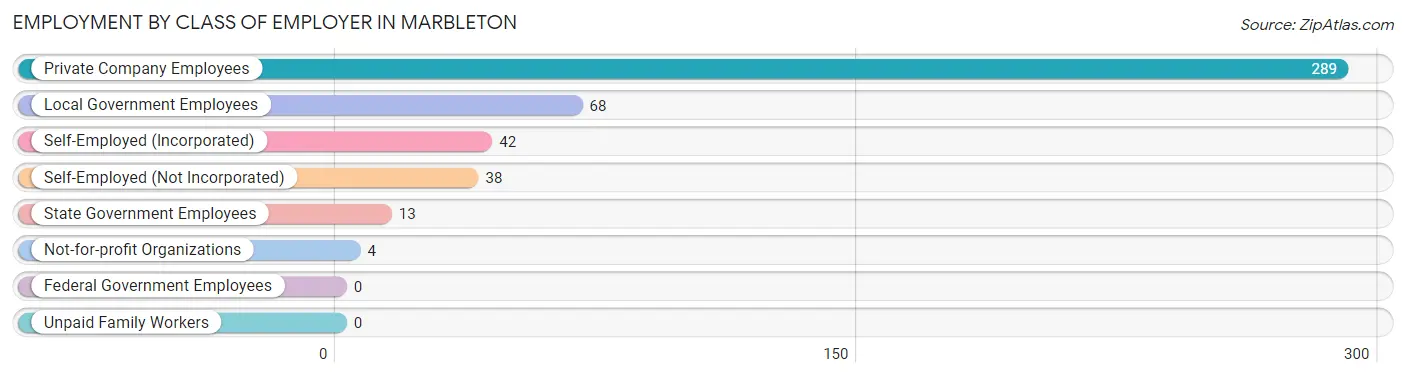
| Employer Class | # Employees | % Employees |
| Private Company Employees | 289 | 63.7% |
| Self-Employed (Incorporated) | 42 | 9.2% |
| Self-Employed (Not Incorporated) | 38 | 8.4% |
| Not-for-profit Organizations | 4 | 0.9% |
| Local Government Employees | 68 | 15.0% |
| State Government Employees | 13 | 2.9% |
| Federal Government Employees | 0 | 0.0% |
| Unpaid Family Workers | 0 | 0.0% |
| Total | 454 | 100.0% |
Employment Status by Age in Marbleton
According to the labor force statistics for Marbleton, out of the total population over 16 years of age (922), 56.6% or 522 individuals are in the labor force, with 13.0% or 68 of them unemployed. The age group with the highest labor force participation rate is 20 to 24 years, with 100.0% or 23 individuals in the labor force. Within the labor force, the 16 to 19 years age range has the highest percentage of unemployed individuals, with 68.7% or 57 of them being unemployed.
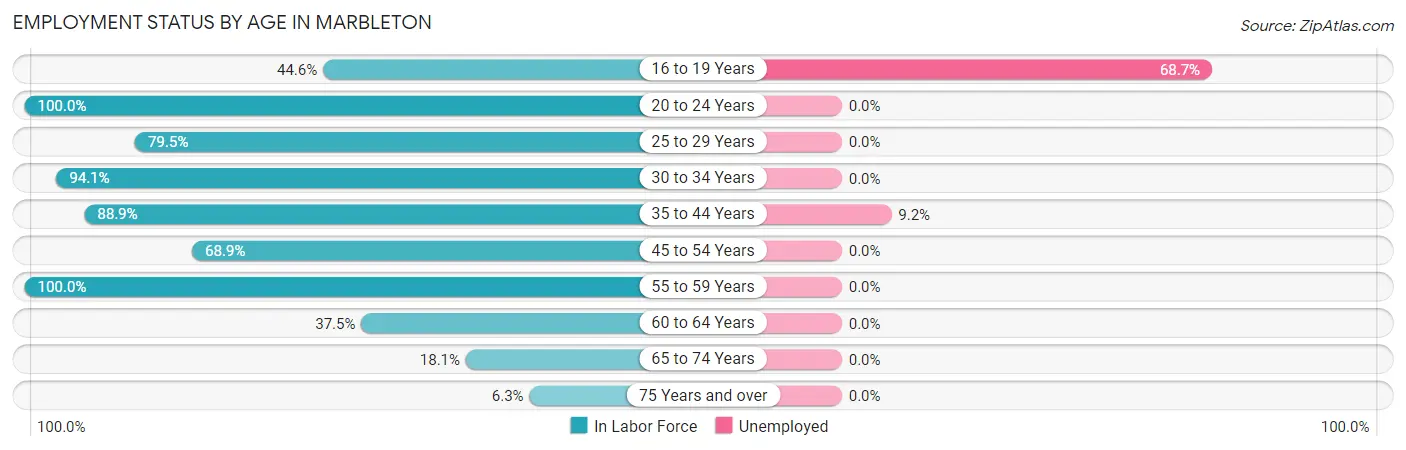
| Age Bracket | In Labor Force | Unemployed |
| 16 to 19 Years | 83 (44.6%) | 57 (68.7%) |
| 20 to 24 Years | 23 (100.0%) | 0 (0.0%) |
| 25 to 29 Years | 58 (79.5%) | 0 (0.0%) |
| 30 to 34 Years | 80 (94.1%) | 0 (0.0%) |
| 35 to 44 Years | 120 (88.9%) | 11 (9.2%) |
| 45 to 54 Years | 71 (68.9%) | 0 (0.0%) |
| 55 to 59 Years | 36 (100.0%) | 0 (0.0%) |
| 60 to 64 Years | 15 (37.5%) | 0 (0.0%) |
| 65 to 74 Years | 32 (18.1%) | 0 (0.0%) |
| 75 Years and over | 4 (6.3%) | 0 (0.0%) |
| Total | 522 (56.6%) | 68 (13.0%) |
Employment Status by Educational Attainment in Marbleton
According to labor force statistics for Marbleton, 80.5% of individuals (380) out of the total population between 25 and 64 years of age (472) are in the labor force, with 2.9% or 11 of them being unemployed. The group with the highest labor force participation rate are those with the educational attainment of less than high school, with 95.3% or 61 individuals in the labor force. Within the labor force, individuals with high school diploma education have the highest percentage of unemployment, with 8.9% or 11 of them being unemployed.
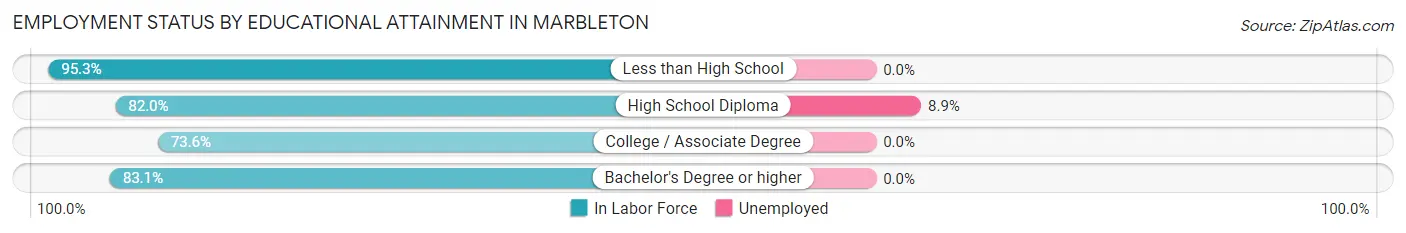
| Educational Attainment | In Labor Force | Unemployed |
| Less than High School | 61 (95.3%) | 0 (0.0%) |
| High School Diploma | 123 (82.0%) | 13 (8.9%) |
| College / Associate Degree | 142 (73.6%) | 0 (0.0%) |
| Bachelor's Degree or higher | 54 (83.1%) | 0 (0.0%) |
| Total | 380 (80.5%) | 14 (2.9%) |
Employment Occupations by Sex in Marbleton
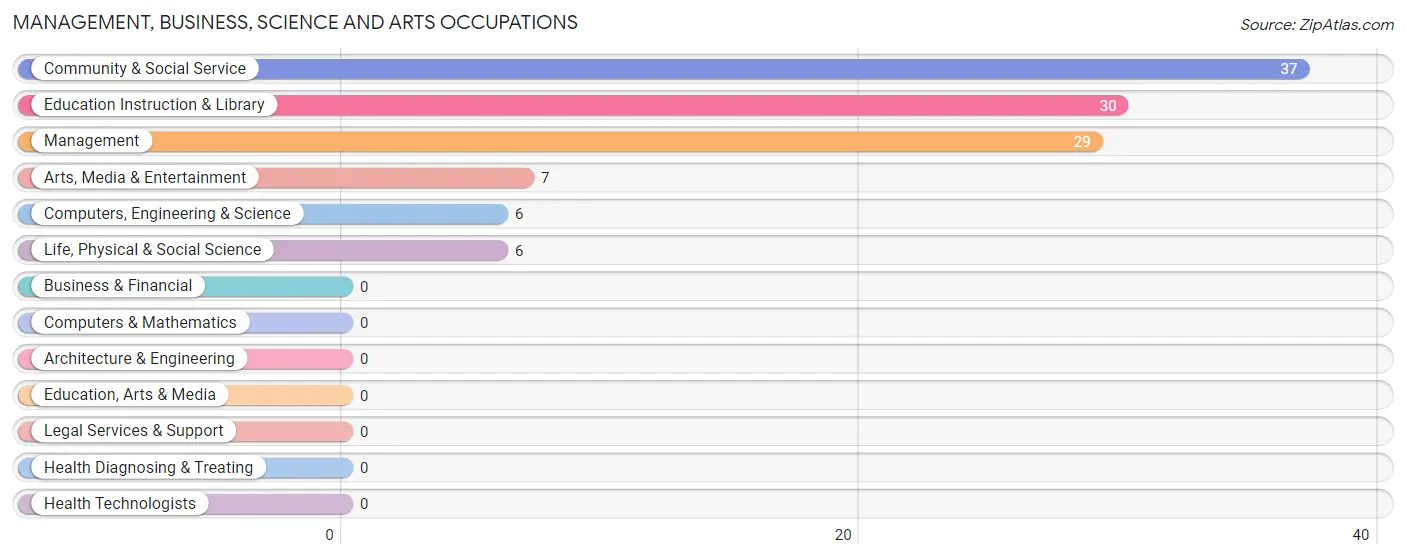
Management, Business, Science and Arts Occupations
The most common Management, Business, Science and Arts occupations in Marbleton are Community & Social Service (37 | 8.2%), Education Instruction & Library (30 | 6.6%), Management (29 | 6.4%), Arts, Media & Entertainment (7 | 1.5%), and Computers, Engineering & Science (6 | 1.3%).
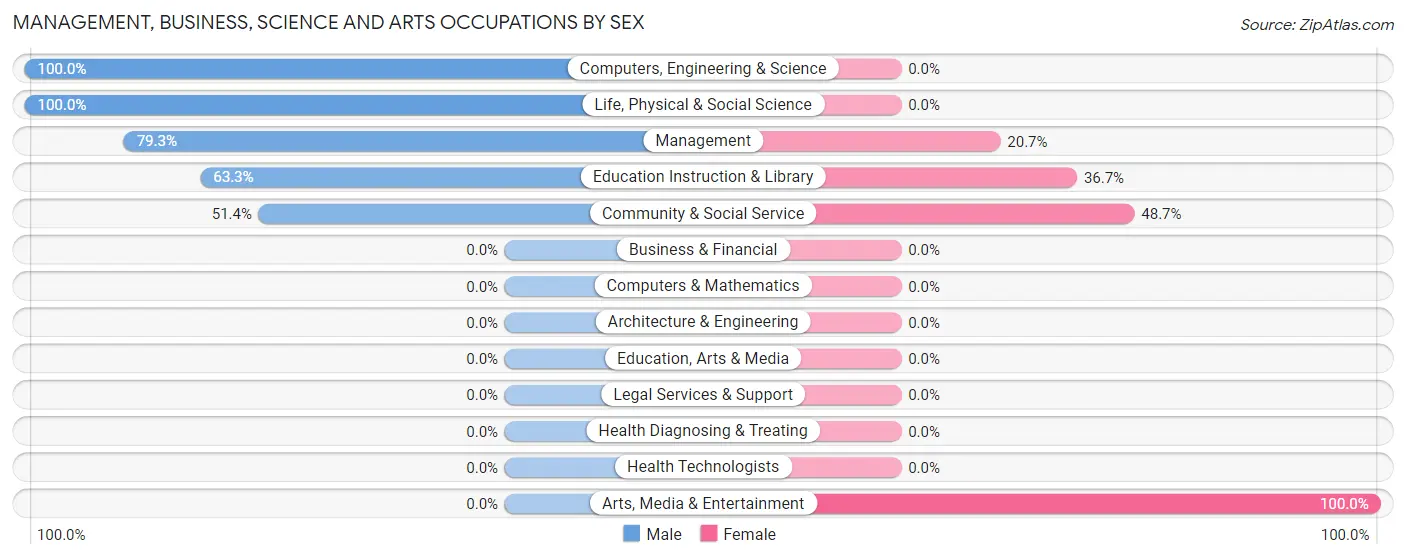
Management, Business, Science and Arts Occupations by Sex
Within the Management, Business, Science and Arts occupations in Marbleton, the most male-oriented occupations are Computers, Engineering & Science (100.0%), Life, Physical & Social Science (100.0%), and Management (79.3%), while the most female-oriented occupations are Arts, Media & Entertainment (100.0%), Community & Social Service (48.6%), and Education Instruction & Library (36.7%).
| Occupation | Male | Female |
| Management | 23 (79.3%) | 6 (20.7%) |
| Business & Financial | 0 (0.0%) | 0 (0.0%) |
| Computers, Engineering & Science | 6 (100.0%) | 0 (0.0%) |
| Computers & Mathematics | 0 (0.0%) | 0 (0.0%) |
| Architecture & Engineering | 0 (0.0%) | 0 (0.0%) |
| Life, Physical & Social Science | 6 (100.0%) | 0 (0.0%) |
| Community & Social Service | 19 (51.3%) | 18 (48.6%) |
| Education, Arts & Media | 0 (0.0%) | 0 (0.0%) |
| Legal Services & Support | 0 (0.0%) | 0 (0.0%) |
| Education Instruction & Library | 19 (63.3%) | 11 (36.7%) |
| Arts, Media & Entertainment | 0 (0.0%) | 7 (100.0%) |
| Health Diagnosing & Treating | 0 (0.0%) | 0 (0.0%) |
| Health Technologists | 0 (0.0%) | 0 (0.0%) |
| Total (Category) | 48 (66.7%) | 24 (33.3%) |
| Total (Overall) | 281 (61.9%) | 173 (38.1%) |
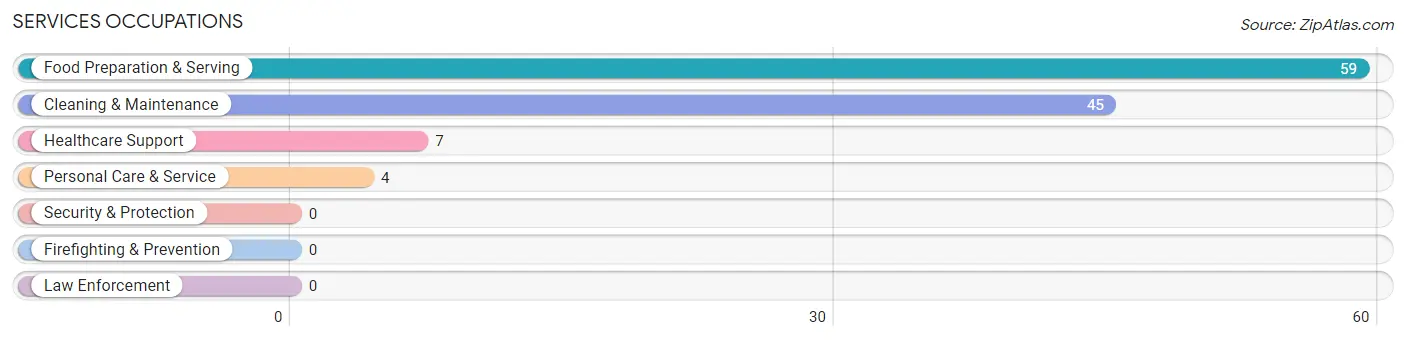
Services Occupations
The most common Services occupations in Marbleton are Food Preparation & Serving (59 | 13.0%), Cleaning & Maintenance (45 | 9.9%), Healthcare Support (7 | 1.5%), and Personal Care & Service (4 | 0.9%).
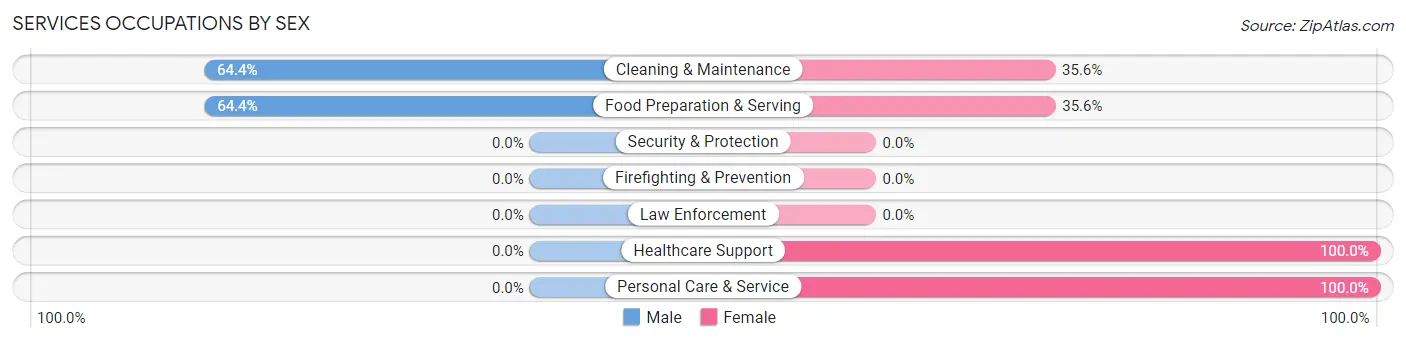
Services Occupations by Sex
Within the Services occupations in Marbleton, the most male-oriented occupations are Cleaning & Maintenance (64.4%), and Food Preparation & Serving (64.4%), while the most female-oriented occupations are Healthcare Support (100.0%), Personal Care & Service (100.0%), and Food Preparation & Serving (35.6%).
| Occupation | Male | Female |
| Healthcare Support | 0 (0.0%) | 7 (100.0%) |
| Security & Protection | 0 (0.0%) | 0 (0.0%) |
| Firefighting & Prevention | 0 (0.0%) | 0 (0.0%) |
| Law Enforcement | 0 (0.0%) | 0 (0.0%) |
| Food Preparation & Serving | 38 (64.4%) | 21 (35.6%) |
| Cleaning & Maintenance | 29 (64.4%) | 16 (35.6%) |
| Personal Care & Service | 0 (0.0%) | 4 (100.0%) |
| Total (Category) | 67 (58.3%) | 48 (41.7%) |
| Total (Overall) | 281 (61.9%) | 173 (38.1%) |
Sales and Office Occupations
The most common Sales and Office occupations in Marbleton are Office & Administration (71 | 15.6%), and Sales & Related (20 | 4.4%).
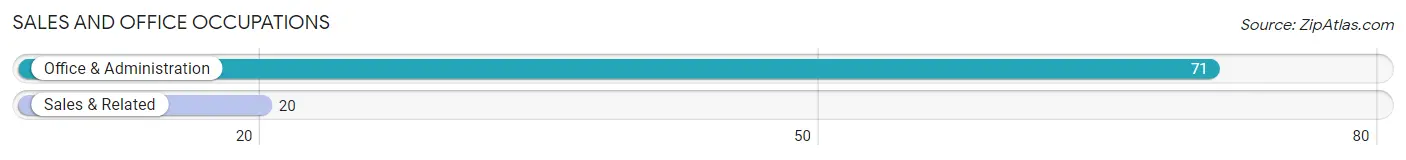
Sales and Office Occupations by Sex
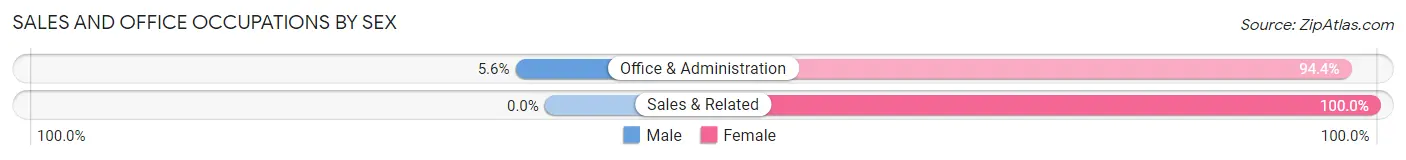
| Occupation | Male | Female |
| Sales & Related | 0 (0.0%) | 20 (100.0%) |
| Office & Administration | 4 (5.6%) | 67 (94.4%) |
| Total (Category) | 4 (4.4%) | 87 (95.6%) |
| Total (Overall) | 281 (61.9%) | 173 (38.1%) |
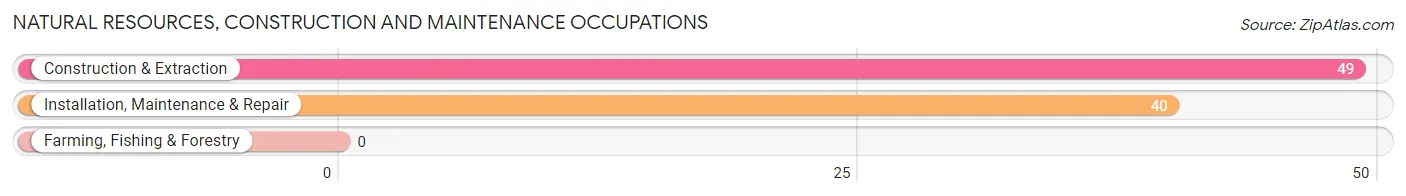
Natural Resources, Construction and Maintenance Occupations
The most common Natural Resources, Construction and Maintenance occupations in Marbleton are Construction & Extraction (49 | 10.8%), and Installation, Maintenance & Repair (40 | 8.8%).
Natural Resources, Construction and Maintenance Occupations by Sex
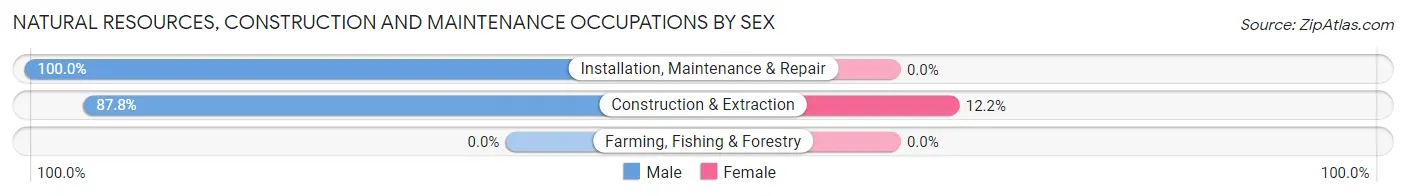
| Occupation | Male | Female |
| Farming, Fishing & Forestry | 0 (0.0%) | 0 (0.0%) |
| Construction & Extraction | 43 (87.8%) | 6 (12.2%) |
| Installation, Maintenance & Repair | 40 (100.0%) | 0 (0.0%) |
| Total (Category) | 83 (93.3%) | 6 (6.7%) |
| Total (Overall) | 281 (61.9%) | 173 (38.1%) |
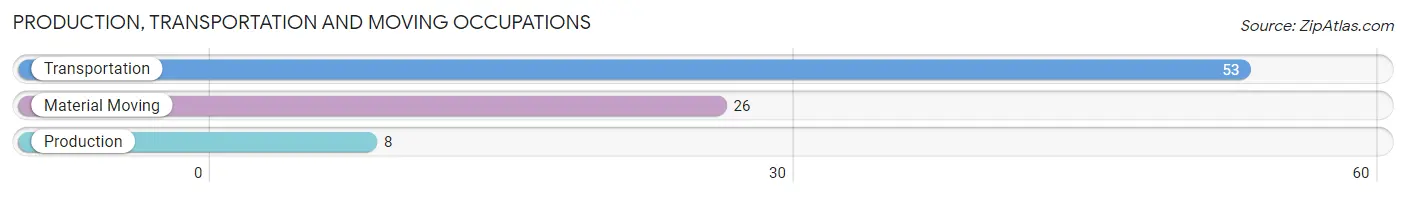
Production, Transportation and Moving Occupations
The most common Production, Transportation and Moving occupations in Marbleton are Transportation (53 | 11.7%), Material Moving (26 | 5.7%), and Production (8 | 1.8%).
Production, Transportation and Moving Occupations by Sex
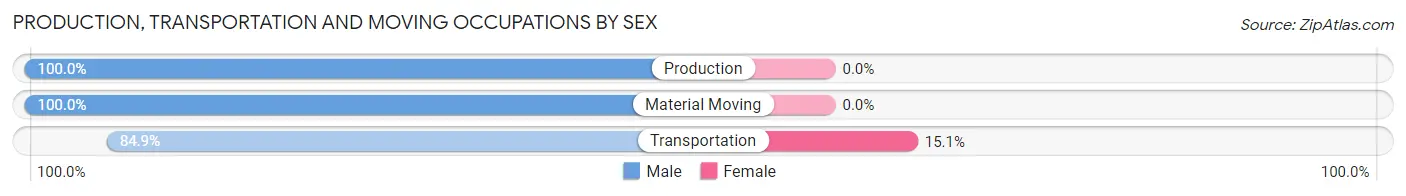
| Occupation | Male | Female |
| Production | 8 (100.0%) | 0 (0.0%) |
| Transportation | 45 (84.9%) | 8 (15.1%) |
| Material Moving | 26 (100.0%) | 0 (0.0%) |
| Total (Category) | 79 (90.8%) | 8 (9.2%) |
| Total (Overall) | 281 (61.9%) | 173 (38.1%) |
Employment Industries by Sex in Marbleton
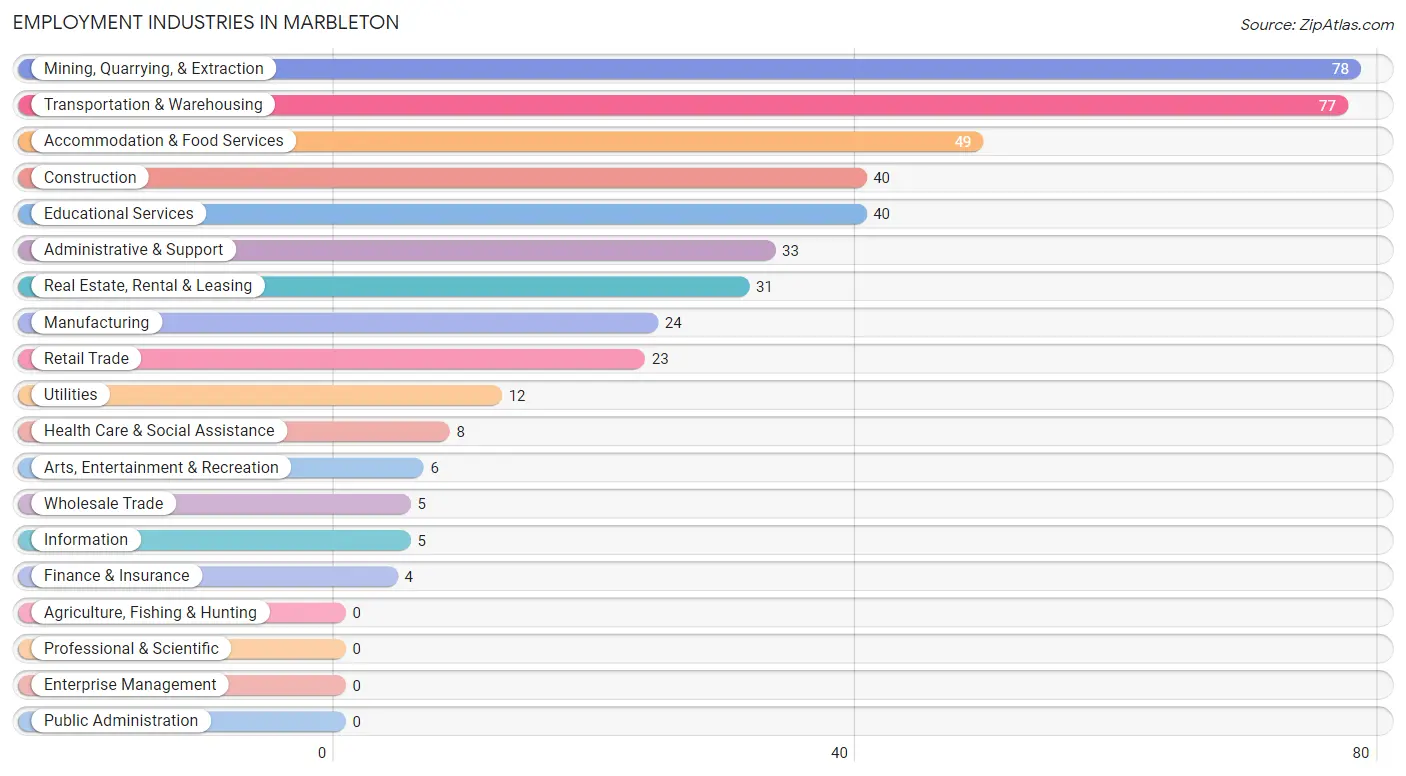
Employment Industries in Marbleton
The major employment industries in Marbleton include Mining, Quarrying, & Extraction (78 | 17.2%), Transportation & Warehousing (77 | 17.0%), Accommodation & Food Services (49 | 10.8%), Construction (40 | 8.8%), and Educational Services (40 | 8.8%).
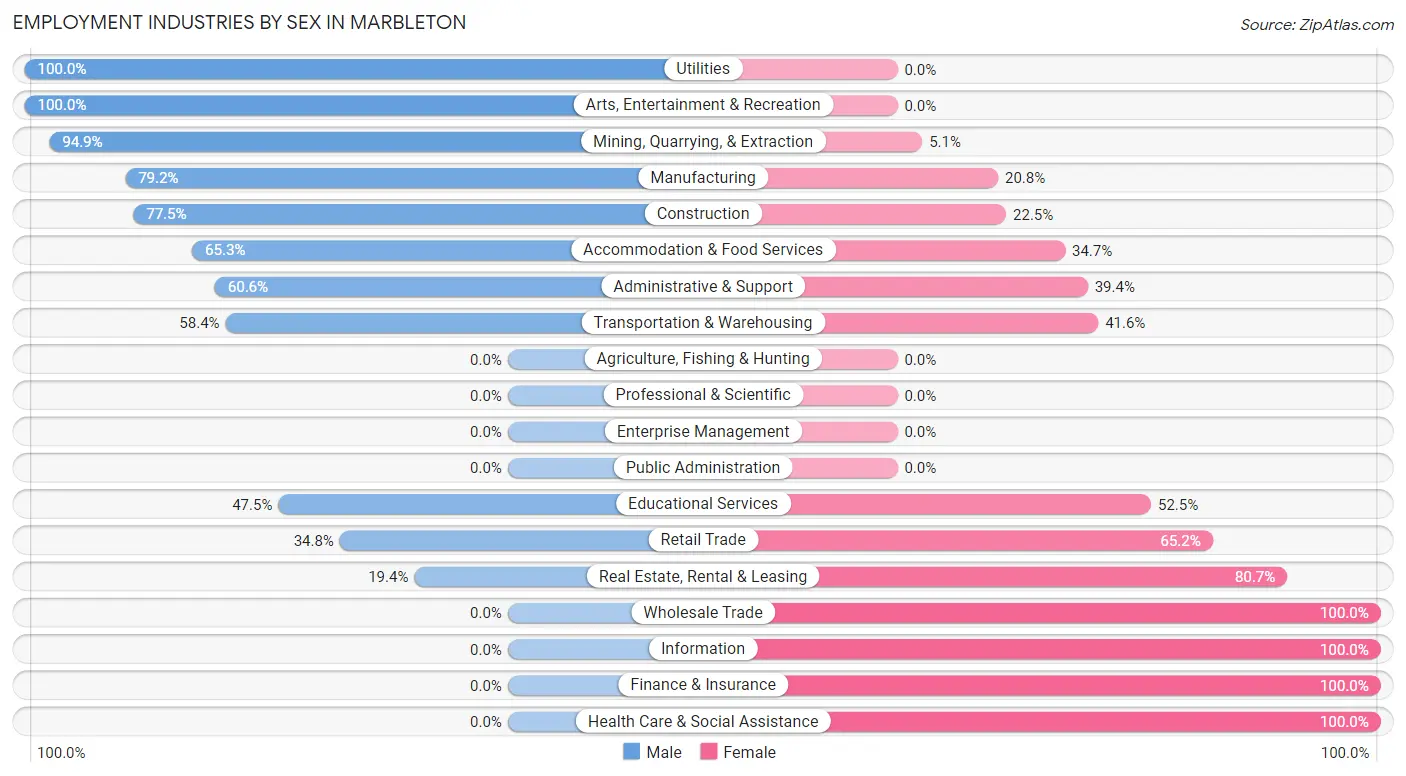
Employment Industries by Sex in Marbleton
The Marbleton industries that see more men than women are Utilities (100.0%), Arts, Entertainment & Recreation (100.0%), and Mining, Quarrying, & Extraction (94.9%), whereas the industries that tend to have a higher number of women are Wholesale Trade (100.0%), Information (100.0%), and Finance & Insurance (100.0%).
| Industry | Male | Female |
| Agriculture, Fishing & Hunting | 0 (0.0%) | 0 (0.0%) |
| Mining, Quarrying, & Extraction | 74 (94.9%) | 4 (5.1%) |
| Construction | 31 (77.5%) | 9 (22.5%) |
| Manufacturing | 19 (79.2%) | 5 (20.8%) |
| Wholesale Trade | 0 (0.0%) | 5 (100.0%) |
| Retail Trade | 8 (34.8%) | 15 (65.2%) |
| Transportation & Warehousing | 45 (58.4%) | 32 (41.6%) |
| Utilities | 12 (100.0%) | 0 (0.0%) |
| Information | 0 (0.0%) | 5 (100.0%) |
| Finance & Insurance | 0 (0.0%) | 4 (100.0%) |
| Real Estate, Rental & Leasing | 6 (19.4%) | 25 (80.6%) |
| Professional & Scientific | 0 (0.0%) | 0 (0.0%) |
| Enterprise Management | 0 (0.0%) | 0 (0.0%) |
| Administrative & Support | 20 (60.6%) | 13 (39.4%) |
| Educational Services | 19 (47.5%) | 21 (52.5%) |
| Health Care & Social Assistance | 0 (0.0%) | 8 (100.0%) |
| Arts, Entertainment & Recreation | 6 (100.0%) | 0 (0.0%) |
| Accommodation & Food Services | 32 (65.3%) | 17 (34.7%) |
| Public Administration | 0 (0.0%) | 0 (0.0%) |
| Total | 281 (61.9%) | 173 (38.1%) |
Education in Marbleton
School Enrollment in Marbleton
The most common levels of schooling among the 356 students in Marbleton are high school (149 | 41.8%), middle school (109 | 30.6%), and elementary school (61 | 17.1%).
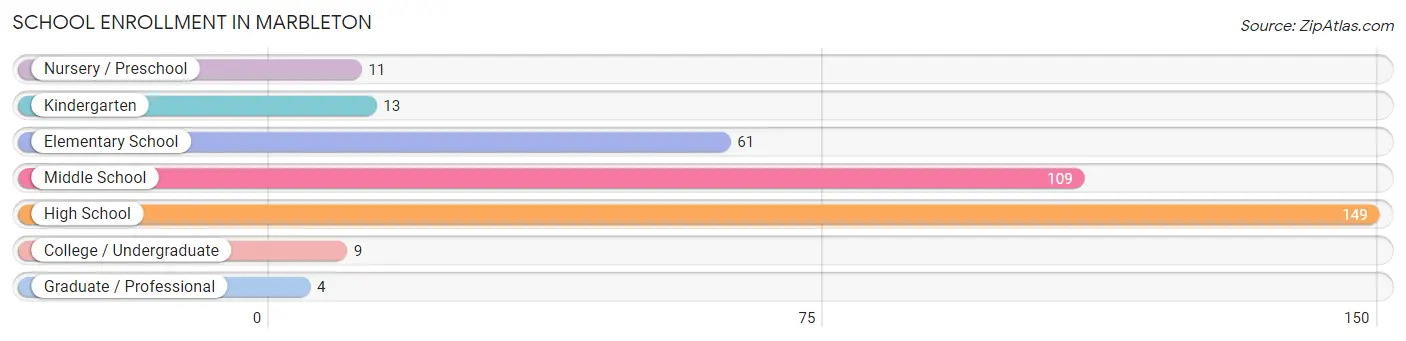
| School Level | # Students | % Students |
| Nursery / Preschool | 11 | 3.1% |
| Kindergarten | 13 | 3.6% |
| Elementary School | 61 | 17.1% |
| Middle School | 109 | 30.6% |
| High School | 149 | 41.8% |
| College / Undergraduate | 9 | 2.5% |
| Graduate / Professional | 4 | 1.1% |
| Total | 356 | 100.0% |
School Enrollment by Age by Funding Source in Marbleton
Out of a total of 356 students who are enrolled in schools in Marbleton, 84 (23.6%) attend a private institution, while the remaining 272 (76.4%) are enrolled in public schools. The age group of 18 to 19 year olds has the highest likelihood of being enrolled in private schools, with 56 (91.8% in the age bracket) enrolled. Conversely, the age group of 3 to 4 year olds has the lowest likelihood of being enrolled in a private school, with 11 (100.0% in the age bracket) attending a public institution.
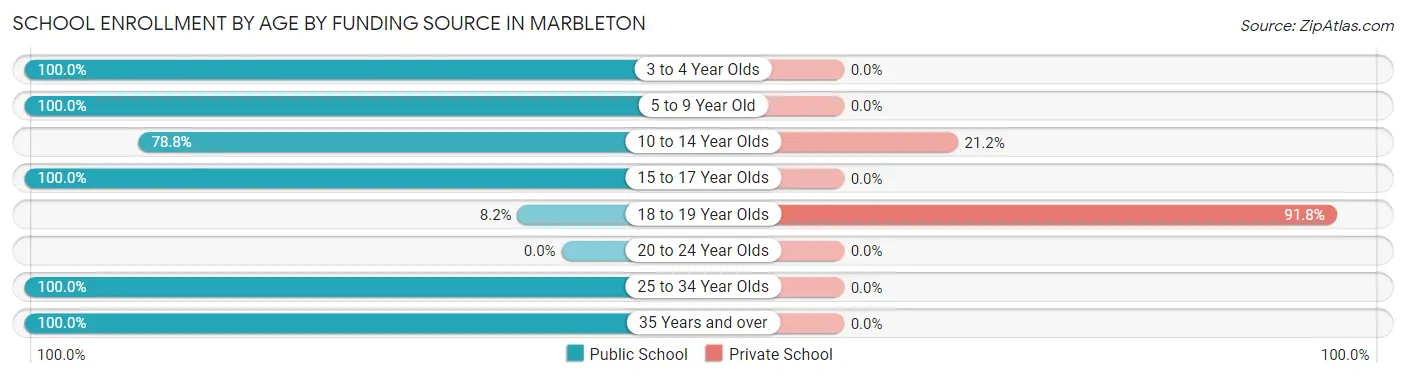
| Age Bracket | Public School | Private School |
| 3 to 4 Year Olds | 11 (100.0%) | 0 (0.0%) |
| 5 to 9 Year Old | 61 (100.0%) | 0 (0.0%) |
| 10 to 14 Year Olds | 104 (78.8%) | 28 (21.2%) |
| 15 to 17 Year Olds | 78 (100.0%) | 0 (0.0%) |
| 18 to 19 Year Olds | 5 (8.2%) | 56 (91.8%) |
| 20 to 24 Year Olds | 0 (0.0%) | 0 (0.0%) |
| 25 to 34 Year Olds | 4 (100.0%) | 0 (0.0%) |
| 35 Years and over | 9 (100.0%) | 0 (0.0%) |
| Total | 272 (76.4%) | 84 (23.6%) |
Educational Attainment by Field of Study in Marbleton
Education (29 | 36.7%), science & technology (14 | 17.7%), arts & humanities (11 | 13.9%), social sciences (8 | 10.1%), and liberal arts & history (8 | 10.1%) are the most common fields of study among 79 individuals in Marbleton who have obtained a bachelor's degree or higher.
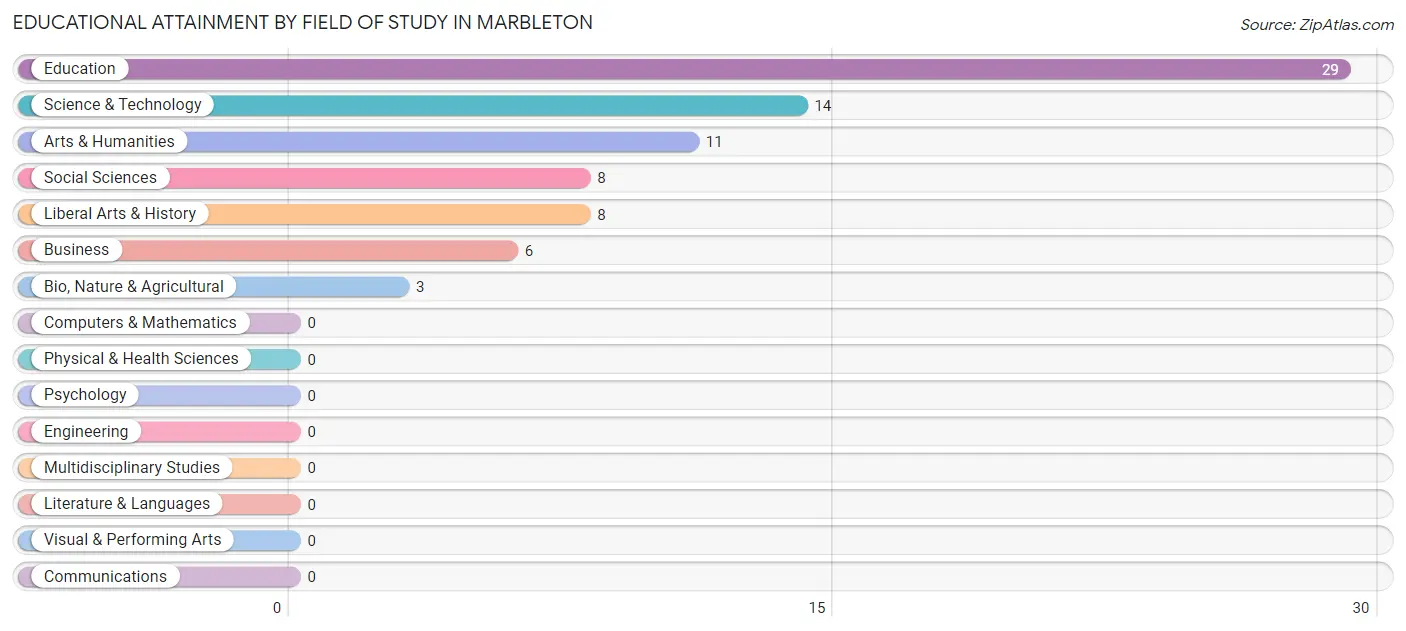
| Field of Study | # Graduates | % Graduates |
| Computers & Mathematics | 0 | 0.0% |
| Bio, Nature & Agricultural | 3 | 3.8% |
| Physical & Health Sciences | 0 | 0.0% |
| Psychology | 0 | 0.0% |
| Social Sciences | 8 | 10.1% |
| Engineering | 0 | 0.0% |
| Multidisciplinary Studies | 0 | 0.0% |
| Science & Technology | 14 | 17.7% |
| Business | 6 | 7.6% |
| Education | 29 | 36.7% |
| Literature & Languages | 0 | 0.0% |
| Liberal Arts & History | 8 | 10.1% |
| Visual & Performing Arts | 0 | 0.0% |
| Communications | 0 | 0.0% |
| Arts & Humanities | 11 | 13.9% |
| Total | 79 | 100.0% |
Transportation & Commute in Marbleton
Vehicle Availability by Sex in Marbleton
The most prevalent vehicle ownership categories in Marbleton are males with 2 vehicles (144, accounting for 51.2%) and females with 2 vehicles (77, making up 83.2%).
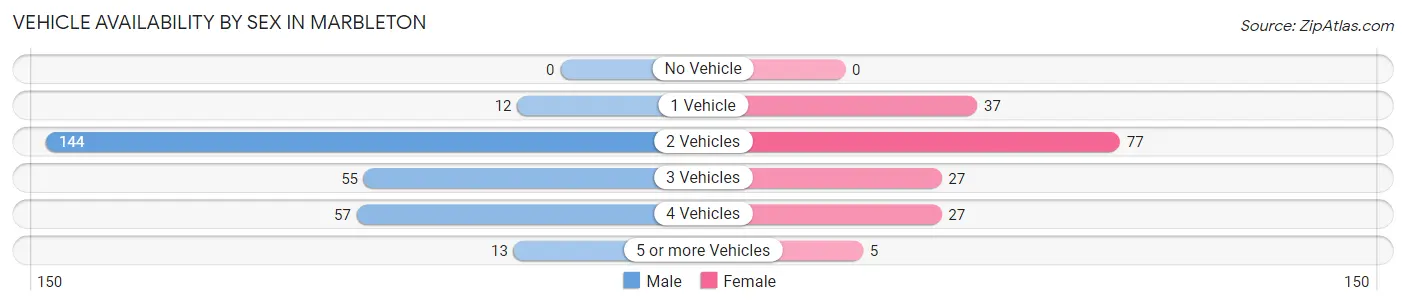
| Vehicles Available | Male | Female |
| No Vehicle | 0 (0.0%) | 0 (0.0%) |
| 1 Vehicle | 12 (4.3%) | 37 (21.4%) |
| 2 Vehicles | 144 (51.2%) | 77 (44.5%) |
| 3 Vehicles | 55 (19.6%) | 27 (15.6%) |
| 4 Vehicles | 57 (20.3%) | 27 (15.6%) |
| 5 or more Vehicles | 13 (4.6%) | 5 (2.9%) |
| Total | 281 (100.0%) | 173 (100.0%) |
Commute Time in Marbleton
The most frequently occuring commute durations in Marbleton are 5 to 9 minutes (136 commuters, 30.6%), less than 5 minutes (95 commuters, 21.3%), and 30 to 34 minutes (44 commuters, 9.9%).
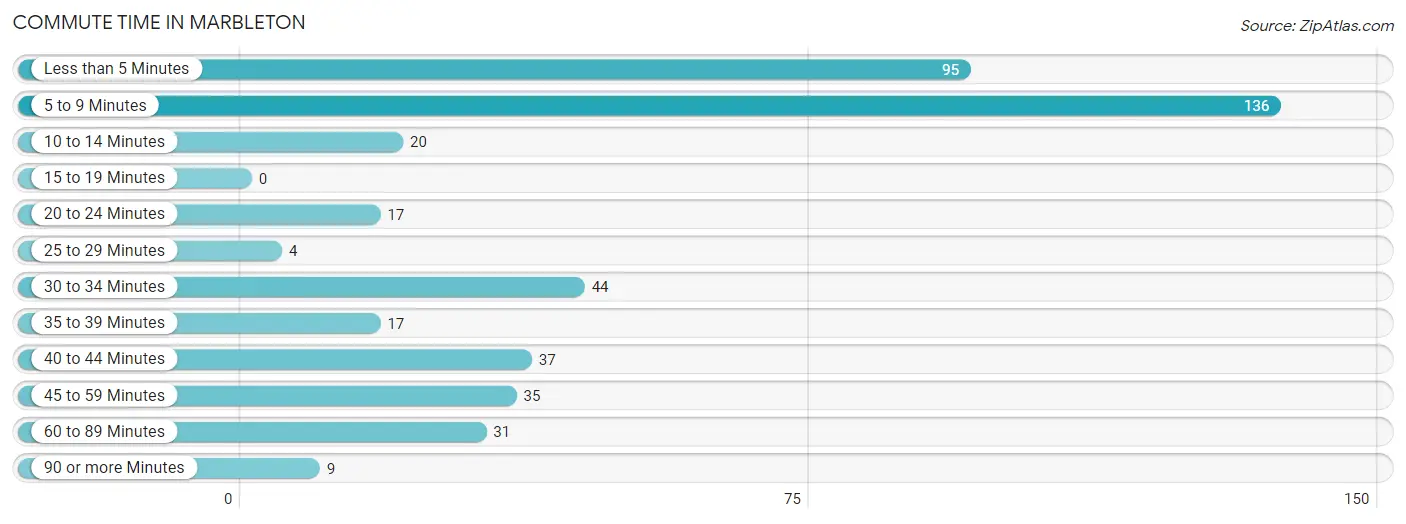
| Commute Time | # Commuters | % Commuters |
| Less than 5 Minutes | 95 | 21.3% |
| 5 to 9 Minutes | 136 | 30.6% |
| 10 to 14 Minutes | 20 | 4.5% |
| 15 to 19 Minutes | 0 | 0.0% |
| 20 to 24 Minutes | 17 | 3.8% |
| 25 to 29 Minutes | 4 | 0.9% |
| 30 to 34 Minutes | 44 | 9.9% |
| 35 to 39 Minutes | 17 | 3.8% |
| 40 to 44 Minutes | 37 | 8.3% |
| 45 to 59 Minutes | 35 | 7.9% |
| 60 to 89 Minutes | 31 | 7.0% |
| 90 or more Minutes | 9 | 2.0% |
Commute Time by Sex in Marbleton
The most common commute times in Marbleton are 5 to 9 minutes (66 commuters, 23.5%) for males and 5 to 9 minutes (70 commuters, 42.7%) for females.
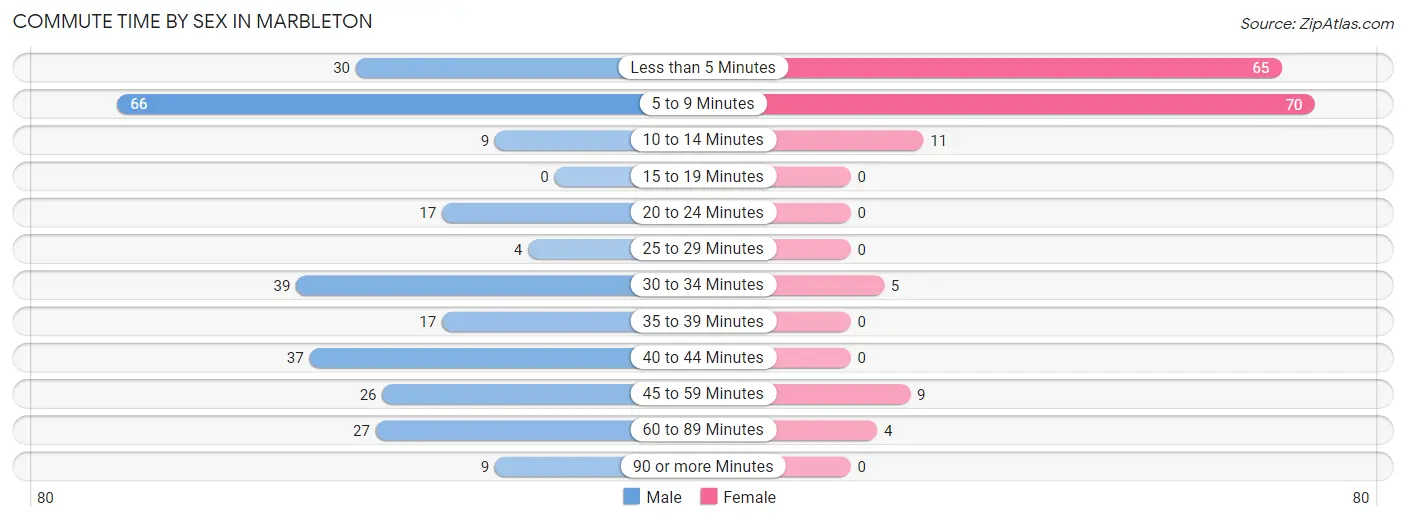
| Commute Time | Male | Female |
| Less than 5 Minutes | 30 (10.7%) | 65 (39.6%) |
| 5 to 9 Minutes | 66 (23.5%) | 70 (42.7%) |
| 10 to 14 Minutes | 9 (3.2%) | 11 (6.7%) |
| 15 to 19 Minutes | 0 (0.0%) | 0 (0.0%) |
| 20 to 24 Minutes | 17 (6.0%) | 0 (0.0%) |
| 25 to 29 Minutes | 4 (1.4%) | 0 (0.0%) |
| 30 to 34 Minutes | 39 (13.9%) | 5 (3.0%) |
| 35 to 39 Minutes | 17 (6.0%) | 0 (0.0%) |
| 40 to 44 Minutes | 37 (13.2%) | 0 (0.0%) |
| 45 to 59 Minutes | 26 (9.2%) | 9 (5.5%) |
| 60 to 89 Minutes | 27 (9.6%) | 4 (2.4%) |
| 90 or more Minutes | 9 (3.2%) | 0 (0.0%) |
Time of Departure to Work by Sex in Marbleton
The most frequent times of departure to work in Marbleton are 6:00 AM to 6:29 AM (81, 28.8%) for males and 7:30 AM to 7:59 AM (46, 28.1%) for females.
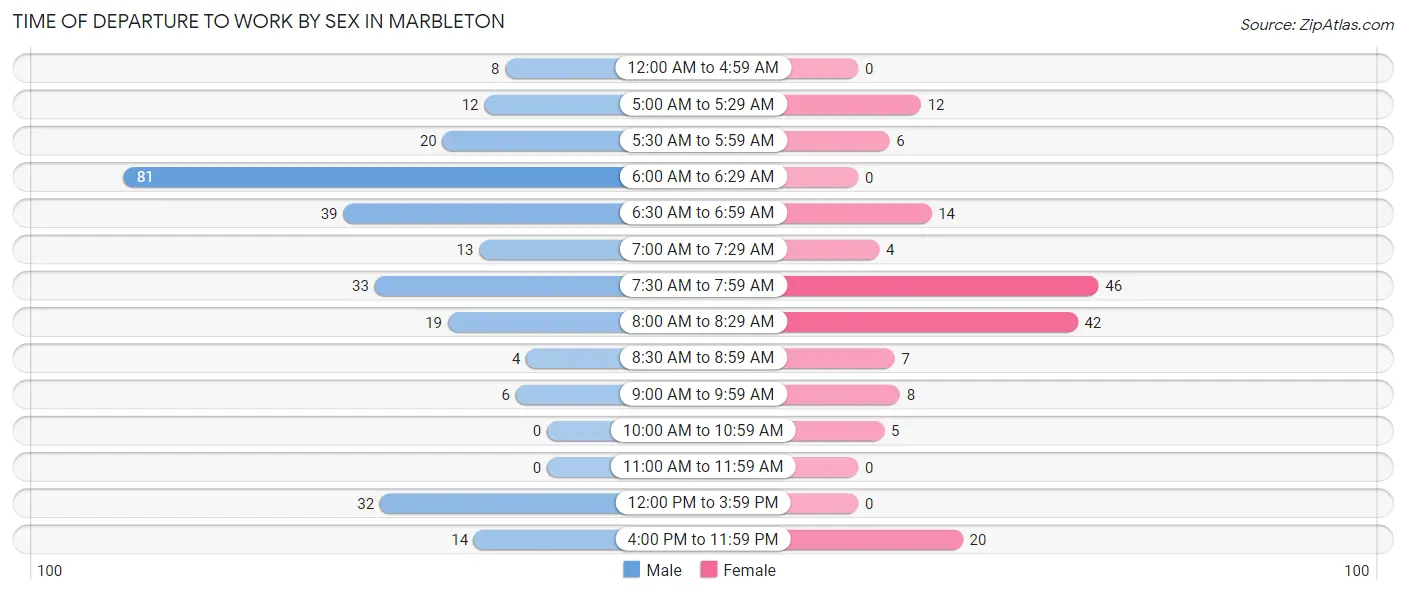
| Time of Departure | Male | Female |
| 12:00 AM to 4:59 AM | 8 (2.9%) | 0 (0.0%) |
| 5:00 AM to 5:29 AM | 12 (4.3%) | 12 (7.3%) |
| 5:30 AM to 5:59 AM | 20 (7.1%) | 6 (3.7%) |
| 6:00 AM to 6:29 AM | 81 (28.8%) | 0 (0.0%) |
| 6:30 AM to 6:59 AM | 39 (13.9%) | 14 (8.5%) |
| 7:00 AM to 7:29 AM | 13 (4.6%) | 4 (2.4%) |
| 7:30 AM to 7:59 AM | 33 (11.7%) | 46 (28.1%) |
| 8:00 AM to 8:29 AM | 19 (6.8%) | 42 (25.6%) |
| 8:30 AM to 8:59 AM | 4 (1.4%) | 7 (4.3%) |
| 9:00 AM to 9:59 AM | 6 (2.1%) | 8 (4.9%) |
| 10:00 AM to 10:59 AM | 0 (0.0%) | 5 (3.0%) |
| 11:00 AM to 11:59 AM | 0 (0.0%) | 0 (0.0%) |
| 12:00 PM to 3:59 PM | 32 (11.4%) | 0 (0.0%) |
| 4:00 PM to 11:59 PM | 14 (5.0%) | 20 (12.2%) |
| Total | 281 (100.0%) | 164 (100.0%) |
Housing Occupancy in Marbleton
Occupancy by Ownership in Marbleton
Of the total 359 dwellings in Marbleton, owner-occupied units account for 272 (75.8%), while renter-occupied units make up 87 (24.2%).
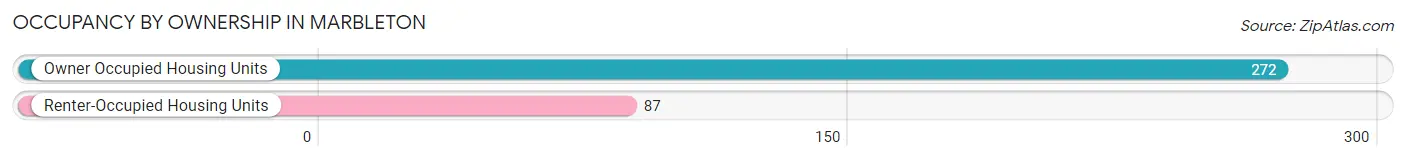
| Occupancy | # Housing Units | % Housing Units |
| Owner Occupied Housing Units | 272 | 75.8% |
| Renter-Occupied Housing Units | 87 | 24.2% |
| Total Occupied Housing Units | 359 | 100.0% |
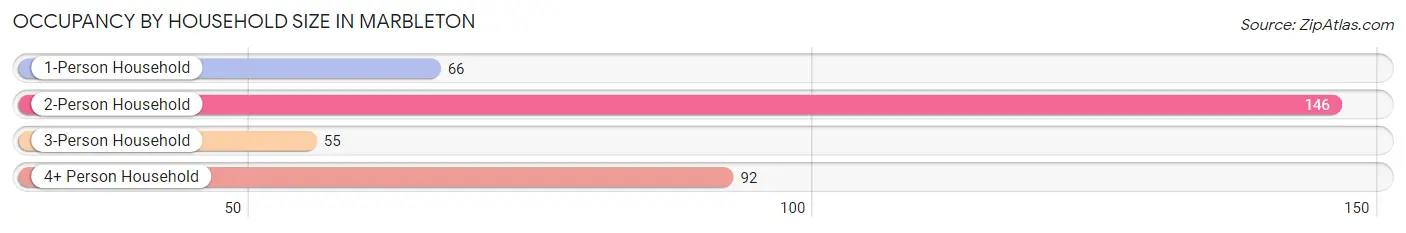
Occupancy by Household Size in Marbleton
| Household Size | # Housing Units | % Housing Units |
| 1-Person Household | 66 | 18.4% |
| 2-Person Household | 146 | 40.7% |
| 3-Person Household | 55 | 15.3% |
| 4+ Person Household | 92 | 25.6% |
| Total Housing Units | 359 | 100.0% |
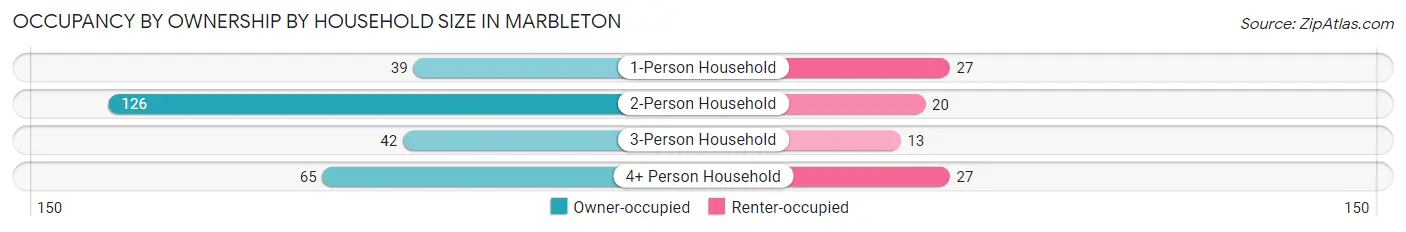
Occupancy by Ownership by Household Size in Marbleton
| Household Size | Owner-occupied | Renter-occupied |
| 1-Person Household | 39 (59.1%) | 27 (40.9%) |
| 2-Person Household | 126 (86.3%) | 20 (13.7%) |
| 3-Person Household | 42 (76.4%) | 13 (23.6%) |
| 4+ Person Household | 65 (70.7%) | 27 (29.3%) |
| Total Housing Units | 272 (75.8%) | 87 (24.2%) |
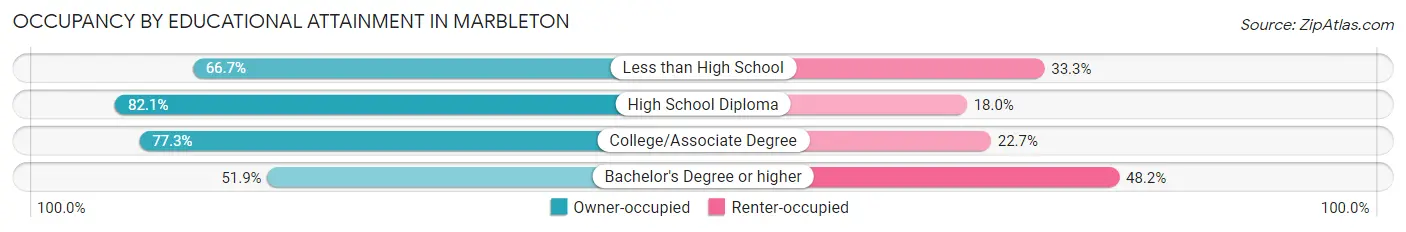
Occupancy by Educational Attainment in Marbleton
| Household Size | Owner-occupied | Renter-occupied |
| Less than High School | 26 (66.7%) | 13 (33.3%) |
| High School Diploma | 96 (82.1%) | 21 (17.9%) |
| College/Associate Degree | 136 (77.3%) | 40 (22.7%) |
| Bachelor's Degree or higher | 14 (51.8%) | 13 (48.1%) |
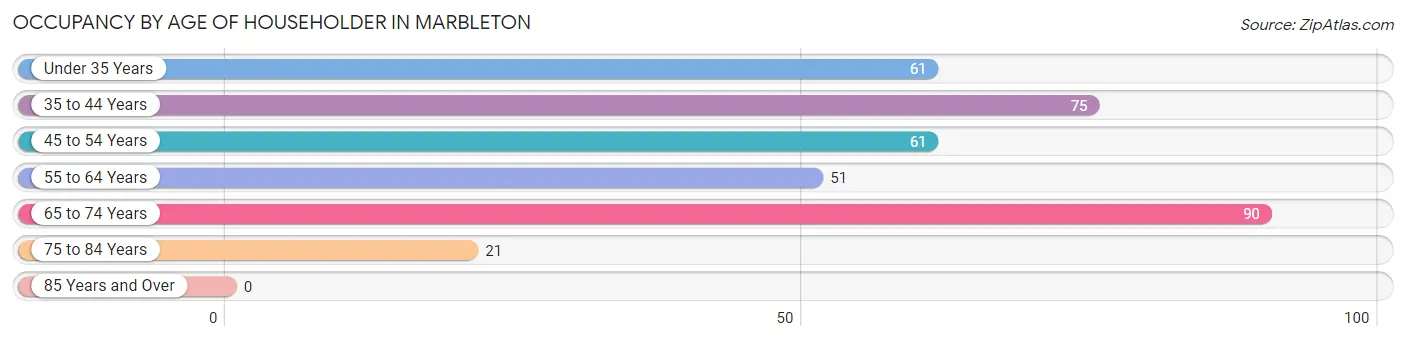
Occupancy by Age of Householder in Marbleton
| Age Bracket | # Households | % Households |
| Under 35 Years | 61 | 17.0% |
| 35 to 44 Years | 75 | 20.9% |
| 45 to 54 Years | 61 | 17.0% |
| 55 to 64 Years | 51 | 14.2% |
| 65 to 74 Years | 90 | 25.1% |
| 75 to 84 Years | 21 | 5.9% |
| 85 Years and Over | 0 | 0.0% |
| Total | 359 | 100.0% |
Housing Finances in Marbleton
Median Income by Occupancy in Marbleton
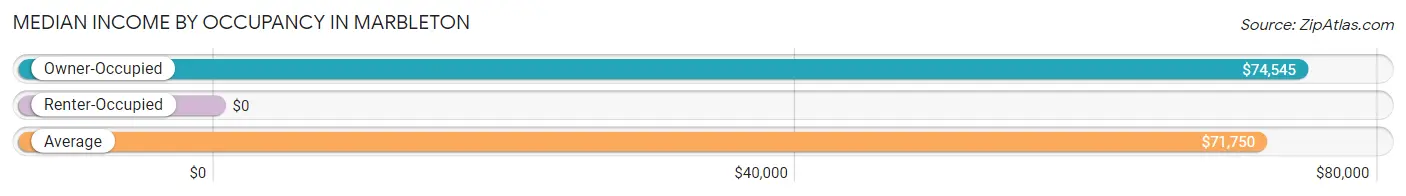
| Occupancy Type | # Households | Median Income |
| Owner-Occupied | 272 (75.8%) | $74,545 |
| Renter-Occupied | 87 (24.2%) | $0 |
| Average | 359 (100.0%) | $71,750 |
Occupancy by Householder Income Bracket in Marbleton
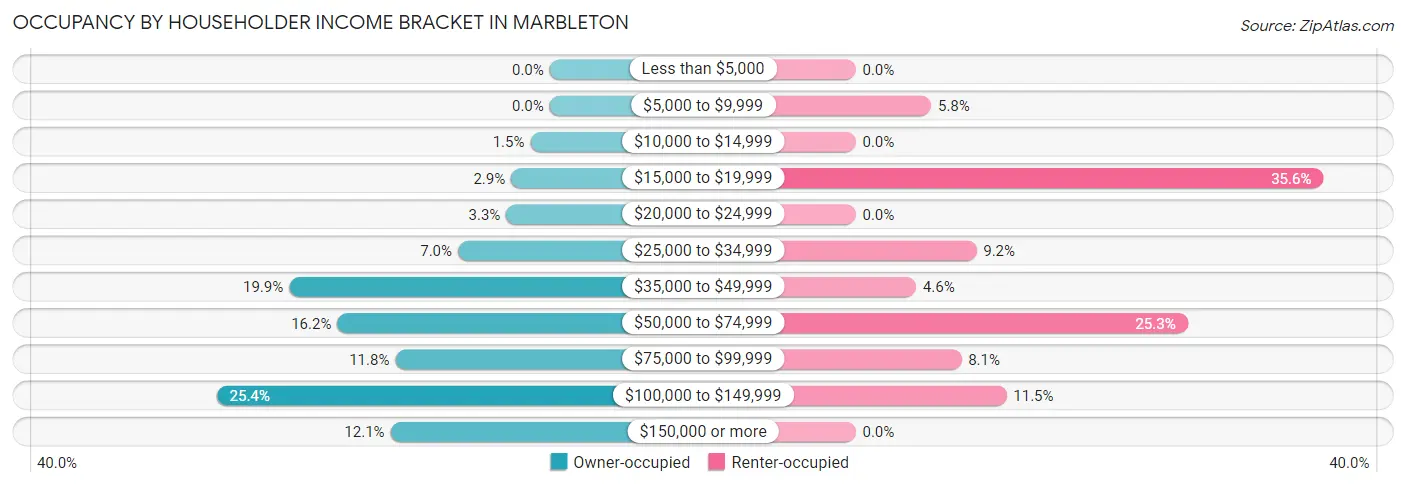
| Income Bracket | Owner-occupied | Renter-occupied |
| Less than $5,000 | 0 (0.0%) | 0 (0.0%) |
| $5,000 to $9,999 | 0 (0.0%) | 5 (5.8%) |
| $10,000 to $14,999 | 4 (1.5%) | 0 (0.0%) |
| $15,000 to $19,999 | 8 (2.9%) | 31 (35.6%) |
| $20,000 to $24,999 | 9 (3.3%) | 0 (0.0%) |
| $25,000 to $34,999 | 19 (7.0%) | 8 (9.2%) |
| $35,000 to $49,999 | 54 (19.9%) | 4 (4.6%) |
| $50,000 to $74,999 | 44 (16.2%) | 22 (25.3%) |
| $75,000 to $99,999 | 32 (11.8%) | 7 (8.1%) |
| $100,000 to $149,999 | 69 (25.4%) | 10 (11.5%) |
| $150,000 or more | 33 (12.1%) | 0 (0.0%) |
| Total | 272 (100.0%) | 87 (100.0%) |
Monthly Housing Cost Tiers in Marbleton
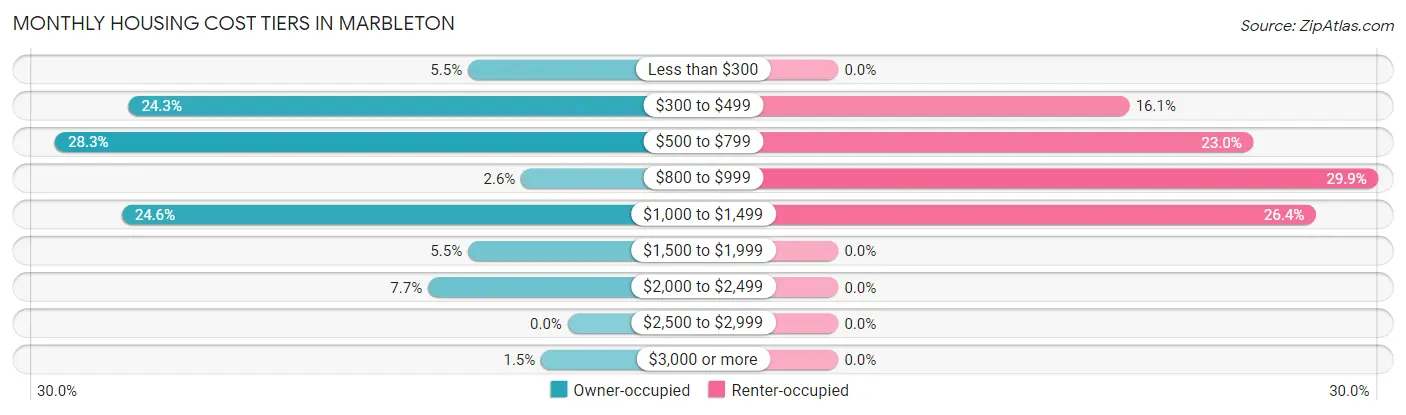
| Monthly Cost | Owner-occupied | Renter-occupied |
| Less than $300 | 15 (5.5%) | 0 (0.0%) |
| $300 to $499 | 66 (24.3%) | 14 (16.1%) |
| $500 to $799 | 77 (28.3%) | 20 (23.0%) |
| $800 to $999 | 7 (2.6%) | 26 (29.9%) |
| $1,000 to $1,499 | 67 (24.6%) | 23 (26.4%) |
| $1,500 to $1,999 | 15 (5.5%) | 0 (0.0%) |
| $2,000 to $2,499 | 21 (7.7%) | 0 (0.0%) |
| $2,500 to $2,999 | 0 (0.0%) | 0 (0.0%) |
| $3,000 or more | 4 (1.5%) | 0 (0.0%) |
| Total | 272 (100.0%) | 87 (100.0%) |
Physical Housing Characteristics in Marbleton
Housing Structures in Marbleton
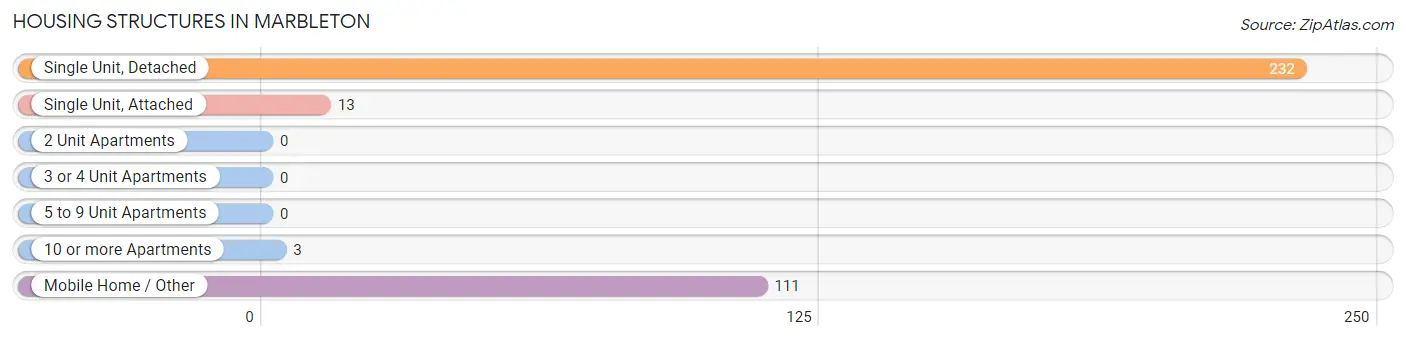
| Structure Type | # Housing Units | % Housing Units |
| Single Unit, Detached | 232 | 64.6% |
| Single Unit, Attached | 13 | 3.6% |
| 2 Unit Apartments | 0 | 0.0% |
| 3 or 4 Unit Apartments | 0 | 0.0% |
| 5 to 9 Unit Apartments | 0 | 0.0% |
| 10 or more Apartments | 3 | 0.8% |
| Mobile Home / Other | 111 | 30.9% |
| Total | 359 | 100.0% |
Housing Structures by Occupancy in Marbleton
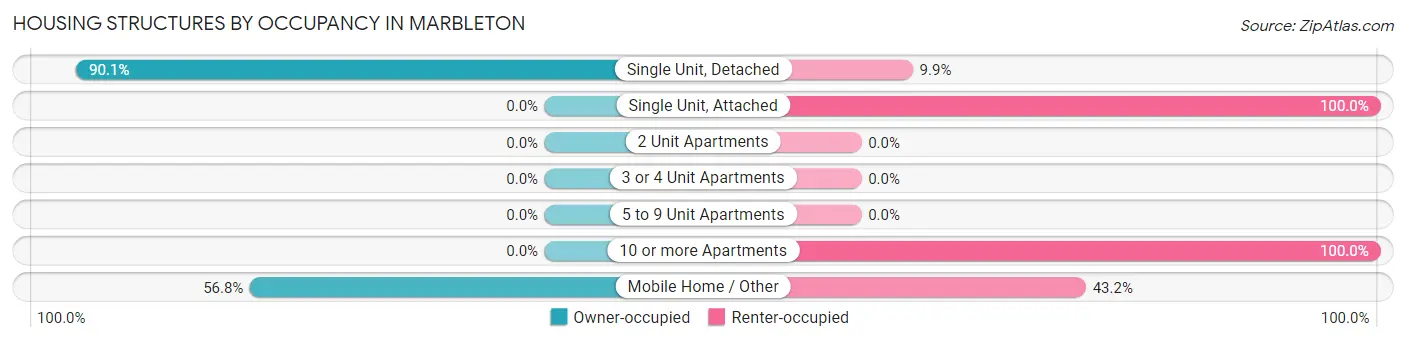
| Structure Type | Owner-occupied | Renter-occupied |
| Single Unit, Detached | 209 (90.1%) | 23 (9.9%) |
| Single Unit, Attached | 0 (0.0%) | 13 (100.0%) |
| 2 Unit Apartments | 0 (0.0%) | 0 (0.0%) |
| 3 or 4 Unit Apartments | 0 (0.0%) | 0 (0.0%) |
| 5 to 9 Unit Apartments | 0 (0.0%) | 0 (0.0%) |
| 10 or more Apartments | 0 (0.0%) | 3 (100.0%) |
| Mobile Home / Other | 63 (56.8%) | 48 (43.2%) |
| Total | 272 (75.8%) | 87 (24.2%) |
Housing Structures by Number of Rooms in Marbleton
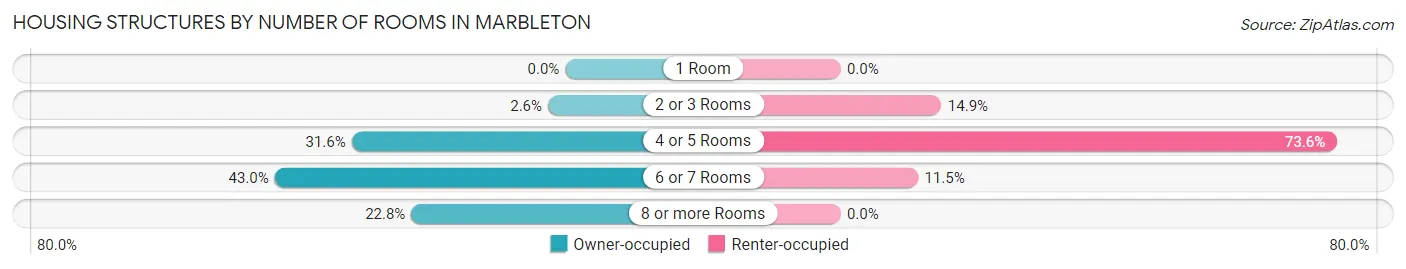
| Number of Rooms | Owner-occupied | Renter-occupied |
| 1 Room | 0 (0.0%) | 0 (0.0%) |
| 2 or 3 Rooms | 7 (2.6%) | 13 (14.9%) |
| 4 or 5 Rooms | 86 (31.6%) | 64 (73.6%) |
| 6 or 7 Rooms | 117 (43.0%) | 10 (11.5%) |
| 8 or more Rooms | 62 (22.8%) | 0 (0.0%) |
| Total | 272 (100.0%) | 87 (100.0%) |
Housing Structure by Heating Type in Marbleton
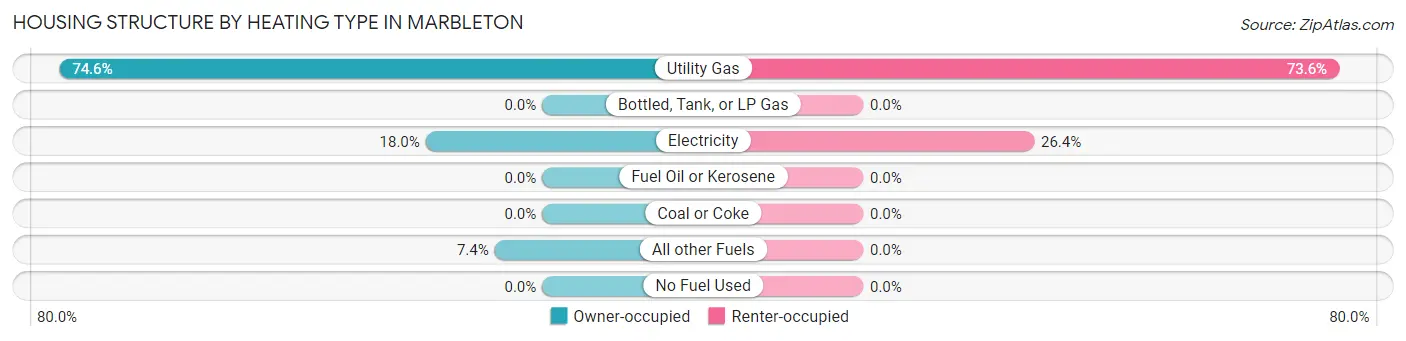
| Heating Type | Owner-occupied | Renter-occupied |
| Utility Gas | 203 (74.6%) | 64 (73.6%) |
| Bottled, Tank, or LP Gas | 0 (0.0%) | 0 (0.0%) |
| Electricity | 49 (18.0%) | 23 (26.4%) |
| Fuel Oil or Kerosene | 0 (0.0%) | 0 (0.0%) |
| Coal or Coke | 0 (0.0%) | 0 (0.0%) |
| All other Fuels | 20 (7.3%) | 0 (0.0%) |
| No Fuel Used | 0 (0.0%) | 0 (0.0%) |
| Total | 272 (100.0%) | 87 (100.0%) |
Household Vehicle Usage in Marbleton
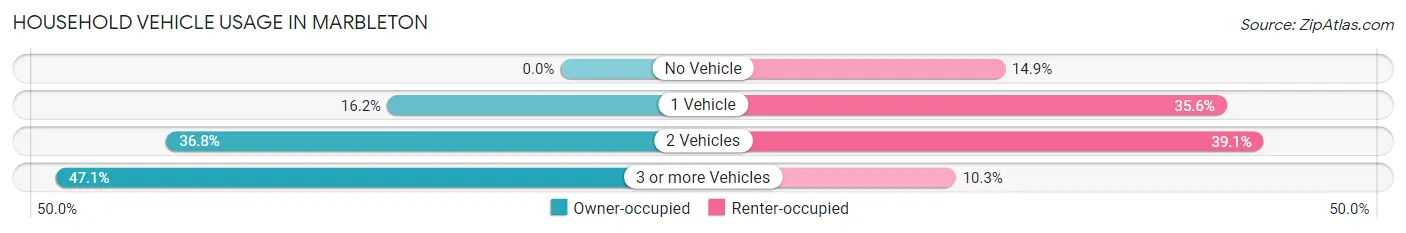
| Vehicles per Household | Owner-occupied | Renter-occupied |
| No Vehicle | 0 (0.0%) | 13 (14.9%) |
| 1 Vehicle | 44 (16.2%) | 31 (35.6%) |
| 2 Vehicles | 100 (36.8%) | 34 (39.1%) |
| 3 or more Vehicles | 128 (47.1%) | 9 (10.3%) |
| Total | 272 (100.0%) | 87 (100.0%) |
Real Estate & Mortgages in Marbleton
Real Estate and Mortgage Overview in Marbleton
| Characteristic | Without Mortgage | With Mortgage |
| Housing Units | 151 | 121 |
| Median Property Value | $165,500 | $188,400 |
| Median Household Income | $57,813 | $16 |
| Monthly Housing Costs | $468 | $4 |
| Real Estate Taxes | $902 | $0 |
Property Value by Mortgage Status in Marbleton
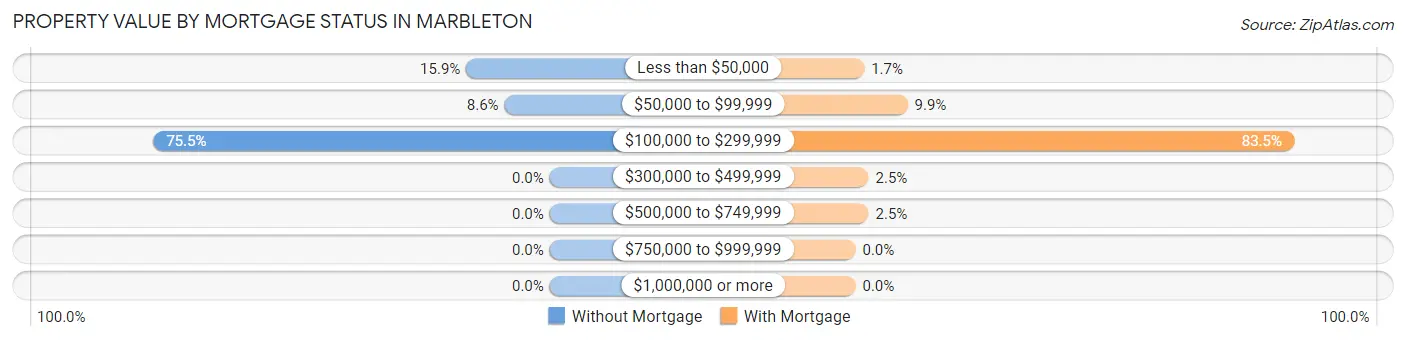
| Property Value | Without Mortgage | With Mortgage |
| Less than $50,000 | 24 (15.9%) | 2 (1.7%) |
| $50,000 to $99,999 | 13 (8.6%) | 12 (9.9%) |
| $100,000 to $299,999 | 114 (75.5%) | 101 (83.5%) |
| $300,000 to $499,999 | 0 (0.0%) | 3 (2.5%) |
| $500,000 to $749,999 | 0 (0.0%) | 3 (2.5%) |
| $750,000 to $999,999 | 0 (0.0%) | 0 (0.0%) |
| $1,000,000 or more | 0 (0.0%) | 0 (0.0%) |
| Total | 151 (100.0%) | 121 (100.0%) |
Household Income by Mortgage Status in Marbleton
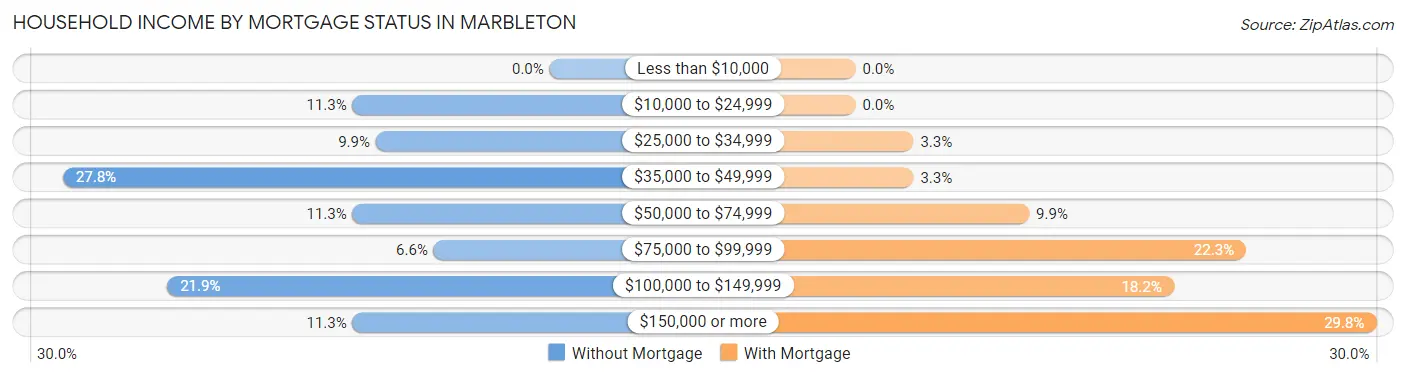
| Household Income | Without Mortgage | With Mortgage |
| Less than $10,000 | 0 (0.0%) | 0 (0.0%) |
| $10,000 to $24,999 | 17 (11.3%) | 0 (0.0%) |
| $25,000 to $34,999 | 15 (9.9%) | 4 (3.3%) |
| $35,000 to $49,999 | 42 (27.8%) | 4 (3.3%) |
| $50,000 to $74,999 | 17 (11.3%) | 12 (9.9%) |
| $75,000 to $99,999 | 10 (6.6%) | 27 (22.3%) |
| $100,000 to $149,999 | 33 (21.8%) | 22 (18.2%) |
| $150,000 or more | 17 (11.3%) | 36 (29.7%) |
| Total | 151 (100.0%) | 121 (100.0%) |
Property Value to Household Income Ratio in Marbleton
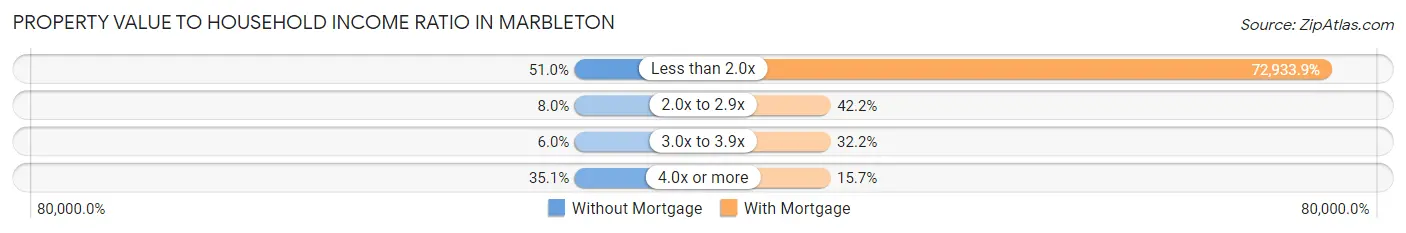
| Value-to-Income Ratio | Without Mortgage | With Mortgage |
| Less than 2.0x | 77 (51.0%) | 88,250 (72,933.9%) |
| 2.0x to 2.9x | 12 (8.0%) | 51 (42.1%) |
| 3.0x to 3.9x | 9 (6.0%) | 39 (32.2%) |
| 4.0x or more | 53 (35.1%) | 19 (15.7%) |
| Total | 151 (100.0%) | 121 (100.0%) |
Real Estate Taxes by Mortgage Status in Marbleton
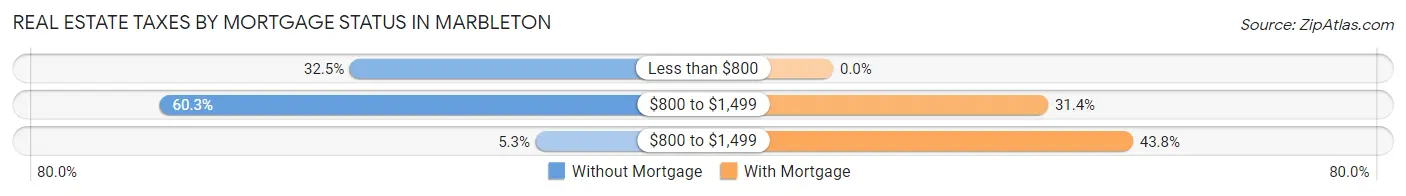
| Property Taxes | Without Mortgage | With Mortgage |
| Less than $800 | 49 (32.5%) | 0 (0.0%) |
| $800 to $1,499 | 91 (60.3%) | 38 (31.4%) |
| $800 to $1,499 | 8 (5.3%) | 53 (43.8%) |
| Total | 151 (100.0%) | 121 (100.0%) |
Health & Disability in Marbleton
Health Insurance Coverage by Age in Marbleton
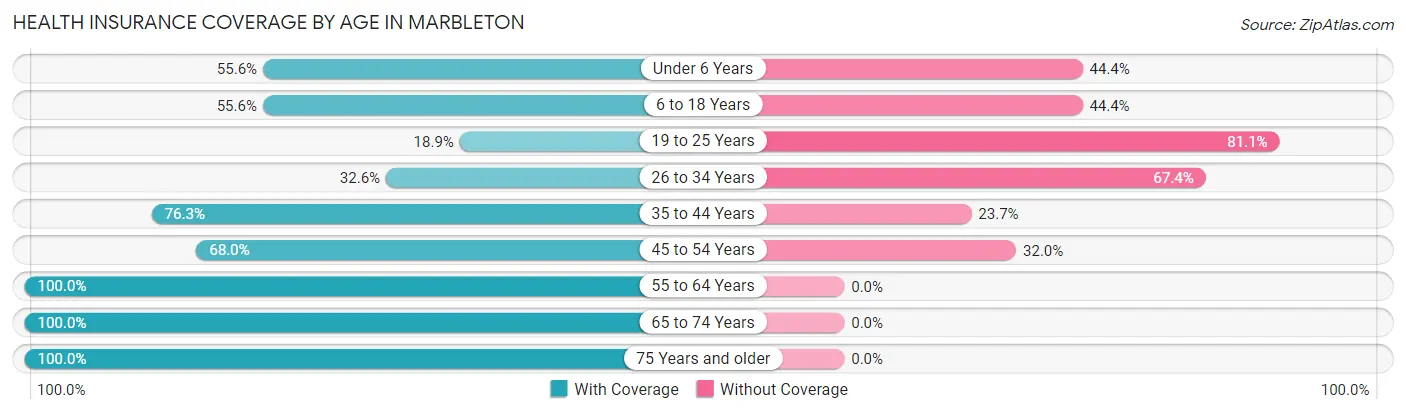
| Age Bracket | With Coverage | Without Coverage |
| Under 6 Years | 25 (55.6%) | 20 (44.4%) |
| 6 to 18 Years | 189 (55.6%) | 151 (44.4%) |
| 19 to 25 Years | 20 (18.9%) | 86 (81.1%) |
| 26 to 34 Years | 46 (32.6%) | 95 (67.4%) |
| 35 to 44 Years | 103 (76.3%) | 32 (23.7%) |
| 45 to 54 Years | 70 (68.0%) | 33 (32.0%) |
| 55 to 64 Years | 76 (100.0%) | 0 (0.0%) |
| 65 to 74 Years | 177 (100.0%) | 0 (0.0%) |
| 75 Years and older | 64 (100.0%) | 0 (0.0%) |
| Total | 770 (64.9%) | 417 (35.1%) |
Health Insurance Coverage by Citizenship Status in Marbleton
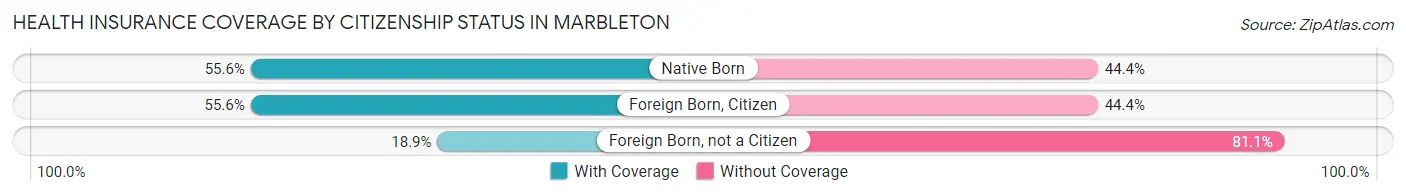
| Citizenship Status | With Coverage | Without Coverage |
| Native Born | 25 (55.6%) | 20 (44.4%) |
| Foreign Born, Citizen | 189 (55.6%) | 151 (44.4%) |
| Foreign Born, not a Citizen | 20 (18.9%) | 86 (81.1%) |
Health Insurance Coverage by Household Income in Marbleton
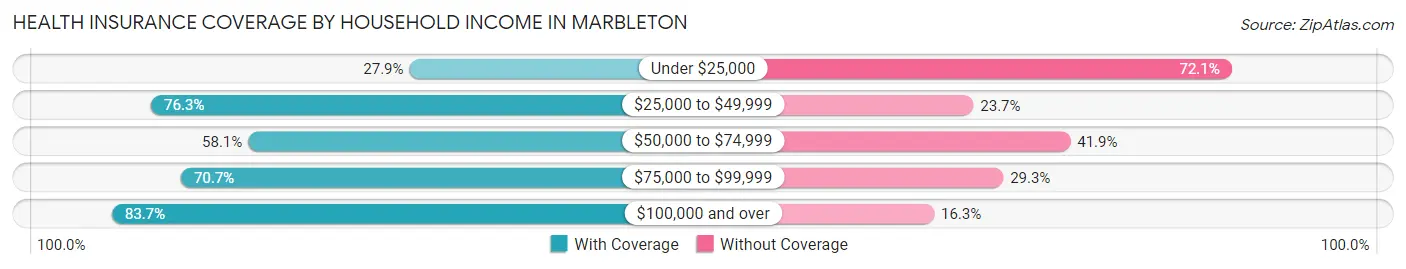
| Household Income | With Coverage | Without Coverage |
| Under $25,000 | 67 (27.9%) | 173 (72.1%) |
| $25,000 to $49,999 | 177 (76.3%) | 55 (23.7%) |
| $50,000 to $74,999 | 118 (58.1%) | 85 (41.9%) |
| $75,000 to $99,999 | 111 (70.7%) | 46 (29.3%) |
| $100,000 and over | 297 (83.7%) | 58 (16.3%) |
Public vs Private Health Insurance Coverage by Age in Marbleton
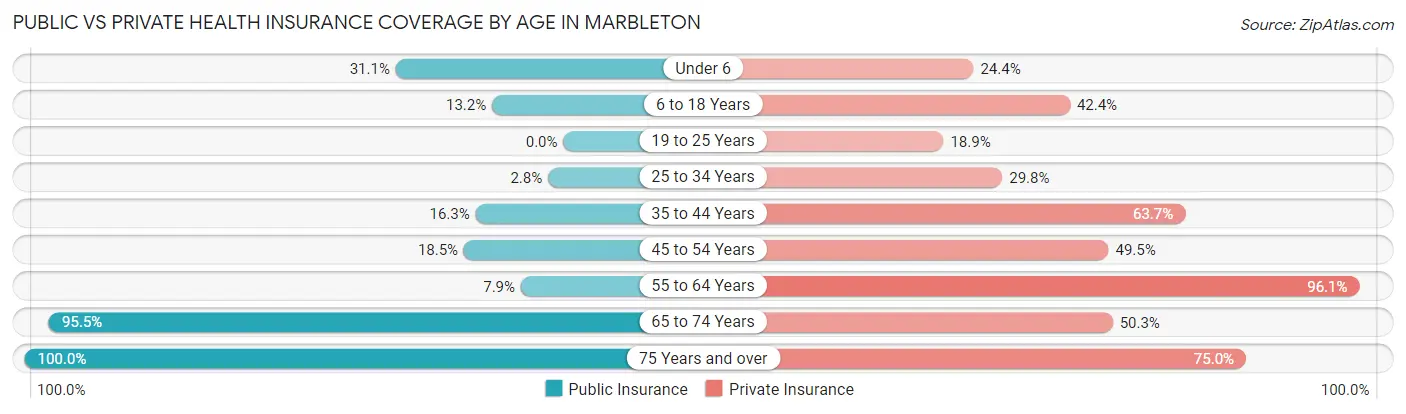
| Age Bracket | Public Insurance | Private Insurance |
| Under 6 | 14 (31.1%) | 11 (24.4%) |
| 6 to 18 Years | 45 (13.2%) | 144 (42.3%) |
| 19 to 25 Years | 0 (0.0%) | 20 (18.9%) |
| 25 to 34 Years | 4 (2.8%) | 42 (29.8%) |
| 35 to 44 Years | 22 (16.3%) | 86 (63.7%) |
| 45 to 54 Years | 19 (18.4%) | 51 (49.5%) |
| 55 to 64 Years | 6 (7.9%) | 73 (96.1%) |
| 65 to 74 Years | 169 (95.5%) | 89 (50.3%) |
| 75 Years and over | 64 (100.0%) | 48 (75.0%) |
| Total | 343 (28.9%) | 564 (47.5%) |
Disability Status by Sex by Age in Marbleton
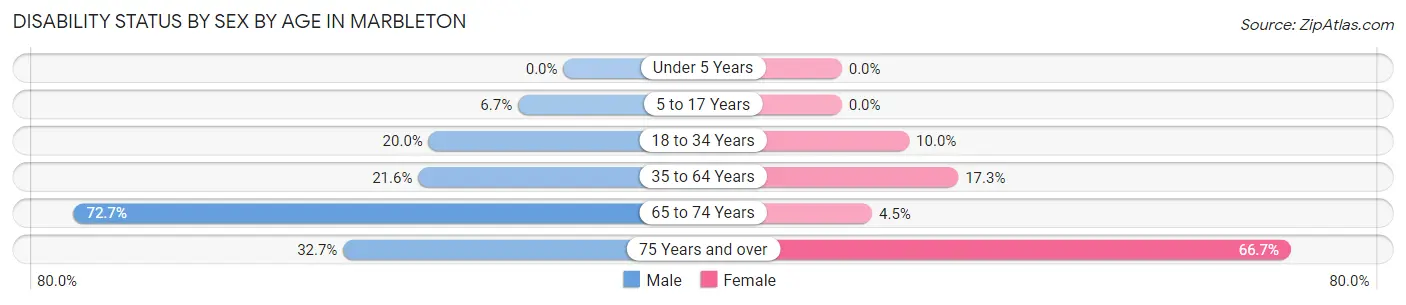
| Age Bracket | Male | Female |
| Under 5 Years | 0 (0.0%) | 0 (0.0%) |
| 5 to 17 Years | 12 (6.7%) | 0 (0.0%) |
| 18 to 34 Years | 48 (20.0%) | 7 (10.0%) |
| 35 to 64 Years | 39 (21.5%) | 23 (17.3%) |
| 65 to 74 Years | 48 (72.7%) | 5 (4.5%) |
| 75 Years and over | 17 (32.7%) | 8 (66.7%) |
Disability Class by Sex by Age in Marbleton
Disability Class: Hearing Difficulty
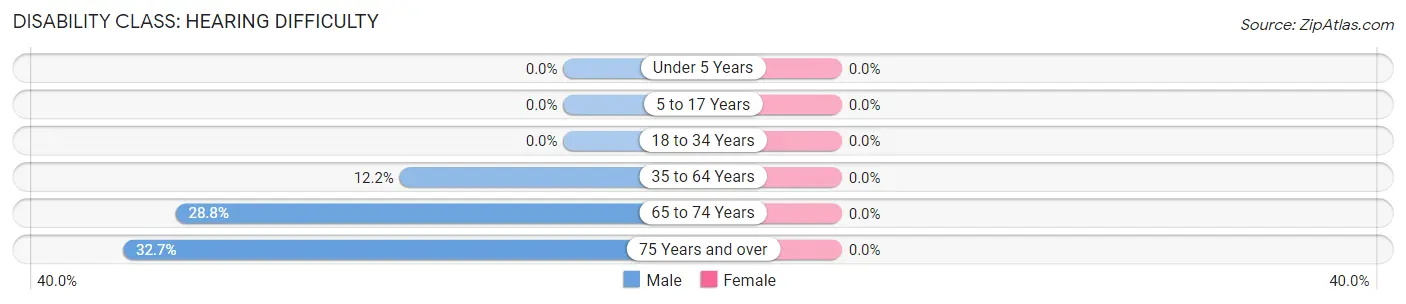
| Age Bracket | Male | Female |
| Under 5 Years | 0 (0.0%) | 0 (0.0%) |
| 5 to 17 Years | 0 (0.0%) | 0 (0.0%) |
| 18 to 34 Years | 0 (0.0%) | 0 (0.0%) |
| 35 to 64 Years | 22 (12.1%) | 0 (0.0%) |
| 65 to 74 Years | 19 (28.8%) | 0 (0.0%) |
| 75 Years and over | 17 (32.7%) | 0 (0.0%) |
Disability Class: Vision Difficulty
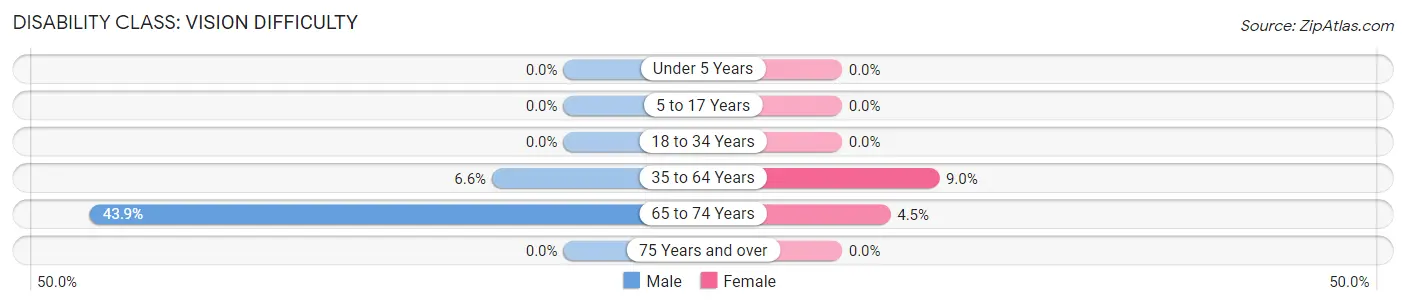
| Age Bracket | Male | Female |
| Under 5 Years | 0 (0.0%) | 0 (0.0%) |
| 5 to 17 Years | 0 (0.0%) | 0 (0.0%) |
| 18 to 34 Years | 0 (0.0%) | 0 (0.0%) |
| 35 to 64 Years | 12 (6.6%) | 12 (9.0%) |
| 65 to 74 Years | 29 (43.9%) | 5 (4.5%) |
| 75 Years and over | 0 (0.0%) | 0 (0.0%) |
Disability Class: Cognitive Difficulty
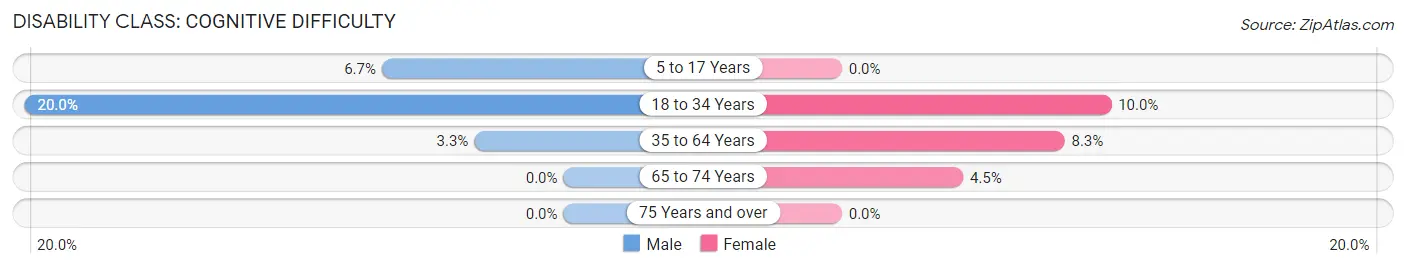
| Age Bracket | Male | Female |
| 5 to 17 Years | 12 (6.7%) | 0 (0.0%) |
| 18 to 34 Years | 48 (20.0%) | 7 (10.0%) |
| 35 to 64 Years | 6 (3.3%) | 11 (8.3%) |
| 65 to 74 Years | 0 (0.0%) | 5 (4.5%) |
| 75 Years and over | 0 (0.0%) | 0 (0.0%) |
Disability Class: Ambulatory Difficulty
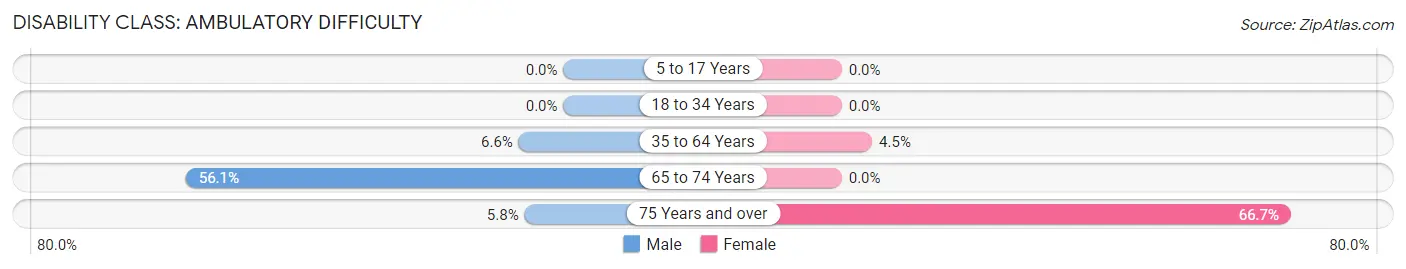
| Age Bracket | Male | Female |
| 5 to 17 Years | 0 (0.0%) | 0 (0.0%) |
| 18 to 34 Years | 0 (0.0%) | 0 (0.0%) |
| 35 to 64 Years | 12 (6.6%) | 6 (4.5%) |
| 65 to 74 Years | 37 (56.1%) | 0 (0.0%) |
| 75 Years and over | 3 (5.8%) | 8 (66.7%) |
Disability Class: Self-Care Difficulty
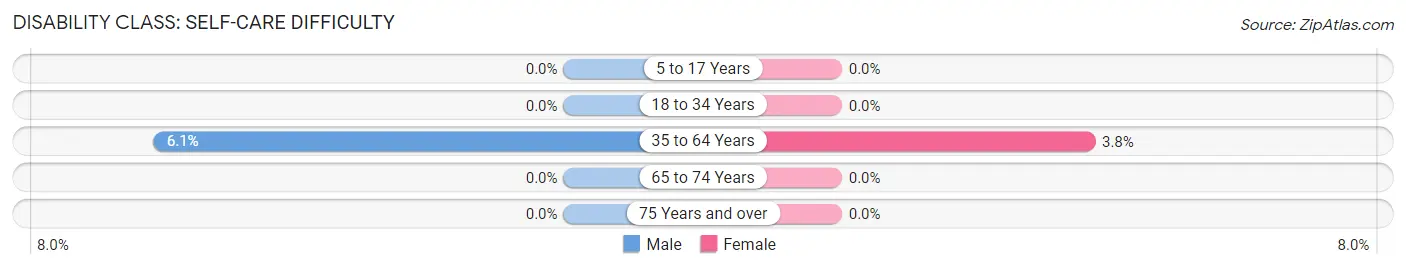
| Age Bracket | Male | Female |
| 5 to 17 Years | 0 (0.0%) | 0 (0.0%) |
| 18 to 34 Years | 0 (0.0%) | 0 (0.0%) |
| 35 to 64 Years | 11 (6.1%) | 5 (3.8%) |
| 65 to 74 Years | 0 (0.0%) | 0 (0.0%) |
| 75 Years and over | 0 (0.0%) | 0 (0.0%) |
Technology Access in Marbleton
Computing Device Access in Marbleton
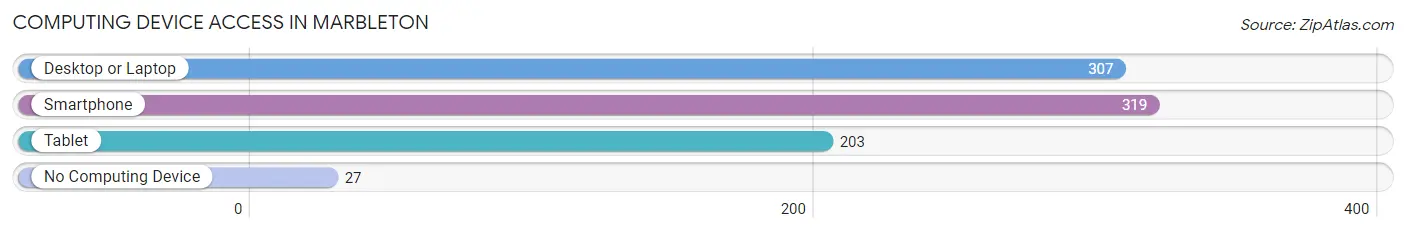
| Device Type | # Households | % Households |
| Desktop or Laptop | 307 | 85.5% |
| Smartphone | 319 | 88.9% |
| Tablet | 203 | 56.6% |
| No Computing Device | 27 | 7.5% |
| Total | 359 | 100.0% |
Internet Access in Marbleton
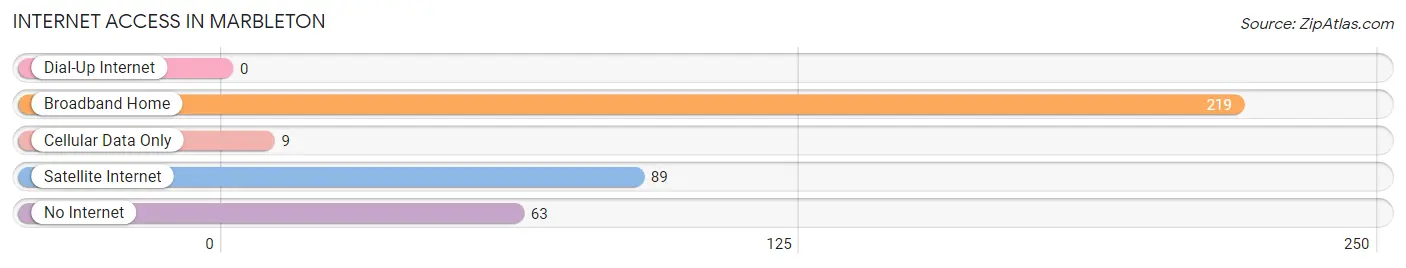
| Internet Type | # Households | % Households |
| Dial-Up Internet | 0 | 0.0% |
| Broadband Home | 219 | 61.0% |
| Cellular Data Only | 9 | 2.5% |
| Satellite Internet | 89 | 24.8% |
| No Internet | 63 | 17.5% |
| Total | 359 | 100.0% |
Marbleton Summary
Marbleton is a small town located in the southwestern corner of Wyoming, in Sublette County. It is situated at the intersection of US Highway 189 and Wyoming Highway 352, and is the county seat of Sublette County. The town was founded in 1884 and was named after the nearby marble deposits. The town has a population of approximately 830 people, and is the largest town in the county.
Geography
Marbleton is located in the Upper Green River Valley, at an elevation of 6,845 feet. The town is surrounded by the Wind River Mountains to the east, the Wyoming Range to the west, and the Gros Ventre Range to the south. The town is located in a semi-arid climate, with hot summers and cold winters. The average annual precipitation is 11.5 inches, and the average annual snowfall is 33.5 inches.
Economy
Marbleton’s economy is largely based on agriculture and tourism. The town is home to several farms and ranches, which produce hay, wheat, barley, and other crops. The town is also home to several tourist attractions, including the Marbleton Museum, the Marbleton Rodeo, and the Marbleton Golf Course.
Demographics
As of the 2010 census, the population of Marbleton was 830, with a population density of 5.3 people per square mile. The median age of the population was 44.7 years, and the median household income was $45,938. The racial makeup of the town was 95.2% White, 0.7% Native American, 0.4% Asian, 0.2% African American, and 3.5% from other races.
History
Marbleton was founded in 1884, when the Union Pacific Railroad built a line through the area. The town was named after the nearby marble deposits, which were used to build the railroad. The town quickly grew, and by the early 1900s, it had become a bustling center of commerce and industry. The town was home to several businesses, including a hotel, a bank, a newspaper, and a general store.
In the early 1900s, Marbleton was also home to a large sheep ranching industry. The town was home to several large sheep ranches, which supplied wool to the local woolen mills. The town also had a thriving mining industry, with several marble quarries in the area.
In the late 1900s, Marbleton’s economy shifted away from agriculture and mining, and towards tourism and recreation. The town is now home to several tourist attractions, including the Marbleton Museum, the Marbleton Rodeo, and the Marbleton Golf Course. The town is also home to several outdoor recreation areas, including the Upper Green River Valley, which is popular for fishing, camping, and hiking.
Common Questions
What is Per Capita Income in Marbleton?
Per Capita income in Marbleton is $25,053.
What is the Median Family Income in Marbleton?
Median Family Income in Marbleton is $74,375.
What is the Median Household income in Marbleton?
Median Household Income in Marbleton is $71,750.
What is Income or Wage Gap in Marbleton?
Income or Wage Gap in Marbleton is 56.1%.
Women in Marbleton earn 43.9 cents for every dollar earned by a man.
What is Inequality or Gini Index in Marbleton?
Inequality or Gini Index in Marbleton is 0.36.
What is the Total Population of Marbleton?
Total Population of Marbleton is 1,187.
What is the Total Male Population of Marbleton?
Total Male Population of Marbleton is 744.
What is the Total Female Population of Marbleton?
Total Female Population of Marbleton is 443.
What is the Ratio of Males per 100 Females in Marbleton?
There are 167.95 Males per 100 Females in Marbleton.
What is the Ratio of Females per 100 Males in Marbleton?
There are 59.54 Females per 100 Males in Marbleton.
What is the Median Population Age in Marbleton?
Median Population Age in Marbleton is 31.4 Years.
What is the Average Family Size in Marbleton
Average Family Size in Marbleton is 3.7 People.
What is the Average Household Size in Marbleton
Average Household Size in Marbleton is 3.3 People.
How Large is the Labor Force in Marbleton?
There are 522 People in the Labor Forcein in Marbleton.
What is the Percentage of People in the Labor Force in Marbleton?
56.6% of People are in the Labor Force in Marbleton.
What is the Unemployment Rate in Marbleton?
Unemployment Rate in Marbleton is 13.0%.