Lucerne, WY Map & Demographics
Lucerne Map

Lucerne Overview
$24,726
PER CAPITA INCOME
$74,183
AVG FAMILY INCOME
$73,558
AVG HOUSEHOLD INCOME
28.0%
WAGE / INCOME GAP [ % ]
72.0¢/ $1
WAGE / INCOME GAP [ $ ]
0.29
INEQUALITY / GINI INDEX
596
TOTAL POPULATION
283
MALE POPULATION
313
FEMALE POPULATION
90.42
MALES / 100 FEMALES
110.60
FEMALES / 100 MALES
34.0
MEDIAN AGE
3.0
AVG FAMILY SIZE
3.1
AVG HOUSEHOLD SIZE
231
LABOR FORCE [ PEOPLE ]
56.9%
PERCENT IN LABOR FORCE
Income in Lucerne
Income Overview in Lucerne
Per Capita Income in Lucerne is $24,726, while median incomes of families and households are $74,183 and $73,558 respectively.
| Characteristic | Number | Measure |
| Per Capita Income | 596 | $24,726 |
| Median Family Income | 177 | $74,183 |
| Mean Family Income | 177 | $74,510 |
| Median Household Income | 192 | $73,558 |
| Mean Household Income | 192 | $74,124 |
| Income Deficit | 177 | $0 |
| Wage / Income Gap (%) | 596 | 28.04% |
| Wage / Income Gap ($) | 596 | 71.96¢ per $1 |
| Gini / Inequality Index | 596 | 0.29 |
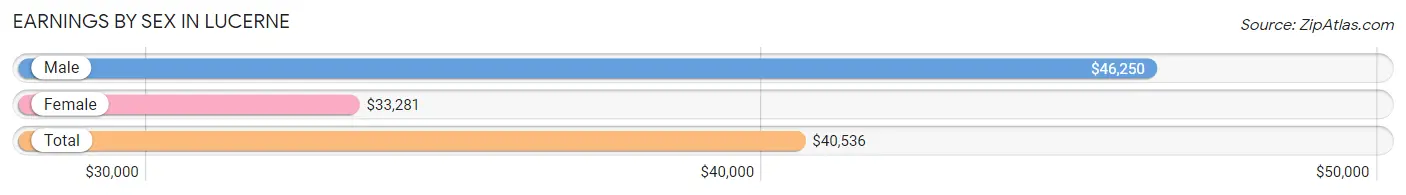
Earnings by Sex in Lucerne
Average Earnings in Lucerne are $40,536, $46,250 for men and $33,281 for women, a difference of 28.0%.
| Sex | Number | Average Earnings |
| Male | 114 (41.4%) | $46,250 |
| Female | 161 (58.6%) | $33,281 |
| Total | 275 (100.0%) | $40,536 |
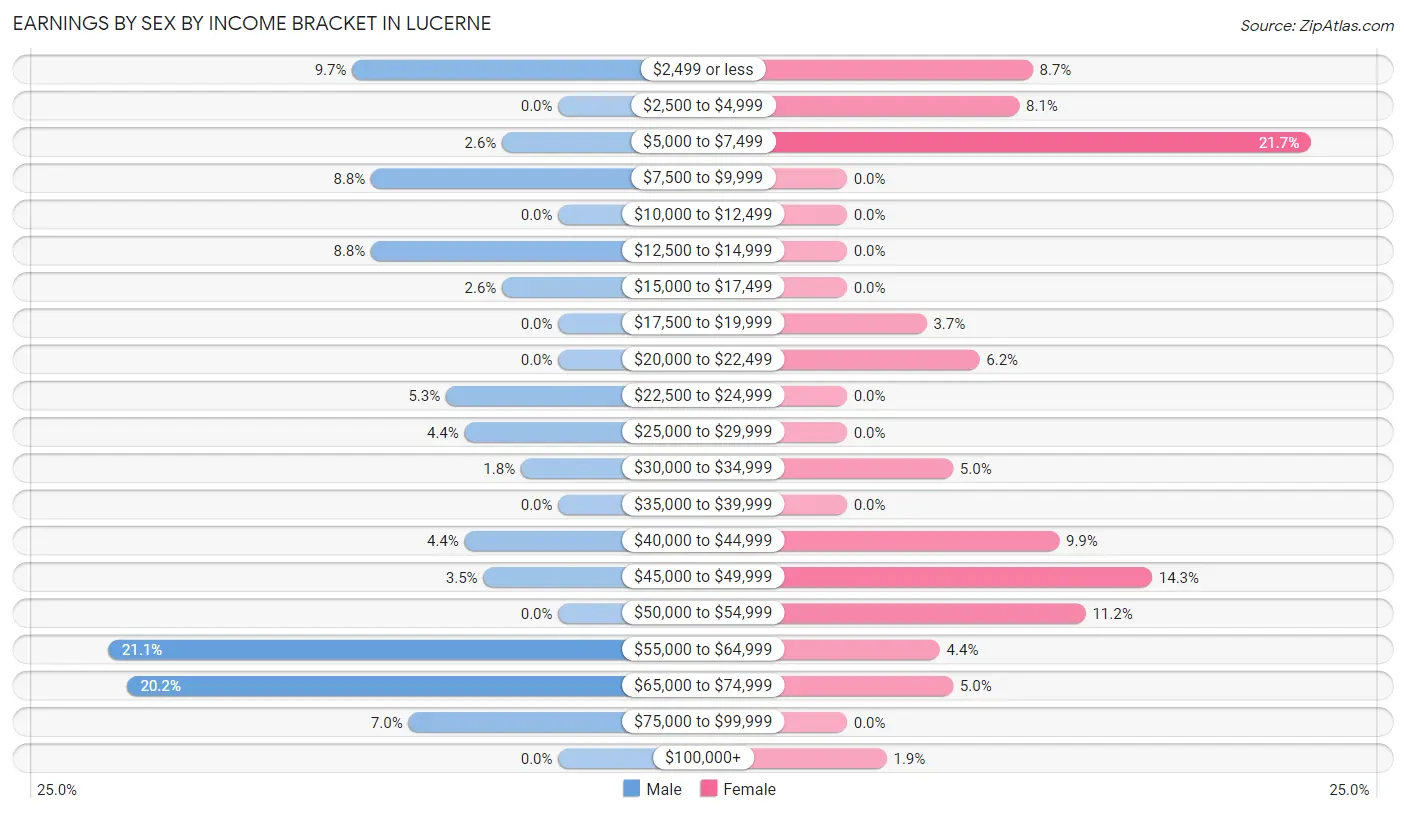
Earnings by Sex by Income Bracket in Lucerne
The most common earnings brackets in Lucerne are $55,000 to $64,999 for men (24 | 21.0%) and $5,000 to $7,499 for women (35 | 21.7%).
| Income | Male | Female |
| $2,499 or less | 11 (9.7%) | 14 (8.7%) |
| $2,500 to $4,999 | 0 (0.0%) | 13 (8.1%) |
| $5,000 to $7,499 | 3 (2.6%) | 35 (21.7%) |
| $7,500 to $9,999 | 10 (8.8%) | 0 (0.0%) |
| $10,000 to $12,499 | 0 (0.0%) | 0 (0.0%) |
| $12,500 to $14,999 | 10 (8.8%) | 0 (0.0%) |
| $15,000 to $17,499 | 3 (2.6%) | 0 (0.0%) |
| $17,500 to $19,999 | 0 (0.0%) | 6 (3.7%) |
| $20,000 to $22,499 | 0 (0.0%) | 10 (6.2%) |
| $22,500 to $24,999 | 6 (5.3%) | 0 (0.0%) |
| $25,000 to $29,999 | 5 (4.4%) | 0 (0.0%) |
| $30,000 to $34,999 | 2 (1.8%) | 8 (5.0%) |
| $35,000 to $39,999 | 0 (0.0%) | 0 (0.0%) |
| $40,000 to $44,999 | 5 (4.4%) | 16 (9.9%) |
| $45,000 to $49,999 | 4 (3.5%) | 23 (14.3%) |
| $50,000 to $54,999 | 0 (0.0%) | 18 (11.2%) |
| $55,000 to $64,999 | 24 (21.0%) | 7 (4.3%) |
| $65,000 to $74,999 | 23 (20.2%) | 8 (5.0%) |
| $75,000 to $99,999 | 8 (7.0%) | 0 (0.0%) |
| $100,000+ | 0 (0.0%) | 3 (1.9%) |
| Total | 114 (100.0%) | 161 (100.0%) |
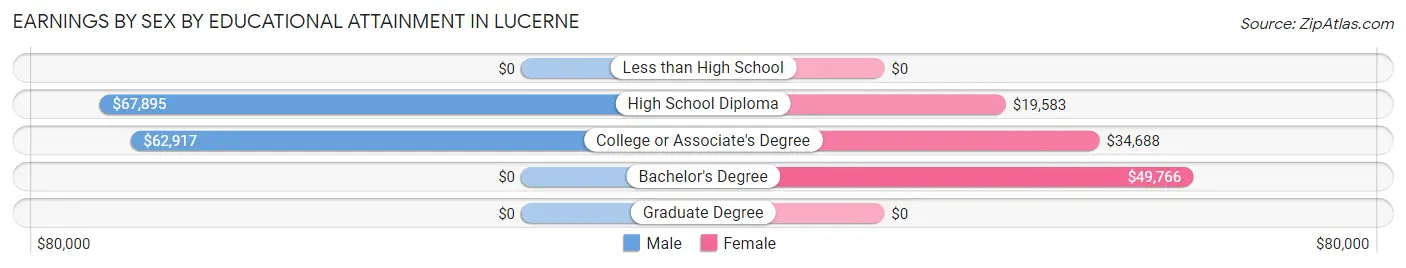
Earnings by Sex by Educational Attainment in Lucerne
Average earnings in Lucerne are $62,917 for men and $41,786 for women, a difference of 33.6%. Men with an educational attainment of high school diploma enjoy the highest average annual earnings of $67,895, while those with college or associate's degree education earn the least with $62,917. Women with an educational attainment of bachelor's degree earn the most with the average annual earnings of $49,766, while those with high school diploma education have the smallest earnings of $19,583.
| Educational Attainment | Male Income | Female Income |
| Less than High School | - | - |
| High School Diploma | $67,895 | $19,583 |
| College or Associate's Degree | $62,917 | $34,688 |
| Bachelor's Degree | - | - |
| Graduate Degree | - | - |
| Total | $62,917 | $41,786 |
Family Income in Lucerne
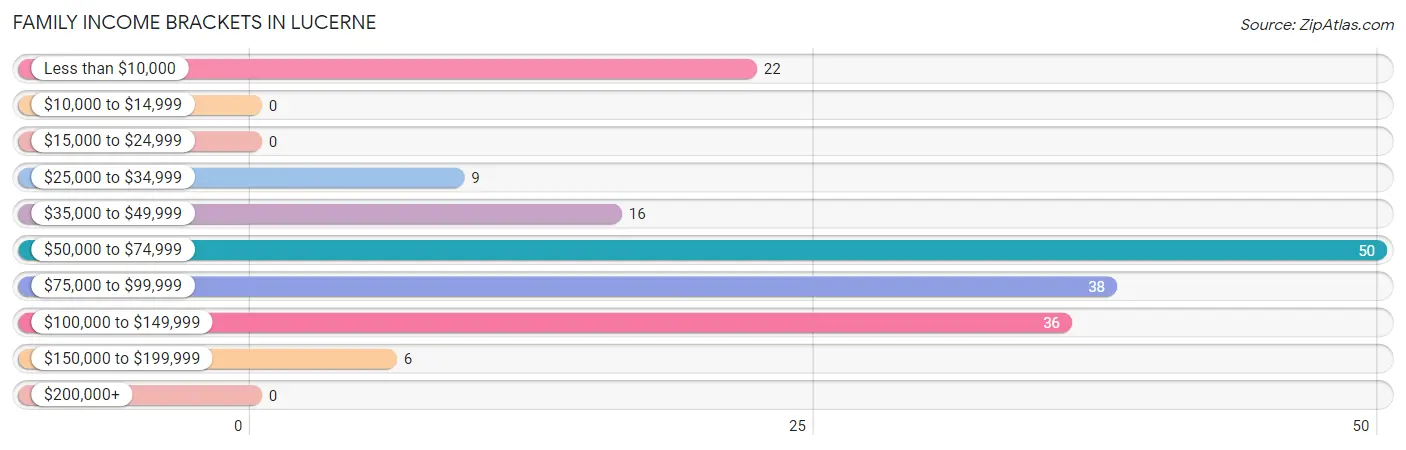
Family Income Brackets in Lucerne
According to the Lucerne family income data, there are 50 families falling into the $50,000 to $74,999 income range, which is the most common income bracket and makes up 28.2% of all families.
| Income Bracket | # Families | % Families |
| Less than $10,000 | 22 | 12.4% |
| $10,000 to $14,999 | 0 | 0.0% |
| $15,000 to $24,999 | 0 | 0.0% |
| $25,000 to $34,999 | 9 | 5.1% |
| $35,000 to $49,999 | 16 | 9.0% |
| $50,000 to $74,999 | 50 | 28.2% |
| $75,000 to $99,999 | 38 | 21.5% |
| $100,000 to $149,999 | 36 | 20.3% |
| $150,000 to $199,999 | 6 | 3.4% |
| $200,000+ | 0 | 0.0% |
Family Income by Famaliy Size in Lucerne
4-person families (40 | 22.6%) account for the highest median family income in Lucerne with $91,458 per family, while 2-person families (110 | 62.2%) have the highest median income of $31,042 per family member.
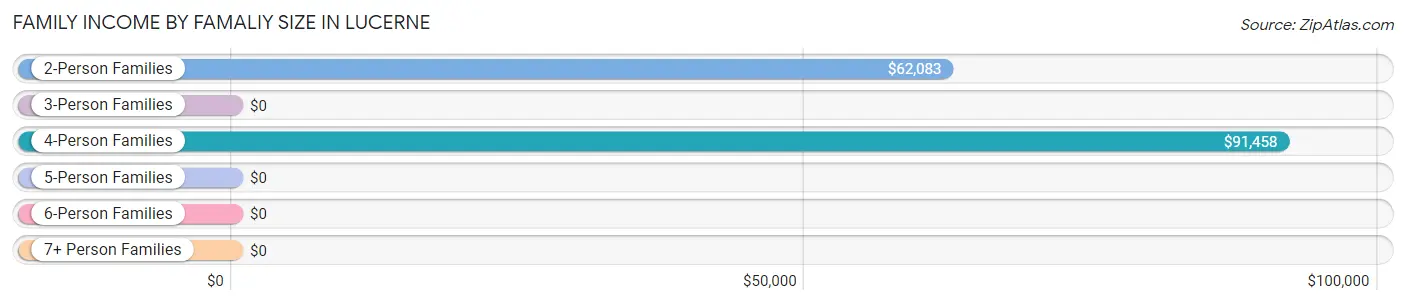
| Income Bracket | # Families | Median Income |
| 2-Person Families | 110 (62.2%) | $62,083 |
| 3-Person Families | 9 (5.1%) | $0 |
| 4-Person Families | 40 (22.6%) | $91,458 |
| 5-Person Families | 0 (0.0%) | $0 |
| 6-Person Families | 18 (10.2%) | $0 |
| 7+ Person Families | 0 (0.0%) | $0 |
| Total | 177 (100.0%) | $74,183 |
Family Income by Number of Earners in Lucerne
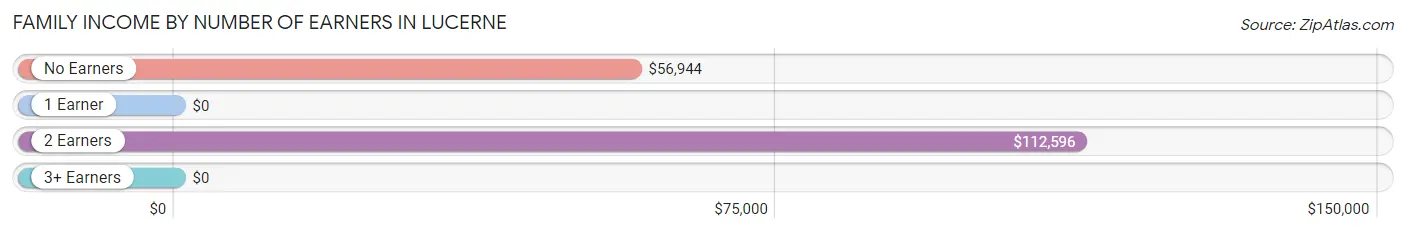
| Number of Earners | # Families | Median Income |
| No Earners | 16 (9.0%) | $56,944 |
| 1 Earner | 73 (41.2%) | $0 |
| 2 Earners | 83 (46.9%) | $112,596 |
| 3+ Earners | 5 (2.8%) | $0 |
| Total | 177 (100.0%) | $74,183 |
Household Income in Lucerne
Household Income Brackets in Lucerne
With 65 households falling in the category, the $50,000 to $74,999 income range is the most frequent in Lucerne, accounting for 33.9% of all households.
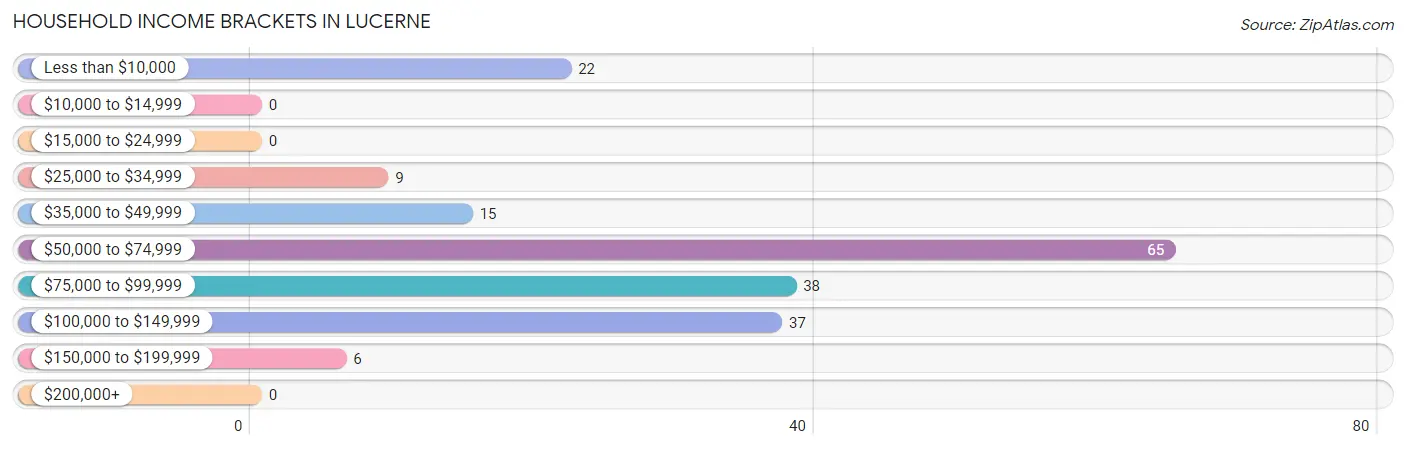
| Income Bracket | # Households | % Households |
| Less than $10,000 | 22 | 11.5% |
| $10,000 to $14,999 | 0 | 0.0% |
| $15,000 to $24,999 | 0 | 0.0% |
| $25,000 to $34,999 | 9 | 4.7% |
| $35,000 to $49,999 | 15 | 7.8% |
| $50,000 to $74,999 | 65 | 33.9% |
| $75,000 to $99,999 | 38 | 19.8% |
| $100,000 to $149,999 | 37 | 19.3% |
| $150,000 to $199,999 | 6 | 3.1% |
| $200,000+ | 0 | 0.0% |
Household Income by Householder Age in Lucerne
The median household income in Lucerne is $73,558, with the highest median household income of $113,036 found in the 25 to 44 years age bracket for the primary householder. A total of 53 households (27.6%) fall into this category. Meanwhile, the 15 to 24 years age bracket for the primary householder has the lowest median household income of $0, with 21 households (10.9%) in this group.
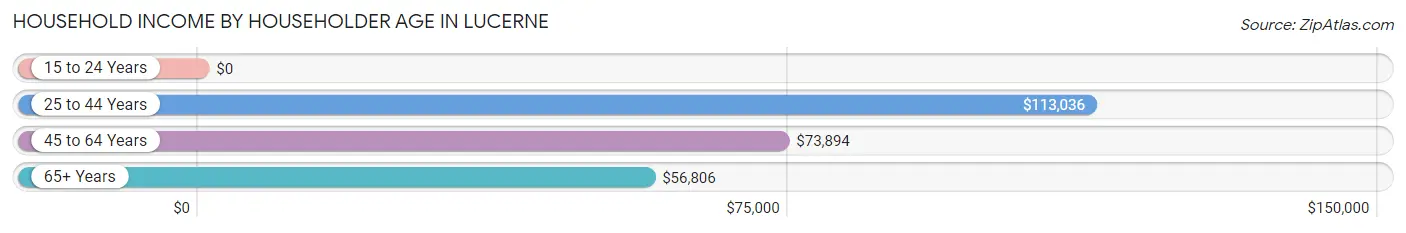
| Income Bracket | # Households | Median Income |
| 15 to 24 Years | 21 (10.9%) | $0 |
| 25 to 44 Years | 53 (27.6%) | $113,036 |
| 45 to 64 Years | 57 (29.7%) | $73,894 |
| 65+ Years | 61 (31.8%) | $56,806 |
| Total | 192 (100.0%) | $73,558 |
Poverty in Lucerne
Income Below Poverty by Sex and Age in Lucerne
With 3.0% poverty level for males and 18.5% for females among the residents of Lucerne, 25 to 34 year old males and 5 year old females are the most vulnerable to poverty, with 6 males (66.7%) and 2 females (100.0%) in their respective age groups living below the poverty level.
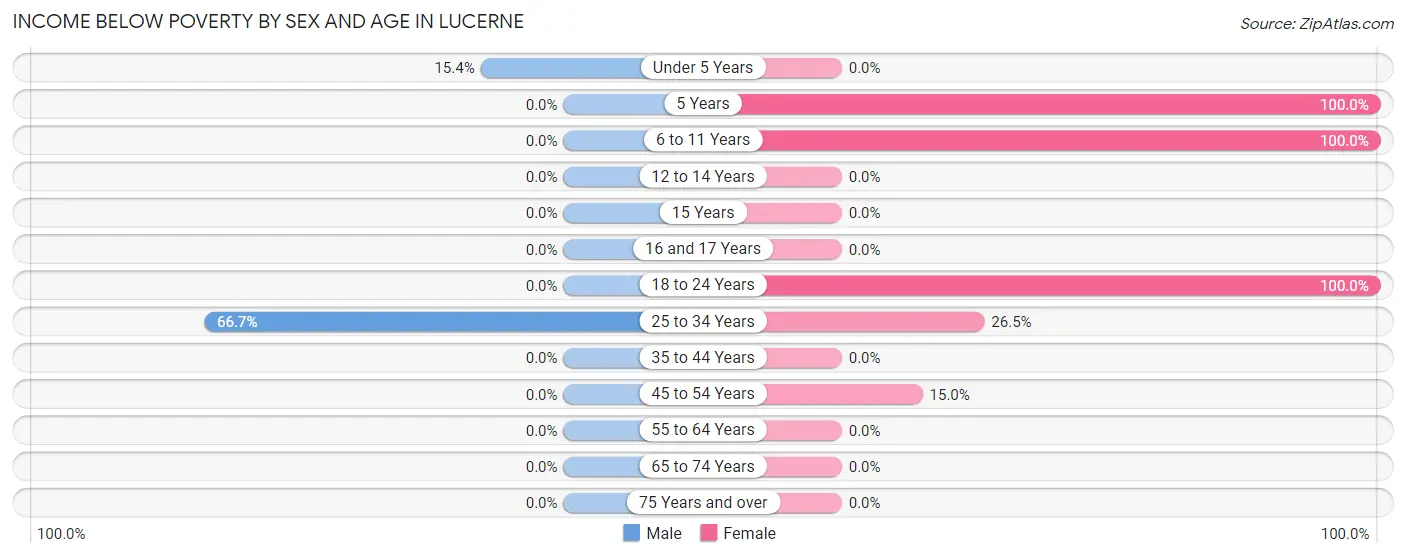
| Age Bracket | Male | Female |
| Under 5 Years | 2 (15.4%) | 0 (0.0%) |
| 5 Years | 0 (0.0%) | 2 (100.0%) |
| 6 to 11 Years | 0 (0.0%) | 2 (100.0%) |
| 12 to 14 Years | 0 (0.0%) | 0 (0.0%) |
| 15 Years | 0 (0.0%) | 0 (0.0%) |
| 16 and 17 Years | 0 (0.0%) | 0 (0.0%) |
| 18 to 24 Years | 0 (0.0%) | 34 (100.0%) |
| 25 to 34 Years | 6 (66.7%) | 9 (26.5%) |
| 35 to 44 Years | 0 (0.0%) | 0 (0.0%) |
| 45 to 54 Years | 0 (0.0%) | 9 (15.0%) |
| 55 to 64 Years | 0 (0.0%) | 0 (0.0%) |
| 65 to 74 Years | 0 (0.0%) | 0 (0.0%) |
| 75 Years and over | 0 (0.0%) | 0 (0.0%) |
| Total | 8 (3.0%) | 56 (18.5%) |
Income Above Poverty by Sex and Age in Lucerne
According to the poverty statistics in Lucerne, males aged 6 to 11 years and females aged under 5 years are the age groups that are most secure financially, with 100.0% of males and 100.0% of females in these age groups living above the poverty line.
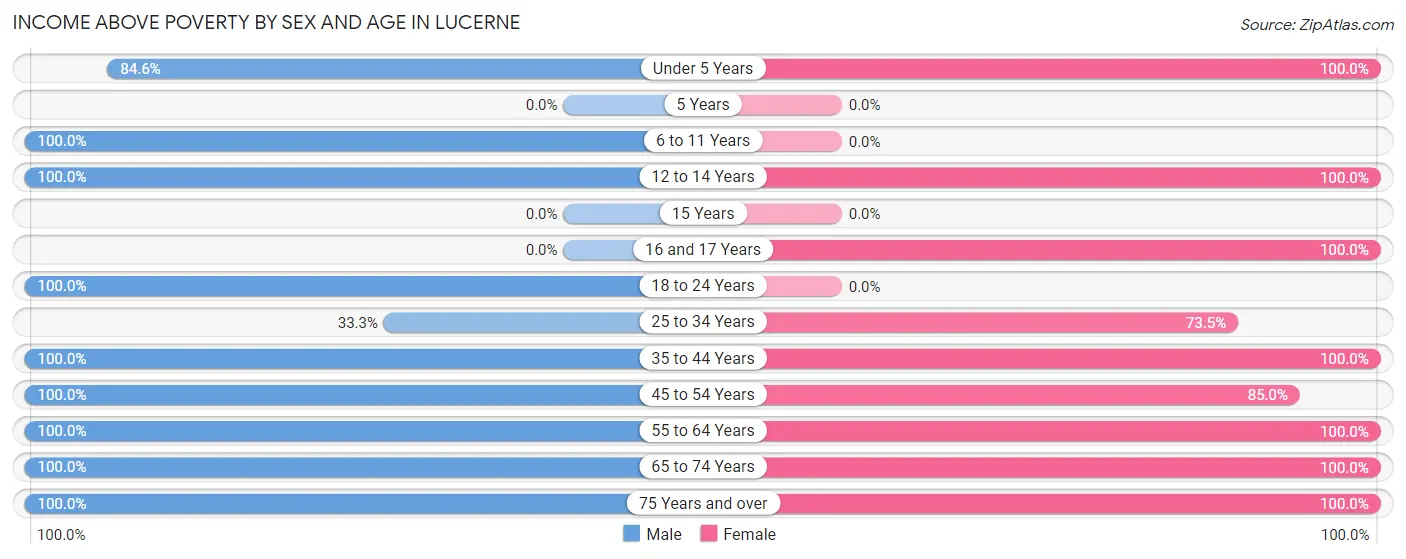
| Age Bracket | Male | Female |
| Under 5 Years | 11 (84.6%) | 48 (100.0%) |
| 5 Years | 0 (0.0%) | 0 (0.0%) |
| 6 to 11 Years | 48 (100.0%) | 0 (0.0%) |
| 12 to 14 Years | 42 (100.0%) | 5 (100.0%) |
| 15 Years | 0 (0.0%) | 0 (0.0%) |
| 16 and 17 Years | 0 (0.0%) | 20 (100.0%) |
| 18 to 24 Years | 12 (100.0%) | 0 (0.0%) |
| 25 to 34 Years | 3 (33.3%) | 25 (73.5%) |
| 35 to 44 Years | 32 (100.0%) | 28 (100.0%) |
| 45 to 54 Years | 34 (100.0%) | 51 (85.0%) |
| 55 to 64 Years | 13 (100.0%) | 23 (100.0%) |
| 65 to 74 Years | 48 (100.0%) | 31 (100.0%) |
| 75 Years and over | 12 (100.0%) | 16 (100.0%) |
| Total | 255 (97.0%) | 247 (81.5%) |
Income Below Poverty Among Married-Couple Families in Lucerne
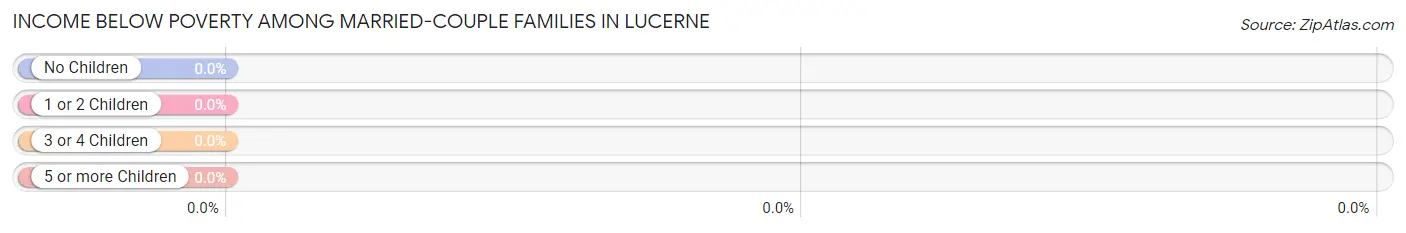
| Children | Above Poverty | Below Poverty |
| No Children | 85 (100.0%) | 0 (0.0%) |
| 1 or 2 Children | 34 (100.0%) | 0 (0.0%) |
| 3 or 4 Children | 18 (100.0%) | 0 (0.0%) |
| 5 or more Children | 0 (0.0%) | 0 (0.0%) |
| Total | 137 (100.0%) | 0 (0.0%) |
Income Below Poverty Among Single-Parent Households in Lucerne
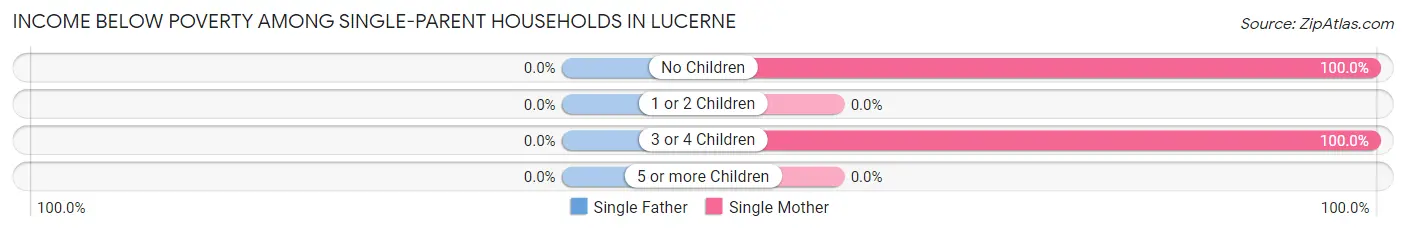
| Children | Single Father | Single Mother |
| No Children | 0 (0.0%) | 21 (100.0%) |
| 1 or 2 Children | 0 (0.0%) | 0 (0.0%) |
| 3 or 4 Children | 0 (0.0%) | 1 (100.0%) |
| 5 or more Children | 0 (0.0%) | 0 (0.0%) |
| Total | 0 (0.0%) | 22 (55.0%) |
Income Below Poverty Among Married-Couple vs Single-Parent Households in Lucerne
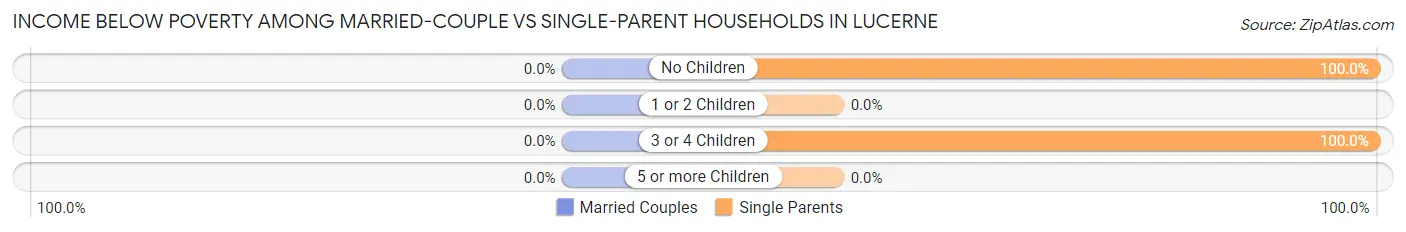
| Children | Married-Couple Families | Single-Parent Households |
| No Children | 0 (0.0%) | 21 (100.0%) |
| 1 or 2 Children | 0 (0.0%) | 0 (0.0%) |
| 3 or 4 Children | 0 (0.0%) | 1 (100.0%) |
| 5 or more Children | 0 (0.0%) | 0 (0.0%) |
| Total | 0 (0.0%) | 22 (55.0%) |
Race in Lucerne
The most populous races in Lucerne are White / Caucasian (539 | 90.4%), Native / Alaskan (53 | 8.9%), and Hispanic or Latino (10 | 1.7%).
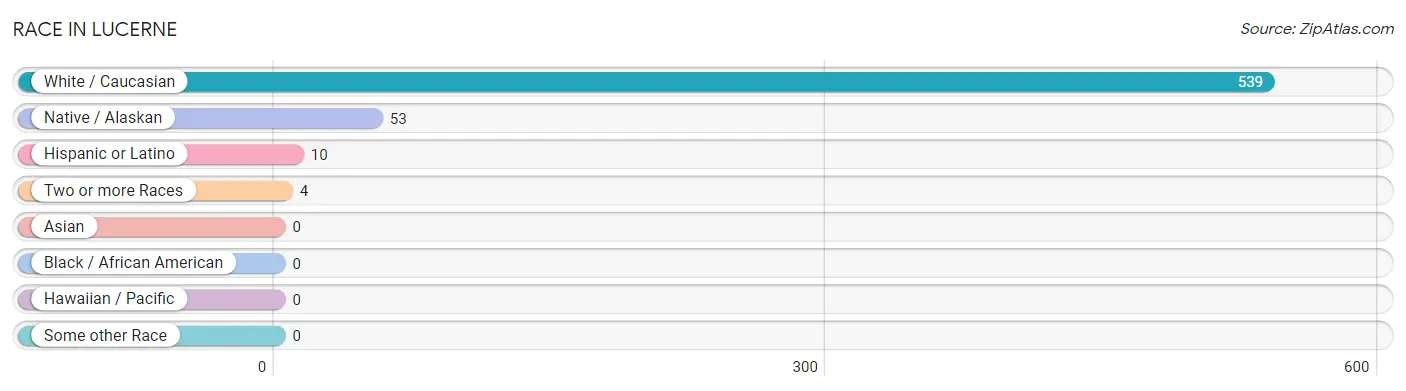
| Race | # Population | % Population |
| Asian | 0 | 0.0% |
| Black / African American | 0 | 0.0% |
| Hawaiian / Pacific | 0 | 0.0% |
| Hispanic or Latino | 10 | 1.7% |
| Native / Alaskan | 53 | 8.9% |
| White / Caucasian | 539 | 90.4% |
| Two or more Races | 4 | 0.7% |
| Some other Race | 0 | 0.0% |
| Total | 596 | 100.0% |
Ancestry in Lucerne
The most populous ancestries reported in Lucerne are English (216 | 36.2%), German (184 | 30.9%), Irish (138 | 23.2%), Arapaho (53 | 8.9%), and American (44 | 7.4%), together accounting for 106.5% of all Lucerne residents.
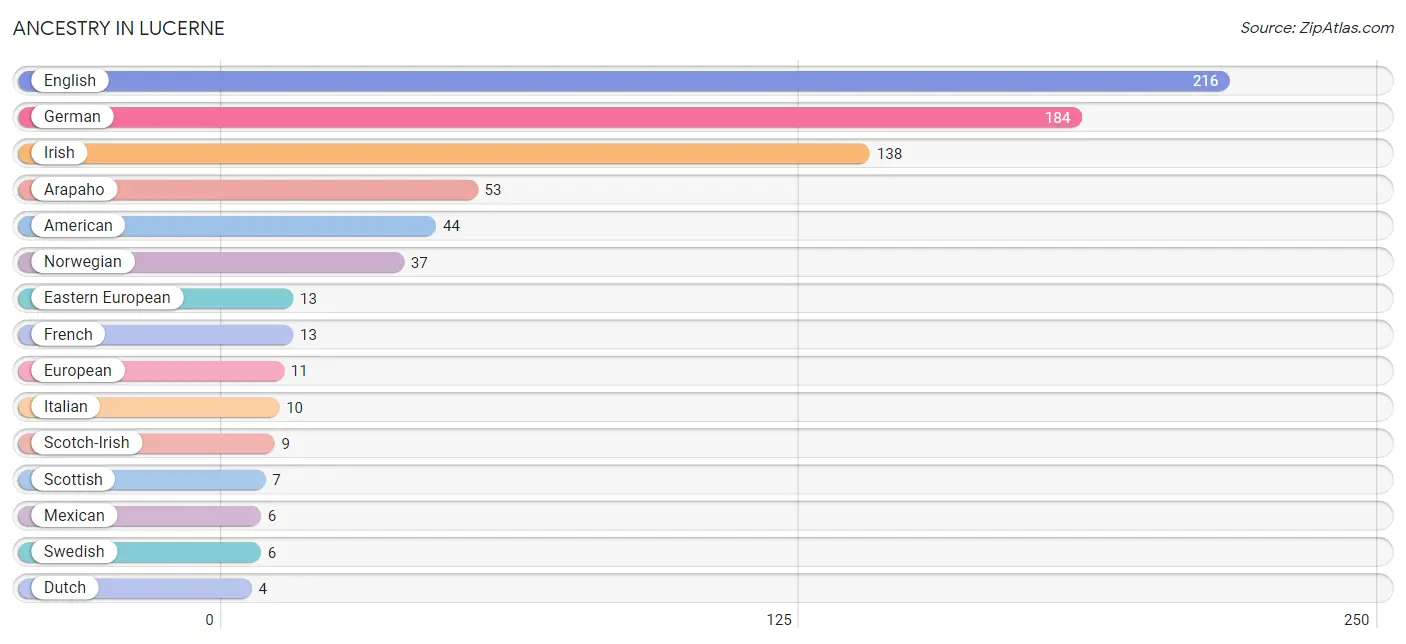
| Ancestry | # Population | % Population |
| American | 44 | 7.4% |
| Arapaho | 53 | 8.9% |
| Danish | 3 | 0.5% |
| Dutch | 4 | 0.7% |
| Eastern European | 13 | 2.2% |
| English | 216 | 36.2% |
| European | 11 | 1.8% |
| French | 13 | 2.2% |
| German | 184 | 30.9% |
| Irish | 138 | 23.2% |
| Italian | 10 | 1.7% |
| Mexican | 6 | 1.0% |
| Norwegian | 37 | 6.2% |
| Peruvian | 4 | 0.7% |
| Polish | 3 | 0.5% |
| Scotch-Irish | 9 | 1.5% |
| Scottish | 7 | 1.2% |
| South American | 4 | 0.7% |
| Swedish | 6 | 1.0% |
| Welsh | 3 | 0.5% | View All 20 Rows |
Immigrants in Lucerne
The most numerous immigrant groups reported in Lucerne came from Latin America (4 | 0.7%), Peru (4 | 0.7%), and South America (4 | 0.7%), together accounting for 2.0% of all Lucerne residents.
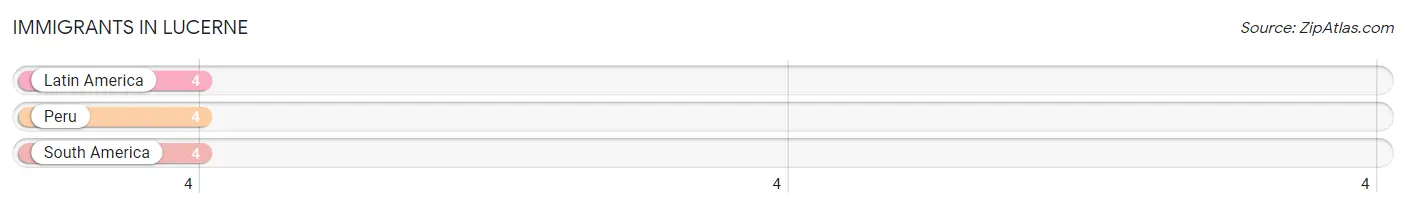
| Immigration Origin | # Population | % Population |
| Latin America | 4 | 0.7% |
| Peru | 4 | 0.7% |
| South America | 4 | 0.7% | View All 3 Rows |
Sex and Age in Lucerne
Sex and Age in Lucerne
The most populous age groups in Lucerne are 10 to 14 Years (80 | 28.3%) for men and Under 5 Years (58 | 18.5%) for women.
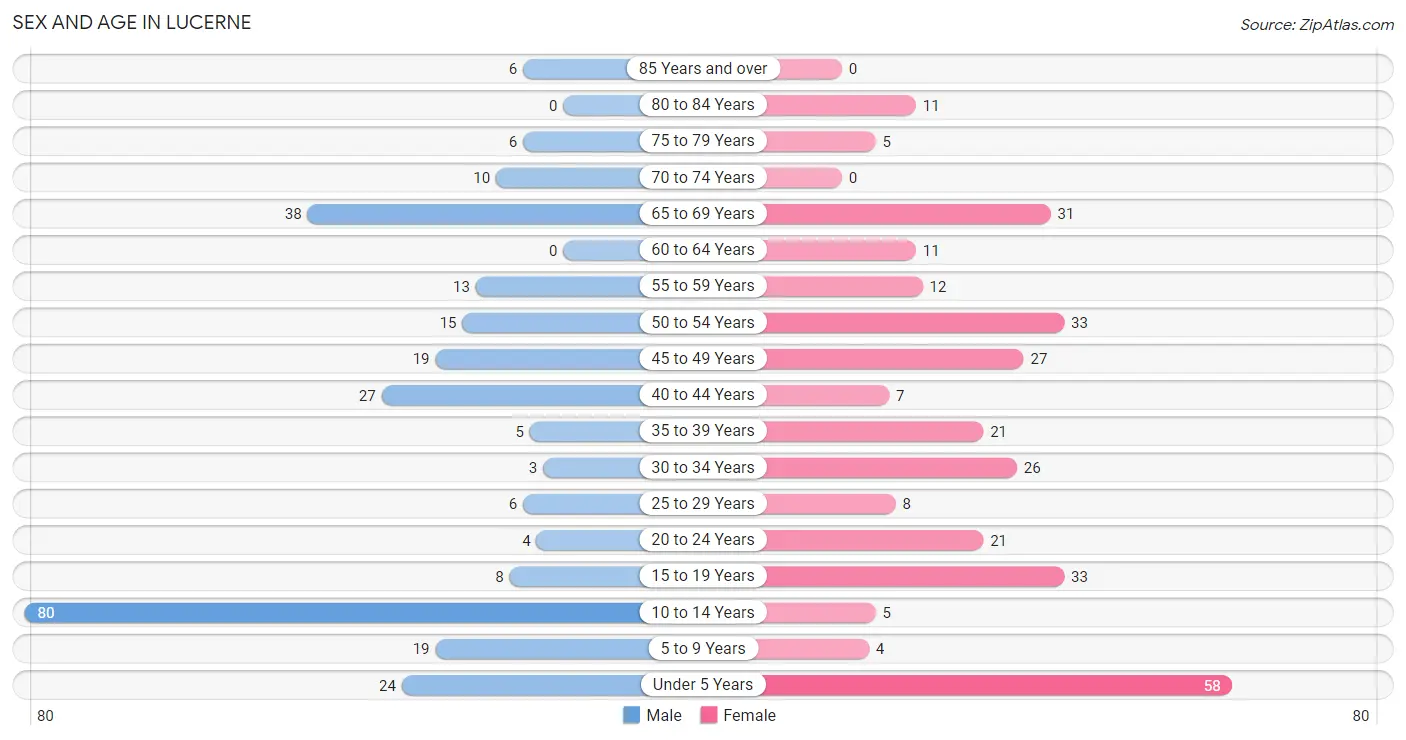
| Age Bracket | Male | Female |
| Under 5 Years | 24 (8.5%) | 58 (18.5%) |
| 5 to 9 Years | 19 (6.7%) | 4 (1.3%) |
| 10 to 14 Years | 80 (28.3%) | 5 (1.6%) |
| 15 to 19 Years | 8 (2.8%) | 33 (10.5%) |
| 20 to 24 Years | 4 (1.4%) | 21 (6.7%) |
| 25 to 29 Years | 6 (2.1%) | 8 (2.6%) |
| 30 to 34 Years | 3 (1.1%) | 26 (8.3%) |
| 35 to 39 Years | 5 (1.8%) | 21 (6.7%) |
| 40 to 44 Years | 27 (9.5%) | 7 (2.2%) |
| 45 to 49 Years | 19 (6.7%) | 27 (8.6%) |
| 50 to 54 Years | 15 (5.3%) | 33 (10.5%) |
| 55 to 59 Years | 13 (4.6%) | 12 (3.8%) |
| 60 to 64 Years | 0 (0.0%) | 11 (3.5%) |
| 65 to 69 Years | 38 (13.4%) | 31 (9.9%) |
| 70 to 74 Years | 10 (3.5%) | 0 (0.0%) |
| 75 to 79 Years | 6 (2.1%) | 5 (1.6%) |
| 80 to 84 Years | 0 (0.0%) | 11 (3.5%) |
| 85 Years and over | 6 (2.1%) | 0 (0.0%) |
| Total | 283 (100.0%) | 313 (100.0%) |
Families and Households in Lucerne
Median Family Size in Lucerne
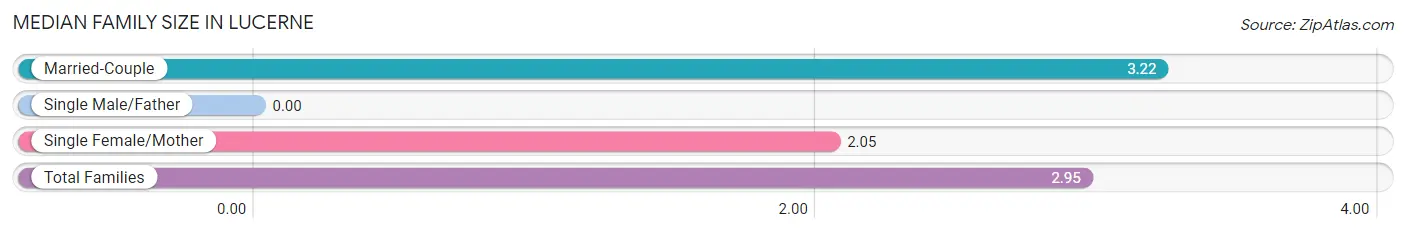
| Family Type | # Families | Family Size |
| Married-Couple | 137 (77.4%) | 3.22 |
| Single Male/Father | 0 (0.0%) | - |
| Single Female/Mother | 40 (22.6%) | 2.05 |
| Total Families | 177 (100.0%) | 2.95 |
Median Household Size in Lucerne
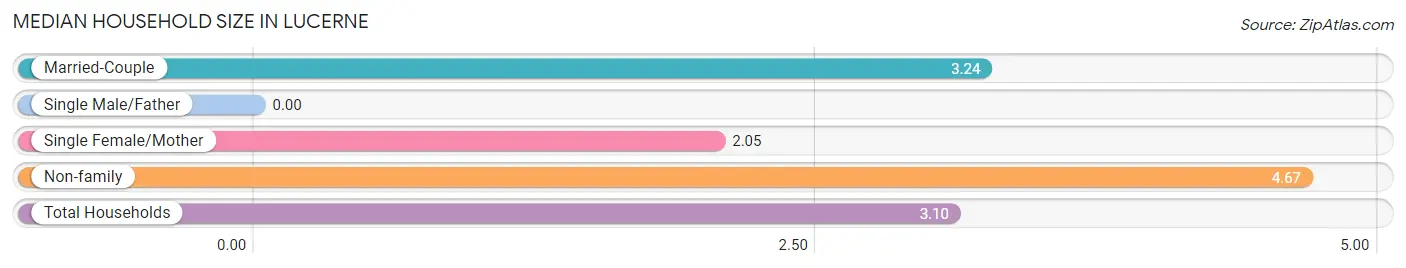
| Household Type | # Households | Household Size |
| Married-Couple | 137 (71.4%) | 3.24 |
| Single Male/Father | 0 (0.0%) | - |
| Single Female/Mother | 40 (20.8%) | 2.05 |
| Non-family | 15 (7.8%) | 4.67 |
| Total Households | 192 (100.0%) | 3.10 |
Household Size by Marriage Status in Lucerne
Out of a total of 192 households in Lucerne, 177 (92.2%) are family households, while 15 (7.8%) are nonfamily households. The most numerous type of family households are 2-person households, comprising 110, and the most common type of nonfamily households are 1-person households, comprising 9.
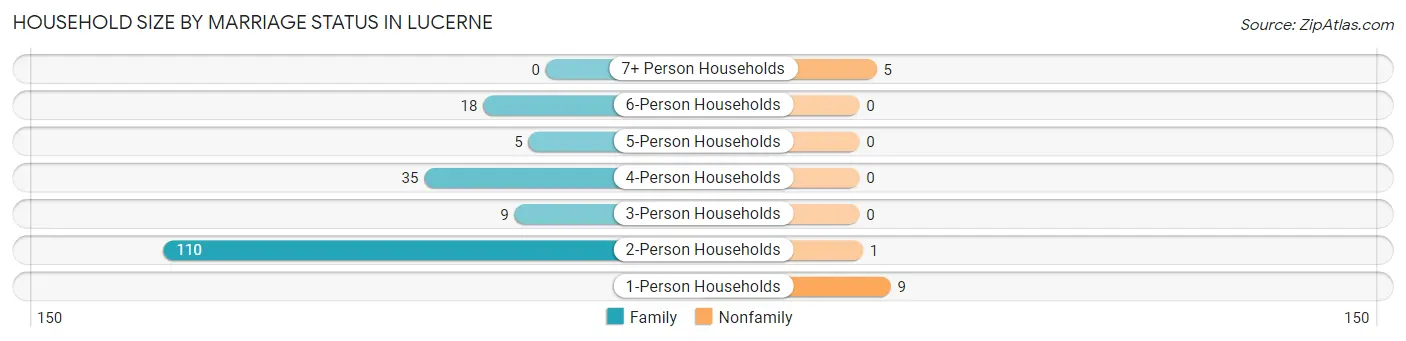
| Household Size | Family Households | Nonfamily Households |
| 1-Person Households | - | 9 (4.7%) |
| 2-Person Households | 110 (57.3%) | 1 (0.5%) |
| 3-Person Households | 9 (4.7%) | 0 (0.0%) |
| 4-Person Households | 35 (18.2%) | 0 (0.0%) |
| 5-Person Households | 5 (2.6%) | 0 (0.0%) |
| 6-Person Households | 18 (9.4%) | 0 (0.0%) |
| 7+ Person Households | 0 (0.0%) | 5 (2.6%) |
| Total | 177 (92.2%) | 15 (7.8%) |
Female Fertility in Lucerne
Fertility by Age in Lucerne
| Age Bracket | Women with Births | Births / 1,000 Women |
| 15 to 19 years | 0 (0.0%) | 0.0 |
| 20 to 34 years | 0 (0.0%) | 0.0 |
| 35 to 50 years | 0 (0.0%) | 0.0 |
| Total | 0 (0.0%) | 0.0 |
Fertility by Age by Marriage Status in Lucerne
| Age Bracket | Married | Unmarried |
| 15 to 19 years | 0 (0.0%) | 0 (0.0%) |
| 20 to 34 years | 0 (0.0%) | 0 (0.0%) |
| 35 to 50 years | 0 (0.0%) | 0 (0.0%) |
| Total | 0 (0.0%) | 0 (0.0%) |
Fertility by Education in Lucerne
| Educational Attainment | Women with Births | Births / 1,000 Women |
| Less than High School | 0 (0.0%) | 0.0 |
| High School Diploma | 0 (0.0%) | 0.0 |
| College or Associate's Degree | 0 (0.0%) | 0.0 |
| Bachelor's Degree | 0 (0.0%) | 0.0 |
| Graduate Degree | 0 (0.0%) | 0.0 |
| Total | 0 (0.0%) | 0.0 |
Fertility by Education by Marriage Status in Lucerne
| Educational Attainment | Married | Unmarried |
| Less than High School | 0 (0.0%) | 0 (0.0%) |
| High School Diploma | 0 (0.0%) | 0 (0.0%) |
| College or Associate's Degree | 0 (0.0%) | 0 (0.0%) |
| Bachelor's Degree | 0 (0.0%) | 0 (0.0%) |
| Graduate Degree | 0 (0.0%) | 0 (0.0%) |
| Total | 0 (0.0%) | 0 (0.0%) |
Employment Characteristics in Lucerne
Employment by Class of Employer in Lucerne
Among the 198 employed individuals in Lucerne, state government employees (62 | 31.3%), private company employees (48 | 24.2%), and self-employed (not incorporated) (37 | 18.7%) make up the most common classes of employment.
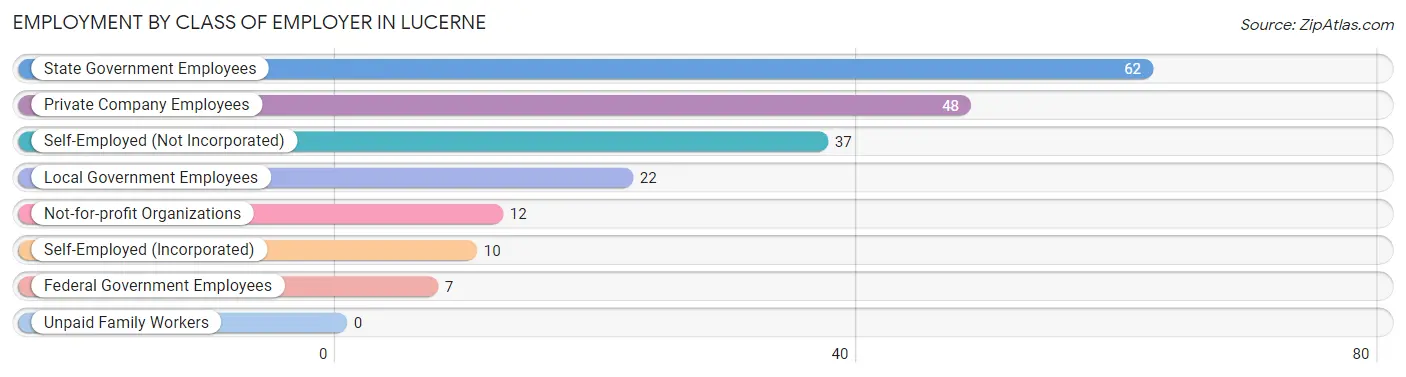
| Employer Class | # Employees | % Employees |
| Private Company Employees | 48 | 24.2% |
| Self-Employed (Incorporated) | 10 | 5.1% |
| Self-Employed (Not Incorporated) | 37 | 18.7% |
| Not-for-profit Organizations | 12 | 6.1% |
| Local Government Employees | 22 | 11.1% |
| State Government Employees | 62 | 31.3% |
| Federal Government Employees | 7 | 3.5% |
| Unpaid Family Workers | 0 | 0.0% |
| Total | 198 | 100.0% |
Employment Status by Age in Lucerne
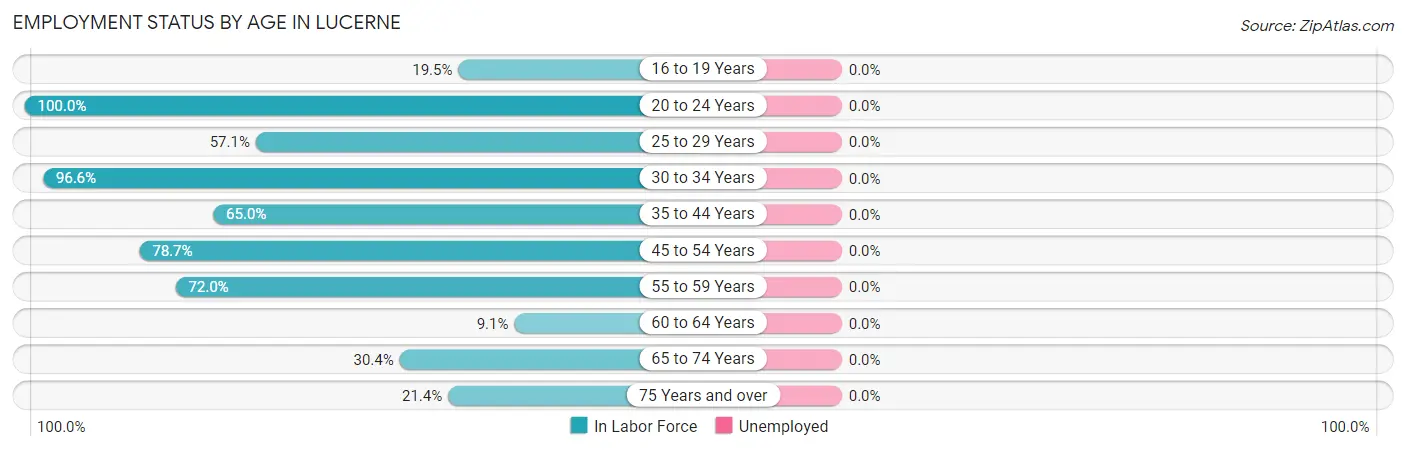
| Age Bracket | In Labor Force | Unemployed |
| 16 to 19 Years | 8 (19.5%) | 0 (0.0%) |
| 20 to 24 Years | 25 (100.0%) | 0 (0.0%) |
| 25 to 29 Years | 8 (57.1%) | 0 (0.0%) |
| 30 to 34 Years | 28 (96.6%) | 0 (0.0%) |
| 35 to 44 Years | 39 (65.0%) | 0 (0.0%) |
| 45 to 54 Years | 74 (78.7%) | 0 (0.0%) |
| 55 to 59 Years | 18 (72.0%) | 0 (0.0%) |
| 60 to 64 Years | 1 (9.1%) | 0 (0.0%) |
| 65 to 74 Years | 24 (30.4%) | 0 (0.0%) |
| 75 Years and over | 6 (21.4%) | 0 (0.0%) |
| Total | 231 (56.9%) | 0 (0.0%) |
Employment Status by Educational Attainment in Lucerne
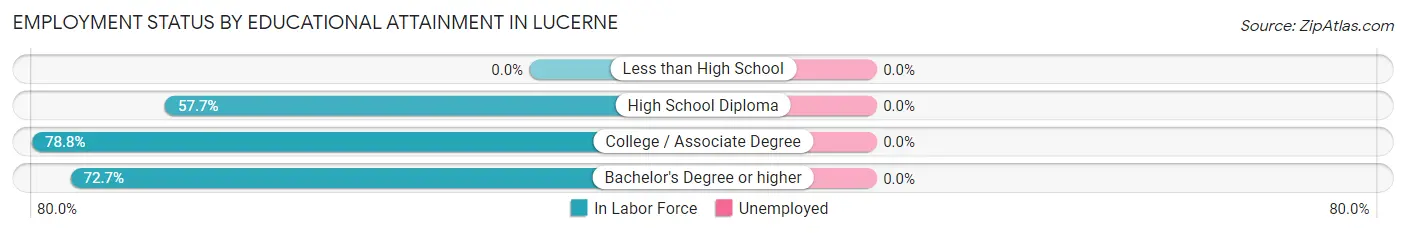
| Educational Attainment | In Labor Force | Unemployed |
| Less than High School | 0 (0.0%) | 0 (0.0%) |
| High School Diploma | 30 (57.7%) | 0 (0.0%) |
| College / Associate Degree | 82 (78.8%) | 0 (0.0%) |
| Bachelor's Degree or higher | 56 (72.7%) | 0 (0.0%) |
| Total | 168 (72.1%) | 0 (0.0%) |
Employment Occupations by Sex in Lucerne
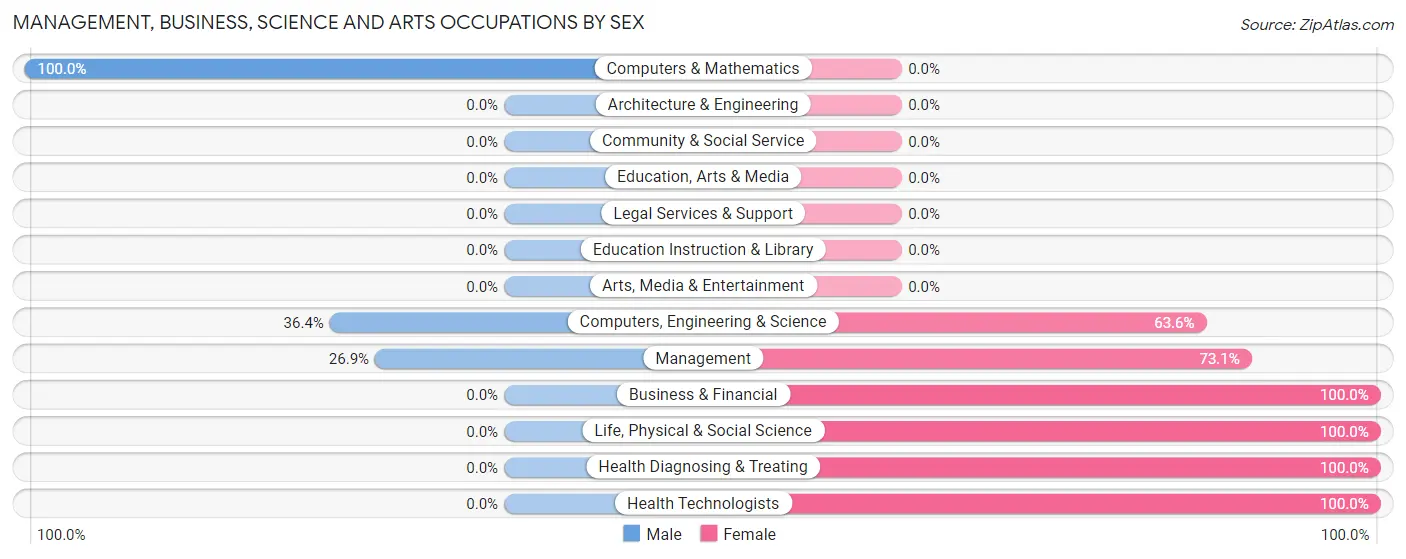
Management, Business, Science and Arts Occupations
The most common Management, Business, Science and Arts occupations in Lucerne are Management (52 | 22.5%), Computers, Engineering & Science (11 | 4.8%), Business & Financial (7 | 3.0%), Life, Physical & Social Science (7 | 3.0%), and Health Diagnosing & Treating (7 | 3.0%).
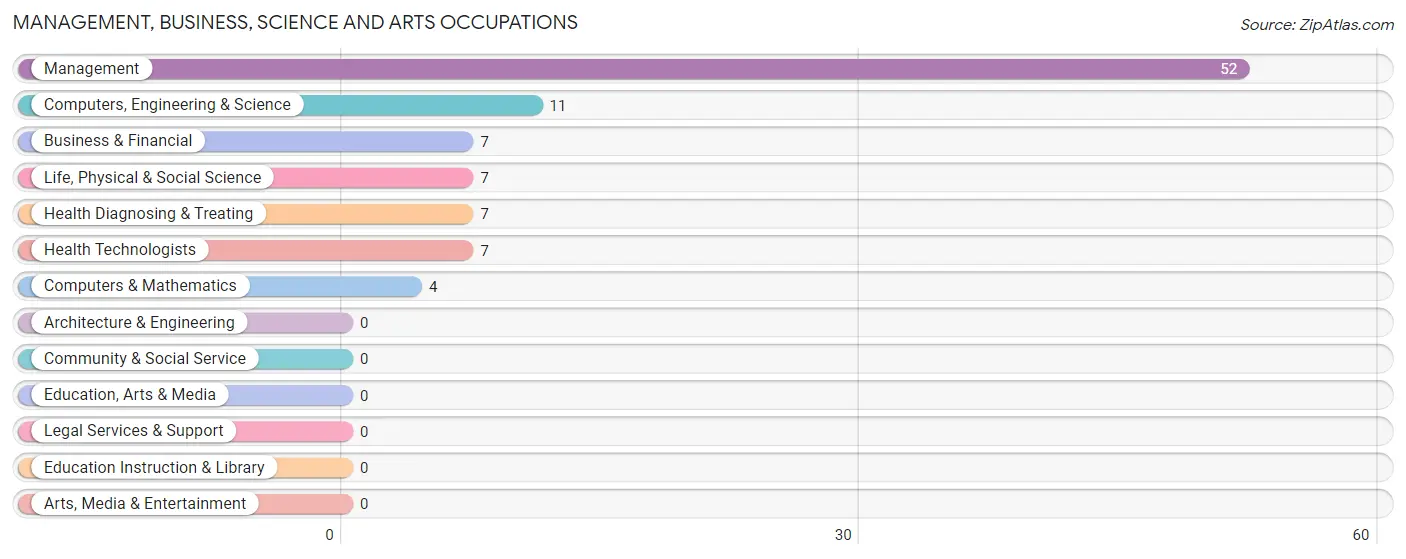
Management, Business, Science and Arts Occupations by Sex
Within the Management, Business, Science and Arts occupations in Lucerne, the most male-oriented occupations are Computers & Mathematics (100.0%), Computers, Engineering & Science (36.4%), and Management (26.9%), while the most female-oriented occupations are Business & Financial (100.0%), Life, Physical & Social Science (100.0%), and Health Diagnosing & Treating (100.0%).
| Occupation | Male | Female |
| Management | 14 (26.9%) | 38 (73.1%) |
| Business & Financial | 0 (0.0%) | 7 (100.0%) |
| Computers, Engineering & Science | 4 (36.4%) | 7 (63.6%) |
| Computers & Mathematics | 4 (100.0%) | 0 (0.0%) |
| Architecture & Engineering | 0 (0.0%) | 0 (0.0%) |
| Life, Physical & Social Science | 0 (0.0%) | 7 (100.0%) |
| Community & Social Service | 0 (0.0%) | 0 (0.0%) |
| Education, Arts & Media | 0 (0.0%) | 0 (0.0%) |
| Legal Services & Support | 0 (0.0%) | 0 (0.0%) |
| Education Instruction & Library | 0 (0.0%) | 0 (0.0%) |
| Arts, Media & Entertainment | 0 (0.0%) | 0 (0.0%) |
| Health Diagnosing & Treating | 0 (0.0%) | 7 (100.0%) |
| Health Technologists | 0 (0.0%) | 7 (100.0%) |
| Total (Category) | 18 (23.4%) | 59 (76.6%) |
| Total (Overall) | 108 (46.8%) | 123 (53.2%) |
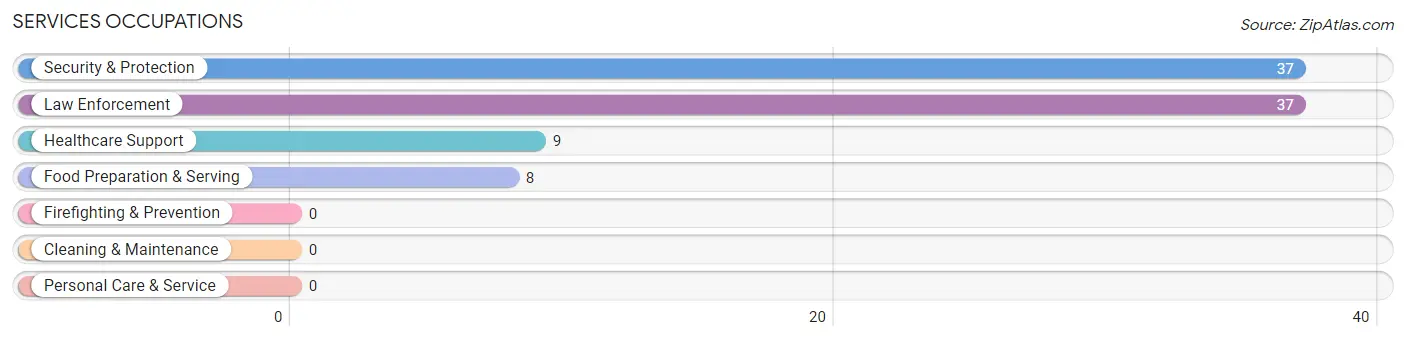
Services Occupations
The most common Services occupations in Lucerne are Security & Protection (37 | 16.0%), Law Enforcement (37 | 16.0%), Healthcare Support (9 | 3.9%), and Food Preparation & Serving (8 | 3.5%).
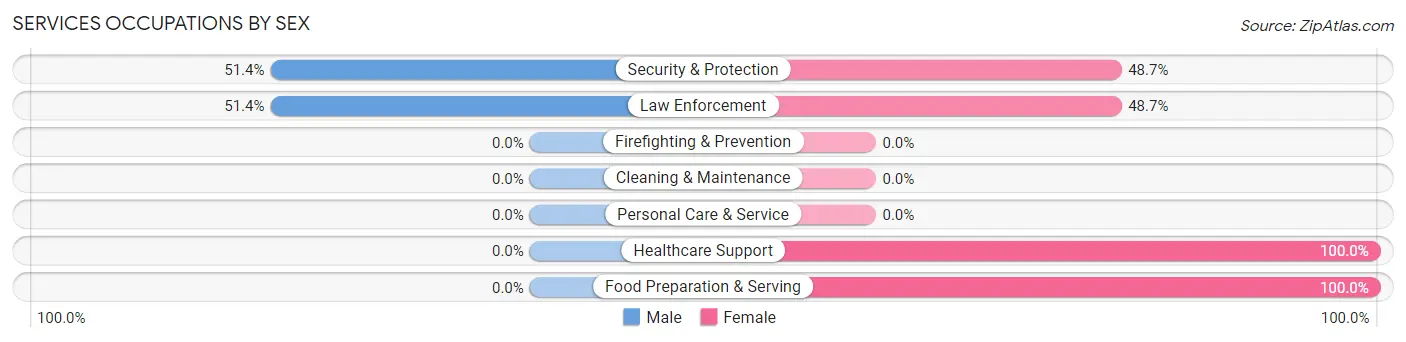
Services Occupations by Sex
Within the Services occupations in Lucerne, the most male-oriented occupations are Security & Protection (51.3%), and Law Enforcement (51.3%), while the most female-oriented occupations are Healthcare Support (100.0%), Food Preparation & Serving (100.0%), and Security & Protection (48.6%).
| Occupation | Male | Female |
| Healthcare Support | 0 (0.0%) | 9 (100.0%) |
| Security & Protection | 19 (51.3%) | 18 (48.6%) |
| Firefighting & Prevention | 0 (0.0%) | 0 (0.0%) |
| Law Enforcement | 19 (51.3%) | 18 (48.6%) |
| Food Preparation & Serving | 0 (0.0%) | 8 (100.0%) |
| Cleaning & Maintenance | 0 (0.0%) | 0 (0.0%) |
| Personal Care & Service | 0 (0.0%) | 0 (0.0%) |
| Total (Category) | 19 (35.2%) | 35 (64.8%) |
| Total (Overall) | 108 (46.8%) | 123 (53.2%) |
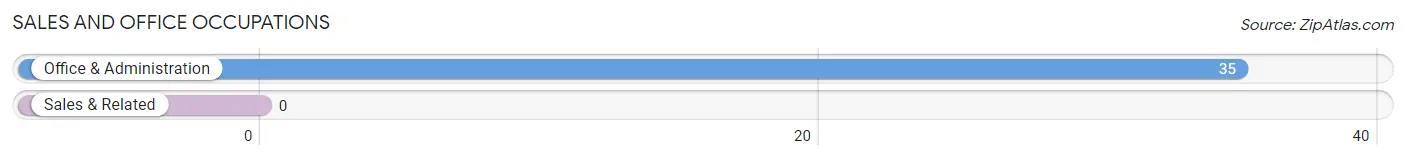
Sales and Office Occupations
The most common Sales and Office occupations in Lucerne are , and Office & Administration (35 | 15.1%).
Sales and Office Occupations by Sex

| Occupation | Male | Female |
| Sales & Related | 0 (0.0%) | 0 (0.0%) |
| Office & Administration | 6 (17.1%) | 29 (82.9%) |
| Total (Category) | 6 (17.1%) | 29 (82.9%) |
| Total (Overall) | 108 (46.8%) | 123 (53.2%) |
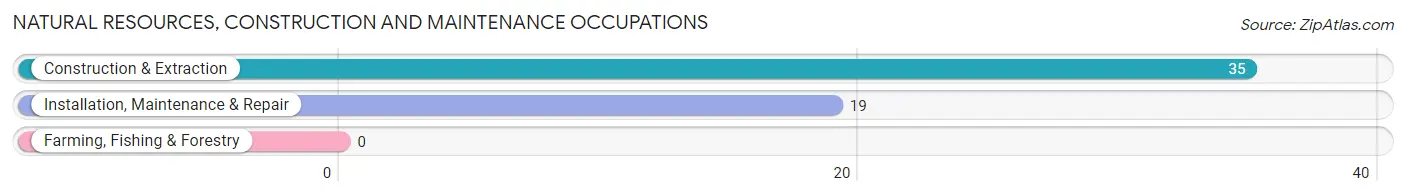
Natural Resources, Construction and Maintenance Occupations
The most common Natural Resources, Construction and Maintenance occupations in Lucerne are Construction & Extraction (35 | 15.1%), and Installation, Maintenance & Repair (19 | 8.2%).
Natural Resources, Construction and Maintenance Occupations by Sex
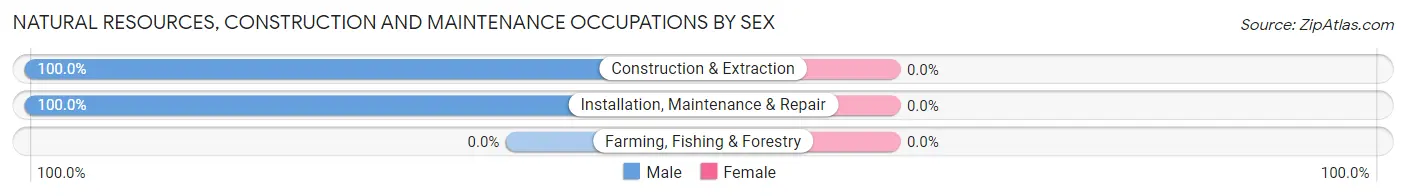
| Occupation | Male | Female |
| Farming, Fishing & Forestry | 0 (0.0%) | 0 (0.0%) |
| Construction & Extraction | 35 (100.0%) | 0 (0.0%) |
| Installation, Maintenance & Repair | 19 (100.0%) | 0 (0.0%) |
| Total (Category) | 54 (100.0%) | 0 (0.0%) |
| Total (Overall) | 108 (46.8%) | 123 (53.2%) |
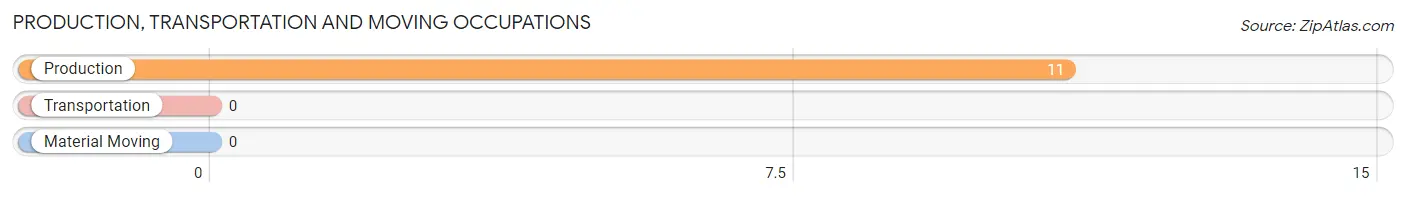
Production, Transportation and Moving Occupations
The most common Production, Transportation and Moving occupations in Lucerne are , and Production (11 | 4.8%).
Production, Transportation and Moving Occupations by Sex
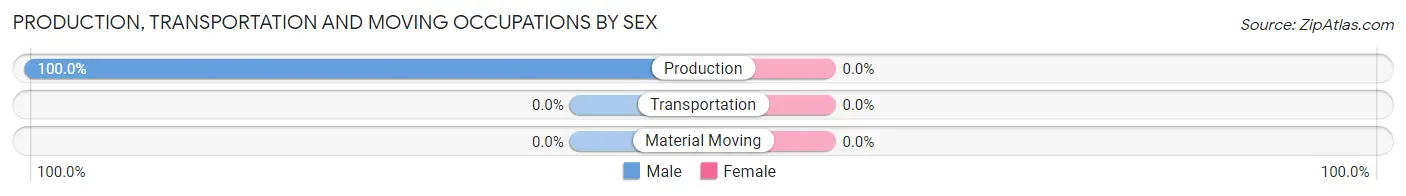
| Occupation | Male | Female |
| Production | 11 (100.0%) | 0 (0.0%) |
| Transportation | 0 (0.0%) | 0 (0.0%) |
| Material Moving | 0 (0.0%) | 0 (0.0%) |
| Total (Category) | 11 (100.0%) | 0 (0.0%) |
| Total (Overall) | 108 (46.8%) | 123 (53.2%) |
Employment Industries by Sex in Lucerne
Employment Industries in Lucerne
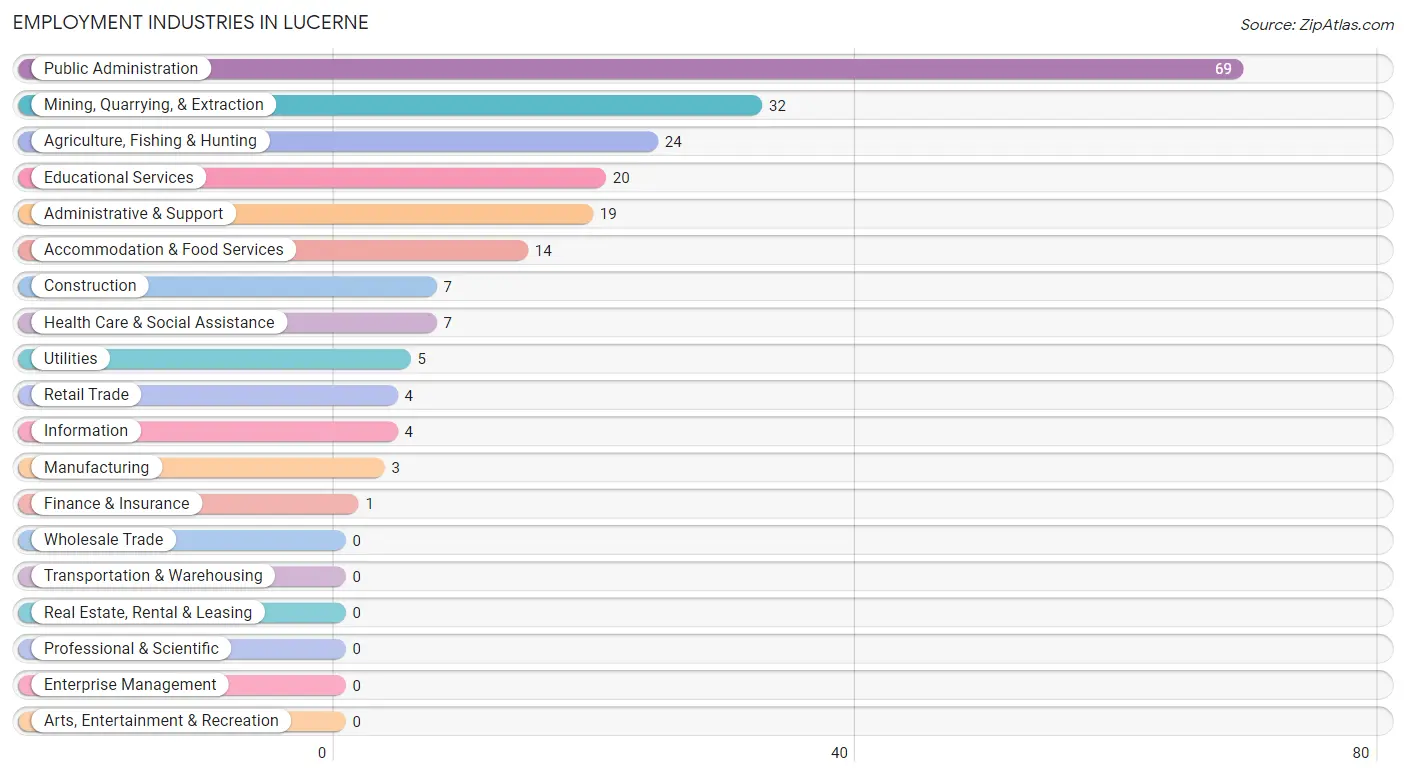
The major employment industries in Lucerne include Public Administration (69 | 29.9%), Mining, Quarrying, & Extraction (32 | 13.9%), Agriculture, Fishing & Hunting (24 | 10.4%), Educational Services (20 | 8.7%), and Administrative & Support (19 | 8.2%).
Employment Industries by Sex in Lucerne
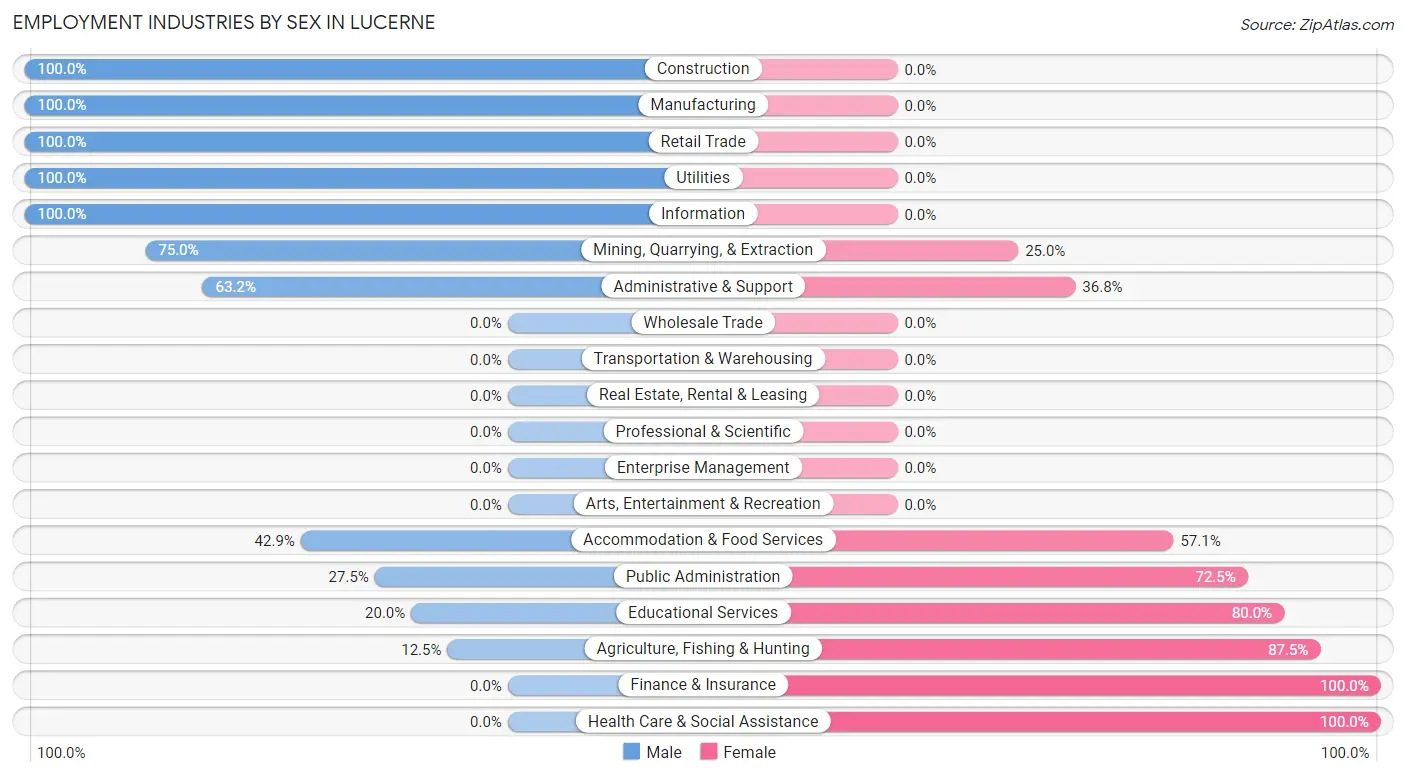
The Lucerne industries that see more men than women are Construction (100.0%), Manufacturing (100.0%), and Retail Trade (100.0%), whereas the industries that tend to have a higher number of women are Finance & Insurance (100.0%), Health Care & Social Assistance (100.0%), and Agriculture, Fishing & Hunting (87.5%).
| Industry | Male | Female |
| Agriculture, Fishing & Hunting | 3 (12.5%) | 21 (87.5%) |
| Mining, Quarrying, & Extraction | 24 (75.0%) | 8 (25.0%) |
| Construction | 7 (100.0%) | 0 (0.0%) |
| Manufacturing | 3 (100.0%) | 0 (0.0%) |
| Wholesale Trade | 0 (0.0%) | 0 (0.0%) |
| Retail Trade | 4 (100.0%) | 0 (0.0%) |
| Transportation & Warehousing | 0 (0.0%) | 0 (0.0%) |
| Utilities | 5 (100.0%) | 0 (0.0%) |
| Information | 4 (100.0%) | 0 (0.0%) |
| Finance & Insurance | 0 (0.0%) | 1 (100.0%) |
| Real Estate, Rental & Leasing | 0 (0.0%) | 0 (0.0%) |
| Professional & Scientific | 0 (0.0%) | 0 (0.0%) |
| Enterprise Management | 0 (0.0%) | 0 (0.0%) |
| Administrative & Support | 12 (63.2%) | 7 (36.8%) |
| Educational Services | 4 (20.0%) | 16 (80.0%) |
| Health Care & Social Assistance | 0 (0.0%) | 7 (100.0%) |
| Arts, Entertainment & Recreation | 0 (0.0%) | 0 (0.0%) |
| Accommodation & Food Services | 6 (42.9%) | 8 (57.1%) |
| Public Administration | 19 (27.5%) | 50 (72.5%) |
| Total | 108 (46.8%) | 123 (53.2%) |
Education in Lucerne
School Enrollment in Lucerne
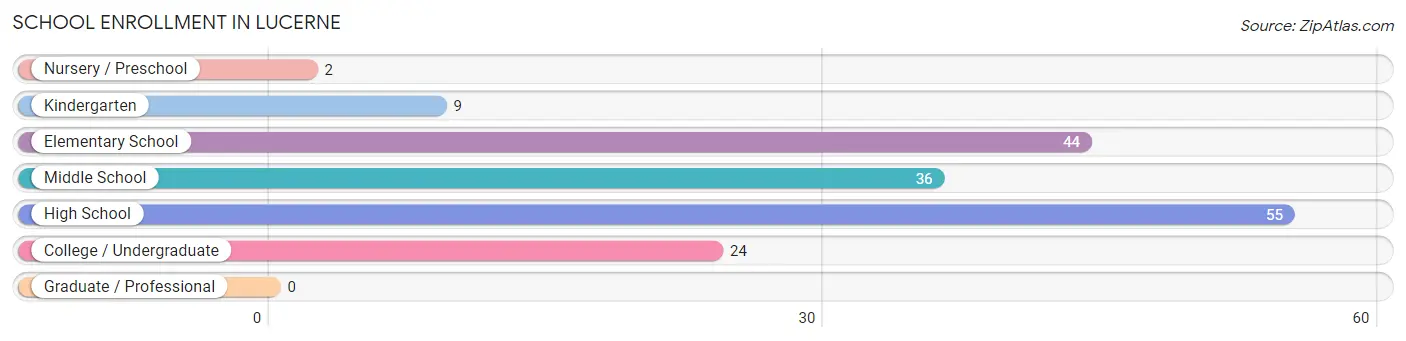
The most common levels of schooling among the 170 students in Lucerne are high school (55 | 32.4%), elementary school (44 | 25.9%), and middle school (36 | 21.2%).
| School Level | # Students | % Students |
| Nursery / Preschool | 2 | 1.2% |
| Kindergarten | 9 | 5.3% |
| Elementary School | 44 | 25.9% |
| Middle School | 36 | 21.2% |
| High School | 55 | 32.4% |
| College / Undergraduate | 24 | 14.1% |
| Graduate / Professional | 0 | 0.0% |
| Total | 170 | 100.0% |
School Enrollment by Age by Funding Source in Lucerne
| Age Bracket | Public School | Private School |
| 3 to 4 Year Olds | 0 (0.0%) | 0 (0.0%) |
| 5 to 9 Year Old | 23 (100.0%) | 0 (0.0%) |
| 10 to 14 Year Olds | 85 (100.0%) | 0 (0.0%) |
| 15 to 17 Year Olds | 20 (100.0%) | 0 (0.0%) |
| 18 to 19 Year Olds | 21 (100.0%) | 0 (0.0%) |
| 20 to 24 Year Olds | 21 (100.0%) | 0 (0.0%) |
| 25 to 34 Year Olds | 0 (0.0%) | 0 (0.0%) |
| 35 Years and over | 0 (0.0%) | 0 (0.0%) |
| Total | 170 (100.0%) | 0 (0.0%) |
Educational Attainment by Field of Study in Lucerne
Social sciences (34 | 30.1%), business (26 | 23.0%), physical & health sciences (21 | 18.6%), bio, nature & agricultural (17 | 15.0%), and science & technology (9 | 8.0%) are the most common fields of study among 113 individuals in Lucerne who have obtained a bachelor's degree or higher.
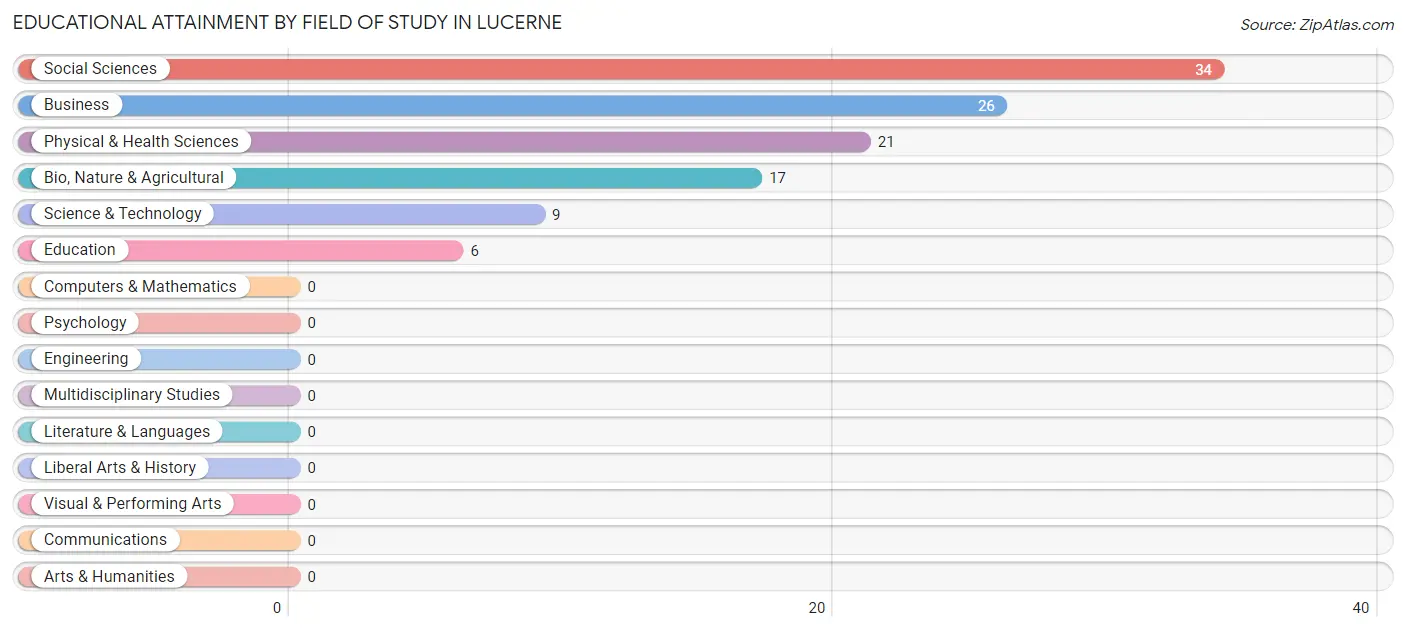
| Field of Study | # Graduates | % Graduates |
| Computers & Mathematics | 0 | 0.0% |
| Bio, Nature & Agricultural | 17 | 15.0% |
| Physical & Health Sciences | 21 | 18.6% |
| Psychology | 0 | 0.0% |
| Social Sciences | 34 | 30.1% |
| Engineering | 0 | 0.0% |
| Multidisciplinary Studies | 0 | 0.0% |
| Science & Technology | 9 | 8.0% |
| Business | 26 | 23.0% |
| Education | 6 | 5.3% |
| Literature & Languages | 0 | 0.0% |
| Liberal Arts & History | 0 | 0.0% |
| Visual & Performing Arts | 0 | 0.0% |
| Communications | 0 | 0.0% |
| Arts & Humanities | 0 | 0.0% |
| Total | 113 | 100.0% |
Transportation & Commute in Lucerne
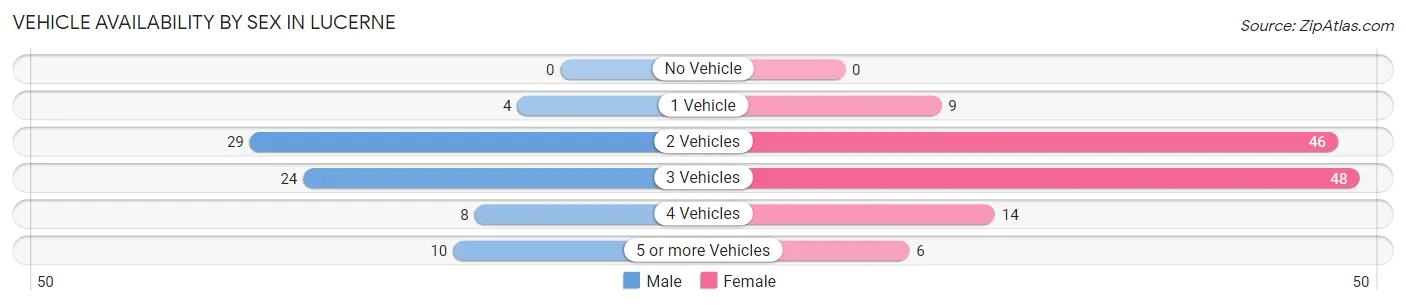
Vehicle Availability by Sex in Lucerne
The most prevalent vehicle ownership categories in Lucerne are males with 2 vehicles (29, accounting for 38.7%) and females with 2 vehicles (46, making up 23.6%).
| Vehicles Available | Male | Female |
| No Vehicle | 0 (0.0%) | 0 (0.0%) |
| 1 Vehicle | 4 (5.3%) | 9 (7.3%) |
| 2 Vehicles | 29 (38.7%) | 46 (37.4%) |
| 3 Vehicles | 24 (32.0%) | 48 (39.0%) |
| 4 Vehicles | 8 (10.7%) | 14 (11.4%) |
| 5 or more Vehicles | 10 (13.3%) | 6 (4.9%) |
| Total | 75 (100.0%) | 123 (100.0%) |
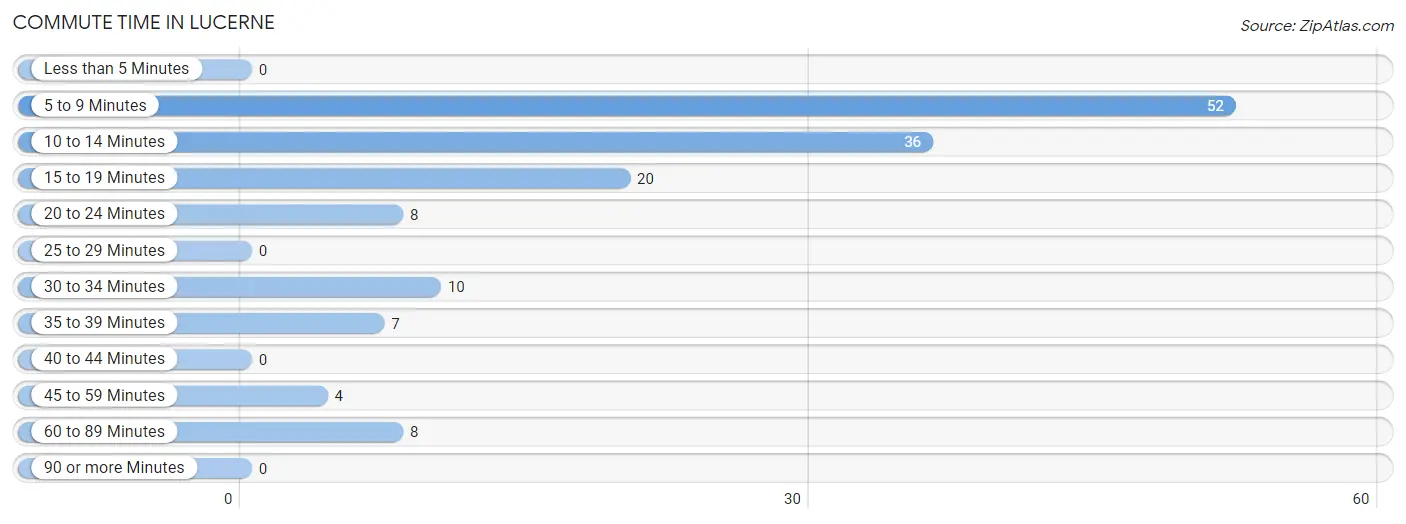
Commute Time in Lucerne
The most frequently occuring commute durations in Lucerne are 5 to 9 minutes (52 commuters, 35.9%), 10 to 14 minutes (36 commuters, 24.8%), and 15 to 19 minutes (20 commuters, 13.8%).
| Commute Time | # Commuters | % Commuters |
| Less than 5 Minutes | 0 | 0.0% |
| 5 to 9 Minutes | 52 | 35.9% |
| 10 to 14 Minutes | 36 | 24.8% |
| 15 to 19 Minutes | 20 | 13.8% |
| 20 to 24 Minutes | 8 | 5.5% |
| 25 to 29 Minutes | 0 | 0.0% |
| 30 to 34 Minutes | 10 | 6.9% |
| 35 to 39 Minutes | 7 | 4.8% |
| 40 to 44 Minutes | 0 | 0.0% |
| 45 to 59 Minutes | 4 | 2.8% |
| 60 to 89 Minutes | 8 | 5.5% |
| 90 or more Minutes | 0 | 0.0% |
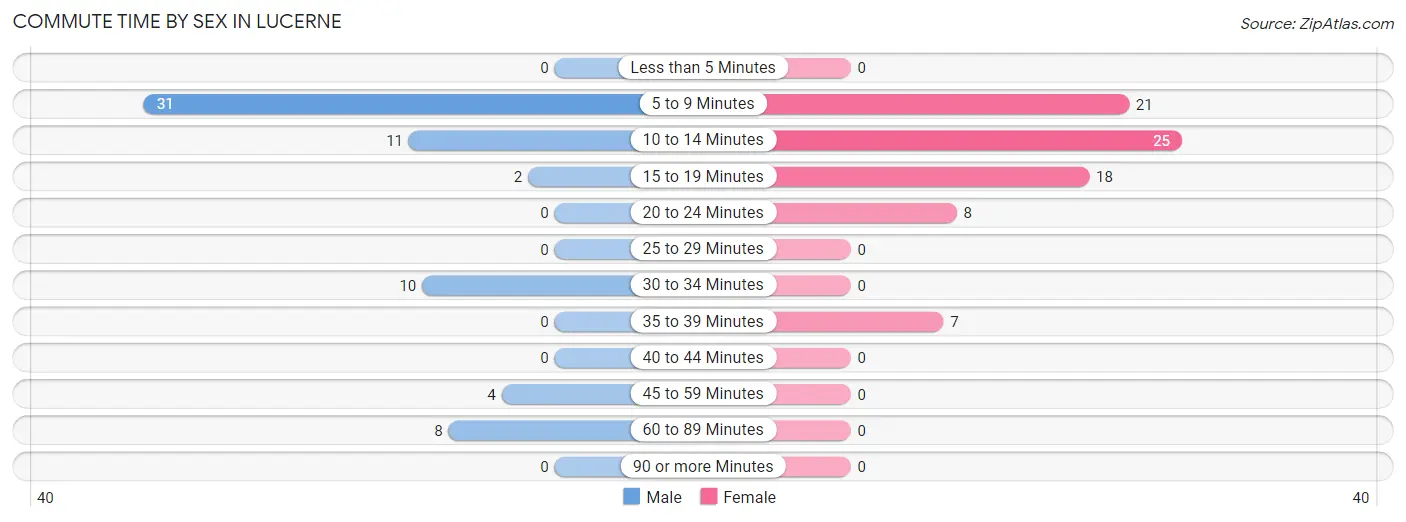
Commute Time by Sex in Lucerne
The most common commute times in Lucerne are 5 to 9 minutes (31 commuters, 47.0%) for males and 10 to 14 minutes (25 commuters, 31.7%) for females.
| Commute Time | Male | Female |
| Less than 5 Minutes | 0 (0.0%) | 0 (0.0%) |
| 5 to 9 Minutes | 31 (47.0%) | 21 (26.6%) |
| 10 to 14 Minutes | 11 (16.7%) | 25 (31.7%) |
| 15 to 19 Minutes | 2 (3.0%) | 18 (22.8%) |
| 20 to 24 Minutes | 0 (0.0%) | 8 (10.1%) |
| 25 to 29 Minutes | 0 (0.0%) | 0 (0.0%) |
| 30 to 34 Minutes | 10 (15.1%) | 0 (0.0%) |
| 35 to 39 Minutes | 0 (0.0%) | 7 (8.9%) |
| 40 to 44 Minutes | 0 (0.0%) | 0 (0.0%) |
| 45 to 59 Minutes | 4 (6.1%) | 0 (0.0%) |
| 60 to 89 Minutes | 8 (12.1%) | 0 (0.0%) |
| 90 or more Minutes | 0 (0.0%) | 0 (0.0%) |
Time of Departure to Work by Sex in Lucerne
The most frequent times of departure to work in Lucerne are 6:00 AM to 6:29 AM (19, 28.8%) for males and 6:30 AM to 6:59 AM (26, 32.9%) for females.
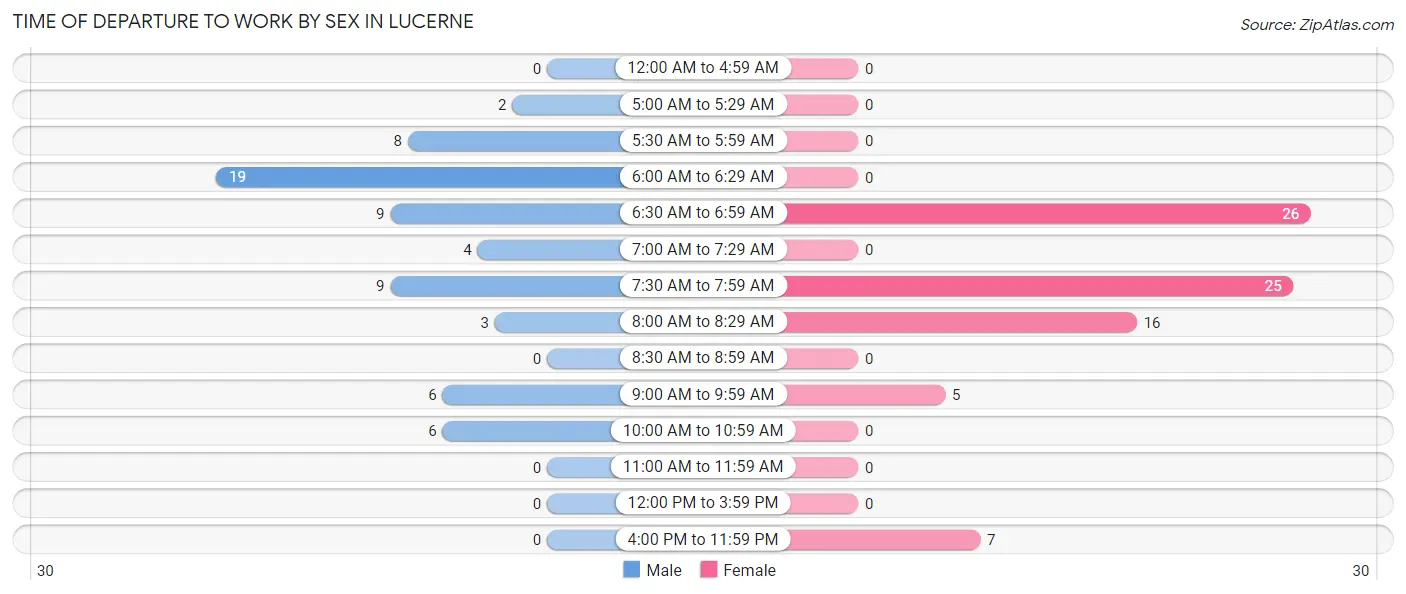
| Time of Departure | Male | Female |
| 12:00 AM to 4:59 AM | 0 (0.0%) | 0 (0.0%) |
| 5:00 AM to 5:29 AM | 2 (3.0%) | 0 (0.0%) |
| 5:30 AM to 5:59 AM | 8 (12.1%) | 0 (0.0%) |
| 6:00 AM to 6:29 AM | 19 (28.8%) | 0 (0.0%) |
| 6:30 AM to 6:59 AM | 9 (13.6%) | 26 (32.9%) |
| 7:00 AM to 7:29 AM | 4 (6.1%) | 0 (0.0%) |
| 7:30 AM to 7:59 AM | 9 (13.6%) | 25 (31.7%) |
| 8:00 AM to 8:29 AM | 3 (4.5%) | 16 (20.3%) |
| 8:30 AM to 8:59 AM | 0 (0.0%) | 0 (0.0%) |
| 9:00 AM to 9:59 AM | 6 (9.1%) | 5 (6.3%) |
| 10:00 AM to 10:59 AM | 6 (9.1%) | 0 (0.0%) |
| 11:00 AM to 11:59 AM | 0 (0.0%) | 0 (0.0%) |
| 12:00 PM to 3:59 PM | 0 (0.0%) | 0 (0.0%) |
| 4:00 PM to 11:59 PM | 0 (0.0%) | 7 (8.9%) |
| Total | 66 (100.0%) | 79 (100.0%) |
Housing Occupancy in Lucerne
Occupancy by Ownership in Lucerne
Of the total 192 dwellings in Lucerne, owner-occupied units account for 147 (76.6%), while renter-occupied units make up 45 (23.4%).
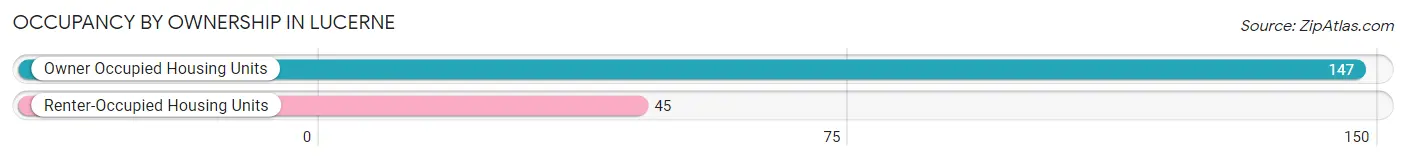
| Occupancy | # Housing Units | % Housing Units |
| Owner Occupied Housing Units | 147 | 76.6% |
| Renter-Occupied Housing Units | 45 | 23.4% |
| Total Occupied Housing Units | 192 | 100.0% |
Occupancy by Household Size in Lucerne
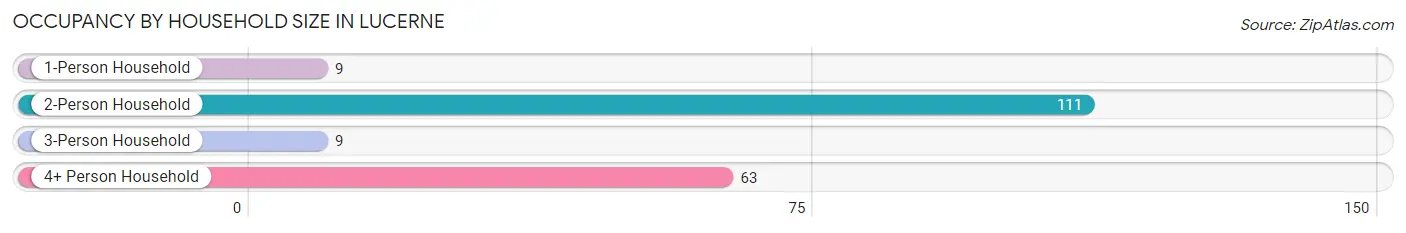
| Household Size | # Housing Units | % Housing Units |
| 1-Person Household | 9 | 4.7% |
| 2-Person Household | 111 | 57.8% |
| 3-Person Household | 9 | 4.7% |
| 4+ Person Household | 63 | 32.8% |
| Total Housing Units | 192 | 100.0% |
Occupancy by Ownership by Household Size in Lucerne
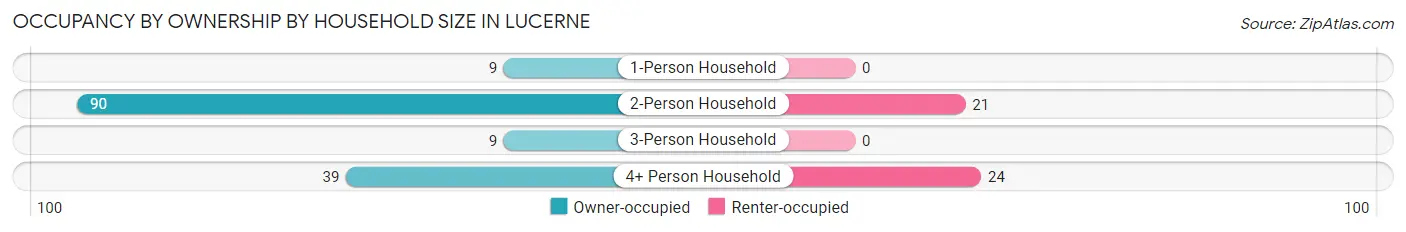
| Household Size | Owner-occupied | Renter-occupied |
| 1-Person Household | 9 (100.0%) | 0 (0.0%) |
| 2-Person Household | 90 (81.1%) | 21 (18.9%) |
| 3-Person Household | 9 (100.0%) | 0 (0.0%) |
| 4+ Person Household | 39 (61.9%) | 24 (38.1%) |
| Total Housing Units | 147 (76.6%) | 45 (23.4%) |
Occupancy by Educational Attainment in Lucerne
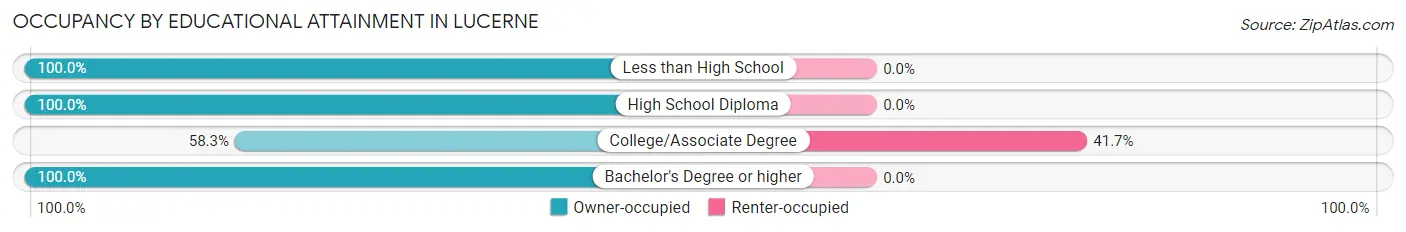
| Household Size | Owner-occupied | Renter-occupied |
| Less than High School | 5 (100.0%) | 0 (0.0%) |
| High School Diploma | 20 (100.0%) | 0 (0.0%) |
| College/Associate Degree | 63 (58.3%) | 45 (41.7%) |
| Bachelor's Degree or higher | 59 (100.0%) | 0 (0.0%) |
Occupancy by Age of Householder in Lucerne
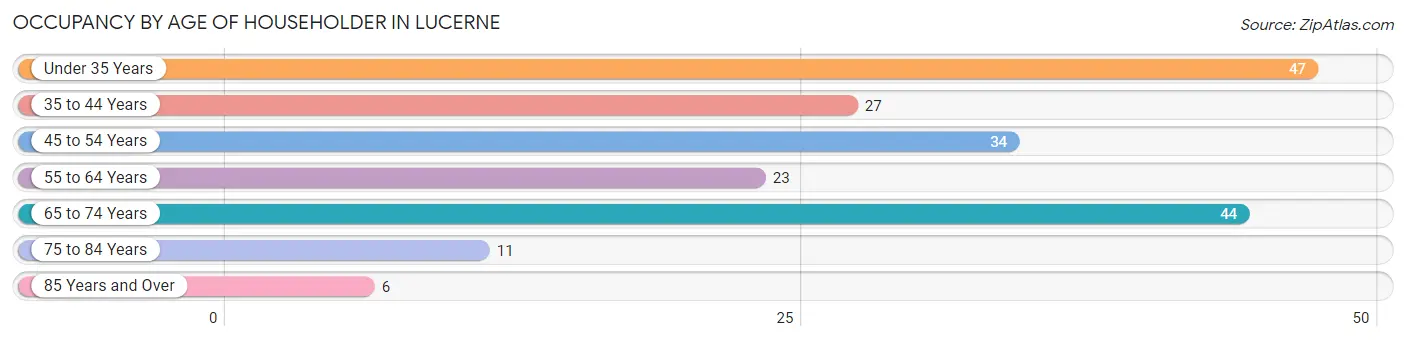
| Age Bracket | # Households | % Households |
| Under 35 Years | 47 | 24.5% |
| 35 to 44 Years | 27 | 14.1% |
| 45 to 54 Years | 34 | 17.7% |
| 55 to 64 Years | 23 | 12.0% |
| 65 to 74 Years | 44 | 22.9% |
| 75 to 84 Years | 11 | 5.7% |
| 85 Years and Over | 6 | 3.1% |
| Total | 192 | 100.0% |
Housing Finances in Lucerne
Median Income by Occupancy in Lucerne
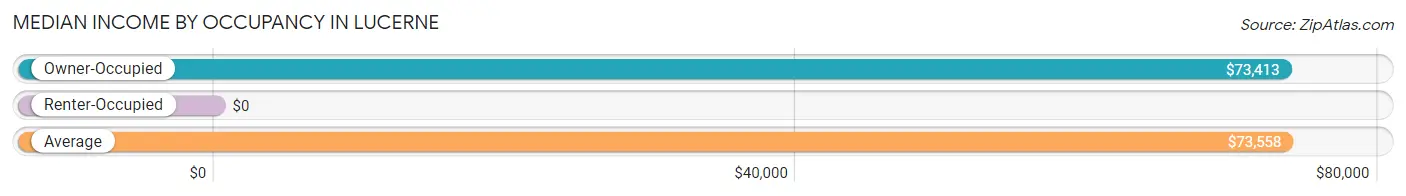
| Occupancy Type | # Households | Median Income |
| Owner-Occupied | 147 (76.6%) | $73,413 |
| Renter-Occupied | 45 (23.4%) | $0 |
| Average | 192 (100.0%) | $73,558 |
Occupancy by Householder Income Bracket in Lucerne
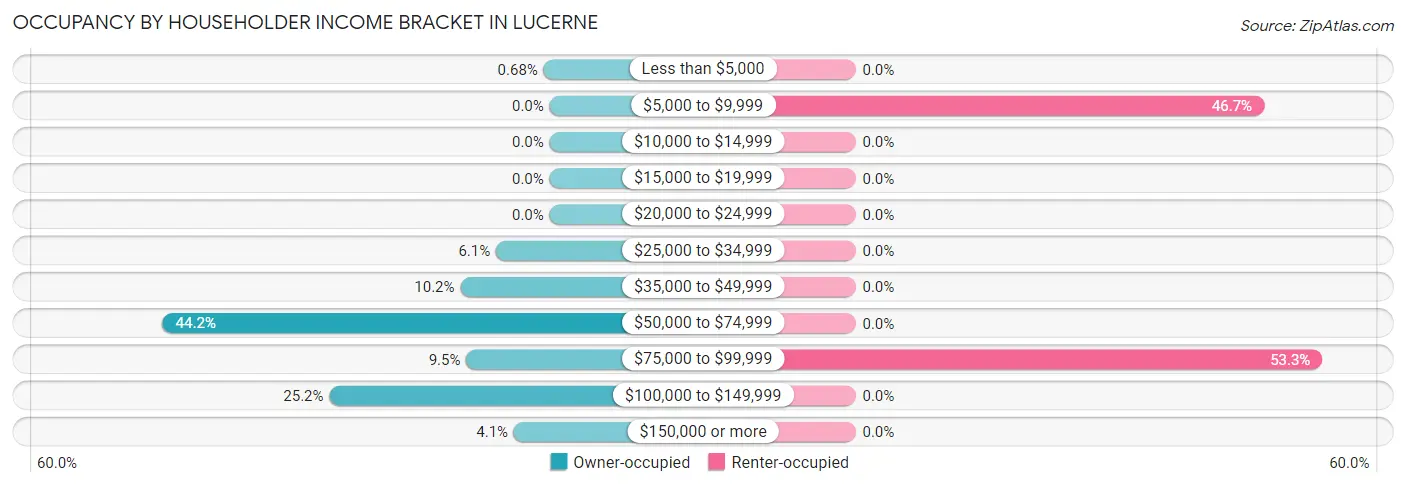
| Income Bracket | Owner-occupied | Renter-occupied |
| Less than $5,000 | 1 (0.7%) | 0 (0.0%) |
| $5,000 to $9,999 | 0 (0.0%) | 21 (46.7%) |
| $10,000 to $14,999 | 0 (0.0%) | 0 (0.0%) |
| $15,000 to $19,999 | 0 (0.0%) | 0 (0.0%) |
| $20,000 to $24,999 | 0 (0.0%) | 0 (0.0%) |
| $25,000 to $34,999 | 9 (6.1%) | 0 (0.0%) |
| $35,000 to $49,999 | 15 (10.2%) | 0 (0.0%) |
| $50,000 to $74,999 | 65 (44.2%) | 0 (0.0%) |
| $75,000 to $99,999 | 14 (9.5%) | 24 (53.3%) |
| $100,000 to $149,999 | 37 (25.2%) | 0 (0.0%) |
| $150,000 or more | 6 (4.1%) | 0 (0.0%) |
| Total | 147 (100.0%) | 45 (100.0%) |
Monthly Housing Cost Tiers in Lucerne
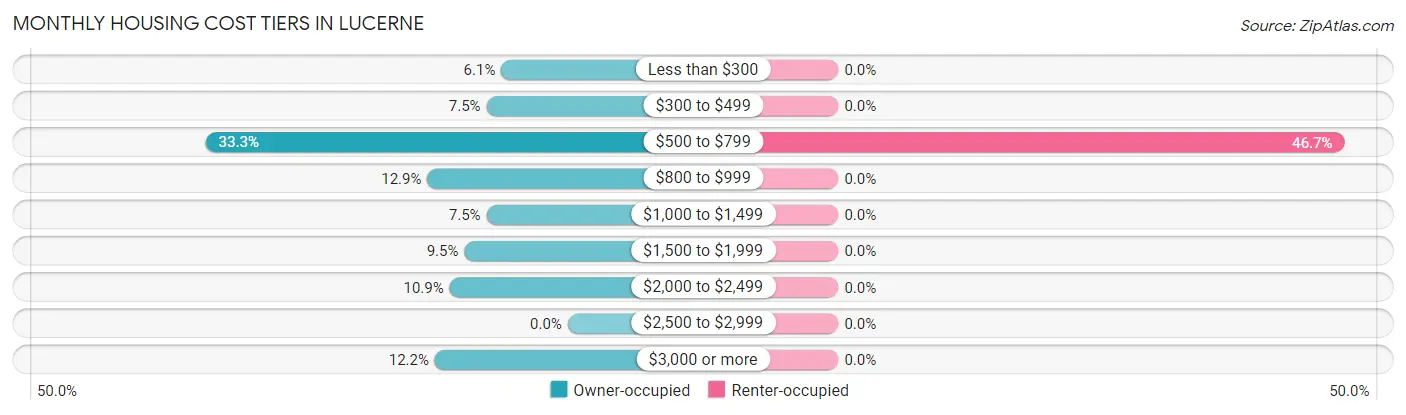
| Monthly Cost | Owner-occupied | Renter-occupied |
| Less than $300 | 9 (6.1%) | 0 (0.0%) |
| $300 to $499 | 11 (7.5%) | 0 (0.0%) |
| $500 to $799 | 49 (33.3%) | 21 (46.7%) |
| $800 to $999 | 19 (12.9%) | 0 (0.0%) |
| $1,000 to $1,499 | 11 (7.5%) | 0 (0.0%) |
| $1,500 to $1,999 | 14 (9.5%) | 0 (0.0%) |
| $2,000 to $2,499 | 16 (10.9%) | 0 (0.0%) |
| $2,500 to $2,999 | 0 (0.0%) | 0 (0.0%) |
| $3,000 or more | 18 (12.2%) | 0 (0.0%) |
| Total | 147 (100.0%) | 45 (100.0%) |
Physical Housing Characteristics in Lucerne
Housing Structures in Lucerne
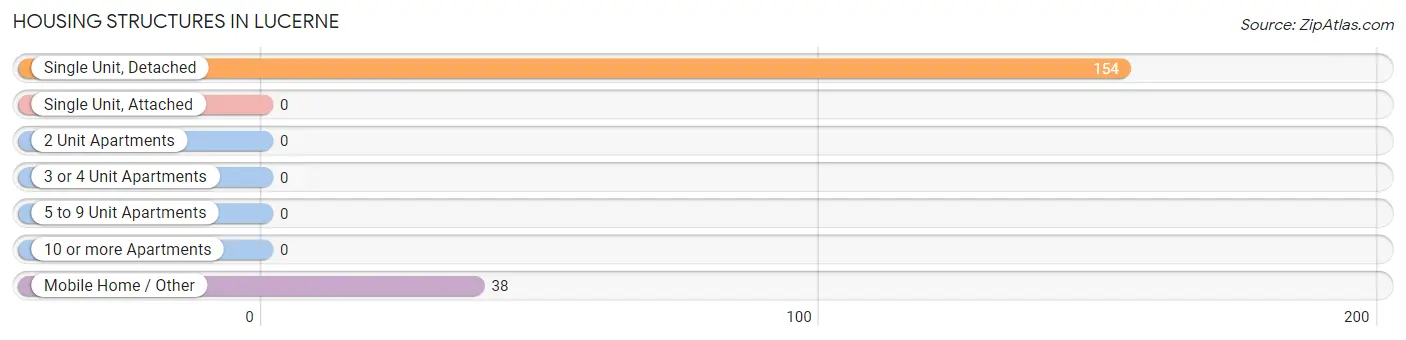
| Structure Type | # Housing Units | % Housing Units |
| Single Unit, Detached | 154 | 80.2% |
| Single Unit, Attached | 0 | 0.0% |
| 2 Unit Apartments | 0 | 0.0% |
| 3 or 4 Unit Apartments | 0 | 0.0% |
| 5 to 9 Unit Apartments | 0 | 0.0% |
| 10 or more Apartments | 0 | 0.0% |
| Mobile Home / Other | 38 | 19.8% |
| Total | 192 | 100.0% |
Housing Structures by Occupancy in Lucerne
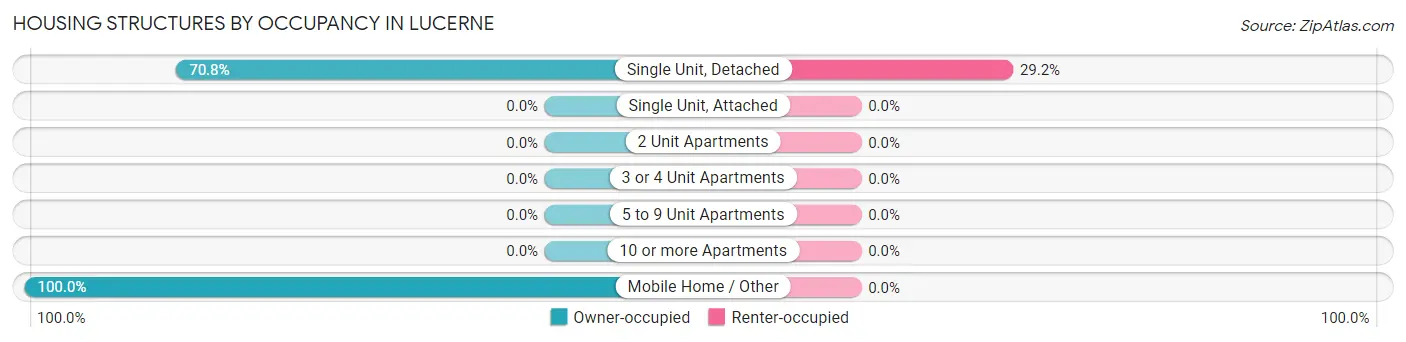
| Structure Type | Owner-occupied | Renter-occupied |
| Single Unit, Detached | 109 (70.8%) | 45 (29.2%) |
| Single Unit, Attached | 0 (0.0%) | 0 (0.0%) |
| 2 Unit Apartments | 0 (0.0%) | 0 (0.0%) |
| 3 or 4 Unit Apartments | 0 (0.0%) | 0 (0.0%) |
| 5 to 9 Unit Apartments | 0 (0.0%) | 0 (0.0%) |
| 10 or more Apartments | 0 (0.0%) | 0 (0.0%) |
| Mobile Home / Other | 38 (100.0%) | 0 (0.0%) |
| Total | 147 (76.6%) | 45 (23.4%) |
Housing Structures by Number of Rooms in Lucerne
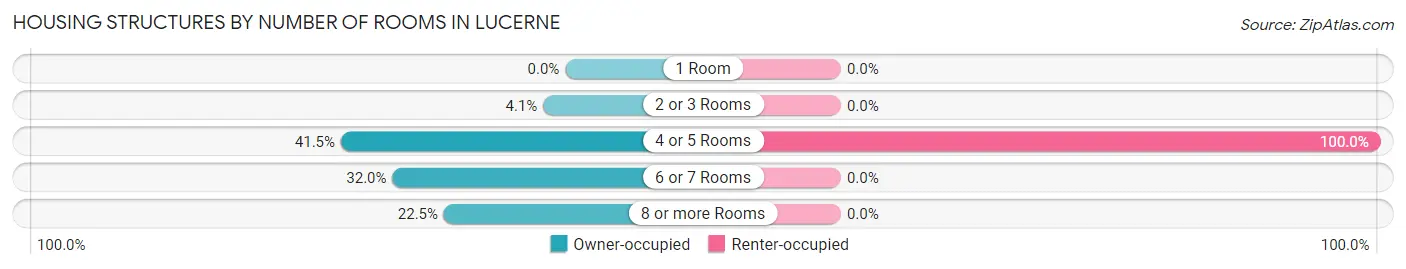
| Number of Rooms | Owner-occupied | Renter-occupied |
| 1 Room | 0 (0.0%) | 0 (0.0%) |
| 2 or 3 Rooms | 6 (4.1%) | 0 (0.0%) |
| 4 or 5 Rooms | 61 (41.5%) | 45 (100.0%) |
| 6 or 7 Rooms | 47 (32.0%) | 0 (0.0%) |
| 8 or more Rooms | 33 (22.5%) | 0 (0.0%) |
| Total | 147 (100.0%) | 45 (100.0%) |
Housing Structure by Heating Type in Lucerne
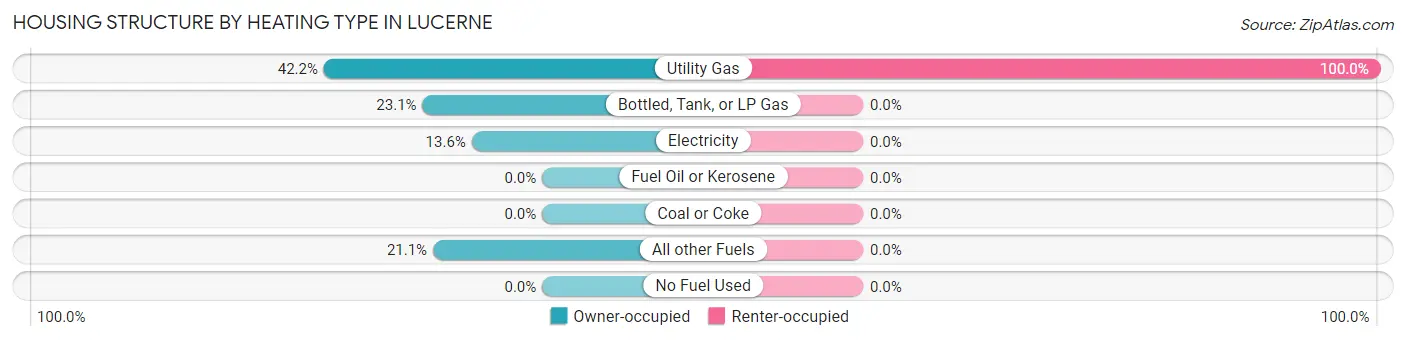
| Heating Type | Owner-occupied | Renter-occupied |
| Utility Gas | 62 (42.2%) | 45 (100.0%) |
| Bottled, Tank, or LP Gas | 34 (23.1%) | 0 (0.0%) |
| Electricity | 20 (13.6%) | 0 (0.0%) |
| Fuel Oil or Kerosene | 0 (0.0%) | 0 (0.0%) |
| Coal or Coke | 0 (0.0%) | 0 (0.0%) |
| All other Fuels | 31 (21.1%) | 0 (0.0%) |
| No Fuel Used | 0 (0.0%) | 0 (0.0%) |
| Total | 147 (100.0%) | 45 (100.0%) |
Household Vehicle Usage in Lucerne
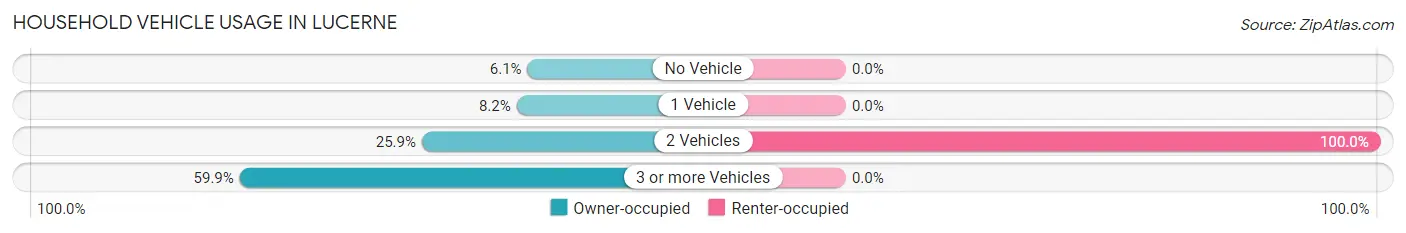
| Vehicles per Household | Owner-occupied | Renter-occupied |
| No Vehicle | 9 (6.1%) | 0 (0.0%) |
| 1 Vehicle | 12 (8.2%) | 0 (0.0%) |
| 2 Vehicles | 38 (25.9%) | 45 (100.0%) |
| 3 or more Vehicles | 88 (59.9%) | 0 (0.0%) |
| Total | 147 (100.0%) | 45 (100.0%) |
Real Estate & Mortgages in Lucerne
Real Estate and Mortgage Overview in Lucerne
| Characteristic | Without Mortgage | With Mortgage |
| Housing Units | 84 | 63 |
| Median Property Value | $191,700 | $357,700 |
| Median Household Income | $69,079 | $3 |
| Monthly Housing Costs | $627 | $18 |
| Real Estate Taxes | $1,643 | $0 |
Property Value by Mortgage Status in Lucerne
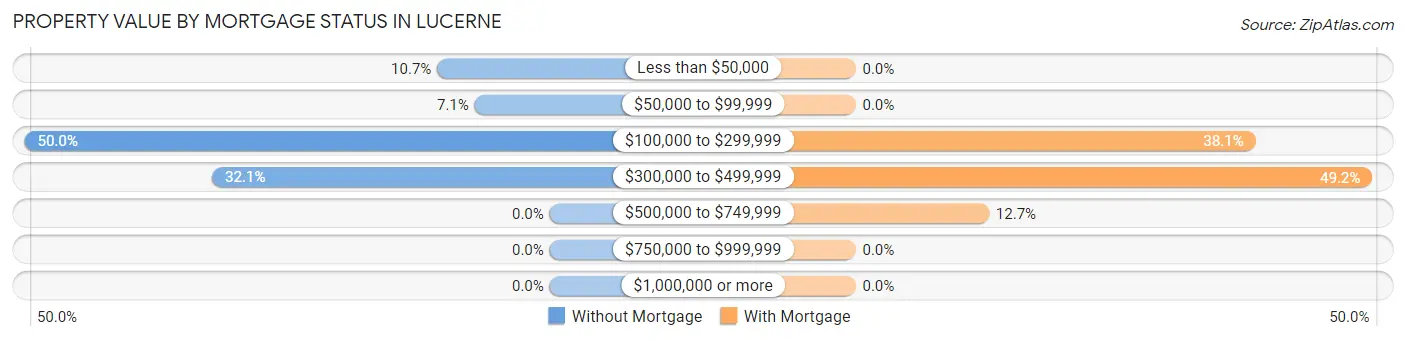
| Property Value | Without Mortgage | With Mortgage |
| Less than $50,000 | 9 (10.7%) | 0 (0.0%) |
| $50,000 to $99,999 | 6 (7.1%) | 0 (0.0%) |
| $100,000 to $299,999 | 42 (50.0%) | 24 (38.1%) |
| $300,000 to $499,999 | 27 (32.1%) | 31 (49.2%) |
| $500,000 to $749,999 | 0 (0.0%) | 8 (12.7%) |
| $750,000 to $999,999 | 0 (0.0%) | 0 (0.0%) |
| $1,000,000 or more | 0 (0.0%) | 0 (0.0%) |
| Total | 84 (100.0%) | 63 (100.0%) |
Household Income by Mortgage Status in Lucerne
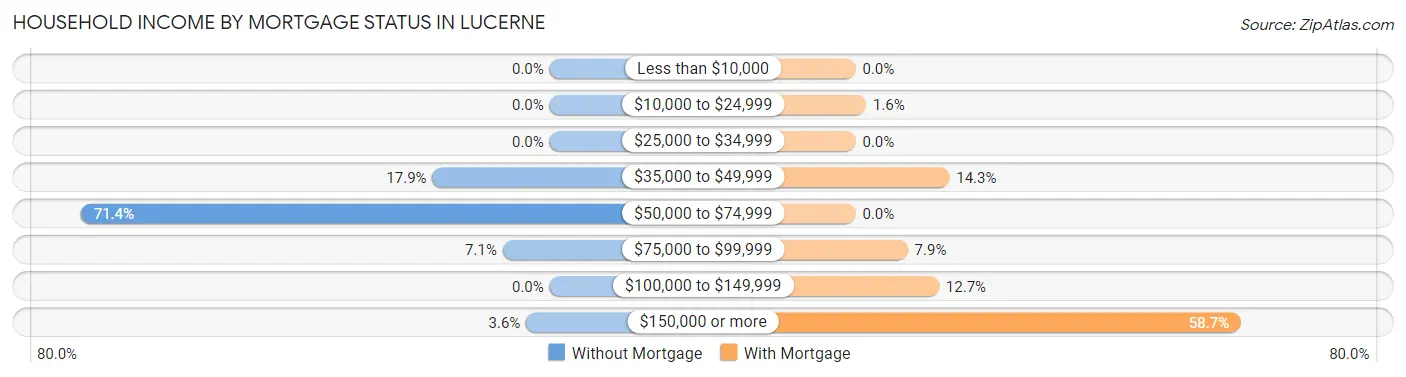
| Household Income | Without Mortgage | With Mortgage |
| Less than $10,000 | 0 (0.0%) | 0 (0.0%) |
| $10,000 to $24,999 | 0 (0.0%) | 1 (1.6%) |
| $25,000 to $34,999 | 0 (0.0%) | 0 (0.0%) |
| $35,000 to $49,999 | 15 (17.9%) | 9 (14.3%) |
| $50,000 to $74,999 | 60 (71.4%) | 0 (0.0%) |
| $75,000 to $99,999 | 6 (7.1%) | 5 (7.9%) |
| $100,000 to $149,999 | 0 (0.0%) | 8 (12.7%) |
| $150,000 or more | 3 (3.6%) | 37 (58.7%) |
| Total | 84 (100.0%) | 63 (100.0%) |
Property Value to Household Income Ratio in Lucerne
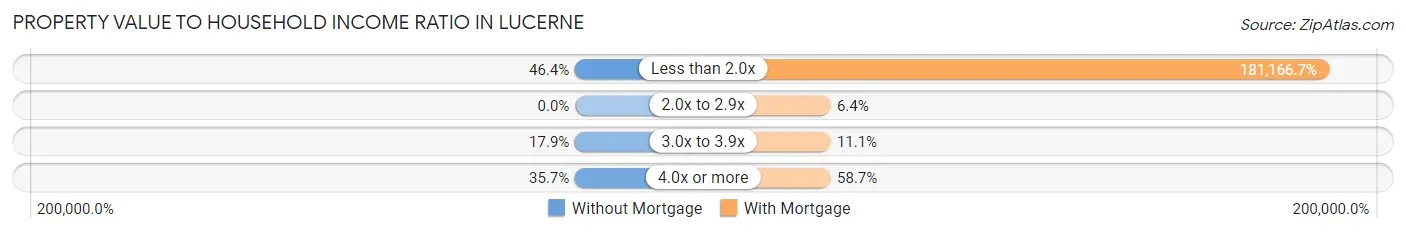
| Value-to-Income Ratio | Without Mortgage | With Mortgage |
| Less than 2.0x | 39 (46.4%) | 114,135 (181,166.7%) |
| 2.0x to 2.9x | 0 (0.0%) | 4 (6.4%) |
| 3.0x to 3.9x | 15 (17.9%) | 7 (11.1%) |
| 4.0x or more | 30 (35.7%) | 37 (58.7%) |
| Total | 84 (100.0%) | 63 (100.0%) |
Real Estate Taxes by Mortgage Status in Lucerne
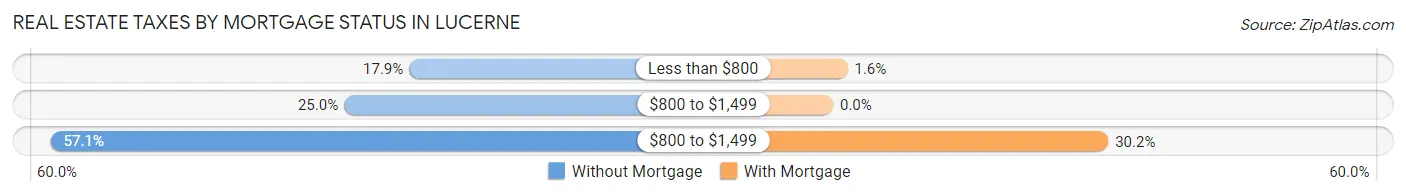
| Property Taxes | Without Mortgage | With Mortgage |
| Less than $800 | 15 (17.9%) | 1 (1.6%) |
| $800 to $1,499 | 21 (25.0%) | 0 (0.0%) |
| $800 to $1,499 | 48 (57.1%) | 19 (30.2%) |
| Total | 84 (100.0%) | 63 (100.0%) |
Health & Disability in Lucerne
Health Insurance Coverage by Age in Lucerne
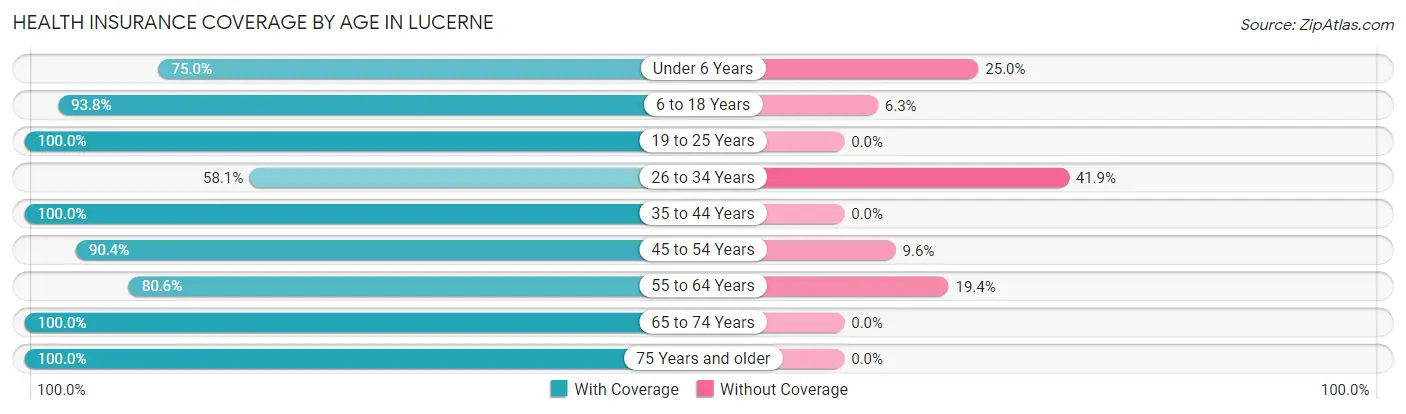
| Age Bracket | With Coverage | Without Coverage |
| Under 6 Years | 63 (75.0%) | 21 (25.0%) |
| 6 to 18 Years | 135 (93.8%) | 9 (6.2%) |
| 19 to 25 Years | 28 (100.0%) | 0 (0.0%) |
| 26 to 34 Years | 25 (58.1%) | 18 (41.9%) |
| 35 to 44 Years | 60 (100.0%) | 0 (0.0%) |
| 45 to 54 Years | 85 (90.4%) | 9 (9.6%) |
| 55 to 64 Years | 29 (80.6%) | 7 (19.4%) |
| 65 to 74 Years | 79 (100.0%) | 0 (0.0%) |
| 75 Years and older | 28 (100.0%) | 0 (0.0%) |
| Total | 532 (89.3%) | 64 (10.7%) |
Health Insurance Coverage by Citizenship Status in Lucerne
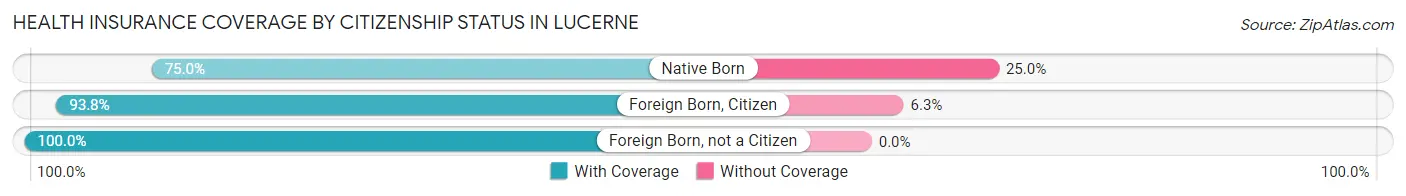
| Citizenship Status | With Coverage | Without Coverage |
| Native Born | 63 (75.0%) | 21 (25.0%) |
| Foreign Born, Citizen | 135 (93.8%) | 9 (6.2%) |
| Foreign Born, not a Citizen | 28 (100.0%) | 0 (0.0%) |
Health Insurance Coverage by Household Income in Lucerne
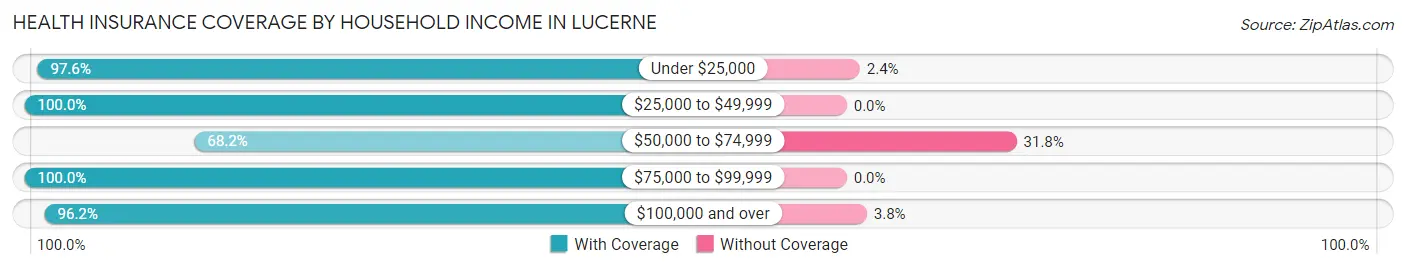
| Household Income | With Coverage | Without Coverage |
| Under $25,000 | 40 (97.6%) | 1 (2.4%) |
| $25,000 to $49,999 | 49 (100.0%) | 0 (0.0%) |
| $50,000 to $74,999 | 120 (68.2%) | 56 (31.8%) |
| $75,000 to $99,999 | 144 (100.0%) | 0 (0.0%) |
| $100,000 and over | 179 (96.2%) | 7 (3.8%) |
Public vs Private Health Insurance Coverage by Age in Lucerne
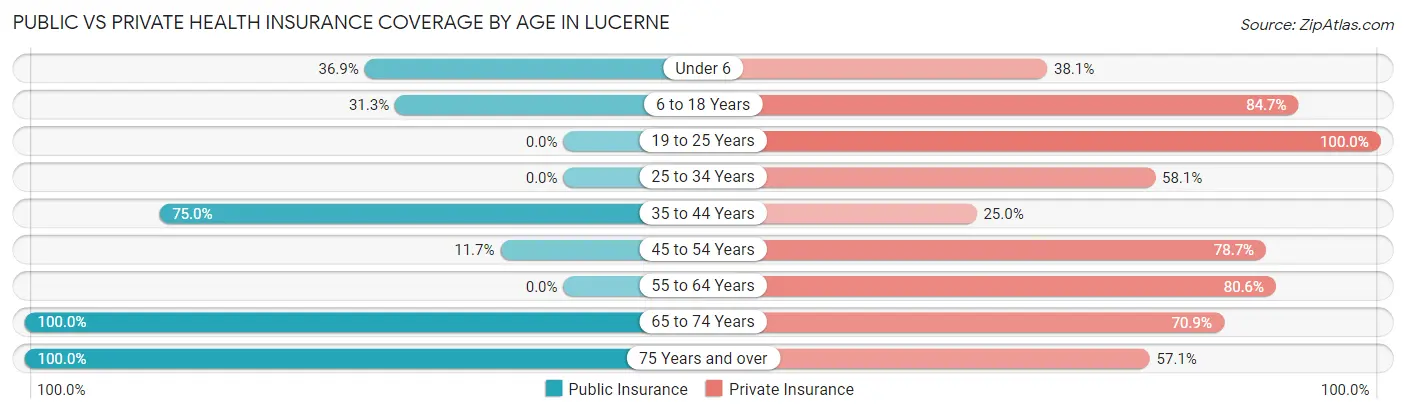
| Age Bracket | Public Insurance | Private Insurance |
| Under 6 | 31 (36.9%) | 32 (38.1%) |
| 6 to 18 Years | 45 (31.2%) | 122 (84.7%) |
| 19 to 25 Years | 0 (0.0%) | 28 (100.0%) |
| 25 to 34 Years | 0 (0.0%) | 25 (58.1%) |
| 35 to 44 Years | 45 (75.0%) | 15 (25.0%) |
| 45 to 54 Years | 11 (11.7%) | 74 (78.7%) |
| 55 to 64 Years | 0 (0.0%) | 29 (80.6%) |
| 65 to 74 Years | 79 (100.0%) | 56 (70.9%) |
| 75 Years and over | 28 (100.0%) | 16 (57.1%) |
| Total | 239 (40.1%) | 397 (66.6%) |
Disability Status by Sex by Age in Lucerne
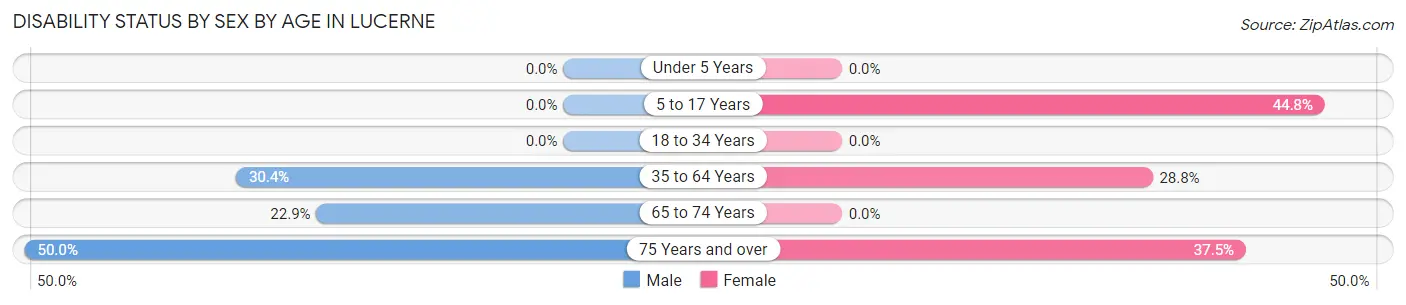
| Age Bracket | Male | Female |
| Under 5 Years | 0 (0.0%) | 0 (0.0%) |
| 5 to 17 Years | 0 (0.0%) | 13 (44.8%) |
| 18 to 34 Years | 0 (0.0%) | 0 (0.0%) |
| 35 to 64 Years | 24 (30.4%) | 32 (28.8%) |
| 65 to 74 Years | 11 (22.9%) | 0 (0.0%) |
| 75 Years and over | 6 (50.0%) | 6 (37.5%) |
Disability Class by Sex by Age in Lucerne
Disability Class: Hearing Difficulty
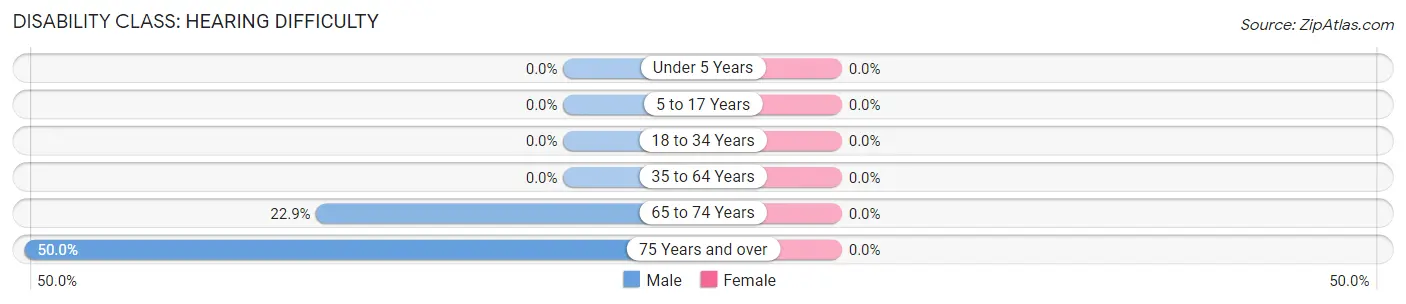
| Age Bracket | Male | Female |
| Under 5 Years | 0 (0.0%) | 0 (0.0%) |
| 5 to 17 Years | 0 (0.0%) | 0 (0.0%) |
| 18 to 34 Years | 0 (0.0%) | 0 (0.0%) |
| 35 to 64 Years | 0 (0.0%) | 0 (0.0%) |
| 65 to 74 Years | 11 (22.9%) | 0 (0.0%) |
| 75 Years and over | 6 (50.0%) | 0 (0.0%) |
Disability Class: Vision Difficulty
| Age Bracket | Male | Female |
| Under 5 Years | 0 (0.0%) | 0 (0.0%) |
| 5 to 17 Years | 0 (0.0%) | 0 (0.0%) |
| 18 to 34 Years | 0 (0.0%) | 0 (0.0%) |
| 35 to 64 Years | 0 (0.0%) | 0 (0.0%) |
| 65 to 74 Years | 0 (0.0%) | 0 (0.0%) |
| 75 Years and over | 0 (0.0%) | 0 (0.0%) |
Disability Class: Cognitive Difficulty
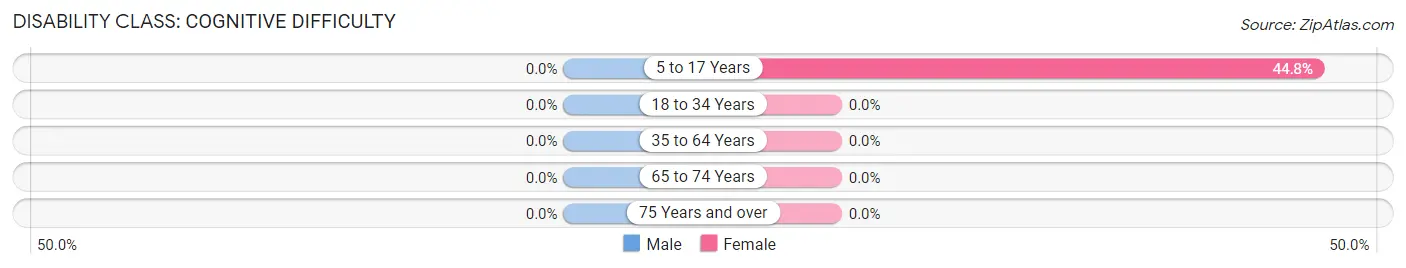
| Age Bracket | Male | Female |
| 5 to 17 Years | 0 (0.0%) | 13 (44.8%) |
| 18 to 34 Years | 0 (0.0%) | 0 (0.0%) |
| 35 to 64 Years | 0 (0.0%) | 0 (0.0%) |
| 65 to 74 Years | 0 (0.0%) | 0 (0.0%) |
| 75 Years and over | 0 (0.0%) | 0 (0.0%) |
Disability Class: Ambulatory Difficulty
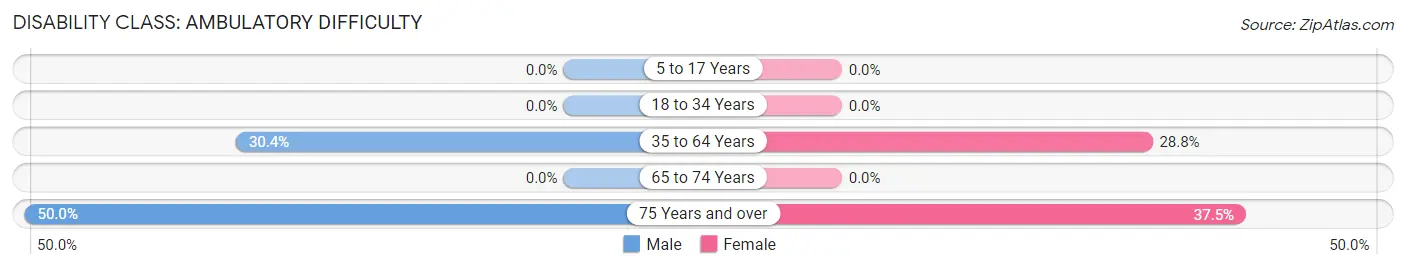
| Age Bracket | Male | Female |
| 5 to 17 Years | 0 (0.0%) | 0 (0.0%) |
| 18 to 34 Years | 0 (0.0%) | 0 (0.0%) |
| 35 to 64 Years | 24 (30.4%) | 32 (28.8%) |
| 65 to 74 Years | 0 (0.0%) | 0 (0.0%) |
| 75 Years and over | 6 (50.0%) | 6 (37.5%) |
Disability Class: Self-Care Difficulty
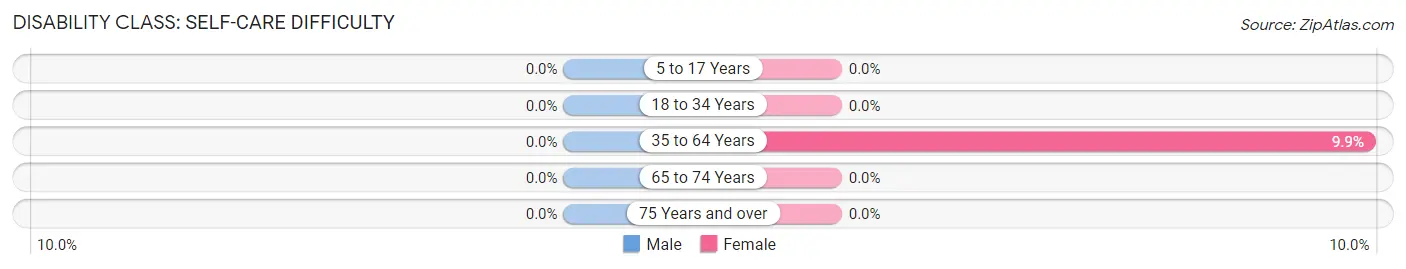
| Age Bracket | Male | Female |
| 5 to 17 Years | 0 (0.0%) | 0 (0.0%) |
| 18 to 34 Years | 0 (0.0%) | 0 (0.0%) |
| 35 to 64 Years | 0 (0.0%) | 11 (9.9%) |
| 65 to 74 Years | 0 (0.0%) | 0 (0.0%) |
| 75 Years and over | 0 (0.0%) | 0 (0.0%) |
Technology Access in Lucerne
Computing Device Access in Lucerne
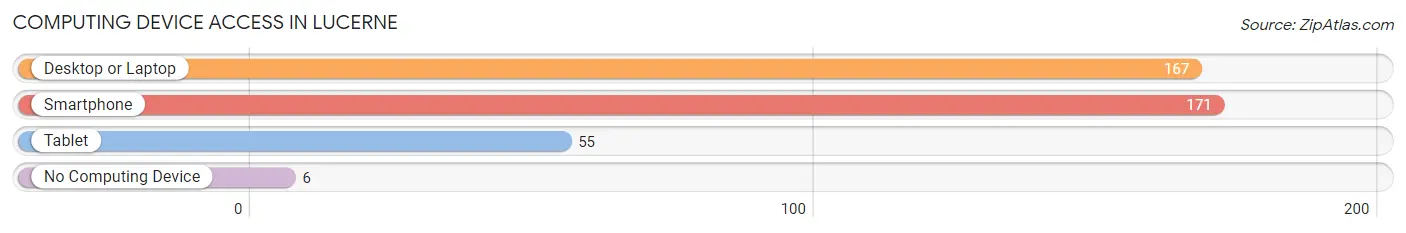
| Device Type | # Households | % Households |
| Desktop or Laptop | 167 | 87.0% |
| Smartphone | 171 | 89.1% |
| Tablet | 55 | 28.6% |
| No Computing Device | 6 | 3.1% |
| Total | 192 | 100.0% |
Internet Access in Lucerne
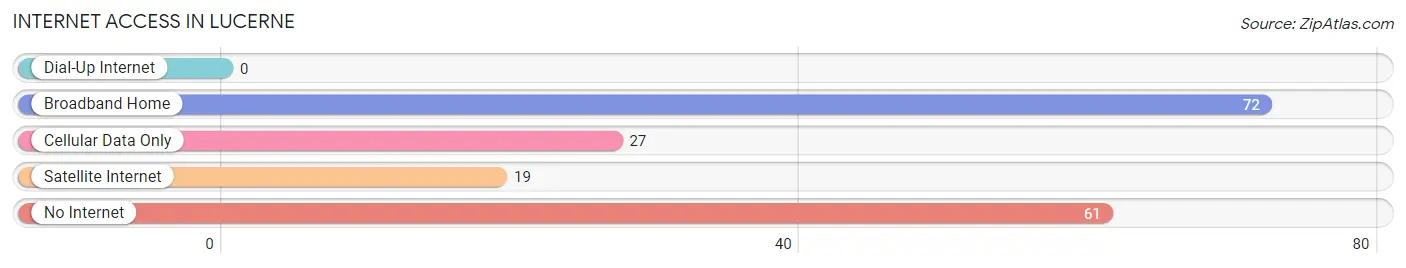
| Internet Type | # Households | % Households |
| Dial-Up Internet | 0 | 0.0% |
| Broadband Home | 72 | 37.5% |
| Cellular Data Only | 27 | 14.1% |
| Satellite Internet | 19 | 9.9% |
| No Internet | 61 | 31.8% |
| Total | 192 | 100.0% |
Lucerne Summary
Lucerne, Wyoming is a small town located in the southeastern corner of the state, near the border of Colorado. It is situated in the Laramie Mountains, and is part of the Laramie Plains region. The town was founded in 1887 and has a population of just over 200 people.
History
Lucerne was founded in 1887 by a group of settlers from the Midwest. The town was named after the city of Lucerne, Switzerland, and was originally intended to be a farming community. The settlers built a school, a church, and a post office, and the town quickly grew. In the early 1900s, the town was home to a number of businesses, including a hotel, a general store, and a saloon.
In the 1920s, the town began to decline as the railroad bypassed it and the population began to move away. The town was nearly abandoned by the 1940s, but was revived in the 1950s when the nearby oil fields were discovered. The town has since become a popular tourist destination, with a number of attractions, including a museum, a golf course, and a ski resort.
Geography
Lucerne is located in the southeastern corner of Wyoming, near the border of Colorado. It is situated in the Laramie Mountains, and is part of the Laramie Plains region. The town is located at an elevation of 6,400 feet, and is surrounded by rolling hills and grasslands. The nearby Medicine Bow National Forest provides a variety of outdoor activities, including camping, fishing, and hiking.
Economy
The economy of Lucerne is largely based on tourism. The town is home to a number of attractions, including a museum, a golf course, and a ski resort. The nearby oil fields provide employment for some of the town's residents. The town also has a number of small businesses, including restaurants, shops, and a gas station.
Demographics
As of the 2010 census, the population of Lucerne was 203. The town is predominantly white, with a small Hispanic population. The median household income is $41,250, and the median home value is $127,000. The town has a high rate of homeownership, with nearly 80% of the population owning their own homes. The town has a low unemployment rate, and the majority of the population is employed in the tourism industry.
Common Questions
What is Per Capita Income in Lucerne?
Per Capita income in Lucerne is $24,726.
What is the Median Family Income in Lucerne?
Median Family Income in Lucerne is $74,183.
What is the Median Household income in Lucerne?
Median Household Income in Lucerne is $73,558.
What is Income or Wage Gap in Lucerne?
Income or Wage Gap in Lucerne is 28.0%.
Women in Lucerne earn 72.0 cents for every dollar earned by a man.
What is Inequality or Gini Index in Lucerne?
Inequality or Gini Index in Lucerne is 0.29.
What is the Total Population of Lucerne?
Total Population of Lucerne is 596.
What is the Total Male Population of Lucerne?
Total Male Population of Lucerne is 283.
What is the Total Female Population of Lucerne?
Total Female Population of Lucerne is 313.
What is the Ratio of Males per 100 Females in Lucerne?
There are 90.42 Males per 100 Females in Lucerne.
What is the Ratio of Females per 100 Males in Lucerne?
There are 110.60 Females per 100 Males in Lucerne.
What is the Median Population Age in Lucerne?
Median Population Age in Lucerne is 34.0 Years.
What is the Average Family Size in Lucerne
Average Family Size in Lucerne is 3.0 People.
What is the Average Household Size in Lucerne
Average Household Size in Lucerne is 3.1 People.
How Large is the Labor Force in Lucerne?
There are 231 People in the Labor Forcein in Lucerne.
What is the Percentage of People in the Labor Force in Lucerne?
56.9% of People are in the Labor Force in Lucerne.