Immigrants from Netherlands vs Immigrants from Honduras 2 or more Vehicles in Household
COMPARE
Immigrants from Netherlands
Immigrants from Honduras
2 or more Vehicles in Household
2 or more Vehicles in Household Comparison
Immigrants from Netherlands
Immigrants from Honduras
57.5%
2 OR MORE VEHICLES IN HOUSEHOLD
98.2/ 100
METRIC RATING
107th/ 347
METRIC RANK
51.8%
2 OR MORE VEHICLES IN HOUSEHOLD
0.2/ 100
METRIC RATING
275th/ 347
METRIC RANK
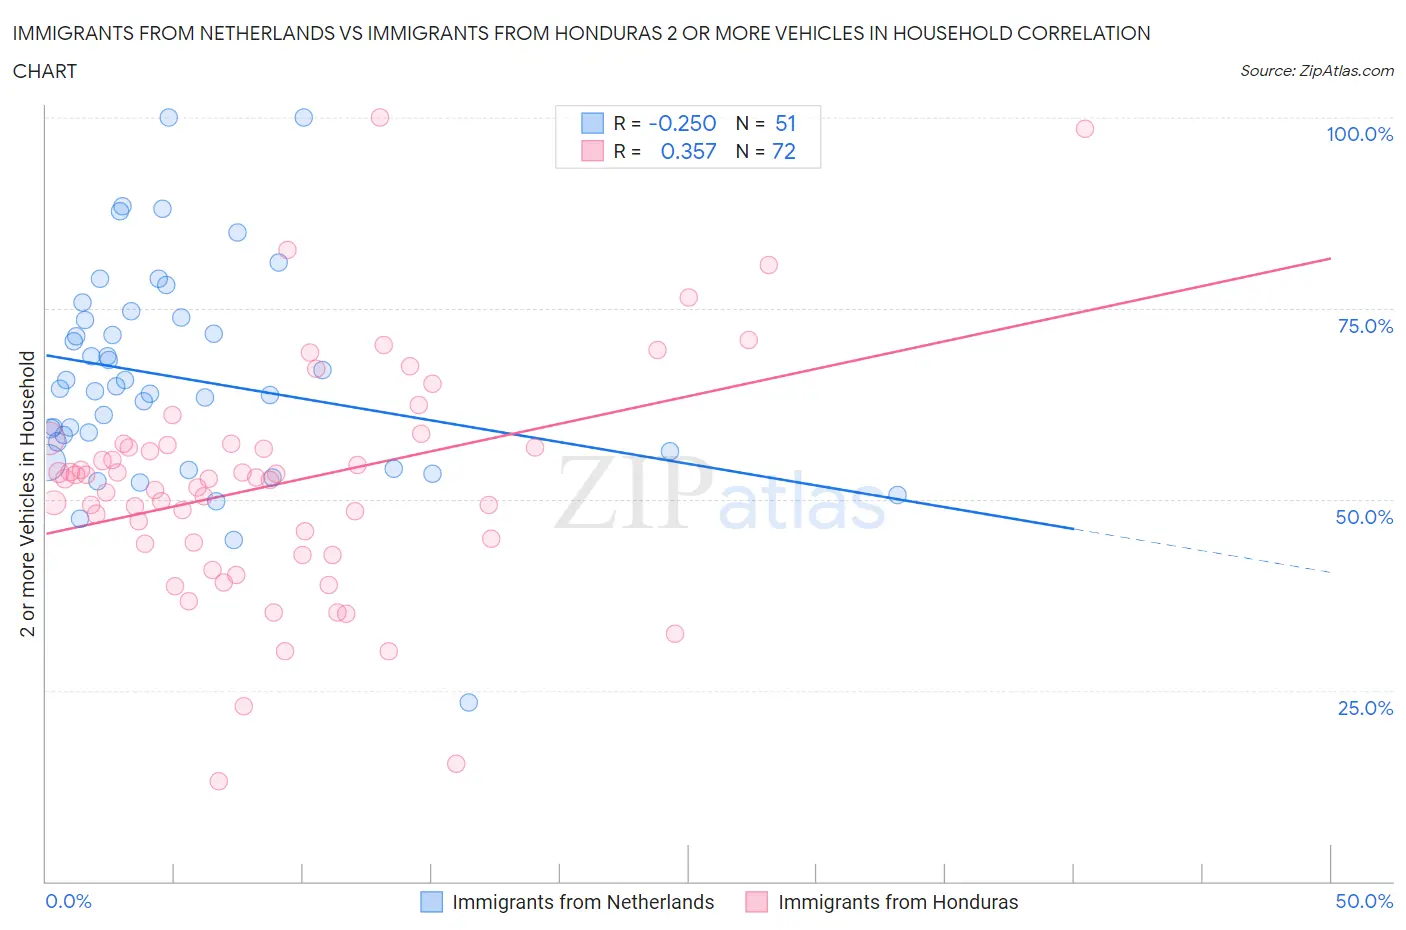
Immigrants from Netherlands vs Immigrants from Honduras 2 or more Vehicles in Household Correlation Chart
The statistical analysis conducted on geographies consisting of 237,817,219 people shows a weak negative correlation between the proportion of Immigrants from Netherlands and percentage of households with 2 or more vehicles available in the United States with a correlation coefficient (R) of -0.250 and weighted average of 57.5%. Similarly, the statistical analysis conducted on geographies consisting of 322,483,271 people shows a mild positive correlation between the proportion of Immigrants from Honduras and percentage of households with 2 or more vehicles available in the United States with a correlation coefficient (R) of 0.357 and weighted average of 51.8%, a difference of 11.0%.
2 or more Vehicles in Household Correlation Summary
| Measurement | Immigrants from Netherlands | Immigrants from Honduras |
| Minimum | 23.3% | 13.2% |
| Maximum | 100.0% | 100.0% |
| Range | 76.7% | 86.8% |
| Mean | 65.9% | 52.1% |
| Median | 64.4% | 52.7% |
| Interquartile 25% (IQ1) | 56.2% | 44.2% |
| Interquartile 75% (IQ3) | 73.9% | 57.2% |
| Interquartile Range (IQR) | 17.6% | 12.9% |
| Standard Deviation (Sample) | 14.1% | 15.3% |
| Standard Deviation (Population) | 14.0% | 15.2% |
Similar Demographics by 2 or more Vehicles in Household
Demographics Similar to Immigrants from Netherlands by 2 or more Vehicles in Household
In terms of 2 or more vehicles in household, the demographic groups most similar to Immigrants from Netherlands are Immigrants from Canada (57.5%, a difference of 0.010%), Immigrants from Oceania (57.5%, a difference of 0.020%), Immigrants from Korea (57.6%, a difference of 0.030%), Immigrants from Bolivia (57.6%, a difference of 0.040%), and Jordanian (57.6%, a difference of 0.040%).
| Demographics | Rating | Rank | 2 or more Vehicles in Household |
| Fijians | 98.4 /100 | #100 | Exceptional 57.6% |
| Lebanese | 98.3 /100 | #101 | Exceptional 57.6% |
| Immigrants | Bolivia | 98.2 /100 | #102 | Exceptional 57.6% |
| Jordanians | 98.2 /100 | #103 | Exceptional 57.6% |
| Immigrants | Indonesia | 98.2 /100 | #104 | Exceptional 57.6% |
| Immigrants | Korea | 98.2 /100 | #105 | Exceptional 57.6% |
| Immigrants | Oceania | 98.2 /100 | #106 | Exceptional 57.5% |
| Immigrants | Netherlands | 98.2 /100 | #107 | Exceptional 57.5% |
| Immigrants | Canada | 98.1 /100 | #108 | Exceptional 57.5% |
| Immigrants | North America | 98.1 /100 | #109 | Exceptional 57.5% |
| Japanese | 98.0 /100 | #110 | Exceptional 57.5% |
| Greeks | 98.0 /100 | #111 | Exceptional 57.5% |
| Pueblo | 98.0 /100 | #112 | Exceptional 57.5% |
| Zimbabweans | 96.9 /100 | #113 | Exceptional 57.2% |
| Immigrants | Lebanon | 96.8 /100 | #114 | Exceptional 57.2% |
Demographics Similar to Immigrants from Honduras by 2 or more Vehicles in Household
In terms of 2 or more vehicles in household, the demographic groups most similar to Immigrants from Honduras are African (51.8%, a difference of 0.020%), Immigrants from Croatia (51.8%, a difference of 0.030%), Israeli (51.9%, a difference of 0.060%), Immigrants from Africa (51.8%, a difference of 0.080%), and Yuman (51.7%, a difference of 0.14%).
| Demographics | Rating | Rank | 2 or more Vehicles in Household |
| Pima | 0.2 /100 | #268 | Tragic 52.0% |
| Hondurans | 0.2 /100 | #269 | Tragic 52.0% |
| Immigrants | Ireland | 0.2 /100 | #270 | Tragic 52.0% |
| South Americans | 0.2 /100 | #271 | Tragic 51.9% |
| Sub-Saharan Africans | 0.2 /100 | #272 | Tragic 51.9% |
| Israelis | 0.2 /100 | #273 | Tragic 51.9% |
| Africans | 0.2 /100 | #274 | Tragic 51.8% |
| Immigrants | Honduras | 0.2 /100 | #275 | Tragic 51.8% |
| Immigrants | Croatia | 0.2 /100 | #276 | Tragic 51.8% |
| Immigrants | Africa | 0.2 /100 | #277 | Tragic 51.8% |
| Yuman | 0.1 /100 | #278 | Tragic 51.7% |
| Liberians | 0.1 /100 | #279 | Tragic 51.7% |
| Immigrants | Eastern Europe | 0.1 /100 | #280 | Tragic 51.7% |
| Immigrants | Kazakhstan | 0.1 /100 | #281 | Tragic 51.6% |
| Bahamians | 0.1 /100 | #282 | Tragic 51.5% |