Zip Codes with the Highest Percentage of Scotch-Irish Population in Dallas, TX

RELATED REPORTS & OPTIONS

Scotch-Irish
Population
Families and Households
Female Fertility
Female Fertility (Unmarried)
Race (Community Size)
Race (Percentage)
Ancestry (Community Size)
AfghanAfricanAlaska NativeAlbanianAlsatianAmericanApacheArabArgentineanArmenianAssyrian / Chaldean / SyriacAustralianAustrianBahamianBangladeshiBarbadianBasqueBelgianBelizeanBhutaneseBlackfeetBolivianBrazilianBritishBritish West IndianBulgarianBurmeseCajunCambodianCanadianCape VerdeanCelticCentral AmericanCentral American IndianCherokeeChickasawChileanChippewaChoctawColombianComancheCosta RicanCreekCroatianCubanCypriotCzechCzechoslovakianDanishDominicanDutchDutch West IndianEastern EuropeanEcuadorianEgyptianEnglishEstonianEthiopianEuropeanFilipinoFinnishFrenchFrench CanadianGermanGhanaianGreekGuamanian / ChamorroGuatemalanGuyaneseHaitianHonduranHungarianIcelanderIndian (Asian)IndonesianIranianIraqiIrishIroquoisIsraeliItalianJamaicanJapaneseJordanianKenyanKoreanLaotianLatvianLebaneseLiberianLithuanianLuxembourgerMalaysianMalteseMexicanMexican American IndianMongolianMoroccanNative HawaiianNavajoNew ZealanderNicaraguanNigerianNorthern EuropeanNorwegianOkinawanOsagePakistaniPalestinianPanamanianParaguayanPennsylvania GermanPeruvianPolishPortuguesePotawatomiPuebloPuerto RicanRomanianRussianSalvadoranSamoanScandinavianScotch-IrishScottishSeminoleSenegaleseSerbianSierra LeoneanSiouxSlavicSlovakSloveneSomaliSouth AfricanSouth AmericanSouth American IndianSpaniardSpanishSpanish AmericanSpanish American IndianSri LankanSubsaharan AfricanSudaneseSwedishSwissSyrianThaiTohono O'OdhamTonganTrinidadian and TobagonianTurkishUgandanUkrainianUruguayanVenezuelanVietnameseWelshWest IndianYaquiYugoslavianZimbabwean
Ancestry (Percentage)
AfghanAfricanAlaska NativeAlbanianAlsatianAmericanApacheArabArgentineanArmenianAssyrian / Chaldean / SyriacAustralianAustrianBahamianBangladeshiBarbadianBasqueBelgianBelizeanBhutaneseBlackfeetBolivianBrazilianBritishBritish West IndianBulgarianBurmeseCajunCambodianCanadianCape VerdeanCelticCentral AmericanCentral American IndianCherokeeChickasawChileanChippewaChoctawColombianComancheCosta RicanCreekCroatianCubanCypriotCzechCzechoslovakianDanishDominicanDutchDutch West IndianEastern EuropeanEcuadorianEgyptianEnglishEstonianEthiopianEuropeanFilipinoFinnishFrenchFrench CanadianGermanGhanaianGreekGuamanian / ChamorroGuatemalanGuyaneseHaitianHonduranHungarianIcelanderIndian (Asian)IndonesianIranianIraqiIrishIroquoisIsraeliItalianJamaicanJapaneseJordanianKenyanKoreanLaotianLatvianLebaneseLiberianLithuanianLuxembourgerMalaysianMalteseMexicanMexican American IndianMongolianMoroccanNative HawaiianNavajoNew ZealanderNicaraguanNigerianNorthern EuropeanNorwegianOkinawanOsagePakistaniPalestinianPanamanianParaguayanPennsylvania GermanPeruvianPolishPortuguesePotawatomiPuebloPuerto RicanRomanianRussianSalvadoranSamoanScandinavianScotch-IrishScottishSeminoleSenegaleseSerbianSierra LeoneanSiouxSlavicSlovakSloveneSomaliSouth AfricanSouth AmericanSouth American IndianSpaniardSpanishSpanish AmericanSpanish American IndianSri LankanSubsaharan AfricanSudaneseSwedishSwissSyrianThaiTohono O'OdhamTonganTrinidadian and TobagonianTurkishUgandanUkrainianUruguayanVenezuelanVietnameseWelshWest IndianYaquiYugoslavianZimbabwean
Immigrant Origin (Total)
AfghanistanAfricaAlbaniaArgentinaArmeniaAsiaAustraliaAustriaBahamasBangladeshBelarusBelgiumBelizeBoliviaBosnia and HerzegovinaBrazilBulgariaBurma / MyanmarCambodiaCameroonCanadaCaribbeanCentral AmericaChileChinaColombiaCongoCosta RicaCroatiaCubaCzechoslovakiaDenmarkDominicaDominican RepublicEastern AfricaEastern AsiaEastern EuropeEcuadorEgyptEl SalvadorEnglandEritreaEthiopiaEuropeFijiFranceGermanyGhanaGreeceGuatemalaGuyanaHaitiHondurasHong KongHungaryIndiaIndonesiaIranIraqIrelandIsraelItalyJamaicaJapanJordanKazakhstanKenyaKoreaKuwaitLaosLatin AmericaLatviaLebanonLiberiaMalaysiaMexicoMiddle AfricaMoldovaMoroccoNepalNetherlandsNicaraguaNigeriaNorthern AfricaNorthern EuropeNorwayOceaniaPakistanPanamaPeruPhilippinesPolandPortugalRomaniaRussiaSaudi ArabiaScotlandSenegalSerbiaSierra LeoneSingaporeSomaliaSouth AfricaSouth AmericaSouth Central AsiaSouth Eastern AsiaSouthern EuropeSpainSri LankaSudanSwedenSwitzerlandSyriaTaiwanThailandTrinidad and TobagoTurkeyUgandaUkraineUruguayUzbekistanVenezuelaVietnamWest IndiesWestern AfricaWestern AsiaWestern EuropeYemenZaireZimbabwe
Immigrant Origin (Percentage)
AfghanistanAfricaAlbaniaArgentinaArmeniaAsiaAustraliaAustriaBahamasBangladeshBelarusBelgiumBelizeBoliviaBosnia and HerzegovinaBrazilBulgariaBurma / MyanmarCambodiaCameroonCanadaCaribbeanCentral AmericaChileChinaColombiaCongoCosta RicaCroatiaCubaCzechoslovakiaDenmarkDominicaDominican RepublicEastern AfricaEastern AsiaEastern EuropeEcuadorEgyptEl SalvadorEnglandEritreaEthiopiaEuropeFijiFranceGermanyGhanaGreeceGuatemalaGuyanaHaitiHondurasHong KongHungaryIndiaIndonesiaIranIraqIrelandIsraelItalyJamaicaJapanJordanKazakhstanKenyaKoreaKuwaitLaosLatin AmericaLatviaLebanonLiberiaMalaysiaMexicoMiddle AfricaMoldovaMoroccoNepalNetherlandsNicaraguaNigeriaNorthern AfricaNorthern EuropeNorwayOceaniaPakistanPanamaPeruPhilippinesPolandPortugalRomaniaRussiaSaudi ArabiaScotlandSenegalSerbiaSierra LeoneSingaporeSomaliaSouth AfricaSouth AmericaSouth Central AsiaSouth Eastern AsiaSouthern EuropeSpainSri LankaSudanSwedenSwitzerlandSyriaTaiwanThailandTrinidad and TobagoTurkeyUgandaUkraineUruguayUzbekistanVenezuelaVietnamWest IndiesWestern AfricaWestern AsiaWestern EuropeYemenZaireZimbabwe
Income
Income (Families)
Income (Households)
Poverty
Poverty (Families)
Unemployment
Employment Occupations
Employment Industries
Employer Class
Commute Time
Commute Means
School Enrollment
Education by Degree Field
Occupancy
Finances
Physical Characteristics
Dallas
Compare Zip Codes
Comparison Subject

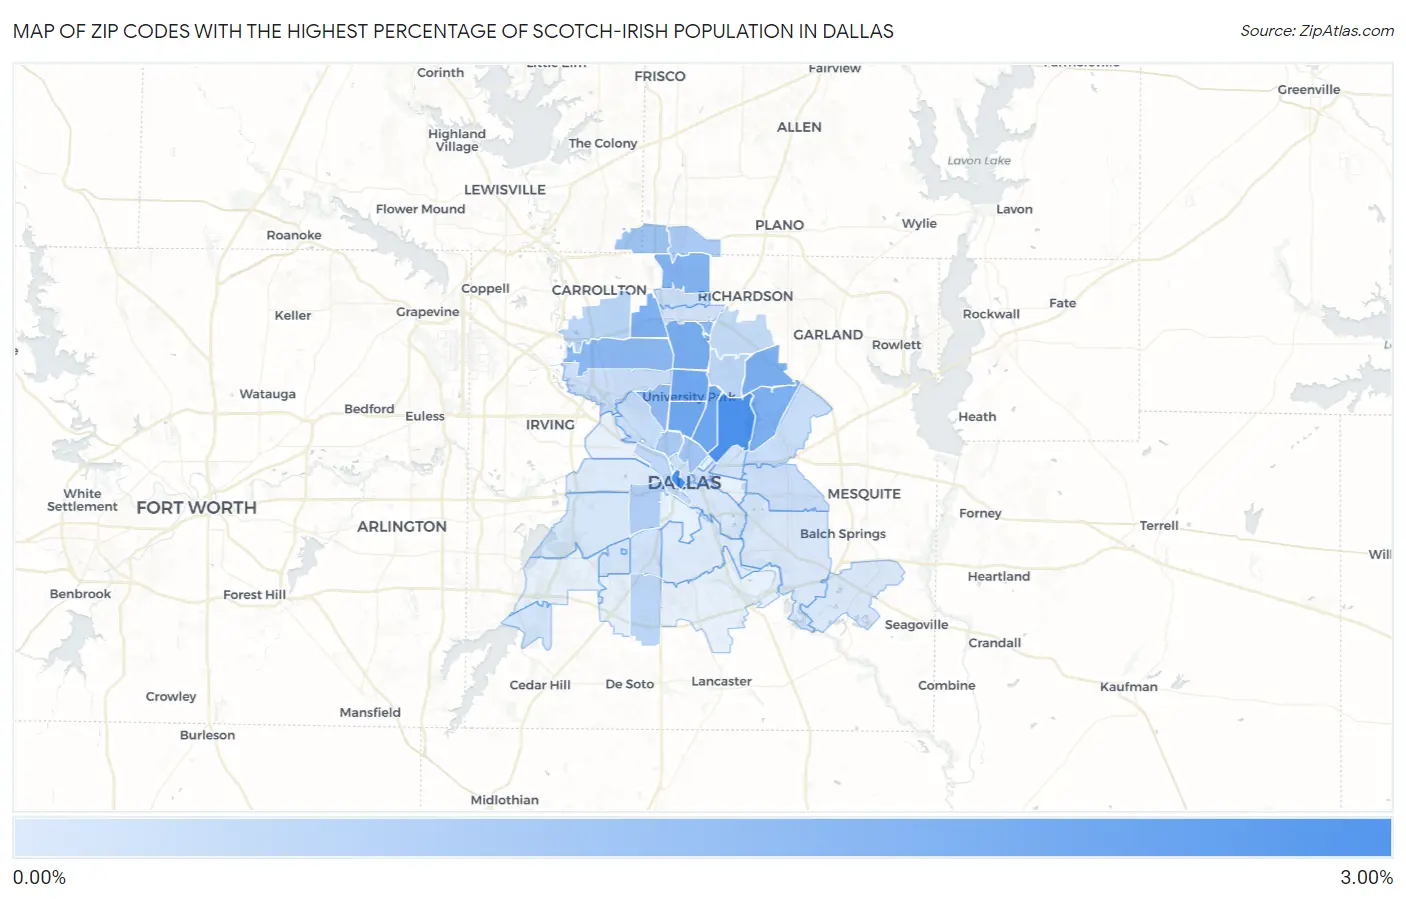
Map of Zip Codes with the Highest Percentage of Scotch-Irish Population in Dallas

0.00%
3.00%
Zip Codes with the Highest Percentage of Scotch-Irish Population in Dallas Map

Zip Codes with the Highest Percentage of Scotch-Irish Population in Dallas, TX

Zip Code Scotch-Irish vs State vs National
1.752022.68%0.79%(+1.90)#1300.82%(+1.87)#2,359
2.752142.58%0.79%(+1.80)#1430.82%(+1.77)#2,523
3.752051.99%0.79%(+1.20)#2220.82%(+1.17)#3,871
4.752061.98%0.79%(+1.19)#2260.82%(+1.16)#3,915
5.752251.94%0.79%(+1.15)#2310.82%(+1.12)#4,029
6.752301.80%0.79%(+1.01)#2600.82%(+0.982)#4,511
7.752181.74%0.79%(+0.958)#2710.82%(+0.926)#4,729
8.752381.73%0.79%(+0.945)#2780.82%(+0.913)#4,778
9.752441.68%0.79%(+0.894)#2910.82%(+0.863)#4,996
10.752481.63%0.79%(+0.839)#3120.82%(+0.808)#5,249
11.752291.49%0.79%(+0.707)#3580.82%(+0.675)#5,968
12.752511.47%0.79%(+0.687)#3690.82%(+0.655)#6,088
13.752091.41%0.79%(+0.629)#3980.82%(+0.597)#6,430
14.752871.10%0.79%(+0.318)#5350.82%(+0.287)#8,706
15.752041.06%0.79%(+0.270)#5640.82%(+0.238)#9,152
16.752190.96%0.79%(+0.170)#6490.82%(+0.138)#10,214
17.752520.92%0.79%(+0.136)#6730.82%(+0.104)#10,572
18.752080.82%0.79%(+0.038)#7400.82%(+0.006)#11,746
19.752340.61%0.79%(-0.171)#9140.82%(-0.203)#14,611
20.752320.59%0.79%(-0.192)#9360.82%(-0.224)#14,922
21.752310.59%0.79%(-0.199)#9430.82%(-0.230)#15,034
22.752070.54%0.79%(-0.250)#9860.82%(-0.282)#15,839
23.752430.47%0.79%(-0.317)#1,0530.82%(-0.348)#16,909
24.752350.40%0.79%(-0.390)#1,1130.82%(-0.422)#18,143
25.752280.39%0.79%(-0.395)#1,1160.82%(-0.426)#18,221
26.752270.36%0.79%(-0.428)#1,1410.82%(-0.459)#18,754
27.752540.35%0.79%(-0.432)#1,1470.82%(-0.464)#18,830
28.752200.34%0.79%(-0.444)#1,1650.82%(-0.476)#19,025
29.752010.28%0.79%(-0.502)#1,2180.82%(-0.534)#20,005
30.752260.27%0.79%(-0.512)#1,2260.82%(-0.544)#20,162
31.752240.23%0.79%(-0.558)#1,2660.82%(-0.589)#20,936
32.752230.22%0.79%(-0.566)#1,2760.82%(-0.598)#21,108
33.752400.21%0.79%(-0.575)#1,2850.82%(-0.607)#21,272
34.752490.20%0.79%(-0.590)#1,2970.82%(-0.622)#21,537
35.752330.16%0.79%(-0.629)#1,3330.82%(-0.660)#22,177
36.752110.12%0.79%(-0.666)#1,3640.82%(-0.698)#22,760
37.752530.11%0.79%(-0.671)#1,3690.82%(-0.703)#22,841
38.752150.084%0.79%(-0.702)#1,4020.82%(-0.733)#23,238
39.752170.049%0.79%(-0.737)#1,4220.82%(-0.769)#23,656
40.752120.022%0.79%(-0.764)#1,4460.82%(-0.796)#23,896
41.752160.015%0.79%(-0.772)#1,4540.82%(-0.803)#23,956

Common Questions

What are the Top 10 Zip Codes with the Highest Percentage of Scotch-Irish Population in Dallas, TX?
Top 10 Zip Codes with the Highest Percentage of Scotch-Irish Population in Dallas, TX are:
#1
2.68%
#2
2.58%
#3
1.99%
#4
1.98%
#5
1.94%
#6
1.80%
#7
1.74%
#8
1.73%
#9
1.68%
#10
1.63%
What zip code has the Highest Percentage of Scotch-Irish Population in Dallas, TX?
75202 has the Highest Percentage of Scotch-Irish Population in Dallas, TX with 2.68%.
What is the Percentage of Scotch-Irish Population in Dallas, TX?
Percentage of Scotch-Irish Population in Dallas is 0.67%.
What is the Percentage of Scotch-Irish Population in Texas?
Percentage of Scotch-Irish Population in Texas is 0.79%.
What is the Percentage of Scotch-Irish Population in the United States?
Percentage of Scotch-Irish Population in the United States is 0.82%.