Zip Codes with the Highest Percentage of Not-for-profit Organizations in Memphis, TN
RELATED REPORTS & OPTIONS
Not-for-profit Organizations
Memphis
Compare Zip Codes
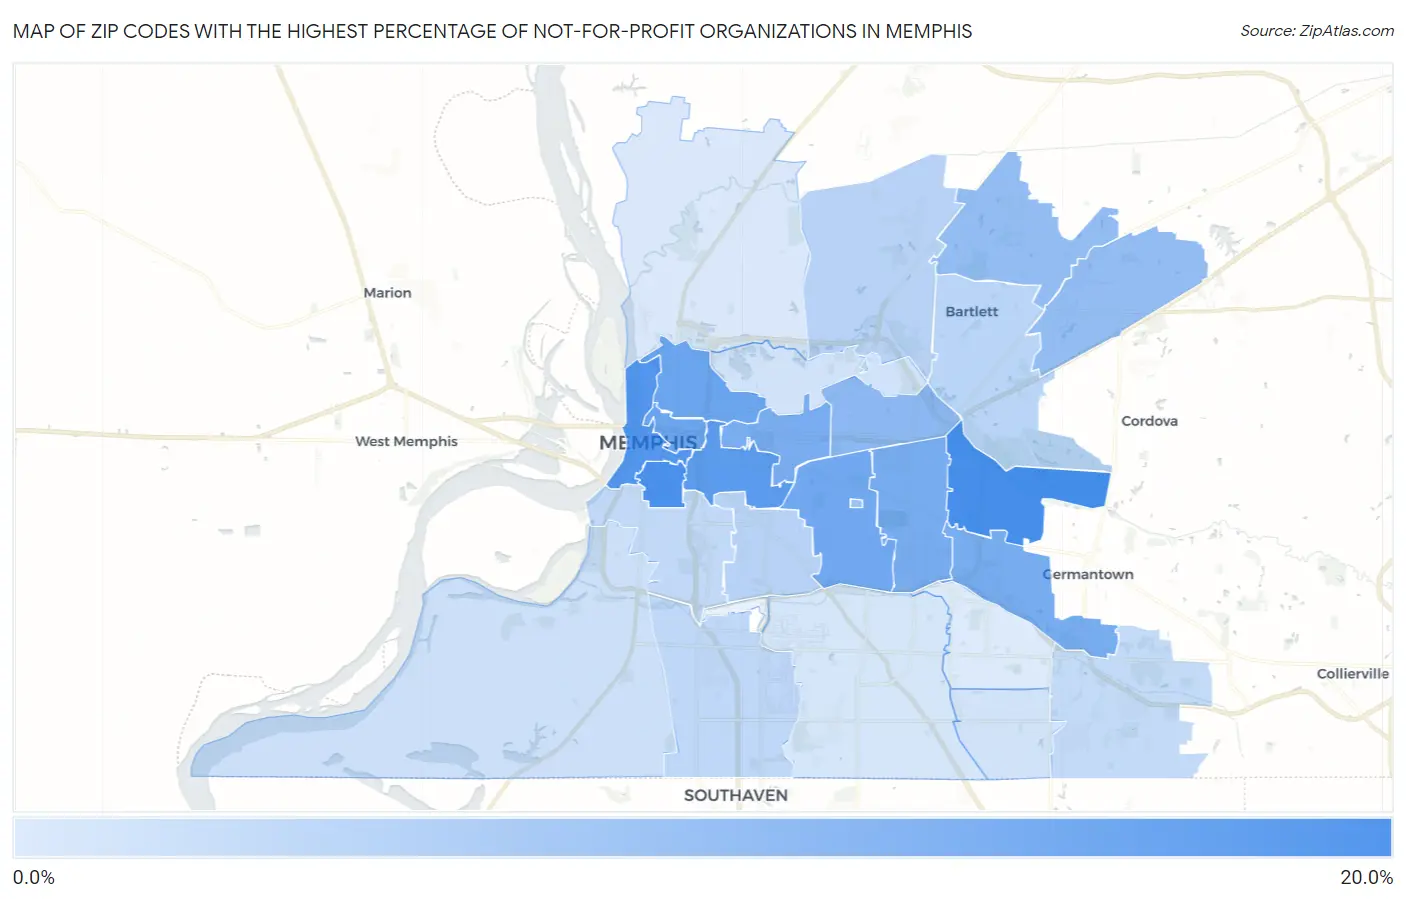
Map of Zip Codes with the Highest Percentage of Not-for-profit Organizations in Memphis
3.6%
17.3%
Zip Codes with the Highest Percentage of Not-for-profit Organizations in Memphis, TN
| Zip Code | % Employed in Not-for-profit | vs State | vs National | |
| 1. | 38120 | 17.3% | 7.7%(+9.58)#13 | 8.4%(+8.81)#1,941 |
| 2. | 38126 | 17.0% | 7.7%(+9.29)#14 | 8.4%(+8.52)#2,034 |
| 3. | 38103 | 15.8% | 7.7%(+8.15)#17 | 8.4%(+7.38)#2,521 |
| 4. | 38104 | 15.3% | 7.7%(+7.66)#20 | 8.4%(+6.89)#2,759 |
| 5. | 38105 | 13.7% | 7.7%(+5.99)#33 | 8.4%(+5.21)#3,885 |
| 6. | 38107 | 13.7% | 7.7%(+5.98)#34 | 8.4%(+5.21)#3,886 |
| 7. | 38111 | 13.2% | 7.7%(+5.54)#40 | 8.4%(+4.77)#4,302 |
| 8. | 38119 | 12.6% | 7.7%(+4.98)#45 | 8.4%(+4.21)#4,889 |
| 9. | 38117 | 12.6% | 7.7%(+4.96)#46 | 8.4%(+4.19)#4,912 |
| 10. | 38112 | 12.5% | 7.7%(+4.84)#49 | 8.4%(+4.07)#5,030 |
| 11. | 38122 | 10.8% | 7.7%(+3.13)#77 | 8.4%(+2.35)#7,385 |
| 12. | 38133 | 10.2% | 7.7%(+2.53)#96 | 8.4%(+1.76)#8,495 |
| 13. | 38135 | 10.0% | 7.7%(+2.34)#99 | 8.4%(+1.57)#8,869 |
| 14. | 38152 | 9.0% | 7.7%(+1.35)#139 | 8.4%(+0.575)#11,013 |
| 15. | 38128 | 6.9% | 7.7%(-0.808)#238 | 8.4%(-1.58)#16,999 |
| 16. | 38114 | 6.8% | 7.7%(-0.836)#239 | 8.4%(-1.61)#17,063 |
| 17. | 38134 | 6.5% | 7.7%(-1.14)#254 | 8.4%(-1.91)#17,934 |
| 18. | 38116 | 6.3% | 7.7%(-1.40)#279 | 8.4%(-2.18)#18,720 |
| 19. | 38106 | 6.0% | 7.7%(-1.66)#303 | 8.4%(-2.43)#19,441 |
| 20. | 38125 | 5.8% | 7.7%(-1.92)#318 | 8.4%(-2.69)#20,204 |
| 21. | 38109 | 5.0% | 7.7%(-2.70)#368 | 8.4%(-3.47)#22,402 |
| 22. | 38108 | 4.7% | 7.7%(-3.01)#385 | 8.4%(-3.78)#23,165 |
| 23. | 38141 | 4.6% | 7.7%(-3.09)#391 | 8.4%(-3.86)#23,360 |
| 24. | 38118 | 4.2% | 7.7%(-3.50)#419 | 8.4%(-4.27)#24,306 |
| 25. | 38127 | 3.7% | 7.7%(-3.97)#454 | 8.4%(-4.74)#25,335 |
| 26. | 38115 | 3.6% | 7.7%(-4.09)#459 | 8.4%(-4.86)#25,594 |
1
Common Questions
What are the Top 10 Zip Codes with the Highest Percentage of Not-for-profit Organizations in Memphis, TN?
Top 10 Zip Codes with the Highest Percentage of Not-for-profit Organizations in Memphis, TN are:
What zip code has the Highest Percentage of Not-for-profit Organizations in Memphis, TN?
38120 has the Highest Percentage of Not-for-profit Organizations in Memphis, TN with 17.3%.
What is the Percentage of Not-for-profit Organizations in Memphis, TN?
Percentage of Not-for-profit Organizations in Memphis is 9.2%.
What is the Percentage of Not-for-profit Organizations in Tennessee?
Percentage of Not-for-profit Organizations in Tennessee is 7.7%.
What is the Percentage of Not-for-profit Organizations in the United States?
Percentage of Not-for-profit Organizations in the United States is 8.4%.